Embed Size (px)
Citation preview
Alignment Statistics and Substitution Matrices
BMI/CS 576
www.biostat.wisc.edu/bmi576/
Colin Dewey
Fall 2010
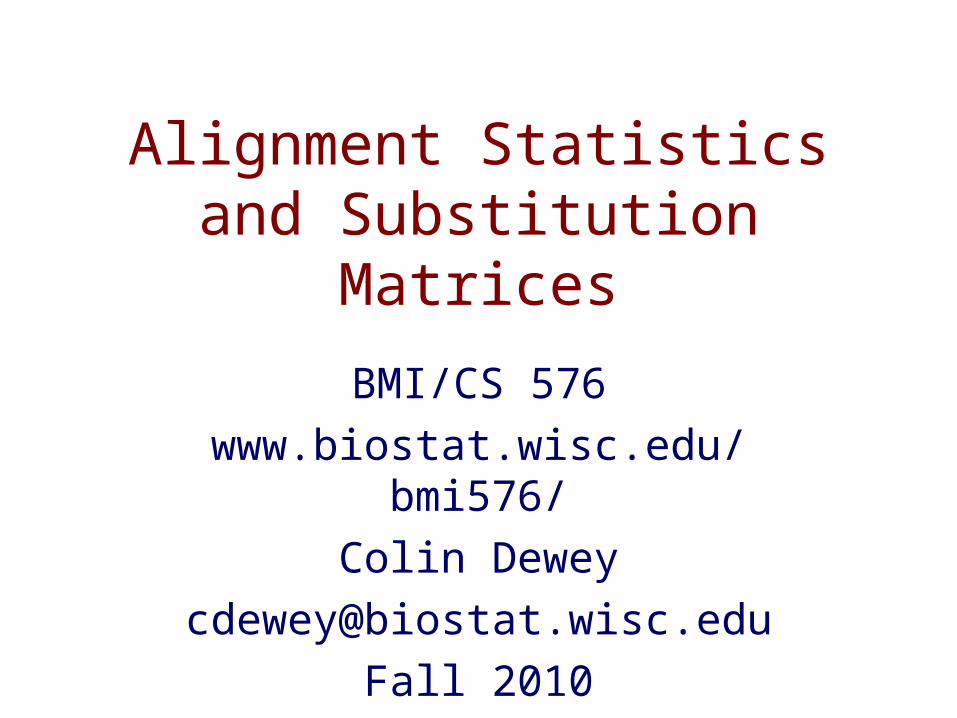
Probabilistic Model of Alignments
• we’ll focus on protein alignments without gaps
• given an alignment, we can consider two possibilities
R: the sequences are related by evolution
U: the sequences are unrelated
• How can we distinguish these possibilities?
• How is this view related to amino-acid substitution matrices?
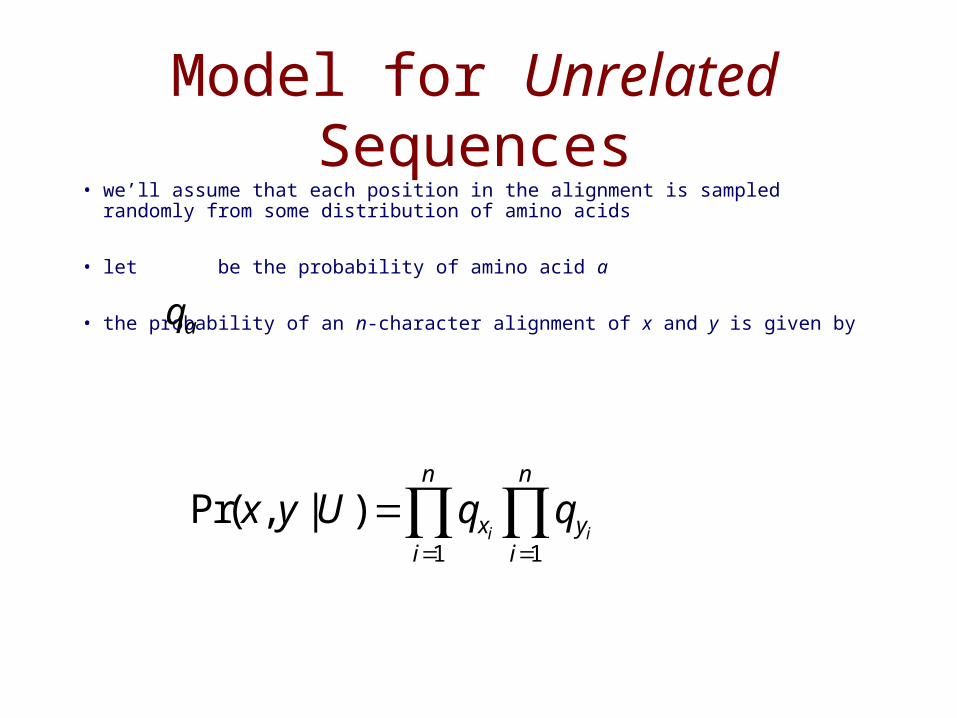
Model for Unrelated Sequences• we’ll assume that each position in the alignment is sampled randomly from some
distribution of amino acids
• let be the probability of amino acid a
• the probability of an n-character alignment of x and y is given by
1 1
Pr( , | )i i
n n
x yi i
x y U q q= =
=∏ ∏
aq
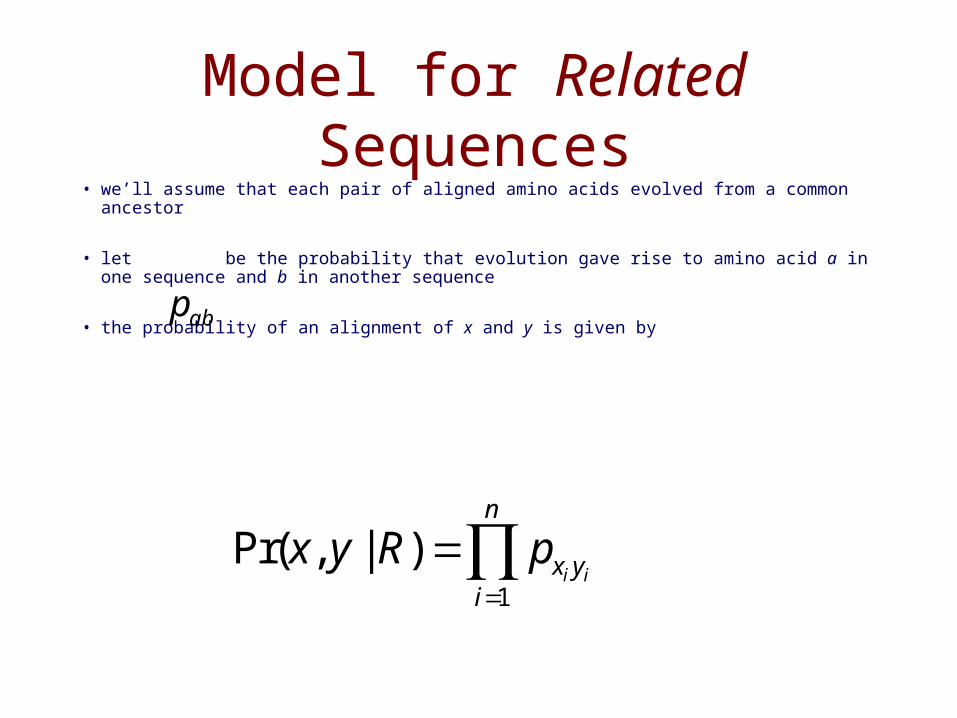
Model for Related Sequences• we’ll assume that each pair of aligned amino acids evolved from a common ancestor
• let be the probability that evolution gave rise to amino acid a in one sequence and b in another sequence
• the probability of an alignment of x and y is given byabp
1
Pr( , | )i i
n
x yi
x y R p=
=∏
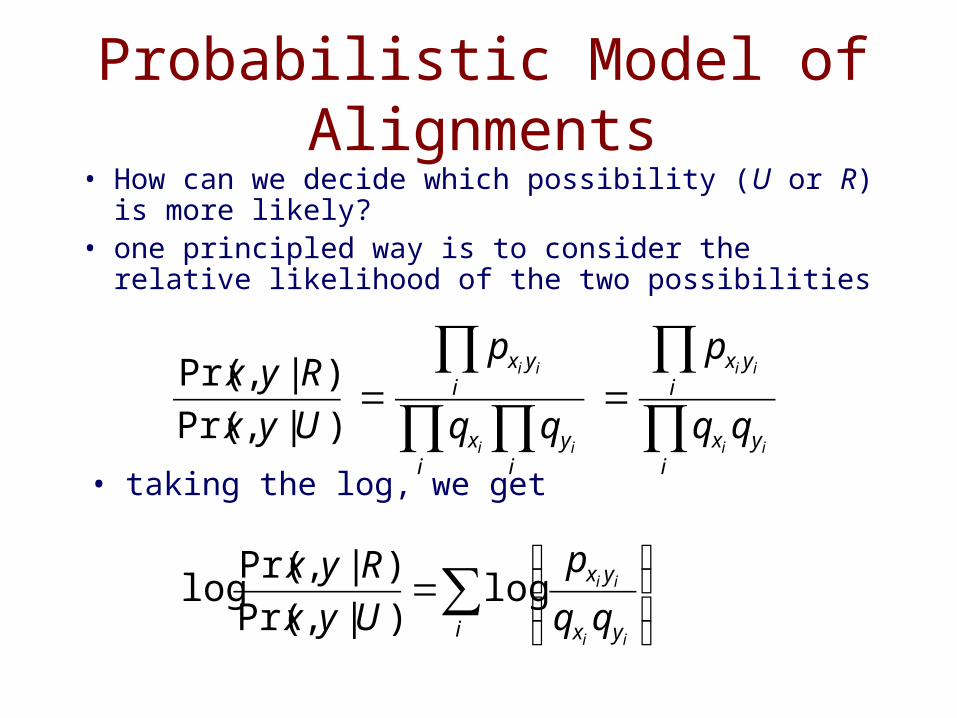
Probabilistic Model of Alignments• How can we decide which possibility (U or R) is more
likely?• one principled way is to consider the relative likelihood of
the two possibilities
∏∏
∏∏∏
==
iyx
iyx
iy
ix
iyx
ii
ii
ii
ii
p
p
Uyx
Ryx
)|,Pr(
)|,Pr(
∑ ⎟⎟⎠
⎞⎜⎜⎝
⎛=
i yx
yx
ii
ii
p
Uyx
Ryxlog
)|,Pr(
)|,Pr(log
• taking the log, we get
• This is the log-odds ratio (or log likelihood ratio)
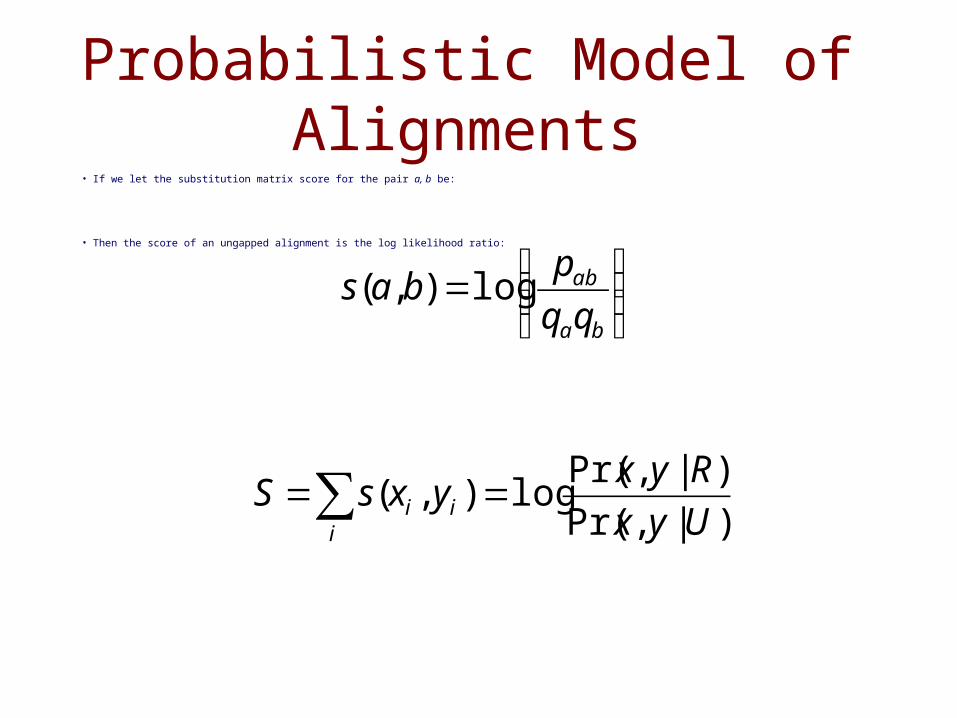
Probabilistic Model of Alignments• If we let the substitution matrix score for the pair a, b be:
• Then the score of an ungapped alignment is the log likelihood ratio:
⎟⎟⎠
⎞⎜⎜⎝
⎛=
ba
ab
pbas log),(
)|,Pr(
)|,Pr(log),(
Uyx
RyxyxsS i
ii ==∑
Substitution Matrices
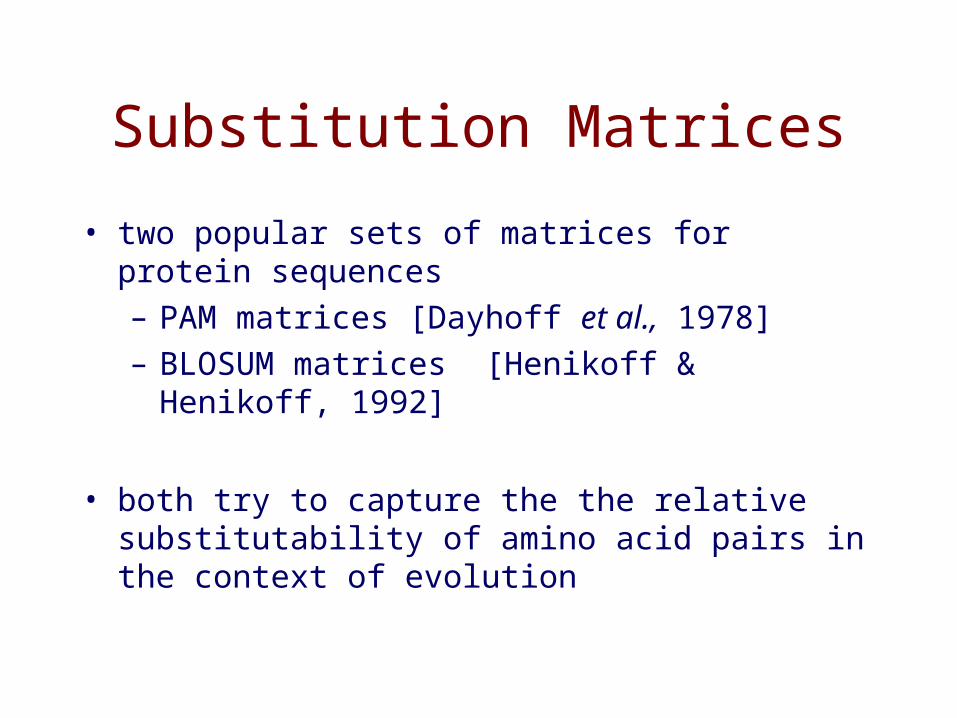
• two popular sets of matrices for protein sequences
– PAM matrices [Dayhoff et al., 1978]
– BLOSUM matrices [Henikoff & Henikoff, 1992]
• both try to capture the the relative substitutability of amino acid pairs in the context of evolution
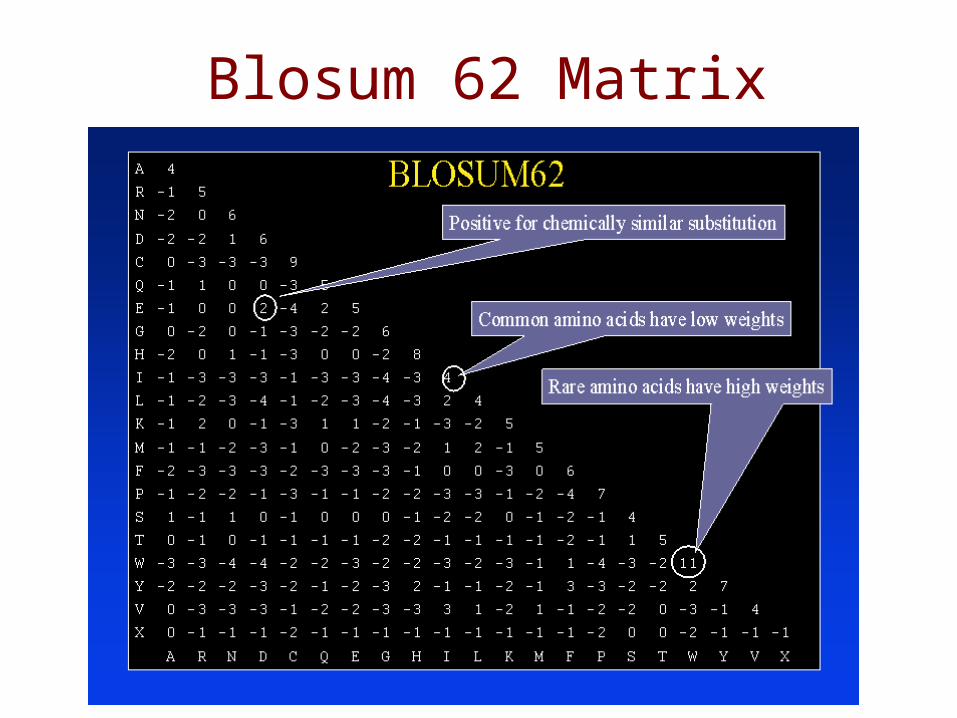
Blosum 62 Matrix
Substitution Matrices
• but how do we get values for (probability that a and b arose from a common ancestor)?
• it depends on how long ago sequences diverged
diverged recently:
diverged long ago:
abp
bapab ≠≈ for 0
baab qqp ≈
• the substitution matrix score for the pair a, b is given by:
⎟⎟⎠
⎞⎜⎜⎝
⎛=
ba
ab
pbas log),(
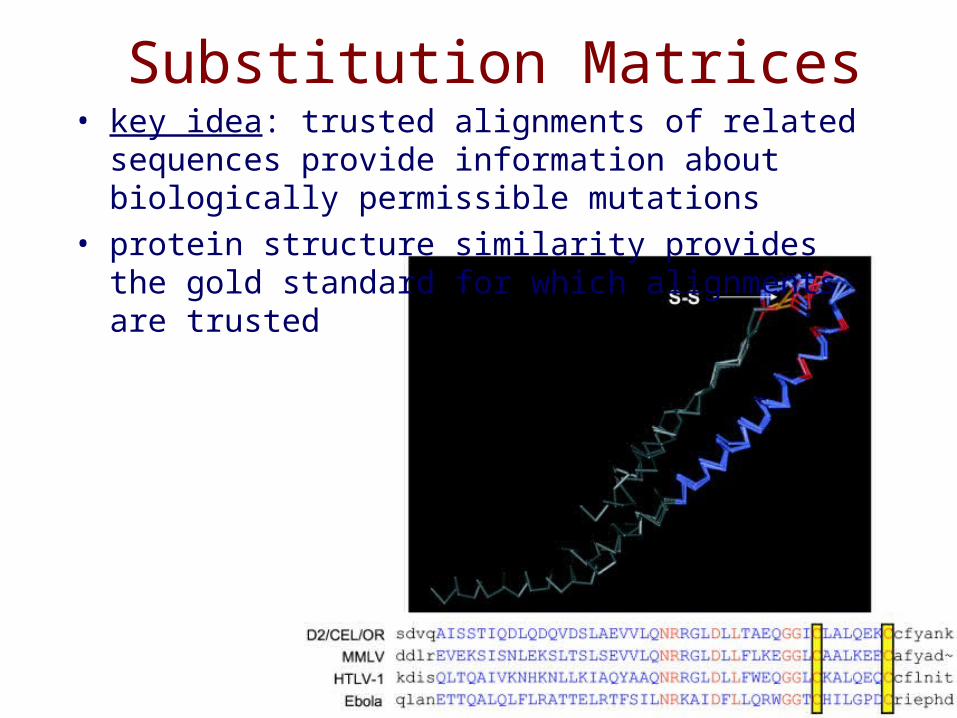
Substitution Matrices• key idea: trusted alignments of related sequences provide
information about biologically permissible mutations
• protein structure similarity provides the gold standard for which alignments are trusted
BLOSUM Matrices• [Henikoff & Henikoff, PNAS 1992]
• probabilities estimated from “blocks” of sequence fragments that represent structurally conserved regions in proteins
• transition frequencies observed directly by counting pairs of characters between clusters in the blocks. Sequences within blocks are clustered at various levels:– 45% identical (BLOSUM-45)– 50% identical (BLOSUM-50)– 62% identical (BLOSUM-62)– etc.
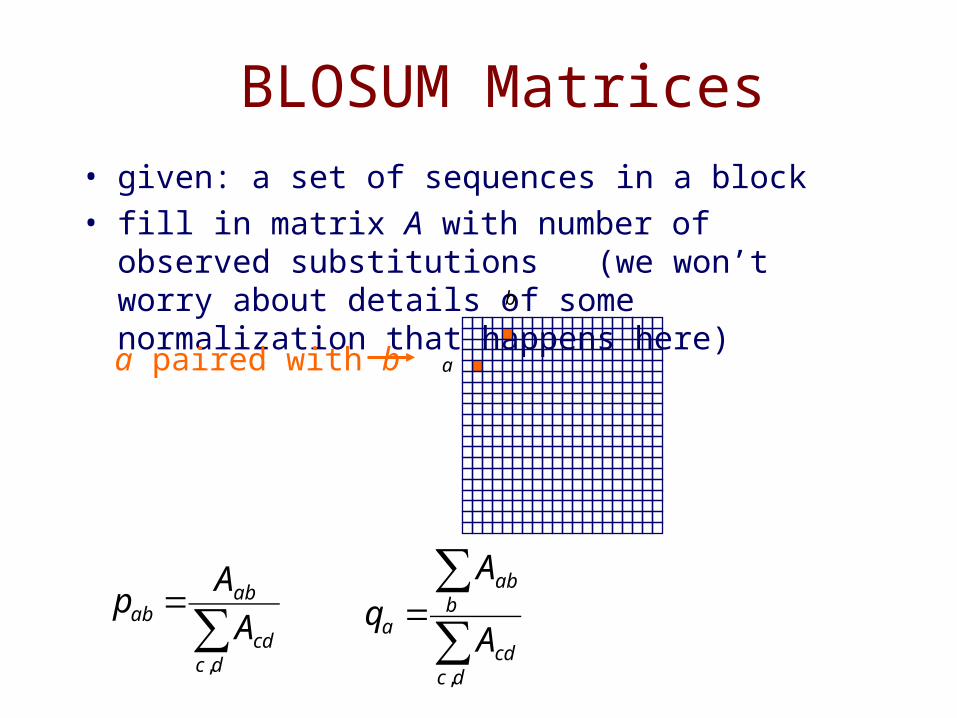
BLOSUM Matrices• given: a set of sequences in a block
• fill in matrix A with number of observed substitutions (we won’t worry about details of some normalization that happens here)
a
b
a paired with b
∑∑
=
dccd
bab
a A
Aq
,
∑=
dccd
abab A
Ap
,
Statistics of Alignment Scores
Q: How do we assess whether an alignment provides good evidence for homology?
A: determine how likely it is that such an alignment score would result from chance.
3 ways to calculate chance; look at alignment scores for– real but non-homologous sequences– real sequences shuffled to preserve compositional properties– sequences generated randomly based upon a DNA/protein
sequence model
Scores from Random Alignments
• suppose we assume• sequence lengths m and n• a particular substitution matrix and amino-acid
frequencies
• and we consider generating random sequences of lengths m and n and finding the best alignment of these sequences
• this will give us a distribution over alignment scores for random pairs of sequences
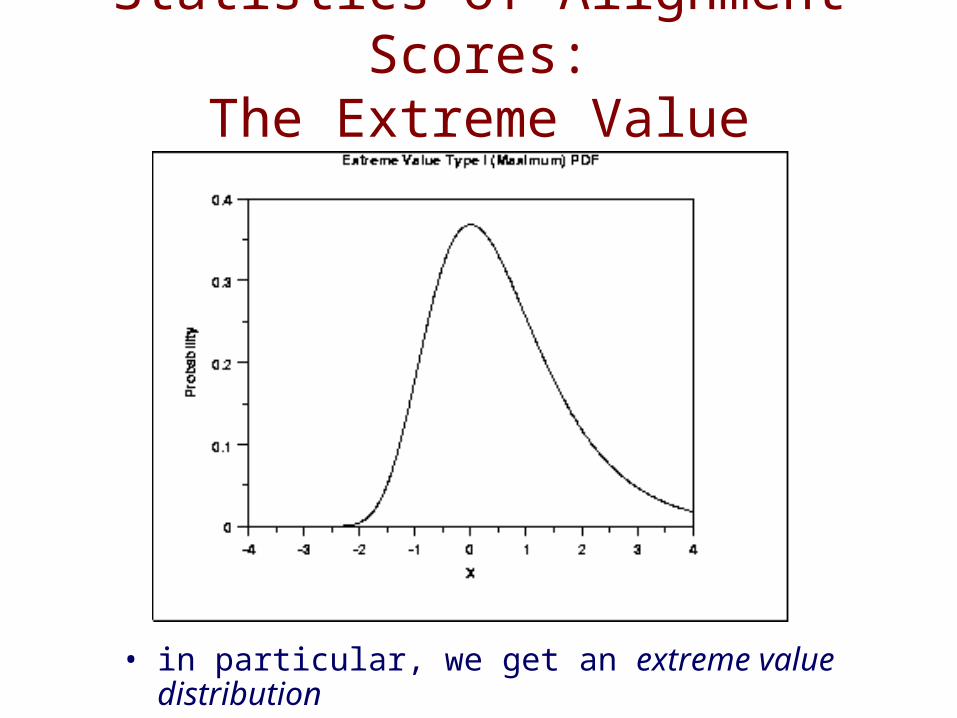
Statistics of Alignment Scores:The Extreme Value Distribution
• in particular, we get an extreme value distribution
Distribution of Scores
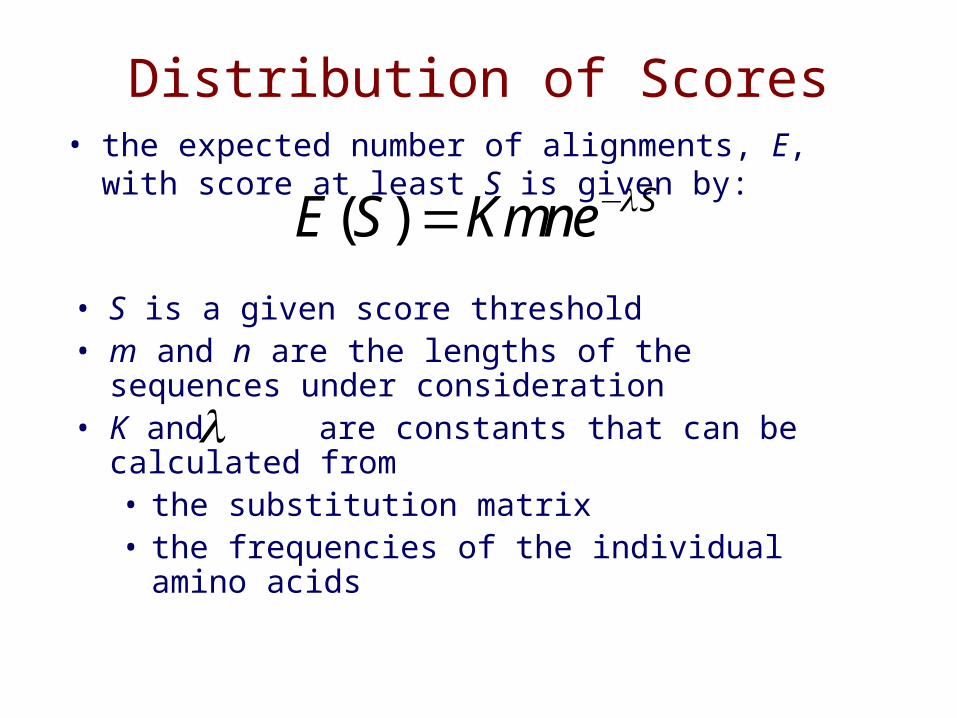
• S is a given score threshold• m and n are the lengths of the sequences under
consideration• K and are constants that can be calculated from
• the substitution matrix• the frequencies of the individual amino acids
λ
( ) SE S Kmne λ−=• the expected number of alignments, E, with score at least S
is given by:
Statistics of Alignment Scores
• to generalize this to searching a database, have n represent the summed length of the sequences in the DB (adjusting for edge effects)
• the NCBI BLAST server does just this
• theory for gapped alignments not as well developed
• computational experiments suggest this analysis holds for gapped alignments (but K and must be estimated from data)
λ
Pairwise Alignment Summary
• we considered two types of alignment: local and global
• exact DP algorithm depends on local/global and gap penalty function
• allowing gaps, there is an exponential number of possible alignments
• computational complexity of common alignment DPs is O(mn)
• algorithms work for both protein and DNA sequences
• heuristic methods like BLAST are faster but may not be as sensitive
Other Topics inPairwise Alignment
• semiglobal alignment– don’t penalize gaps on the end of the alignment
• linear-space alignment– don’t maintain entire matrix
• banded alignment– consider only alignments that are “close” to some seed alignment– like we saw in gapped BLAST
• alignment of whole genomes– DP too time/memory intensive– instead find significant (near) exact matches to anchor alignment– detect features like genome rearrangements