Embed Size (px)
Citation preview
Aligning Sub-national Climate Actions for the new post-Paris Climate Regime
DRAFT MAY 2016 - DO NOT CITE OR CIRCULATE Authors: Angel Hsu, Ph.D. Title: Assistant Professor, Yale-NUS College and Yale School of Forestry and Environmental Studies. Address: 12 College Ave West, Singapore. E-mail: [email protected]. Phone number: +65. 6601 5282. Amy J. Weinfurter. Title: Research Associate, Yale School of Forestry and Environmental Studies. Address: 195 Prospect Street, New Haven, CT, 06511. E-mail: [email protected] Kaiyang Xu. Title: Research Analyst, Yale School of Forestry and Environmental Studies. Address: 195 Prospect Street, New Haven, CT, 06511. E-mail: [email protected] Stefanie Wnuck. Title: Research Analyst, Yale School of Forestry and Environmental Studies. Address: 195 Prospect Street, New Haven, CT, 06511. Email: [email protected] Abstract The rise of sub-national actors in global climate governance underscores the need for clear alignment between these efforts and their national counterparts. As these sub-national climate actions are filling gaps in mitigation, adaptation, and financing, among other functions, a critical question is how these efforts complement or overlap with national climate pledges. This consideration is particularly important in the context of the Paris Agreement’s mandate for five-year review cycles, where national governments will be asked to demonstrate progress towards climate mitigation goals and increase their ambition. In this paper, we argue that alignment – both vertically between multiple jurisdictions and horizontally with external networks and actors – is critical to clarifying climate actions between multiple levels of actors and to maximizing mitigation potential. We use nine case studies to demonstrate the varying degrees and modes of vertical integration between subnational and national climate actors. We find that the case studies embody different styles of vertical alignment, and exhibit significant variation in the degree and direction of vertical alignment within each of these modes. We also find that many case studies rely on horizontally-aligned international networks and coalitions to fill gaps in financial resources or technical support. As a proof of concept, we demonstrate that an additional 1 gigaton carbon dioxide equivalent (CO2e) in 2020 can be achieved in these nine case studies through stronger alignment that makes it possible to scale sub-national climate actions to the national level. These findings suggest there may be a missed opportunity to realize greater mitigation potential by fostering stronger vertical alignment, and enhancing coordination between horizontal networks of climate action and national governments.
Introduction National governments are no longer the sole actors in global climate governance. The landmark Paris climate negotiations featured more than 400 city mayors and subnational representatives, who made high-profile pledges on climate change alongside national governments. By April 21, 2016, 2,021 cities and 114 regions, representing 7.3 percent of the global population, and 114 regions, encompassing 6.5 percent of the global population, made climate commitments through one UN-sanctioned platform – the Non-State Actor Zone for Climate Action (NAZCA) (Hsu et al, 2016). This groundswell of sub-national and regional climate actions could play an essential role in keeping global temperature rise within the 2 degrees Celsius or the new aspirational 1.5 degree target articulated in the Paris Agreement. A 2014 United Nations Environment Programme’s Emissions Gap report finds an 8 to 10 gigaton gap between the carbon dioxide emissions cuts promised by current national pledges and the reductions required to maintain a 2020 least-cost trajectory for containing global temperature rise. Even if governments fulfill all of their climate pledges, emissions will rise 19 percent (8.7 Gt CO2e) above the 2-degree C pathway by 2025, and would climb 35 percent (15.1 Gt CO2e) above the emissions limit by 2030 (UNFCCC 2015).
Countries’ ability to “ratchet up” their ambition during five-year cycles of review will be crucial to capping global temperature rise and successfully implementing the Paris agreement. Many sub-national efforts surpass national climate policies in scope and ambition, yet data clarifying sub-national contributions to national and global climate mitigation have, until recently, been hard to come by. The Compact of Mayors, a coalition of more than 360 cities representing more than 5 percent of the global population, conducted an internal analysis that found its members’ pledges could close 25 percent of the gap between national pledges made prior to the 2015 Paris Climate Summit and the emissions cuts needed for a 2-degree C scenario (Kovac and Fong 2016). Erickson and Tempest (2014) estimate that aggressive urban mitigation could narrow the 2030 emissions gap by 10 percent in 2030 and by 15 percent in later years. These studies appear to suggest that sub-national climate actions are outside of, or additional to, existing national climate pledges. Some proponents argue that sub-national action represents effort that is frequently uncaptured by or is “additional”1 to state-centric processes like the UN Framework Convention on Climate Change (UNFCCC). The US 2016 Second Biennial Report, for instance, acknowledges nine US states and the District of Columbia’s enactment of appliance efficiency standards that go beyond federal standards (US Department of State 2015). The Australian city of Newcastle and the United Kingdom cities of Newcastle and Leicester developed local government research and initiatives on urban responses to climate change before their national governments (Betsill and Bulkeley 2006). Hoehne et al (2015) estimate non-state actors’ climate commitments, which they qualify are additional to policies currently implemented, could reduce 2020 emissions between 14 to 32 MtCO2e/year.
1 For a detailed discussion of the challenges of defining and applying definitions of additionality, see: Gillenwater, M. What is additionality? (Greenhouse Gas Management Institute, Discussion Paper 001, 2012); http://ghginstitute.org/wp-content/uploads/2015/04/AdditionalityPaper_Part-1ver3FINAL.pdf.

Some argue that because sub-national entities are inherently nested within national jurisdictions, their climate actions cannot be considered additional to or outside of national efforts. Many national governments specifically count sub-national emission reductions as contributions towards countrywide targets. Japan, for instance, requires 1,800 municipal governments and 47 prefectures to prepare climate mitigation action plans, folding sub-national commitments into state-sponsored policy (Sugiyama and Takeuchi 2008). Even if a climate action begins as a sub-national effort, national governments often adopt these efforts and incorporate them into baseline and target calculations. Although at their inception they may have been considered additional to existing national reduction pledges, many of California’s climate actions, including its cap and trade program, have since been taken account in national calculations (U.S. Department of State 2014). The uncertainty regarding the extent and timing of these shifts make pinpointing the exact nature of additionally difficult – a classic “chicken vs. egg” scenario where it becomes difficult, if not impossible, to determine whether a sub-national action is truly additional. The additionality question has become particularly salient after the Paris climate negotiations, where subnational governments have made their own mitigation pledges, often without clearly connecting them to national counterparts. These emissions reductions pledges accounted for 85 percent of city commitments, and 45 percent of regional commitments across seven major networks of climate action (Hsu et al. 2016). A great deal of uncertainty and confusion is created when multiple actors make simultaneous commitments, potentially double-counting emissions savings when different actors claim the same mitigation efforts. This problem will only become intensified in the Paris Agreement’s five-year review cycles, when national governments will be asked to submit “successive” nationally determined contribution that represent a “progression” beyond the then-current pledge and reflects “its highest possible ambition” (UNFCCC 2015). These calculations of higher ambition will undoubtedly draw from estimations of sub-national climate mitigation effort and potential. The U.S.’s 2016 Biennial Climate Assessment, for instance, includes a “higher abatement” scenario that relies on state-level overachievement of energy efficiency efforts (U.S. DOS 2016). What is needed, then, is alignment of sub-national commitments and national pledges. Vertical alignment between sub-national and national actors helps make mitigation actions “as efficient as possible,” taking advantage of comparative strengths between actors at different levels to achieve the greatest possible reductions (Broekhoff et al. 2015). Horizontal coordination – a case studies’ connection to peer cities and regions, either directly or through third parties, such as international organizations or networks of climate action – can also be more strongly leveraged to implement and facilitate the spread of successful sub-national climate action. Such alignment not only enables clearer accounting of greenhouse gas reductions, but it can help facilitate a broader and more targeted implementation of climate action, possibly leading to deeper emission reductions. In this article, we argue that alignment – both vertically between multiple jurisdictions and horizontally with external networks and actors – is critical to tracking climate actions between multiple levels of actors and to maximizing mitigation potential. We use nine case studies where sub-national actors are exceeding or acting outside of national climate policy efforts to

demonstrate varying degrees and modes of integration. We find that the case studies exhibit significant variation in the degree and direction of alignment both vertically and horizontally. We also find that many case studies rely on horizontally-aligned international networks and coalitions to fill gaps in financial resources or technical support. As a proof of concept, we further estimate an additional 1 gigaton carbon dioxide equivalent (CO2e) in 2020 can be achieved through stronger alignment in these nine cases. These findings suggest there may be a missed opportunity to realize greater mitigation potential by fostering stronger vertical alignment, and enhancing coordination between horizontal networks of climate action and national governments. This paper is organized as follows: a synopsis of the nine case studies we evaluate is followed by an analysis of their vertical alignment with national counterparts and their horizontal coordination with external networks and financial resources. We present a framework for mapping these cases’ vertical and horizontal alignment to initiate a discussion of their relative positioning. We then demonstrate the additional mitigation potential if these sub-national efforts are scaled or adopted at the national level. We conclude with a discussion and set of recommendations for further actions that are needed to provide greater coherence to the emergent post-Paris climate governance system. Range of Sub-national Climate Action Nine case studies showcase how different sub-national entities have implemented climate mitigation strategies that exceed national policies or have been created outside of national policy directive. The nine case studies come from eight countries, six of which – Brazil, Canada, China, Germany, India, the United States – are among the world’s 10 biggest emitters. We selected the nine case studies by identifying cases primarily within these high-emitting countries that host innovative and effective sub-national and non-state actions that could be considered “additional” or outside of national climate policies. We narrowed our focus based on the availability of data that would enable us to assess a program’s emissions mitigation impact and its potential to be scaled up to help meet countries’ 2020 emissions targets. We also made case study selections with the intent to include a representative sample of sectors and countries. Our selections were informed by interviews with in-country experts familiar with the projects and national policy contexts. In the following section, we describe in greater detail the particular sub-national policy innovation occurring and how it contributes to national climate mitigation in each respective country. Acre, Brazil The Amazonian state of Acre has voluntarily taken on – and run with – Brazil’s national 80 percent reduction in deforestation goal. Acre has voluntarily adopted this national target at the state level, and implemented innovative state-wide policy mechanisms, such as payments for ecosystem services models, to meet this goal to slow deforestation. In 2013, Acre had achieved 63 percent of the 80 percent goal, and maintained over 86 percent of its original forest cover (World Wildlife Fund 2013). The state’s deforestation activities could cut an estimated 62 tons of carbon dioxide equivalent from Brazil’s 2020 emissions.
Acre’s success localizing the national deforestation reduction target has largely been driven by its own state laws that incentivize forest protection. In 2010, the state passed the State System of Incentives for Environmental Services (or SISA), a groundbreaking law to combat deforestation and promote sustainable forest management. SISA programs seek to reduce the economic incentive for deforestation and protect intact forest through zoning laws and initiatives linking local communities with international markets, garnering payments for ecosystem services for forest conservation activities. Acre’s connections with a broad network of climate and forestry-focused organizations (i.e., strong horizontal alignment) has proven crucial to its ability to implement these programs. In March 2013, for instance, the Verified Carbon Standard, a network of business and environmental leaders focused on carbon accounting, received a 1.4 million USD grant from the Norwegian International Climate and Forest Initiative to pilot a Jurisdictional and Nested REDD+ accounting and verification framework for Acre (Verified Carbon Standard 2013; Verified Carbon Standard 2015). This framework harmonizes its reduction target, reference level and monitoring system with Brazil's National Climate Change Policy, paving the way for this reporting system to link to Brazil’s national REDD+ program (Verified Carbon Standard 2014). Acre has currently signed agreements with the Brazilian states of Sao Paulo and Rio de Janeiro and the Brazilian Development Bank and a Memorandum of Understanding with California, to integrated carbon offsets from Acre these states current or projected carbon markets or cap-and-trade program (Verified Carbon Standard, 2014). Belo Horizonte, Brazil Belo Horizonte, Brazil’s sixth largest city, helped inspire national waste management strategies, and has emerged as a leader in implementing new nationally-articulated waste management goals. “A pioneer on waste management at the local level since the 1990s,” reports Green Growth Best Practices, “[Belo Horizonte] took innovative actions towards more efficient waste management, years before a national policy was approved ”(Green Growth Best Practices 2014). The city’s 1993 Integrated Solid Waste Management Model legitimized waste pickers, who had long been an informal but integral part of the waste sector, and its 2012 Municipal Urban Cleansing Law builds on the law’s targets, aiming to increase efficiency in waste collection and recycling, and create jobs for city workers (Green Growth Best Practices 2014). The city has also emerged as an example of how other states and municipalities could meet Brazil’s 2012 National Policy for Solid Waste, which requires sub-national actors to develop waste management plans to qualify for credit, financial support and tax relief. Despite the strong incentives articulated in this policy, opportunities to reduce, recycle and reuse waste are uneven across the country, and only 32 percent of Brazil’s municipalities have a waste management plan (Beecheno 2013). Belo Horizonte’s success may offer a road map for spurring wider adoption of this goal, particularly through its focus on waste management efforts that also carry strong co-benefits. For instance, the bulk of greenhouse gas reductions resulting from the city’s waste management strategies spring from its Municipal Waste Treatment Centre (or Centro de
Tratamento de Resíduos Sólidos – CTRS), a biogas plant built on a former landfill (Prefeitura de Belo Horizonte 2012). In addition to mitigating an estimated 0.4 million tons of carbon dioxide equivalent by 2020, expanding energy and electricity access, and improving urban sanitation, the plant has created a new source of revenue for the city through the UNFCCC’s Clean Development Mechanism (CDM), a program that enables developed countries to purchase certified emission reduction credits from developing countries. The city’s horizontal alignment with the CDM supplements the funding and monitoring conducted by Belo Horizonte, adding to the benefits residents gain from the city’s waste management efforts. British Columbia, Canada British Columbia has pioneered the implementation of a carbon tax on fossil fuels – a policy that still does yet exist at the national level. The tax addresses nearly all emissions from fossil fuels, which account for an estimated 70 percent of the province’s entire greenhouse gas emissions (Ministry of Finance 2013). By 2020, this policy is projected to mitigate 2.5 million tons of carbon dioxide equivalent (authors’ calculations). Since the introduction of the carbon tax, British Columbia’s fuel consumption has decreased – bucking the national trend – even as its GDP growth has outpaced Canada’s (Murray and Rivers 2015). The carbon tax on fossil fuels has increased incrementally, and is revenue-neutral, meaning the provincial government uses funds collected from the carbon tax to offset other taxes. From 2013 to 2014, taxing carbon in British Columbia generated 1.2 billion (CAD), which was applied to lower business taxes, provide income tax credits to low income individuals, reduce personal income tax rates, and give a $200 benefit to northern and rural homeowners (Canada’s Ecofiscal Commission 2015). Although the public initially opposed the carbon tax, support has grown post-implementation (Murray and Rivers 2015), which may reflect British Columbia’s transparent reporting of the sources and uses of the carbon tax, enabling policymakers and residents to understand its impacts and benefits. Though British Columbia initiated and orchestrated the tax independently, it has participated within a broader network of local governments implementing similar policies. British Columbia’s success may help explain why Alberta’s provincial government has recently announced its intent to launch a carbon-pricing system. The national government of Canada, along with British Columbia, Alberta, Quebec (which has implemented a cap-and-trade system), Manitoba (is planning to implement a cap-and-trade system), Ontario (is planning to implement a cap-and-trade system) joined the Carbon Pricing Leadership Coalition (Government of Canada 2016), one of several carbon pricing networks British Columbia participates in. Although British Columbia’s policies are not formally echoed in Canada’s legislation, these horizontally-aligned networks may provide an informal means of harnessing lessons and supporting a broader implementation of carbon pricing. Oran, Algeria
Oran, Algeria represents a case where external networks facilitated the local adoption of a waste sorting and recycling program. The non-governmental organization R20 Regions of Climate Action (R20), local authorities in Oran, and the Algerian government are collaborating to expand waste sorting and recycling, to form the foundation for additional composting, incineration, and waste valorization programs. This initiative builds on national efforts to support waste management, but pilots a new approach not found at the national level. The partnership in Oran pilots an incremental and holistic approach to waste sorting and recycling, designed to create material streams that can attract the private sector and monetize recycling efforts. The program is estimated to contribute 11,572.9 tons CO2e in reductions in 2020 (author’s calculations). Since the 2002 launch of its National Program of Municipal Waste Management (PROGDEM), the Algerian government has supported efforts to strengthen municipal waste management strategies, often through the development of city waste management plans, or creation of landfills, and sorting centers (SWEEP-Net 2014). This legislation offers a framework for Algerian authorities to scale up the model for implementing a comprehensive sorting and recycling program and attracting much-needed (SWEEP-Net 2014) investment in the waste sector in Oran. California, United States of America The California Advanced Clean Cars Program builds on and goes beyond national standards, combining regulations for smog, soot-causing pollutants, and greenhouse gas emissions in a balanced set of requirements, known as Low Emission Vehicles (LEV) III (CalEPA, Air Resources Board) for model years 2017-2025. This policy also encompasses the Zero-Emission Vehicle Program, which aims to support and accelerate the numbers of plug-in hybrids and zero-emission vehicles in California. The Program’s goal is to usher in 1.5 million plug-in hybrids, electric vehicles, and hydrogen-powered fuel cell vehicles, equal to 1 in 7 cars sold in the state, by 2025 (California Office of the Governor 2012). In implementing the Advanced Clean Car Program, California continues its tradition of setting more ambitious vehicle emissions standards than the national government. As the only state the federal Clean Air Act allows to request an EPA waiver for state-level vehicle emission standards that go beyond national requirements, California has long been a leader in promoting cleaner passenger vehicles. In 2002, California passed the Clean Cars Law, commonly known as the Pavley standard, which set GHG emission limits that surpassed national requirements on new passenger vehicle models 2009-2016. Between 2004 and 2007, 14 states followed suit, adopting the stricter standards set by California (Maryland Department of the Environment). The State’s Advanced Clean Car requirements also exceed the nationally adopted regulations they helped craft, and could spur other states, or the national government, to once again adopt these more ambitious targets. Together with California’s Pavley vehicle emissions standards, which target the model years 2009-2016, the Advanced Clean Cars Program’s suite of regulations represent the state’s single largest carbon mitigation strategy. It is estimated that California’s Clean Cars Program alone will

contribute 289 million metrics tons of carbon dioxide equivalent in the year 2020 – equal to a nearly 65 percent reduction in the state’s total passenger vehicle emissions in 2013. Cape Town, South Africa Among Cape Town’s renewable energy and energy efficiency programs, the pioneering Kuyasa Project stands out for enabling an impoverished community in the Cape Town township of Khayelitsha to “leap-frog” beyond carbon-intensive strategies for meeting their heating and lighting needs, turning instead to solutions that lessen the community’s dependence on an overloaded and polluting grid. From 1999 to 2010, the project, spearheaded by the City of Cape Town, the Dutch NGO SouthSouthNorth and residents of the township’s Kuyasa neighborhood, retrofitted 2,309 low-income homes with solar water heaters, insulated ceilings, and energy efficient lighting, saving energy and electricity while reducing carbon emissions by 2.80 tons per household or 3,879 tons CO2e in total (ESMAP 2012; authors’ calculations). The Kuyasa Project is also South Africa’s first internationally registered Clean Development Mechanism (CDM) venture, meaning that industrial firms can purchase some of the project’s annual 6,580 tons of reduced carbon emissions to help them meet their Kyoto Protocol targets. Cape Town’s implementation of this project depended on its on successfully leverage funding from national grants and funds and from third-party organizations. SouthSouthNorth helped fund Cape Town’s efforts to qualify for participation in the Clean Development Mechanism (CDM), complementing grants from the Department of Environmental Affairs and Tourism and Western Cape Provincial Department of Housing, along with a loan from South African Export Development Fund (ESMAP 2012). The CDM income, in turn, provided a sustainable stream of financing that made the project possible (ESMAP 2012). Cape Town’s access to horizontally-aligned support enabled and reinforced its access to vertically-aligned support, and vice versa. Hamburg, Germany Hamburg’s industry-focused climate actions reference and draw legitimacy from Germany’s mitigation target, but originated and are implemented at the local level. Hamburg’s Climate Action Master Plan, which outlines a framework for 2020 and 2050 climate targets and policy, aims to cut emissions 30 percent below 1990 levels by 2020, and 80 percent below 1990 levels by 2050, in support of Germany’s target of lowering national emissions 40 percent below 1990 levels by 2020. This plan leverages the city’s strong ties with industry and the business community. The city’s Senate and the business community have coordinated on the rapid implementation of a range of voluntary measures for resource efficiency that go beyond legal requirements (City of Hamburg 2013). This initiative's cost savings – an estimated 20.5 million euro per year – motivate companies to participate (City of Hamburg 2012). From 2001 to 2012, companies carried out over 1,750 projects enhancing efficiency in lighting, heating, and cooling. These activities have saved an

estimated 146,000 tons of carbon dioxide and 432,500 megawatts of energy per year, helped to conserve 687,500 cubic meters of water, and avoid over 26,400 tons of waste (City of Hamburg 2012). This success helped motivate additional companies to take climate action; 11 industrial companies mitigated 514,924 tons of carbon dioxide in the 2008 to 2012 period, a carbon savings equal to 25 percent of the Hamburg Climate Action Plan’s total mitigation goal. This success built momentum to extend the group’s effort to 2018 and bring four additional companies on board, aiming to increase their carbon reduction by an additional 130,000 tons beginning in 2018 (City of Hamburg 2013). While the emissions reductions are likely captured in Germany’s national inventory, vertically-integrated approaches to scaling up the policies that drove them are not currently specified. Hamburg’s participation in climate action networks, such as the Climate Alliance, may help these strategies spread to other centers of industry. Rajasthan, India Rajasthan’s and India’s solar energy policies operate in parallel, deriving energy from each other while operating primarily independently. India has made solar energy production a cornerstone of its development and climate mitigation strategies, a process that could expand energy access and offset the growth of more polluting fuels, such as coal, leading to improved air quality and public health. In June 2015, the Union Cabinet approved Prime Minister Narendra Modi’s goal of generating 176 gigawatts of electricity from renewable energy sources and 100 gigawatts of electricity from solar energy by 2022 (The Economic Times 2015). India is projected to add 24 gigawatts of utility-scale solar PV capacity between 2015 and 2019 (Bridge to India 2015). Rajasthan leads solar capacity installation among Indian states, with 1,128 megawatts installed (The Times of India 2015). Along with the neighboring state of Gujarat (953 megawatts), Rajasthan makes up nearly half of India's total installed solar capacity (Jaiswal 2015). Before Prime Minister Modi expanded India’s solar capacity target to 100 gigawatts, Rajasthan’s 2011 solar power goal exceeded it, aiming to reach 25 gigawatts of new solar capacity by 2022, in comparison to the national government’s goal of 22 gigawatts in the same time frame (CleanTechnica 2014). Rajasthan’s current rate of solar power generation would offset 38.4 million tons of CO2e in 2020 (authors’ own calculations). Rajasthan’s Solar Energy Policy for 2014 builds on the momentum of both the state’s 2011 energy plan and the Jawaharlal Nehru National Solar Mission’s recently enhanced ambition. It targets known obstacles in financing and land acquisition, introducing lowered net worth requirements for prospective project developers, lengthening land leases to allow developers to plan for longer-term investments, and easing the application process for plants under 10 megawatts to facilitate faster approval (CleanTechnica 2014). Though India’s solar mission cites Rajasthan as an example of a solar leader, and encourages other states to examine and adopt best practices for supporting solar implementation at the state level, it has not scaled up the specific strategies the region has employed. Shenzhen, China
China already has a highly vertically-integrated governance system, with policies formulated at the central government level and subsequently implemented at the provincial and local levels (Lieberthal and Oksenberg 1998). In particular, five-year social and economic development plans form the basis for major environment and energy-related targets. China’s 12th Five-Year Plan (2011-2015) required the establishment of an Emission Trading Scheme (ETS) as one policy approach to meet its energy and climate targets. On October 29, 2011, the National Development and Reform Commission (NRDC), China’s main policy implementing body, selected five cities and two provinces – Shenzhen, Beijing, Shanghai, Chongqing, Hubei, Tianjin and Guangdong – as initial pilots to test emissions trading in China, with a goal to establish a national scheme by 2017. Among these cities, Shenzhen stands out as a leader in greenhouse gas emission reduction, with the lowest emissions intensity (carbon dioxide emissions per unit GDP) of all of China’s most populous cities – in this case, cities containing a population greater than 1 million people (China Emissions Exchange 2014). The program now covers 635 industrial enterprises from 26 sectors, accounting for 30 million tons of annual carbon dioxide emissions, which are traded in this system. The trading scheme includes the transportation sector and 197 public buildings that span more than 10,000 square meters. In 2010, Shenzhen’s ETS encompassed 40 percent of the city’s total emissions and 26 percent of Shenzhen’s GDP (China Emissions Exchange 2014). In 2013, its first year of implementation, Shenzhen’s pilot ETS achieved its emission reduction target of 25 percent – far exceeding the national 12th Five-Year Plan target of 17 percent reduction in carbon intensity reduction. 631 of the 635 participating companies fulfilled their emissions reduction obligation, decreasing emissions by 3.83 million tons (11.7 percent) and increasing their market value by 105.1 billion Yuan (42.6 percent) from 2010 to 2013, indicating a decoupling of profits and emissions. These companies’ average carbon intensity dropped 38.1 percent, even more than Shenzhen’s overall carbon emission reduction rate of 33.5 percent. Characterizing the Alignment of Sub-national Climate Action While not representative of the full range of sub-national climate action, these case studies help illustrate different modes of vertical integration and the ways horizontal networks of climate action buttress the relationship between sub-national and national governments. Table 1 summarizes elements of horizontal and vertical integration identified in each case study, using three sets of indicators or proxies – Funding, Monitoring and Evaluation, and Policy Links. In addition to identifying vertical and horizontal policy linkages, we focus on funding and monitoring both because they are feasible to track, and because technical capacity and financial resources are frequently cited as two key stumbling blocks for implementing local climate action (Aylett 2014; Ryan 2014; C40 2016; Harrison 2013; Salon et al 2014). We define the degree of vertical integration between national and sub-national governments based on the extent and depth of policy or strategy overlap (e.g., policy linkages), and the level of dispersion of the policy or strategy from one level of government to another. Shenzhen, China is the clearest case of vertical alignment, where China’s top-down authoritarian political system
mandated Shenzhen’s emissions trading pilot. Cape Town’s energy efficiency project is considered slightly to represent a more bottom-up strategy than Oran, since the Algerian government is a member of the wilaya’s effort to pilot recycling and waste management strategies. However, since the results of Oran’s pilot are not yet formally integrated into Algeria’s national policies and strategies, it is still considered relatively unaligned and a bottom-up strategy. Acre’s deforestation strategy is classified as slightly more top-down than Belo Horizonte, since it explicitly uses a national deforestation target to frame and catalyze its policy, while Belo Horizonte’s work builds on both past municipal legislation as well as on a national waste management mandate. Horizontal alignment, defined as a case studies’ connection to peer cities and regions, either directly or through third parties, such as international organizations or networks of climate action, may exist in cases where external networks collaborate with a local government to implement a program. In some cases, actors receive funding through international mechanisms like the UNFCCC’s Clean Development Mechanism (CDM), suggesting horizontal alignment with similar emissions-savings projects in other geographic locations. In Cape Town, Acre, and Oran, for example, support from NGOs and international development organizations or mechanisms is crucial to implementing the project. In other case studies, such as British Columbia and California, the sub-national government operated independently, but may have drawn ideas or motivation from their participation in broader networks of climate action. The information regarding sub-national governments’ participation in networks of climate action, noted under the Policy Links column, are mechanisms that may enable other climate actors to access and benefit from the case study in questions. These mechanisms could help facilitate the spread of case study activities to other sub-national governments, but our analysis does not assess whether or not this dispersal has occurred. Synthesizing Table 1, Figure 1 spatially maps the nine case studies within a two-dimensional grid, where the x-axis represents a spectrum of horizontal alignment and the y-axis tracks vertical alignment. Each case study is also identified within one of Broekhoff et al’s (2015) three categories of vertical integration. Cities or regions classified as policy architects and leaders in Table 1 bear primary body responsible for a policy’s design, formulation, application, implementation and enforcement. California and British Columbia fall into this category, spearheading the Advanced Clean Cars Program and implementing a fossil fuel carbon tax independent of national mandates or support. Cities or regions labeled critical implementers undertake responsibility for key application, implementation, or enforcement actions related to a policy that originated outside their jurisdiction. Shenzhen’s role piloting an emissions trading scheme for wider deployment across China represents one example of this form of vertical integration. Cities or regions considered complementary or strategic partners demonstrate actions that contribute to the effectiveness, uptake, penetration, or success of a policy led by higher levels of government. For instance, Acre and Hamburg adopt national climate targets for deforestation and mitigation, but also develop new, complementary, and locally-focused strategies to support the implementation of these goals. Similarly, Rajasthan’s efforts to facilitate solar installation will help India meet its national target, but constitutes a separate and independent strategy for supporting solar energy.

This spatial mapping allows for direct comparison between the push (i.e., horizontal) and pull (i.e., vertical) factors that shed light into drivers of sub-national climate action. The most horizontally aligned policies leverage broader networks and third-party actors to support a policy’s funding and monitoring, as well as linking the sub-national actor to other governments and networks. From Figure 1, it appears that horizontal factors were slightly stronger driving forces in our nine case studies, with five out of the nine demonstrating elements of stronger horizontal alignment. Most cases, with the exception of California and British Columbia, demonstrate a moderate degree of vertical alignment. Strong vertical alignment is likely absent in these two cases of California and British Columbia because these states are located in countries with highly federal political systems, where both are among the highest GDP output in their respective countries. This political structure and their strong economic grounding may give them more political leeway and leverage to be Policy Leaders, implementing climate policies that go beyond their national governments. Cape Town’s climate action, however, demonstrates that leadership remains possible in other economic contexts, though it may be more reliant on horizontal integration to fill funding gaps. The Complementary Partners all appear to have similar degrees of vertical alignment, although the role of horizontal factors is more diverse. Acre is both more vertically-aligned and more horizontally aligned than Oran. Though the Brazilian state formally adopts a national policy target, it implements this target largely by leveraging its horizontal alignment. Though the policy links between Oran and Algeria are more informal, the national government is active in advising the implementation of the wilaya’s waste management strategy. This comparison suggests that the direction, in addition to the degree, of vertical alignment influences the role horizontal alignment plays. Oran’s alignment, while informal, is both top-down and bottom-up. Acre’s adoption of a national target occurs primarily from the bottom-up, compelling the state to turn to other partners to implement its goals. Within this mode of vertical integration, Rajasthan demonstrates the lowest degree of horizontal alignment, due to the fact that the state acted independently to implement policies to draw and maintain investors in solar energy.
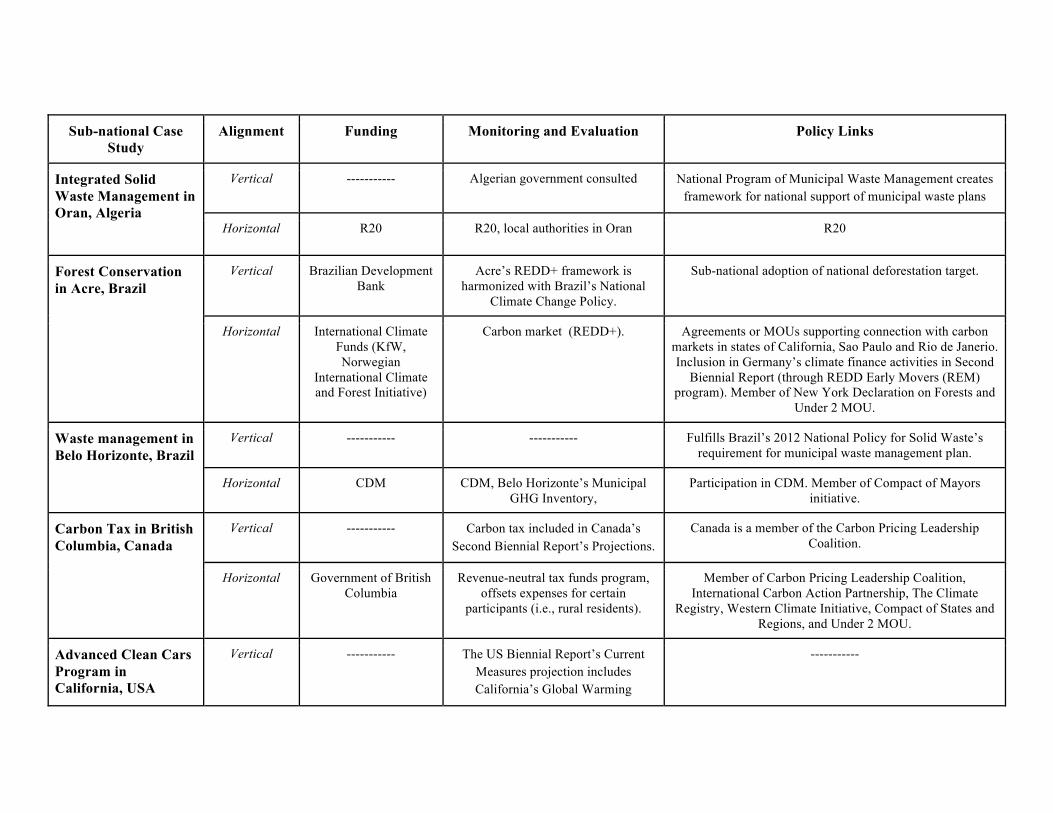
Sub-national Case Study
Alignment Funding Monitoring and Evaluation Policy Links
Integrated Solid Waste Management in Oran, Algeria
Vertical ----------- Algerian government consulted National Program of Municipal Waste Management creates framework for national support of municipal waste plans
Horizontal R20 R20, local authorities in Oran R20
Forest Conservation in Acre, Brazil
Vertical Brazilian Development Bank
Acre’s REDD+ framework is harmonized with Brazil’s National
Climate Change Policy.
Sub-national adoption of national deforestation target.
Horizontal International Climate Funds (KfW, Norwegian
International Climate and Forest Initiative)
Carbon market (REDD+). Agreements or MOUs supporting connection with carbon markets in states of California, Sao Paulo and Rio de Janerio. Inclusion in Germany’s climate finance activities in Second
Biennial Report (through REDD Early Movers (REM) program). Member of New York Declaration on Forests and
Under 2 MOU.
Waste management in Belo Horizonte, Brazil
Vertical ----------- ----------- Fulfills Brazil’s 2012 National Policy for Solid Waste’s requirement for municipal waste management plan.
Horizontal CDM CDM, Belo Horizonte’s Municipal GHG Inventory,
Participation in CDM. Member of Compact of Mayors initiative.
Carbon Tax in British Columbia, Canada
Vertical ----------- Carbon tax included in Canada’s Second Biennial Report’s Projections.
Canada is a member of the Carbon Pricing Leadership Coalition.
Horizontal Government of British Columbia
Revenue-neutral tax funds program, offsets expenses for certain
participants (i.e., rural residents).
Member of Carbon Pricing Leadership Coalition, International Carbon Action Partnership, The Climate
Registry, Western Climate Initiative, Compact of States and Regions, and Under 2 MOU.
Advanced Clean Cars Program in California, USA
Vertical ----------- The US Biennial Report’s Current Measures projection includes California’s Global Warming
-----------

Solutions Act (AB 32).
Horizontal Government of California (CalEPA)
Government of California (CalEPA) Member of Compact of States and Regions, Under 2 MOU, and The Climate Group.
Emissions Trading in Shenzhen, China
Vertical ----------- People’s Republic of China (National Development and Reform
Commission).
Establishment of an emissions trading market included as part of activities undertaken during 12th Five-Year Plan
period.
Horizontal ----------- Shenzhen Development and Reform Commission
Participant in U.S. – China Climate Leaders Declaration, California-China Urban Climate Collaborative, MOU between Shenzhen and Los Angeles. Member of C40 Cities.
Harnessing Industry in Hamburg, Germany
Vertical ----------- National GHG inventory likely to capture emissions reductions
-----------
Horizontal Industry’s efficiency gains and savings
Government of Hamburg, participating industries
Member of the Covenant of Mayors, CDP, The Climate Network
Solar Power in Rajasthan, India
Vertical ----------- Solar power counted towards India’s 2022 100 GW solar target. Rajasthan
participates in national Solar Data Sharing and Accessibility Policy.
Supports goals of India’s 2022 100 GW solar target and Jawaharlal Nehru National Solar Mission. Solar Mission
cites Rajasthan as example of state implementing “favorable state Government policies” other states could adopt.
Horizontal Attracting financial investment (national and international).
Government of Rajasthan; third parties (investors, funders, NGOs).
-----------
Energy Efficiency in Cape Town, South Africa
Vertical National grant and loan ----------- -----------
Horizontal Third-party support, CDM, sub-national
grant
CDM, City of Cape Town Participation in CDM, Member of Compact of Mayors and C40 Cities.
Table 1. Indicators or proxies used to evaluate degree of horizontal and vertical alignment, used to inform spatial mapping and analysis in Figure 1. Source: authors.

Figure 1. The level of horizontal and vertical alignment in nine case studies of sub-national climate action. Classifications of vertical integration (policy leader, critical implementer, and complementary partner) adapted from Broekhoff et al. (2015). Our classification focuses strictly on the observed relationship between different levels of government, rather than on the sector of climate action or resources available to different levels of government, though these forces may influence the nature of their collaboration. Mitigation potential The mitigation impact of scaling these case studies up to the national level demonstrates the potential that could be realized by more widespread coordination between various levels of climate action. To determine how to scale each project to the national level, we relied on feedback from in-country experts, and tailored the method of scaling up for every initiative. For instance, to scale up Shenzhen’s emissions trading scheme (ETS), we calculated the emissions reductions that would result if the emissions coverage and reductions achieved by the city’s ETS applied to all seven other pilot cities, and the emissions reductions that would occur if the ETS were applied to 45 mega-cities with a population greater than one million. More details about the
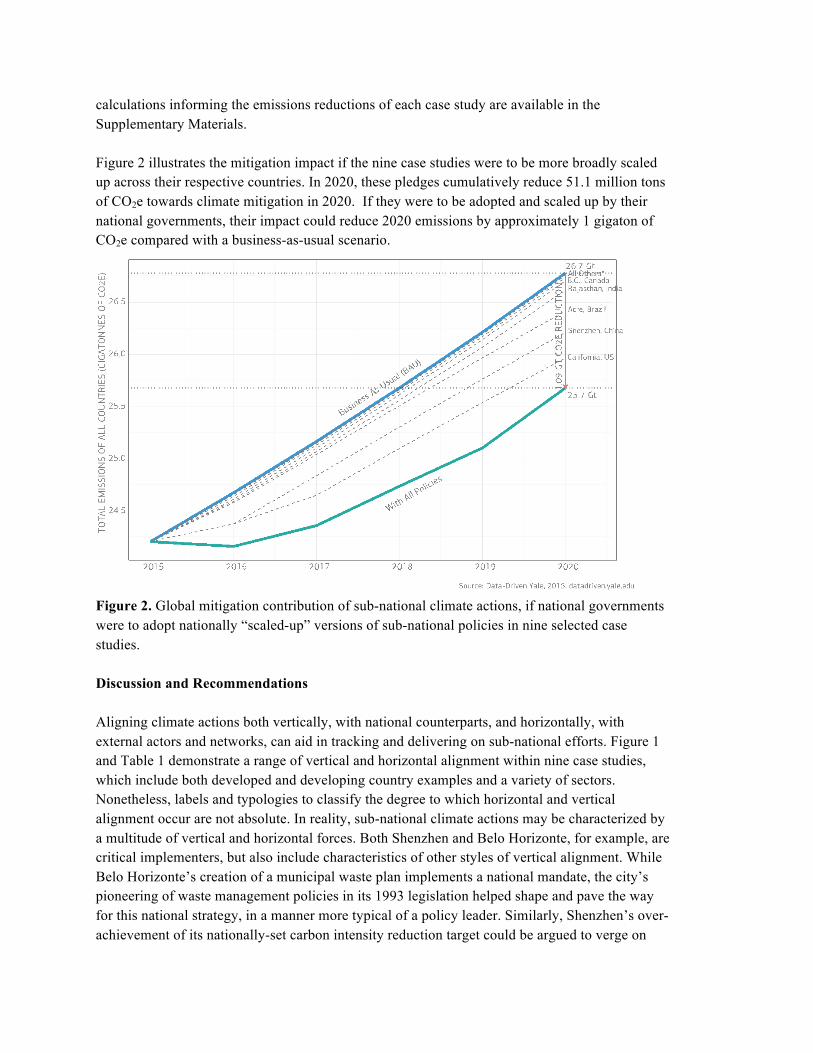
calculations informing the emissions reductions of each case study are available in the Supplementary Materials. Figure 2 illustrates the mitigation impact if the nine case studies were to be more broadly scaled up across their respective countries. In 2020, these pledges cumulatively reduce 51.1 million tons of CO2e towards climate mitigation in 2020. If they were to be adopted and scaled up by their national governments, their impact could reduce 2020 emissions by approximately 1 gigaton of CO2e compared with a business-as-usual scenario.
Figure 2. Global mitigation contribution of sub-national climate actions, if national governments were to adopt nationally “scaled-up” versions of sub-national policies in nine selected case studies. Discussion and Recommendations Aligning climate actions both vertically, with national counterparts, and horizontally, with external actors and networks, can aid in tracking and delivering on sub-national efforts. Figure 1 and Table 1 demonstrate a range of vertical and horizontal alignment within nine case studies, which include both developed and developing country examples and a variety of sectors. Nonetheless, labels and typologies to classify the degree to which horizontal and vertical alignment occur are not absolute. In reality, sub-national climate actions may be characterized by a multitude of vertical and horizontal forces. Both Shenzhen and Belo Horizonte, for example, are critical implementers, but also include characteristics of other styles of vertical alignment. While Belo Horizonte’s creation of a municipal waste plan implements a national mandate, the city’s pioneering of waste management policies in its 1993 legislation helped shape and pave the way for this national strategy, in a manner more typical of a policy leader. Similarly, Shenzhen’s over-achievement of its nationally-set carbon intensity reduction target could be argued to verge on
complementary partnership, the crafting of supportive sub-national scaffolding around a national policy. Successful instances of vertical integration are likely to generate virtuous cycles and positive feedback loops (Hoffmann 2011) that make these relationships more difficult to classify. Similarly, while horizontal integration often fills gaps left by incomplete vertical integration, the nature and impact of this reinforcement varies greatly. For instance, Cape Town’s access to horizontally- and vertically-aligned support depended on and reinforced each other; the city needed national funding to quality for participation in the CDM, and depended on CDM support to access a level of financial security that was unavailable through local or national means. In Acre, the REDD+ network went beyond filling a crucial gap in the national government’s support of the implementation of the state’s efforts. By harmonizing Acre’s monitoring framework with Brazil's National Climate Change Policy, the creation of the state’s REDD+ framework also helped build a key link and enabling factor for a more aligned relationship between the state and national government. Although horizontal integration often fills key gaps to make implementation possible, strong vertical and horizontal alignment are not mutually exclusive. Shenzhen’s membership in a number of climate networks, including C40 for instance, far exceeds the less vertically-aligned Rajasthan’s. While these nine case studies do not capture the full range and variation in vertical and horizontal alignment, our findings align with other research confirming the value of transnational networks in implementing climate action. A 2011 study by Martins and Costa Ferreira illustrates the crucial role membership in transnational municipal networks played in developing climate change policies in the Sao Paulo and Rio de Janeiro (Ryan 2014). By helping sub-national governments acquire technical capacity and financial resources, horizontally-aligned networks tackle two key stumbling blocks standing in the way of local climate action (Aylett 2014; Ryan 2014; C40 2016; Harrison 2013; Salon et al 2014). A 2016 C40 report identified 2,300 high-impact, readily-deliverable urban activities, capable of saving 450 megatons of CO2 by 2020, but noted that three-quarters of these projects would require outside support from the national government or private sector to overcome gaps in resources and funding, mobilize political will and leadership, or navigate institutional, regulatory or legislative issues that lie outside of cities’ sole jurisdiction (C40 2016). This need for supplementary support can occur even in relationships that are vertically aligned in other ways. Larson (2002) describes the assignment of new policy responsibilities to local government, without the corresponding funds to implement them, as a relatively common global trend (Ryan 2014). Overall, the case studies and estimated additional mitigation potential in Figure 2 suggest many missed opportunities for national governments to support and leverage sub-national activities, either through providing financial and technical assistance in implementing and monitoring these activities, or through more comprehensively adopting and scaling up successful case studies. This lack in coordination becomes especially important in light of the opportunity to leverage INDCS to encourage additional investment and cooperation from international development banks (Edwards et al 2015). Excluding sub-national activities from national climate action plans further fragments the landscape of climate action. The broader literature (Broekhoff et al. 2015; Corfee-Marlot 2009; Betsill and Bulkeley 2006; Keohane and Victor 2011; Keohane and Victor 2016;
Erickson and Tempest 2014; Chan and Pauw 2014) echoes this missed opportunity to realize greater mitigation by fostering stronger vertical alignment, and the need to better harness the “polycentric” (Ostrom 2010) climate governance framework. Our research suggests that better tracking networks and multiple scales of climate action could facilitate stronger understanding and support for mitigation efforts. Including clear criteria for national biennial communications to detail sub-national contributions would help avoid possible double counting of emissions reductions and make clear how multiple levels of climate action relate. Third-party organizations, academic experts, and analysts could help in these efforts to assess how national governments can further leverage horizontal and vertical integration to achieve higher ambition in national pledges – demonstrated through the additional “scaled up” emissions savings presented in this paper. Key facilitating organizations or mechanisms, like the CDM or REDD+ frameworks, could build an assessment of the need, style and degree of support for vertical integration into their coordination with sub-national governments. Identifying more effective ways for horizontally-aligned support to spark and facilitate vertical integration could help disperse strategies more widely. Additionally, while data on the role horizontal networks play in supporting climate action is fairly accessible, information on their role in dispersing successful examples is less closely tracked. Research or data that monitors the dispersal of successful climate actions to other sub-national governments could help identify where examples spread organically (either vertically or horizontally), and where networks of climate action can be most useful in amplifying examples that might otherwise be overlooked. Conclusion The groundswell of sub-national and regional climate actions are poised to play a critical role in meeting the mitigation goals of the Paris Agreement, capping global temperature rise at or below 2 degrees Celsius. Harnessing sub-national mitigation activities within the structure of the Paris Agreement, however, also highlights the need to strengthen alignment between different levels of government. Our assessment of nine sub-national case studies captures varying degrees and modes of vertical integration, and highlights the role horizontally-aligned international networks and coalitions play in filling gaps in financial resources or technical support. Fostering greater horizontal and vertical alignment is crucial to helping to both implement climate action and to facilitate successful strategies to other sub-national and national governments. Horizontally-aligned actors not only supplement, but, in some instances, catalyze or enable coordination between sub-national and national governments. Enhancing cooperation between national governments and third-party organizations and networks in both climate action frameworks and assessments could enable a more coordinated and efficient use of resources, facilitating a more rapid scaling up of climate action.

Acknowledgments We thank the following contributors to this research: David Albertani, R20 Regions of Climate Action; Dr. Felipe Bittencourt, WayCarbon; Ana Caetano, City of Belo Horizonte, Brazil; William Dean, CalEPA; Dr. Todd Edwards, Stanley Foundation; Kristina Haddad, R20 Regions of Climate Action; Bing Han, China Emission Exchange; Nesamani Kalandiyur, CalEPA; Qiuping Li, R20 Regions of Climate Action; Yin Lin, China Emission Exchange; Lavender Luo, China Emission Exchange; Christophe Nuttall, R20 Regions of Climate Action; Aromar Revi, Indian Institute for Human Settlements; Sarang Shidore, Lyndon B. Johnson School of Public Affairs. The University of Texas at Austin; Kartikeya Singh, Asian Affairs, Department of Energy - International Affairs; Terry Tamminen, R20 Regions of Climate Action; Denise Welch, R20 Regions of Climate Action; Mark Wenzel, CalEPA; and Professor Xiliang Zhang of Tsinghua University. We’d also like to thank Carlin Rosengarten for valuable editing and writing assistance. References Beecheno, K. (2013). Recycling and waste management in Brazil: Overview Report. Proceedings from: Consumption Work and Societal Divisions of Labour Conference. Retrieved from: http://www.essex.ac.uk/sociology/research/divlab/Recycling_and_Waste_Management_in_Brazil_Overview_Report.pdf. Betsill, M. M., & Bulkeley, H.. (2006). Cities and the Multilevel Governance of Global Climate Change. Global Governance, 12(2), 141-159. Retrieved from http://www.jstor.org/stable/27800607. Bulkeley, H. and Moser, S. C. (2007). Responding to Climate Change: Governance and Social Action beyond Kyoto. Global Environmental Politics, Vol. 7.2 pp. 1-10. Bridge to India. (2015). India solar handbook. Retrieved from: http://www.bridgetoindia.com/our-reports/india-solar-handbook/. Broekhoff, Derik, Peter Erickson, and Carrie M. Lee. (2015). What cities do best: Piecing together an efficient global climate governance. Stockholm Environment Institute Working Paper 2015-15. California Air Resources Board. (2011) Advanced Clean Cars Program. Retrieved from: http://www.arb.ca.gov/msprog/consumer_info/advanced_clean_cars/acc.htm. California Office of the Governor. (2012, March 23). Executive order B-16-2012. Retrieved from: http://gov.ca.gov/news.php?id=17472. Canada’s Ecofiscal Commission. (2015). A snapshot of carbon pricing in Canada. Retrieved from: http://ecofiscal.ca/reports/wayforward/infographic/.

California Air Resources Board. (2016). Cap and Trade Program (CA-ARB, 2014). Retrieved from: http://www.arb.ca.gov/cc/capandtrade/capandtrade.htm. Cofree-Morlot, J. et al. (2009) Cities, Climate Change and Multilevel Governance. OECD Environment Working Papers, No. 14, OECD Publishing, Paris. DOI: http://dx.doi.org/10.1787/220062444715. Government of the People’s Republic of China. (2011). China’s 12th Five-Year Plan (2011-2015). China Emissions Exchange. (2014). Annual report on Shenzhen emissions trading scheme first-year operation: Compliance period I (2013-2014). Retrieved from: http://www.ieta.org/assets/China-WG/shenzhen-2013etsreport.pdf. City of Hamburg. (2012). Hamburg climate action plan 2007-2012, update 2011-2012. Communication of the Senate to the Hamburg Parliament. Retrieved from: http://www.hamburg.de/contentblob/3959638/data/download-update-2011-12-englisch.pdf. City of Hamburg. (2013). Status quo report. Retrieved from: http://urbantransform.eu/wp-content/uploads/sites/2/2015/07/Status-Quo-Report_Hamburg.pdf. Chadha, M. (2014, October 8). Indian state of Rajasthan simplifies regulations to boost solar power capacity by 25 GW. CleanTechnica. Retrieved from: http://cleantechnica.com/2014/10/08/indian-state-rajasthan-simplifies-regulations-boost-solar-power-capacity-25-gw/. Chan, S. and Pauw, P. (2014). A Global Framework for Climate Action (GFCA) Orchestrating Non-State and Subnational Initiatives for More Effective Global Climate. German Development Institute. Discussion paper 34/2014. China Emissions Exchange. (2014). Annual Report on Shenzhen Emissions Trading Scheme First-Year Operation: A Comprehensive Analysis of Shenzhen’s Cap-and-Trade Program. Retrieved from: http://www.ieta.org/resources/China/shenzhen-2013etsreport.pdf. Harrison, N. (2013). Sub-national involvement in NAMA development: Current and emerging practice towards vertical integration. Deutsche Geseullschaft fur Internationale Zusammenarbeir (GIZ). Retrieved from: http://www.ecofys.com/files/files/ecofys-giz-2013-sub-national-involvement-nama_02.pdf. Ecosystem Marketplace. (2014). Acre and goliath: One Brazilian state struggles to end deforestation. Retrieved from: http://www.ecosystemmarketplace.com/articles/acre-and-goliath-one-brazilian-state-struggles-to-end-deforestation/. Edwards, G., Roberts, J.T., Araya, M., Retamal, C. (2015). A New Global Agreement Can Catalyze Climate Change in Latin America. The Brookings Institute Policy Paper 2015-03.

Elgie, S., & McClay, J. (2013). BC’s carbon tax shift after five years: Results. Sustainable Prosperity. Retrieved from: http://sustainableprosperity.ca/sites/default/files/publications/files/BC%27s%20Carbon%20Tax%20Shift%20after%205%20Years%20-%20Results.pdf. Erickson, P. and Tempest, K. (2014). Advancing climate ambition: How city-scale actions can contribute to global climate goals. Stockholm Environment Institute Working Paper 2014-06. World Bank Energy Sector Management Assistance Program (ESMAP). (2012). Good practices in City Energy Efficiency: Cape Town-Kuyasa Settlement, South Africa- LowIncome Energy Efficiency Housing Project. Retrieved from: http://www.esmap.org/sites/esmap.org/files/Kuyasa_EECI_Housing_FinalCaseStudy_Africa.pdf. Fong, W.K, Sotos, M., Doust, M. Schultz, S., Marques, A., Deng-Beck, C. et al. Global Protocol for Community-Scale Greenhouse Gas Emissions Inventories: An accounting and reporting standard for cities. (World Resources Institute, C40 Cities Leadership Group, and ICLEI – Local Governments for Sustainability, 2014); http://ghgprotocol.org/files/ghgp/GHGP_GPC.pdf. Gillenwater, M. What is additionality? (Greenhouse Gas Management Institute, Discussion Paper 001, 2012); http://ghginstitute.org/wp-content/uploads/2015/04/AdditionalityPaper_Part-1ver3FINAL.pdf. Deutsche Geseullschaft fur Internationale Zusammenarbeir (GIZ). REDD Early Movers. Retrieved from: https://www.giz.de/en/worldwide/33356.html. Federative Republic of Brazil. (2015). Intended Nationally Determined Contribution Towards Achieving the Objective of the United Nations Framework Convention on Climate Change. Retrieved from : http://www4.unfccc.int/submissions/INDC/Published%20Documents/Brazil/1/BRAZIL%20iNDC%20english%20FINAL.pdf. Governor’s Climate & Forests Task Force. (2013). Current REDD+ program progress. Retrieved from: http://www.gcftaskforce-database.org/ReddImplementation/Acre Verified Carbon Standard (VCS). Jurisdictional and nested REDD+ pilot programs. Retrieved from: http://www.v-c-s.org/jnr-pilot-programs Government of Canada. (2016). Canada’s Second Biennial Report of Climate Change. Retrieved from: http://unfccc.int/national_reports/biennial_reports_and_iar/submitted_biennial_reports/items/7550.php. Green Growth Best Practices. (2014). Waste and Recycling in Belo Horizonte. Laloe, F. Seoul, Republic of Korea: Laloe, F. Retrieved from: http://www.ggbp.org/case-studies/brazil/waste-and-recycling-belo-horizonte.

Hoehne, N., Sterl, S., and Fekete, H. (2015). How much more could Germany achieve through non-state action? NewClimate Institute. Retrieved from: https://newclimateinstitute.files.wordpress.com/2015/11/15013-initiatives-final-report.pdf. Hoffmann, M. (2011) Climate Governance at the Crossroads. New York: Oxford University Press. Hsu, A., et al. (21 April 2016). Track climate pledges of cities and companies. Nature 532: 303-305. Hsu, A., et al. (2015). State of Play: Contextualizing Non-state and Sub-national Actors’ Climate Pledges Through NAZCA and the LPAA. Yale University. Retrieved from: https://campuspress.yale.edu/datadriven/files/2015/11/Yale_NAZCAStateofPlayMemo_Dec4-27jlxg8.pdf. Jaiswal, A. (2015, June 30). Rapid growth in India's solar energy market: Stronger policies to achieve 100 GW by 2020. Natural Resources Defense Council, Switchboard Blog. Retrieved from: http://switchboard.nrdc.org/blogs/ajaiswal/rapid_growth_in_indias_solar_e.html. Lieberthal, K., & Oksenberg, M. (1988). Policy making in China: Leaders, structures, and processes. Princeton University Press. Keohane, R.O. and Victor, D.G. (2011). The Regime Complex for Climate Change. Perspectives on Politics 9:1. Keohane, R.O. and Victor, D.G. (2016). Cooperation and discord in global climate policy. Nature. Doi: 10.1038/NCLIMATE2937 Kovac, A. and W. K. Fong. (2015). Compact of Mayors Emissions Scenario Model. World Resources Institute. Retrieved from: www.wri.org/publication/compactdata2015. Maryland Department of the Environment. States adopting California’s Clean Car standards. Retrieved from: http://www.mde.maryland.gov/programs/Air/MobileSources/CleanCars/Pages/states.aspx. Ministry of Finance, British Columbia. (2013). Myths and Facts about the Carbon Tax. Retrieved from: http://www.fin.gov.bc.ca/tbs/tp/climate/A6.htm. Murray, B.C., & and Rivers, N. (2015). British Columbia’s revenue-neutral carbon tax: A review of the latest “grand experiment” in environmental policy. NI WP 15-04. Durham, NC: Duke University. Retrieved from: https://nicholasinstitute.duke.edu/sites/default/files/publications/ni_wp_15-04_full.pdf.
Nagarajan, G. (2015, February 28). India to quadruple renewable capacity to 175 gigawatts by 2022. BloombergBusiness. Retrieved from: http://www.bloomberg.com/news/articles/2015-02-28/india-to-quadruple-renewable-capacity-to-175-gigawatts-by-2022. OECD & CDSB. (2015). Climate Change Disclosure in G20 Countries: Stocktaking of Corporate Reporting Schemes. Retrieved from: http://www.oecd.org/daf/inv/mne/Report-on-Climate-change-disclosure-in-G20-countries.pdf. Ostrom, E. Polycentric systems for coping with collective action and global environmental change. Global Environ Change 20 (4): 550–557 (2010). Prefeitura de Belo Horizonte. (2012). 2 degree inventory of greenhouse gas emissions. Belo Horizonte, Brazil. Province of British Columbia, Intergovernmental Relations on Climate Action. Retreived from: http://www2.gov.bc.ca/gov/content/environment/climate-change/policy-legislation-programs/partnerships-outside-bc. PBL Netherlands Environmental Assessment Agency. (2015). Climate Action Outside the UNFCC: Assessment of the impact of international cooperative initiatives on greenhouse gas emissions. Retrieved from: http://www.pbl.nl/sites/default/files/cms/pbl-2015-climate-action-outside-the-unfccc_01188.pdf. R20 Regions of Climate Action. (2015). Program overview: Integrated solid waste management, Oran, Algeria. Retrieved from: http://www.regions20.org/images/Oran%20Waste%20Overview.pdf. Ryan, D. (2014). From commitment to action: a literature review on climate policy implementation at city level. Climatic Change (2015) 131:519–529. Salon, D., Murphy, S., Sciara, G. (2014). Local climate action motives enabling factors and barriers. Carbon Management: 5(1), 67–79. Seto K.C., S. Dhakal, A. Bigio, et al. (2014). Chapter 12. In Fifth Assessment Report of the Intergovernmental Panel on Climate Change, Cambridge Univ. Press. Shenzhen Municipal People's Government Office. (2012) Shenzhen Municipal People's Government on the issuance of Shenzhen Energy Saving "Twelfth Five Year Plan." Retrieved from: http://www.sz.gov.cn/zfgb/2012_1/gb778/201203/t20120306_1823115.htm. Singh, N. & Bacher, K. (2015). Guide for Designing Mandatory Greenhouse Gas Reporting Programs. World Resources Institute. Retrieved from: http://www.wri.org/publication/guide-designing-mandatory-greenhouse-gas-reporting-programs. Sugiyama N., and T. Takeuchi. (2008). Local Policies for Climate Change in Japan. The Journal of Environment & Development 17, 424-441.

SWEEP-Net. (2014). Country Report on the solid waste management in Algeria. Deusche Geselleschaft fur Internationale Zusammenarbeit (GIZ). Retrieved from: http://www.sweep-net.org/sites/default/files/ALGERIE%20RA%20ANG%20WEB_0.pdf. Vishnoi, A. Is Modi government's target to increase solar power capacity to five-fold in seven years achievable? (2015, August 22). The Economic Times. Retrieved from: http://articles.economictimes.indiatimes.com/2015-08-22/news/65739641_1_indian-railways-solar-power-solar-energy-corporation. The People’s Republic of China. (2012). Second National Communication on Climate Change of The People’s Republic of China. Retrieved from: http://unfccc.int/resource/docs/natc/chnnc2e.pdf. The Times of India. (2015, June 23). Rajasthan pips Gujarat in solar power, becomes No. 1 in country. Retrieved from: http://timesofindia.indiatimes.com/india/Rajasthan-pips-Gujarat-in-solar-power-becomes-No-1-in-country/articleshow/47776965.cms. Department of Economic and Social Affairs of the United Nations Secretariat. (2012). World Urbanization Prospects: The 2011 Revision. Retrieved from: http://www.un.org/en/development/desa/population/publications/pdf/urbanization/WUP2011_Report.pdf. World Wildlife Fund. (2013). Environmental service incentives system in the state of Acre, Brazil: Lessons for policies, programmes and strategies for jurisdiction-wide REDD+. Retrieved from: http://d2ouvy59p0dg6k.cloudfront.net/downloads/acre_brazil_sisa_report___english_10_13.pdf. United Nations Environment Programme (UNEP). (2014). The Emissions Gap Report 2014. Retrieved from: http://www.unep.org/publications/ebooks/emissionsgapreport2014/. United Nations Framework Convention on Climate Change (UNFCCC). (2015). Draft Decision CP.21. Retrieved from: https://unfccc.int/resource/docs/2015/cop21/eng/l09r01.pdf, May 4, 2016. United Nations Framework Convention on Climate Change (UNFCCC). (2015). Synthesis report on the aggregate effect of the intended nationally determined contributions. Retrieved from: http://unfccc.int/resource/docs/2015/cop21/eng/07.pdf. United States Department of State. US Climate Action Report 2014. (2014). Retrieved from: http://www.state.gov/documents/organization/218993.pdf. United States Department of State. USA 2016 Second Biennial Report. (2016). Retrieved from: https://unfccc.int/files/national_reports/biennial_reports_and_iar/submitted_biennial_reports/application/pdf/2016_second_biennial_report_of_the_united_states_.pdf Verified Carbon Standard. (2013). Jurisdictional and Nested REDD+ Pilot Programs. Retrieved from: http://www.v-c-s.org/jnr-pilot-programs.

Verified Carbon Standard. (2 October 2014). The road to zero-deforestation: Lessons from Brazil. Retrieved from: http://www.v-c-s.org/news-events/news/road-zero-deforestation-lessons-brazil Verified Carbon Standard. (2 June 2015). Two New JNR Guidance Documents Released and First JNR Program in Acre, Brazil has Documents Open for Public Comment. Retrieved from:http://www.v-c-s.org/news-events/news/two-new-jnr-guidance-documents-released-and-first-jnr-program-acre-brazil-has.
Aligning Sub-national Climate Actions for the new post-Paris Climate Regime Supplementary Information 1. Scaling Local and Regional Climate Policies to the National Level
Below is a detailed description of the calculations used to determine of the emissions reductions the following case studies could accomplish by 2020, both on their own, and when scaled to the national level by their respective national governments. Methods Data Sources Data sources varied among case studies. We used primary data, when possible, including empirically measured emissions reductions provided by project managers (e.g., in the Cape Town, South Africa and Hamburg, Germany case studies) or shared by in-country experts and government agencies. Where direct emissions reduction data was not accessible or available, we used proxies, such as the emissions factors of different energy sources, to calculate emissions reductions. Time Frame We sought to identify sub-national climate actions that went beyond or could be characterized as additional to national pledges. Our calculations assume that policies will be implemented gradually in 2015, before being fully implemented in 2016. As a result, the case study policies’ emissions effects grow gradually throughout the course of 2015, before reaching full impact in 2016. The Shenzhen case study is the exception: since China plans to scale this policy up in 2016, we assume that the policy will be gradually implemented from 2016 to 2017, and will reach full implementation in 2017. We recognize that the time required to secure political and social buy-in may vary greatly in different case studies. Since the goal of our study is to demonstrate the potential mitigation impacts of scaling sub-national action to the national scale, rather than to offer specific road maps for how this should occur, attempting to factor each country’s unique political and social climate into this forecast of initial implementation is out of the scope of this analysis. We instead assume a constant implementation period, where the mitigation benefits increase to their full potential linearly over the course of 2015. This gradual realization of each program’s full mitigation benefits is meant to approximate the time required to organize and implement the case studies at a national scale. Business As Usual (BAU) Calculations We calculated countries’ business as usual calculations (BAU) using linear projections of historic data to avoid double counting that could be associated with using countries’ own BAU calculations. This approach allowed us to apply a consistent methodology for determining the BAU pathway for different countries. Data predicting nations’ 2020 BAU emissions were not
consistently available for all of the countries considered in this paper. As a result, the predicted BAU pathways described in this report may vary slightly from other sources and from countries’ internal assessments of future trajectories and targets, based on differences in the methodologies used to calculate these figures. Greenhouse Gas Emission Targets Where countries pledged 2020 mitigation targets (i.e., the United States, Canada, and Germany) prior to the 2015 Paris climate negotiations, we made reference to how the sub-national case study contributes directly towards that goal. For other countries where 2020 goals are articulated on an intensity basis (e.g., carbon emissions per unit GDP), we calculated mitigation impact of sub-national efforts from BAU 2020 emission projections. Case Study 1: Oran, Algeria Case Study Description The Algerian government, Oran’s local government, trash collection agency, and sorting center, along with the non-governmental organization R20 Regions of Climate Action (R20) are collaborating to develop Oran’s waste sorting and recycling program. A coordinated outreach campaign, along with two workshops that trained 125 local professionals to become professionals become stewards of the program, piloted a new waste sorting and recycling waste stream in Oran’s AADL Pepiniere and Akid Lotfi neighborhoods. At the time of our research, the program involved some 54,000 residents and diverted approximately 605 kilograms of recyclable materials from the waste stream each day.1 The Emissions Impact of Oran’s Waste Management Strategy To determine the greenhouse gas emissions reduction achieved by Oran’s waste sorting and recycling program, we multiplied the composition of Oran’s municipal solid waste1 to the volume of waste measured by the case study, to determine the total amount of recycled materials removed from the waste stream. We then multiplied the emissions factors for the removal of these materials2 by the previously calculated amount of recycled materials recovered by the R20 program, to determine the mitigation impact of these efforts. Scaling Oran’s Emissions Impact to the National Level To determine the impact this project would have if scaled to the national level, we applied the per capita greenhouse gas emissions reduction from Oran’s waste sorting program to the 32 administrative areas (Wilayas) containing over 500,000 residents3. Compared to the nation’s business as usual emissions, which were determined by applying a linear projection to historical emissions data4, the expansion of Oran’s waste sorting program could lower national 2020 emissions by 11 million tons of carbon dioxide, or roughly 4.3 percent, from 254 million tons to 243 million tons (see Supplementary Figure 1). Between 2015 and 2020, the policy could reduce the country’s carbon dioxide emissions by a cumulative total of 52 million tons. Assumptions:
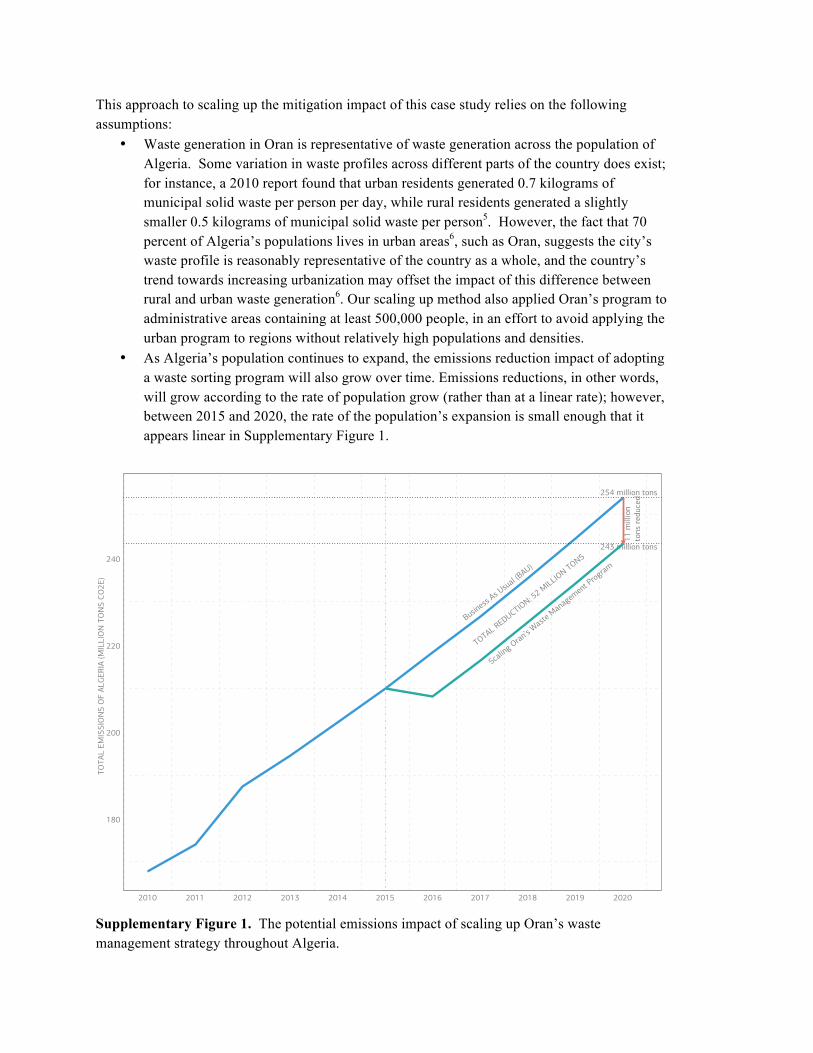
This approach to scaling up the mitigation impact of this case study relies on the following assumptions:
• Waste generation in Oran is representative of waste generation across the population of Algeria. Some variation in waste profiles across different parts of the country does exist; for instance, a 2010 report found that urban residents generated 0.7 kilograms of municipal solid waste per person per day, while rural residents generated a slightly smaller 0.5 kilograms of municipal solid waste per person5. However, the fact that 70 percent of Algeria’s populations lives in urban areas6, such as Oran, suggests the city’s waste profile is reasonably representative of the country as a whole, and the country’s trend towards increasing urbanization may offset the impact of this difference between rural and urban waste generation6. Our scaling up method also applied Oran’s program to administrative areas containing at least 500,000 people, in an effort to avoid applying the urban program to regions without relatively high populations and densities.
• As Algeria’s population continues to expand, the emissions reduction impact of adopting a waste sorting program will also grow over time. Emissions reductions, in other words, will grow according to the rate of population grow (rather than at a linear rate); however, between 2015 and 2020, the rate of the population’s expansion is small enough that it appears linear in Supplementary Figure 1.
Supplementary Figure 1. The potential emissions impact of scaling up Oran’s waste management strategy throughout Algeria.
Busines
s As U
sual (B
AU)
Scaling Oran’s
Waste
Mana
gemen
t Program
243 million tons
254 million tons
11 m
illio
n to
ns re
duce
dTOTAL REDUCTION: 5
2 MILLION TONS
180
200
220
240
2010 2011 2012 2013 2014 2015 2016 2017 2018 2019 2020
TOTA
L EM
ISSI
ON
S O
F AL
GERI
A (M
ILLI
ON
TO
NS
CO2E
)
Case Study 2: Acre, Brazil Case Study Description The Amazonian state of Acre, Brazil, has adopted Brazil’s national deforestation target at the state level. By adopting Brazil’s national deforestation target, Acre committed to reducing deforestation rates 80 percent by 2020, compared to the state’s average deforestation rate between 1996 and 20057. Meeting this target means limiting deforestation to an annual loss of 120 square kilometers by 2020 (compared to a baseline loss of approximately 602 square kilometers per year)7. In 2013, Acre had achieved 63 percent of this deforestation reduction goal8, in large part due to the Acre’s State System of Incentives for Environmental Services (or SISA), a groundbreaking law passed in 2010 to combat deforestation and promote sustainable forest management. Acre continues to be one of the leading states in reducing deforestation in Brazil9. Brazil’s Projected Rate of Deforestation To determine how Acre’s conservation policies might translate to the national context, we applied the reduction Acre has achieved in its rate of deforestation in the Amazon9 to Brazil’s national deforestation rates. These calculations apply Acre’s progress in slowing its deforestation rate to all of Brazil’s forested areas, rather than just to the Amazon specifically. It is important to note that this method assumes a consistent forest composition across the country, although the carbon storage and greenhouse gas savings realized by protecting other forests, such as the Cerrado forest, may vary. The nation’s business as usual (BAU) rate of deforestation, was calculated as the average of deforestation rates9 between 2010 and 2014. While Brazil’s target of reducing deforestation in the Amazon by 80 percent by 2020 sets 1996 through 2005 as its baseline or reference level10, we calculated the impact of reducing deforestation against a more recent target, because deforestation in the Brazilian Amazon has slowed significantly since 20038. Supplementary Figure 2 demonstrates the difference between the two baselines. Applying Acre’s reduction of deforestation across Brazil as a whole would lower the country’s 2020 emissions by 368 million tons of carbon dioxide equivalent, compared to the reductions that would be achieved at the nation’s baseline rate of deforestation reduction (between 1996 and 2005). The national application of Acre’s strategy to Brazil would lower emissions by 204 million tons of carbon dioxide equivalent, compared to the deforestation reductions Brazil has maintained over the last five years (2010-2014, inclusive of 2010).
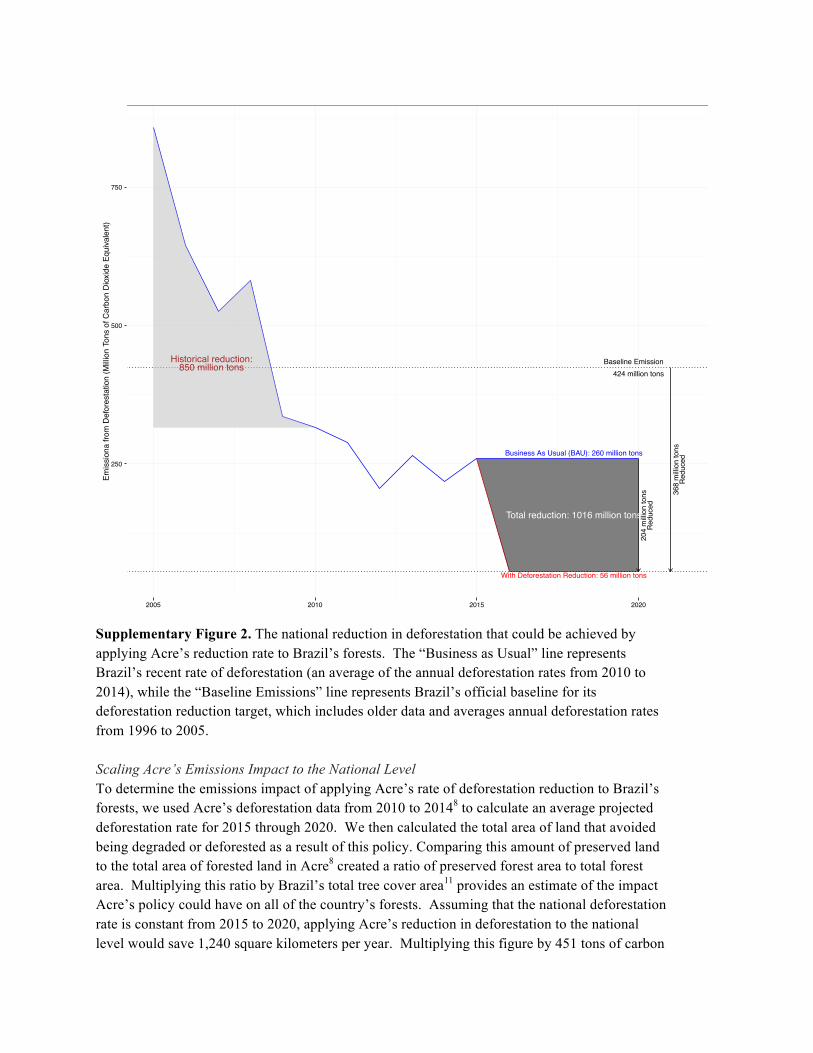
Supplementary Figure 2. The national reduction in deforestation that could be achieved by applying Acre’s reduction rate to Brazil’s forests. The “Business as Usual” line represents Brazil’s recent rate of deforestation (an average of the annual deforestation rates from 2010 to 2014), while the “Baseline Emissions” line represents Brazil’s official baseline for its deforestation reduction target, which includes older data and averages annual deforestation rates from 1996 to 2005. Scaling Acre’s Emissions Impact to the National Level To determine the emissions impact of applying Acre’s rate of deforestation reduction to Brazil’s forests, we used Acre’s deforestation data from 2010 to 20148 to calculate an average projected deforestation rate for 2015 through 2020. We then calculated the total area of land that avoided being degraded or deforested as a result of this policy. Comparing this amount of preserved land to the total area of forested land in Acre8 created a ratio of preserved forest area to total forest area. Multiplying this ratio by Brazil’s total tree cover area11 provides an estimate of the impact Acre’s policy could have on all of the country’s forests. Assuming that the national deforestation rate is constant from 2015 to 2020, applying Acre’s reduction in deforestation to the national level would save 1,240 square kilometers per year. Multiplying this figure by 451 tons of carbon
424 million tonsBaseline Emission
Business As Usual (BAU): 260 million tons
With Deforestation Reduction: 56 million tons
Total reduction: 1016 million tons
204
milli
on to
nsR
educ
ed
368
milli
on to
nsR
educ
ed
Historical reduction:850 million tons
250
500
750
2005 2010 2015 2020
Emis
sion
a fro
m D
efor
esta
tion
(Milli
on T
ons
of C
arbo
n D
ioxi
de E
quiva
lent
)

dioxide equivalent per hectare, the conversion factor used by the Government of Acre12, yields the emissions impact of adopting Acre’s policy at a national level. Applying Acre’s deforestation reduction rate across all of Brazil’s forested areas would lower its 2020 emissions by 0.204 gigatons of carbon dioxide equivalent, compared to the deforestation reductions Brazil has maintained over the last four years (See Supplementary Figure 3).
Supplementary Figure 3. The potential emissions impact of scaling up Acre’s deforestation reduction policy throughout Brazil. Case Study 3: Belo Horizonte, Brazil Case Study Description Belo Horizonte has pioneered an innovative waste management solution, in particular through its 1993 Integrated Solid Waste Management Model and its 2012 Municipal Urban Cleansing Law, which aimed to increase efficiency in waste collection and recycling, promote social inclusion, create jobs and generate income for city workers13. Perhaps the most impactful example of this strategy is the creation of a biogas plant at the city’s Municipal Waste Treatment Centre (or
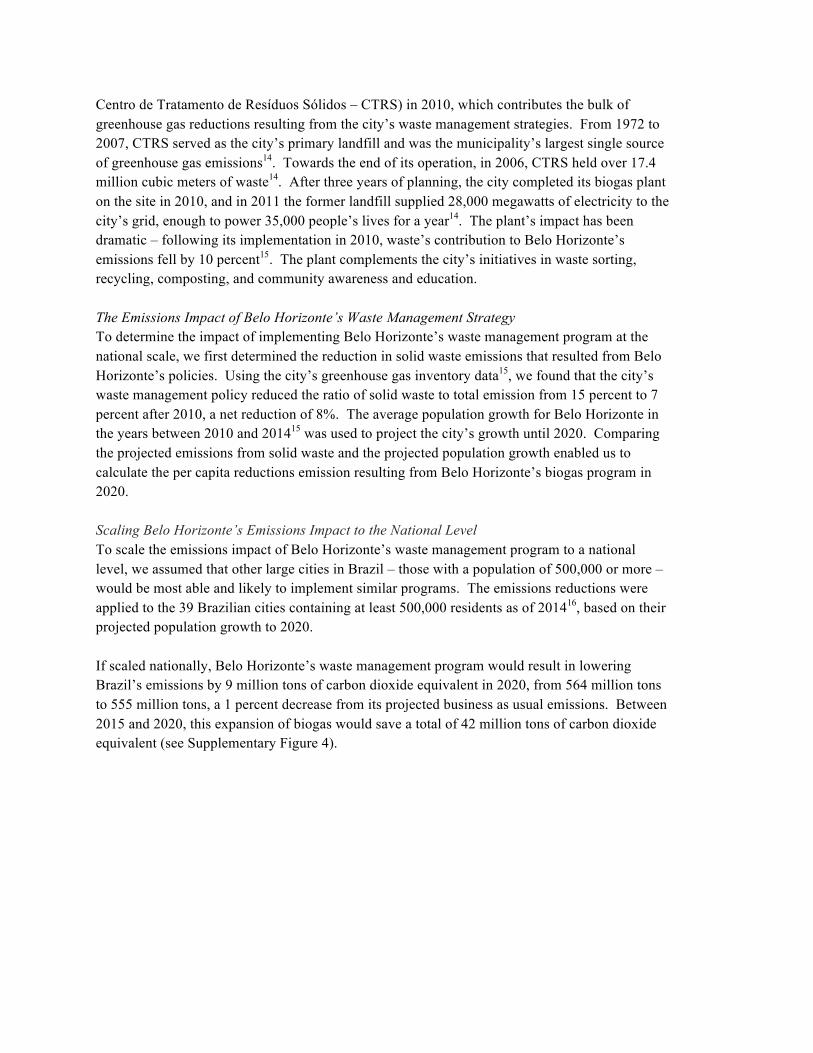
Centro de Tratamento de Resíduos Sólidos – CTRS) in 2010, which contributes the bulk of greenhouse gas reductions resulting from the city’s waste management strategies. From 1972 to 2007, CTRS served as the city’s primary landfill and was the municipality’s largest single source of greenhouse gas emissions14. Towards the end of its operation, in 2006, CTRS held over 17.4 million cubic meters of waste14. After three years of planning, the city completed its biogas plant on the site in 2010, and in 2011 the former landfill supplied 28,000 megawatts of electricity to the city’s grid, enough to power 35,000 people’s lives for a year14. The plant’s impact has been dramatic – following its implementation in 2010, waste’s contribution to Belo Horizonte’s emissions fell by 10 percent15. The plant complements the city’s initiatives in waste sorting, recycling, composting, and community awareness and education. The Emissions Impact of Belo Horizonte’s Waste Management Strategy To determine the impact of implementing Belo Horizonte’s waste management program at the national scale, we first determined the reduction in solid waste emissions that resulted from Belo Horizonte’s policies. Using the city’s greenhouse gas inventory data15, we found that the city’s waste management policy reduced the ratio of solid waste to total emission from 15 percent to 7 percent after 2010, a net reduction of 8%. The average population growth for Belo Horizonte in the years between 2010 and 201415 was used to project the city’s growth until 2020. Comparing the projected emissions from solid waste and the projected population growth enabled us to calculate the per capita reductions emission resulting from Belo Horizonte’s biogas program in 2020. Scaling Belo Horizonte’s Emissions Impact to the National Level To scale the emissions impact of Belo Horizonte’s waste management program to a national level, we assumed that other large cities in Brazil – those with a population of 500,000 or more – would be most able and likely to implement similar programs. The emissions reductions were applied to the 39 Brazilian cities containing at least 500,000 residents as of 201416, based on their projected population growth to 2020. If scaled nationally, Belo Horizonte’s waste management program would result in lowering Brazil’s emissions by 9 million tons of carbon dioxide equivalent in 2020, from 564 million tons to 555 million tons, a 1 percent decrease from its projected business as usual emissions. Between 2015 and 2020, this expansion of biogas would save a total of 42 million tons of carbon dioxide equivalent (see Supplementary Figure 4).
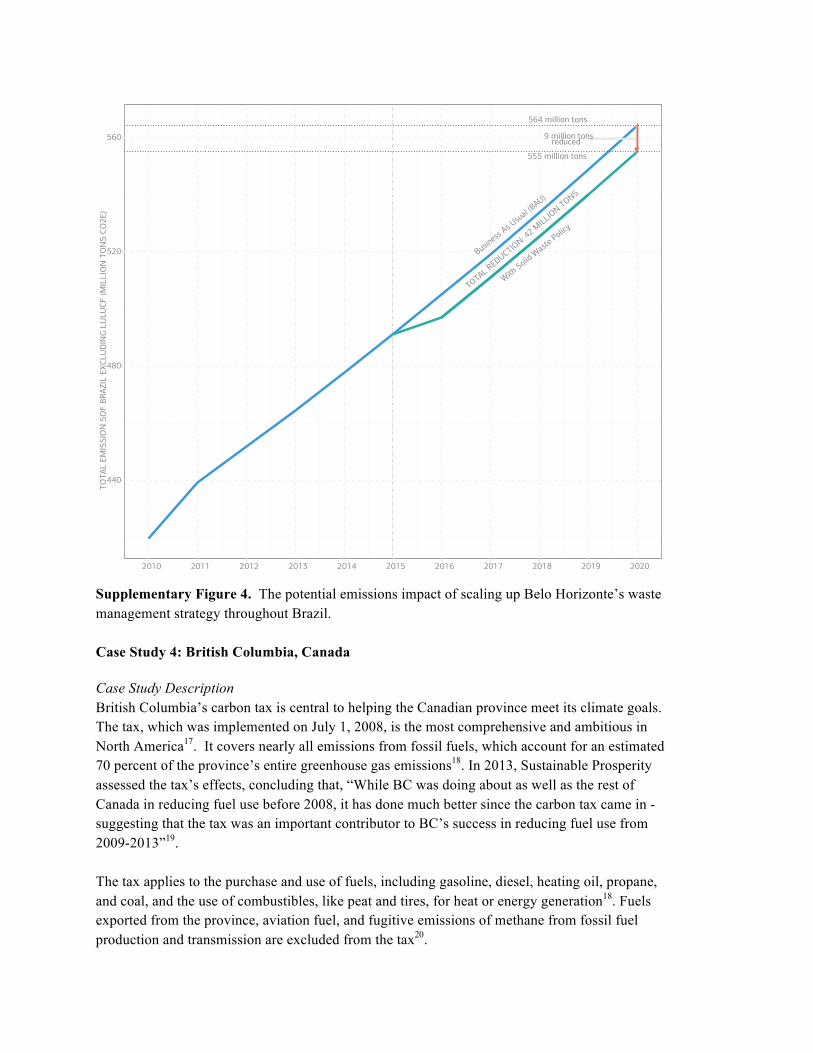
Supplementary Figure 4. The potential emissions impact of scaling up Belo Horizonte’s waste management strategy throughout Brazil. Case Study 4: British Columbia, Canada Case Study Description British Columbia’s carbon tax is central to helping the Canadian province meet its climate goals. The tax, which was implemented on July 1, 2008, is the most comprehensive and ambitious in North America17. It covers nearly all emissions from fossil fuels, which account for an estimated 70 percent of the province’s entire greenhouse gas emissions18. In 2013, Sustainable Prosperity assessed the tax’s effects, concluding that, “While BC was doing about as well as the rest of Canada in reducing fuel use before 2008, it has done much better since the carbon tax came in - suggesting that the tax was an important contributor to BC’s success in reducing fuel use from 2009-2013”19. The tax applies to the purchase and use of fuels, including gasoline, diesel, heating oil, propane, and coal, and the use of combustibles, like peat and tires, for heat or energy generation18. Fuels exported from the province, aviation fuel, and fugitive emissions of methane from fossil fuel production and transmission are excluded from the tax20.
Busine
ss As U
sual (B
AU)
With Solid
Waste Policy
564 million tons
555 million tons
9 million tonsreduced
TOTAL REDUCTION: 4
2 MILL
ION TONS
440
480
520
560
2010 2011 2012 2013 2014 2015 2016 2017 2018 2019 2020
TOTA
L EM
ISSI
ON
SO
F BR
AZIL
EXC
LUD
ING
LULU
CF (M
ILLI
ON
TO
NS
CO2E
)
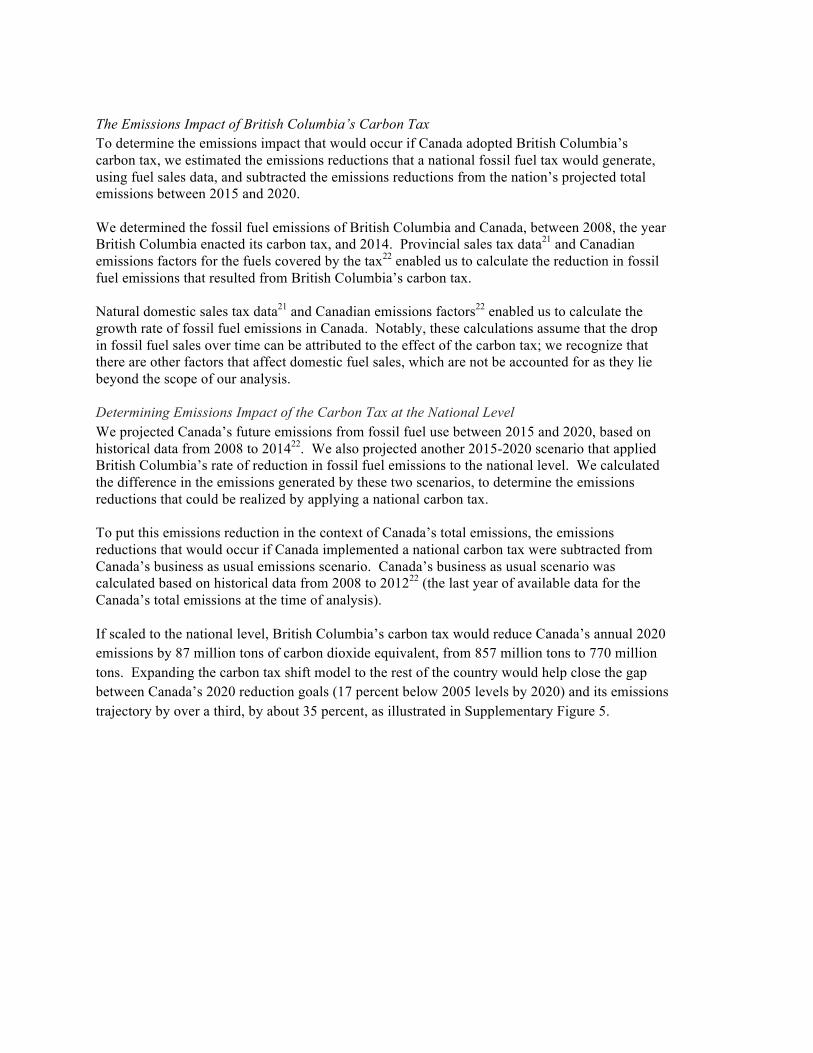
The Emissions Impact of British Columbia’s Carbon Tax To determine the emissions impact that would occur if Canada adopted British Columbia’s carbon tax, we estimated the emissions reductions that a national fossil fuel tax would generate, using fuel sales data, and subtracted the emissions reductions from the nation’s projected total emissions between 2015 and 2020. We determined the fossil fuel emissions of British Columbia and Canada, between 2008, the year British Columbia enacted its carbon tax, and 2014. Provincial sales tax data21 and Canadian emissions factors for the fuels covered by the tax22 enabled us to calculate the reduction in fossil fuel emissions that resulted from British Columbia’s carbon tax. Natural domestic sales tax data21 and Canadian emissions factors22 enabled us to calculate the growth rate of fossil fuel emissions in Canada. Notably, these calculations assume that the drop in fossil fuel sales over time can be attributed to the effect of the carbon tax; we recognize that there are other factors that affect domestic fuel sales, which are not be accounted for as they lie beyond the scope of our analysis. Determining Emissions Impact of the Carbon Tax at the National Level We projected Canada’s future emissions from fossil fuel use between 2015 and 2020, based on historical data from 2008 to 201422. We also projected another 2015-2020 scenario that applied British Columbia’s rate of reduction in fossil fuel emissions to the national level. We calculated the difference in the emissions generated by these two scenarios, to determine the emissions reductions that could be realized by applying a national carbon tax. To put this emissions reduction in the context of Canada’s total emissions, the emissions reductions that would occur if Canada implemented a national carbon tax were subtracted from Canada’s business as usual emissions scenario. Canada’s business as usual scenario was calculated based on historical data from 2008 to 201222 (the last year of available data for the Canada’s total emissions at the time of analysis). If scaled to the national level, British Columbia’s carbon tax would reduce Canada’s annual 2020 emissions by 87 million tons of carbon dioxide equivalent, from 857 million tons to 770 million tons. Expanding the carbon tax shift model to the rest of the country would help close the gap between Canada’s 2020 reduction goals (17 percent below 2005 levels by 2020) and its emissions trajectory by over a third, by about 35 percent, as illustrated in Supplementary Figure 5.

Supplementary Figure 5. The potential emissions impact of scaling up British Columbia’s carbon tax across Canada. Case Study 5: Shenzhen, China Case Study Description The 12th Five-Year Plan (2011-2015) – China’s primary national, social and economic development roadmap – established a pilot Emission Trading Scheme (ETS) to reduce greenhouse gases in a cost-effective way. On October 29, 2011, the National Development and Reform Commission (NRDC), China’s main policy implementing body, selected five cities and two provinces – Shenzhen, Beijing, Shanghai, Chongqing, Hubei, Tianjin and Guangdong – as initial pilots to test emissions trading in China. Among these cities, Shenzhen stands out as a pioneer of greenhouse gas emission reduction. Its ETS covers 635 industrial enterprises from 26 sectors, accounting for 30 million tons of annual carbon dioxide emissions, which are traded in this system23. In 2010, Shenzhen’s ETS encompassed 40 percent of the city’s total emissions and 26 percent of Shenzhen’s GDP. In its first year of implementation, Shenzhen’s pilot ETS achieved its emission reduction target of 25
Business
As Usual (B
AU)
With Carbon Tax Policy
857 million tons
770 million tons
87 m
illio
n to
nsre
duce
d
Total Reduction:265 million tons
611 million tonsCanada 2020's Emission Target
159
mill
ion
tons
Nee
ded
~ 35
% o
f Ta
rget
Total Reduction Needed:470 million tons
National Climate Mitigation Target
600
700
800
2010 2011 2012 2013 2014 2015 2016 2017 2018 2019 2020
TOTA
L EM
ISSI
ON
S O
F CA
NAD
A (M
ILLI
ON
TO
NN
ES C
O2E
)

percent, and 631 of the 635 participating companies fulfilled their emissions reduction obligation23. The program’s 635 participants’ total carbon emissions decreased by 3.83 million tons (11.7 percent) and participating companies increased their market value by 105.1 billion Yuan (42.6 percent) from 2010 to 2013, indicating a decoupling of profits and emissions. These companies’ average carbon intensity dropped 38.1 percent, even more than Shenzhen’s overall carbon emission reduction rate of 33.5 percent. Companies participating in the ETS aim for an intensity reduction target that is more ambitious than Shenzhen’s citywide plan, which, in turn, goes beyond the national goal China spelled out in its 12th Five-Year Plan (See Supplementary Table 1). The ETS helped Shenzhen achieve its 21 percent carbon intensity reduction targets under the 12th Five-Year Plan ahead of schedule (See Supplementary Table 1). Supplementary Table 1. Relationship of Shenzhen’s ETS to Shenzhen’s National Carbon and Energy Targets. Data from Annual report on Shenzhen emissions trading scheme first-year operation: Compliance period I (2013-2014)23.
Baseline year
Number of enterprises covered by Shenzhen Emission Trading Scheme
Percentage of total city emission
covered by Shenzhen Emission Trading Scheme
China’s energy intensity target (compared to 2010 levels)
China carbon intensity target (compared to
2010 emissions)
Shenzhen’s energy intensity target
(compared to 2010 levels)
Shenzhen’s carbon intensity
target (compared to 2010 emissions)
2009-2011 832 40% -17% -16% -19.5% -21%
China’s Projected Emissions Determining the impact of the adoption of Shenzhen’s emissions trading scheme (ETS) on the national level depends on the expected growth of China’s carbon emissions. Supplementary Table 2 and Supplementary Figure 6 summarize different estimates of the ways China’s emissions are expected to grow by 2020 and 2030, in terms of both the country’s total carbon emissions and its average annual carbon emission growth rate. These projections are based on the country’s 2010 emissions data24,25. Supplementary Table 2. China’s projected carbon emissions in 2020 and 2030
Business-As-Usual (BAU) Projected Carbon Emissions
Year Projected Emissions (Green
&Stern, 2015)
Projected Emissions (Climate
Action Tracker)
Annual Emission Growth Rate (Green
& Stern, 2015)
Annual Emissions Growth Rate (Climate
Action Tracker)
2020 12.6 - 13.5 Gt 12.2 - 12.6 Gt 2.97 - 3.69% 2.64 - 2.97%

2030 13.8 - 16.5 Gt 13.8 - 14.4 Gt 1.94 - 2.85% 1.94 - 2.1 %
*China’s actual 2012 carbon emissions were 9.4Gt.24
Supplementary Figure 6. China’s projected carbon emissions in 2020 and 2030. The boxes represent the range of China’s projected emissions, according to averaged estimates from two sources24,25. The solid black line represents the projected median level of emissions, while the red dot represents the projected mean level of emissions in 2020 and 2030. Assumptions Scaling the mitigation potential of Shenzhen’s ETS to the national level rests on several key assumptions:
● China’s ETS will cover roughly the same proportion (40 percent23) of carbon emissions as Shenzhen’s ETS;
● China’s national ETS participants will have the same reduction rate (11.7 percent23) as Shenzhen’s compliant companies had in 2013.
Business
As Usual (B
AU)
Business
As Usual (B
AU)
Business
As Usual (B
AU)
Business
As Usual (B
AU)
Business
As Usual (B
AU)
Business
As Usual (B
AU)
Business
As Usual (B
AU)
Business
As Usual (B
AU)
12.7275
14.6225
12
13
14
15
16
2020 2030
Tota
l Pro
ject
ed E
mis
sion
s of
Chi
na (G
t of C
arbo
n D
ioxi
de)
Projected Year
2020
2030

● In 2013, Shenzhen’s ETS cut the city’s total carbon emissions by 4.68 percent23. China will establish its national ETS in 2016 or 201726, so carbon emission reductions can only occur at the national level from 2016 onwards.
● A “Business-As-Usual” (BAU) scenario of China’s total emissions was calculated by averaging two estimates of China’s future emissions (these estimates came from the New Normal Report24, and Climate Action Tracker25).
Potential Pathways for Scaling Shenzhen’s Emissions Impact to the National Level While China’s government has decided to expand an ETS to the national level, how it will nationalize it remains unclear. There are two potential pathways:
1. China could connect the emissions markets of the seven pilot cities first, then expand it to all cities or provinces gradually; or,
2. China could build an emissions trading market in all mega-cities (i.e., cities with a population greater than 10 million), and allow the markets to trade between each other.
Both pathways anticipate that the government will apply the ETS to urban areas. The emission per capita and population growth rates will likely be similar across these areas, so the impact of adopting the ETS on the national level emission could be determined by scaling its impact up in terms of population. Assuming that all seven pilot cities’ ETS would cover the same proportion of total emissions as Shenzhen’s ETS, their annual emissions impact would reach 0.17 gigatons (17 million tons) by 2020. In 2010, China contained 45 cities that had a population greater than one million27. If the national ETS covered these 45 mega city areas, in addition to the seven pilot ETS cities, the annual emission reduction would be 0.25 gigatons by 2020 (as illustrated in Supplementary Figure 7). Between 2016 and 2020, this approach would reduce a total of 0.86 gigatons of carbon dioxide.
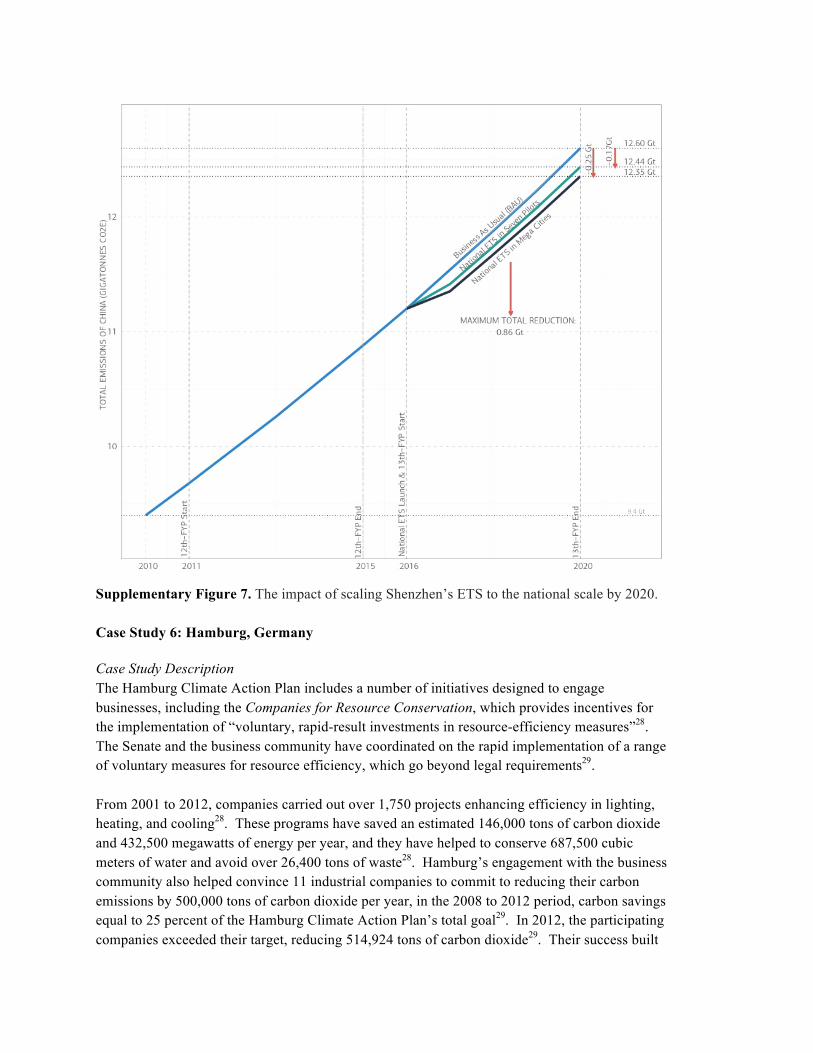
Supplementary Figure 7. The impact of scaling Shenzhen’s ETS to the national scale by 2020. Case Study 6: Hamburg, Germany Case Study Description The Hamburg Climate Action Plan includes a number of initiatives designed to engage businesses, including the Companies for Resource Conservation, which provides incentives for the implementation of “voluntary, rapid-result investments in resource-efficiency measures”28. The Senate and the business community have coordinated on the rapid implementation of a range of voluntary measures for resource efficiency, which go beyond legal requirements29. From 2001 to 2012, companies carried out over 1,750 projects enhancing efficiency in lighting, heating, and cooling28. These programs have saved an estimated 146,000 tons of carbon dioxide and 432,500 megawatts of energy per year, and they have helped to conserve 687,500 cubic meters of water and avoid over 26,400 tons of waste28. Hamburg’s engagement with the business community also helped convince 11 industrial companies to commit to reducing their carbon emissions by 500,000 tons of carbon dioxide per year, in the 2008 to 2012 period, carbon savings equal to 25 percent of the Hamburg Climate Action Plan’s total goal29. In 2012, the participating companies exceeded their target, reducing 514,924 tons of carbon dioxide29. Their success built
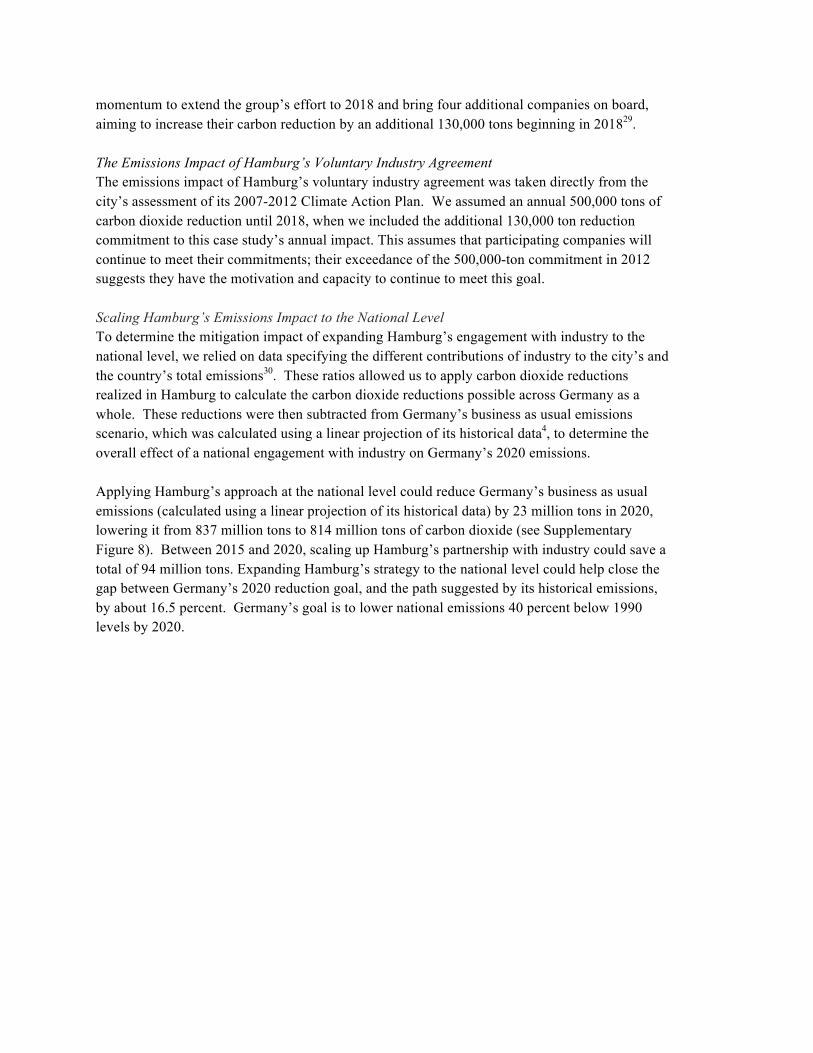
momentum to extend the group’s effort to 2018 and bring four additional companies on board, aiming to increase their carbon reduction by an additional 130,000 tons beginning in 201829. The Emissions Impact of Hamburg’s Voluntary Industry Agreement The emissions impact of Hamburg’s voluntary industry agreement was taken directly from the city’s assessment of its 2007-2012 Climate Action Plan. We assumed an annual 500,000 tons of carbon dioxide reduction until 2018, when we included the additional 130,000 ton reduction commitment to this case study’s annual impact. This assumes that participating companies will continue to meet their commitments; their exceedance of the 500,000-ton commitment in 2012 suggests they have the motivation and capacity to continue to meet this goal. Scaling Hamburg’s Emissions Impact to the National Level To determine the mitigation impact of expanding Hamburg’s engagement with industry to the national level, we relied on data specifying the different contributions of industry to the city’s and the country’s total emissions30. These ratios allowed us to apply carbon dioxide reductions realized in Hamburg to calculate the carbon dioxide reductions possible across Germany as a whole. These reductions were then subtracted from Germany’s business as usual emissions scenario, which was calculated using a linear projection of its historical data4, to determine the overall effect of a national engagement with industry on Germany’s 2020 emissions. Applying Hamburg’s approach at the national level could reduce Germany’s business as usual emissions (calculated using a linear projection of its historical data) by 23 million tons in 2020, lowering it from 837 million tons to 814 million tons of carbon dioxide (see Supplementary Figure 8). Between 2015 and 2020, scaling up Hamburg’s partnership with industry could save a total of 94 million tons. Expanding Hamburg’s strategy to the national level could help close the gap between Germany’s 2020 reduction goal, and the path suggested by its historical emissions, by about 16.5 percent. Germany’s goal is to lower national emissions 40 percent below 1990 levels by 2020.
Supplementary Figure 8. The potential emissions impact of scaling up Hamburg’s engagement with industry throughout Germany. Case Study 7: Rajasthan, India Case Study Description Rajasthan recently edged past Gujarat to take the lead in installed solar capacity among Indian states, with 1128 megawatts compared to Gujarat’s 953 megawatts.31 Ambitious policies have helped the state capitalize on its high solar radiation and large tracts of available land.31 Before Prime Minister Modi expanded India’s solar capacity target to 100 gigawatts, Rajasthan’s 2011 solar power goal exceeded it, aiming to reach 25 gigawatts of new solar capacity by 2022, in comparison to the national government’s goal of 22 gigawatts in the same time frame32. Rajasthan’s 2014 policy builds on the momentum of both the state’s 2011 energy plan and the Jawaharlal Nehru National Solar Mission’s recently enhanced ambition. The Rajasthan Solar Energy Policy for 2014 targets known obstacles in financing and land acquisition: it introduces lowered net worth requirements for prospective project developers, lengthens land leases from 30 to 40 years to allow developers to plan for longer-term investments, and eases the application process for plants under 10 megawatts to facilitate faster approval32.
Business As Usual (BAU)
With Industry Emissions Reduction
National Climate M
itigation Target
698 million tons
814 million tons
837 million tons
23m
illio
n to
nsre
duce
d
116
mill
ion
tons
redu
ced
Total Reduction Needed:
321 million tons
Total reduction:94 million tons
700
750
800
850
900
950
2010 2011 2012 2013 2014 2015 2016 2017 2018 2019 2020
TOTA
L EM
ISSI
ON
S O
F GE
RMAN
Y (M
ILLI
ON
TO
NS
CO2E
)
The Emissions Impact of Rajasthan’s Solar Implementation Leadership To determine the emissions impact of Rajasthan’s solar implementation in 2020, we projected its current rate of growth in its solar capacity based on its growth rate over 2012 through 201433, and used emissions factor from India’s Central Electricity Authority’s CO2 Baseline Database (which was based on data from 2009 through 2014)34 to determine the emissions impact of this continued expansion of solar power. Scaling Rajasthan’s Emissions Impact to the National Level To calculate the impact of scaling Rajasthan’s solar policies to the national level, we applied the growth rate Rajasthan has demonstrated in its expansion of solar energy (between 2012 through 2014) to India’s other states, during 2015 to 202033. This approach accounts for explicitly state-supported solar projects, as well as projects that have spearheaded by the private sector, but, we assume, have also been facilitated by Rajasthan’s work to eliminate obstacles in financing and acquiring land for solar utilities. Rajasthan’s high rate of solar capacity also depends on factors, such as its availability of large tracts of land and high solar potential, which other states might not share. To account for this disparity between the solar potentials of different parts of the country, we used the rate of Rajasthan’s solar installation (rather than the net amount of solar capacity it has installed) to scale its policies to the national level. An emissions factor from India’s Central Electricity Authority’s CO2 Baseline Database (which was based on data from 2009 through 2014)34 translated the impact of renewable energy into the resulting reduction of carbon dioxide emissions. As Supplementary Figure 9 illustrates, if Rajasthan’s solar policies were to be applied across India, the country’s 2020 emissions would fall by 202 million tons of carbon dioxide, from 3.321 gigatons to 3.119 gigatons, compared to its projected business as usual emissions. In total, adopting this rate of solar energy expansion would reduce 0.398 gigatons of carbon dioxide between 2015 and 2020, an amount equal to approximately 19 percent of India’s total carbon dioxide emissions in 2012, as Supplementary Figure 9 illustrates. We do not include India’s goal of generating 176 gigawatts of electricity from renewable energy sources and 100 gigawatts of electricity from solar energy by 202235 into India’s projected 2020 emissions, due to the extremely challenging nature of this target. As of January 2015, 3 gigawatts of solar utility capacity had been installed, and 285 megawatts of rooftop solar capacity had been installed36. India will need to add an average of approximately 15 gigawatts of solar power to its current base of 4 gigawatts each year to meet its 100-gigawatt goal by 2022.

Supplementary Figure 9. The potential emissions impact of scaling up Rajasthan’s rate of solar installation across India. Case Study 8: Kuyasa, South Africa Case Study Description Among Cape Town’s renewable energy and energy efficiency programs, the pioneering Kuyasa Project stands out for its rigorous monitoring, engagement of stakeholders, and melding of energy access and climate mitigation needs. From 1999 to 2010, the project retrofitted 2,309 low-income homes with solar water heaters, insulated ceilings, and energy efficient lighting, saving energy and electricity while reducing carbon emissions37. The program also generated co-benefits in terms of public health; savings from reduced fuel costs; and economic opportunities arising from job creation and training38. The Kuyasa Project is South Africa’s first internationally registered Clean Development Mechanism (CDM) venture, meaning that industrial firms can purchase some of the project’s annually reduced carbon emissions to help them meet their Kyoto Protocol targets. The Emissions Impact of the Kuyasa’s Energy Efficiency Program
Busine
ss As U
sual
(BAU)
With Sola
r Ene
rgy Poli
cy
3.119 Gt
3.321 Gt
0.20
2 Gt
redu
ced
TOTAL REDUCTION:0.398 Gt
2.0
2.5
3.0
2010 2011 2012 2013 2014 2015 2016 2017 2018 2019 2020
TOTA
L EM
ISSI
ON
S O
F IN
DIA
(GIG
ATO
NN
ES C
O2E
)

In total, the Kuyasa energy efficiency project reduced emissions by 2.80 tons per household, an amount calculated using a suppressed demand calculation methodology, and specifically, the Indicative Simplified Baseline and Monitoring methodologies for selected small-scale Clean Development Mechanism project activity categories38. The suppressed demand calculation methodology determines the emissions impact of energy services in an area where income or infrastructure limits energy access. This approach assumes that the baseline for a project’s energy use should “reflect the technology and/or service levels that would be required if suppressed demand did not exist, rather than the technology currently in use by poor households”38. In other words, suppressed demand calculations compare the emissions impact of new projects to the energy use and emissions that would occur if residents had access to traditional sources of energy. Without this assumption, projects that expand energy access could often be found to create a net increase in overall energy consumption. Scaling Kuyasa’s Emissions Impact to the National Level To determine the impact of expanding the Kuyasa Project to the national level, we applied the household reduction in emissions to South Africa’s entire low-income population. Assessments of the Kuyasa Project determined that energy “demand would be suppressed similarly in other communities in South Africa with a similar socio-economic status”38, making the application of the suppressed demand calculation appropriate. The City of Cape Town defines the poverty line in terms of an income of less than 3,500 Rand per month, a number that includes about 35.7% of the city’s population39. This translates into a yearly income of 42,000 Rand, a total that approximately corresponds to the first three quintiles used by the South African census to classify population based on income. Specifically, these quintiles account for citizens with yearly incomes of or below 43,897.15 Rand (Quintile 3)40. Based on these numbers, the GHG reductions per capita can be scaled up to the first three quintiles of South Africa’s national population. Scaling this program up to all of South Africa’s low-income households could result in a net reduction of 148 million tons of carbon dioxide between 2015 and 2020. This approach could lower South Africa’s 2020 emissions by 35 million tons, from 473 million tons to 438 million tons of carbon dioxide. It lowers the gap between the country’s 2020 goal, of reducing its scenario 34 percent below a business as usual scenario by 2020, and its current pathway, by approximately 22 percent (see Supplementary Figure 10). This contextualization uses South Africa’s historical emissions4 to project its business as usual scenario.

Supplementary Figure 10. The potential emissions impact of scaling up Kuyasa’s energy efficiency policy across South Africa. Case Study 9: California, United States of America Case Study Description The Advanced Clean Cars Program forms one prong of California’s ambitious climate mitigation agenda. The state’s vehicle emission standards for smog, soot-causing pollutants, and greenhouse gas emissions in a balanced set of requirements, known as Low Emission Vehicles (LEV) III41 for model years 2017-2025. These standards align with national emissions standards that, in turn, resulted from the federal government’s adoption of California’s Pavley standards in 2012. The Advanced Clean Cars program also encompasses the Zero-Emission Vehicle Program, which aims to support and accelerate the numbers of plug-in hybrids and zero-emission vehicles in California, and to usher in 1.5 million plug-in hybrids, electric vehicles, and hydrogen-powered fuel cell vehicles (equal to 1 in 7 cars sold in the state) by 202542. The policy is projected to cut California’s emissions by approximately 3 million metric tons of carbon dioxide equivalent in 2020, and reduce more than 850 million metric tons of carbon dioxide equivalent from 2017 – 2050, nearly double California’s total annual greenhouse gas emissions in 199043.
Business As Usual (BAU)
With Energy Efficiency Policy
473 million tons
438 million tons
35 m
illio
n to
nsre
duce
d
TOTAL REDUCED:148 MILLION TONS
312 million tons
~ 22
%12
5.8
mill
ion
tons
Red
uctio
n N
eede
d
250
300
350
400
450
500
2010 2011 2012 2013 2014 2015 2016 2017 2018 2019 2020
TOTA
L EM
ISSI
ON
S O
F SO
UTH
AFR
ICA
(MIL
LIO
N T
ON
S CO
2E)

Scaling up California’s Advanced Clean Cars Program To determine the emissions impact that would occur if California’s entire Advanced Clean Cars Program were to be scaled nationally, we first calculated the average baseline carbon dioxide emissions that passenger vehicles, light trucks, and combined light-duty vehicles would emit in the absence of the Advanced Clean Cars Program, using data from California Environmental Protection Agency (CalEPA)44. This yielded an average protected baseline of 341 grams of carbon dioxide emitted per mile traveled by the vehicle. We then determined the average projected 2020 emissions from these vehicle classes if the Advanced Clean Car Program were to be implemented, again using projections from CalEPA to arrive at a total of 211 grams of carbon dioxide emitted per mile traveled by the vehicle. Both of these numbers – the projected baseline emissions, and the projected emissions if the Advanced Clean Cars program were in place – were multiplied by 0.68 (the ratio of cars covered by the Advanced Clean Cars program (passenger cars, light-duty trucks and medium-duty trucks to the total number of cars on the road45) and by the projected annual number of vehicle miles traveled in the US in 2020 (3.5332 x 10¹² miles) according to projections based on United States Department of Transportation data46. The emissions produced under the Advanced Clean Cars Program were subtracted from the baseline emissions, and yielded a total of 289, 110,142 metric tons of carbon dioxide. This reduction was subtracted from the business-as-usual (BAU) carbon dioxide emissions for the United States in 2020. The BAU emissions were calculated through a linear projection of historic carbon dioxide emissions from energy and industry, provided by the U.S. Energy Information Administration47. Since the United States BAU projection includes California’s AB 32 legislation, which encompasses the Advanced Clean Cars Program, in its calculations, we projected the BAU using historic data, rather than using the United State’s official estimates of this target, to avoid accounting for the impact of the Advanced Clean Car Program twice. Since the emissions factors of the Advanced Clean Cars Program relate to carbon dioxide, and not to carbon dioxide equivalent, we limited this case study to carbon dioxide emissions, which also contributes to the difference between the BAU used in this case study and the BAU target estimates adopted by United States agencies (6.1 gigatons of carbon dioxide equivalent in 2020, according to projections based on the U.S. Environmental Protection Agency’s data, and 5.9 gigatons of carbon dioxide equivalent in 2020, according to projections based on the U.S. Energy Information Administration)47.
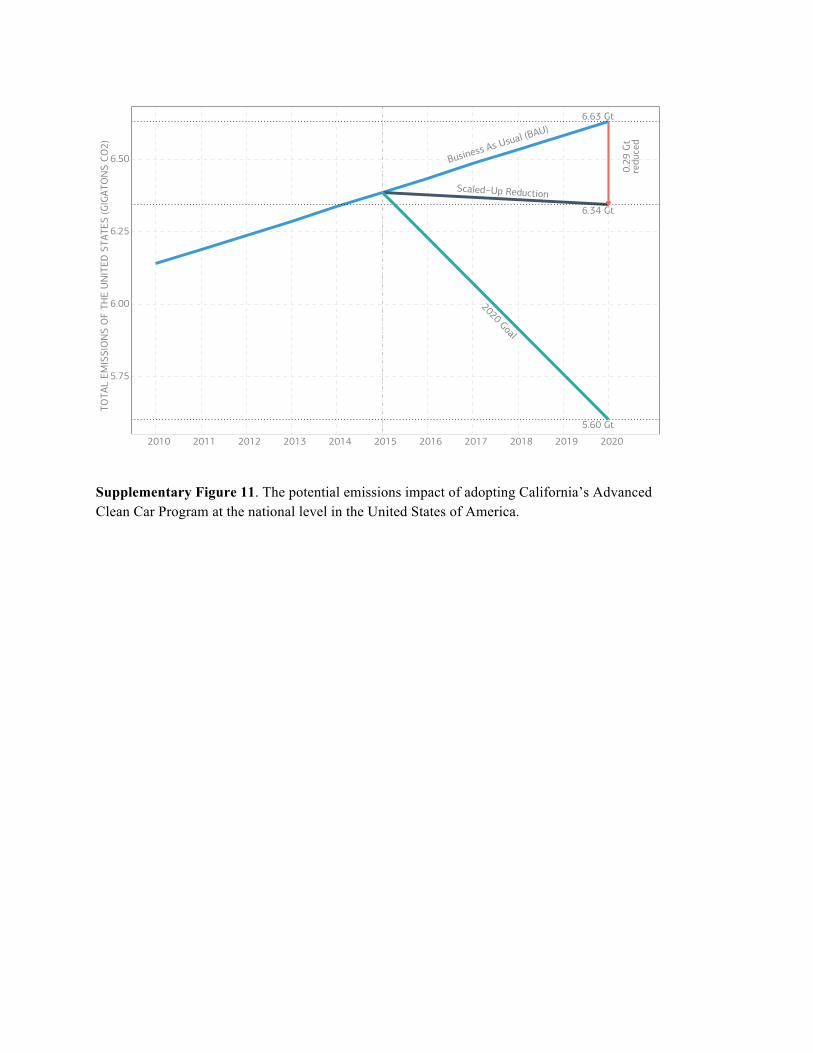
Supplementary Figure 11. The potential emissions impact of adopting California’s Advanced Clean Car Program at the national level in the United States of America.
Business As Usual (BAU)
2020 Goal
Scaled−Up Reduction
6.63 Gt
5.60 Gt
6.34 Gt
0.29
Gt
redu
ced
5.75
6.00
6.25
6.50
2010 2011 2012 2013 2014 2015 2016 2017 2018 2019 2020
TOTA
L EM
ISSI
ON
S O
F TH
E U
NIT
ED S
TATE
S (G
IGAT
ON
S CO
2)
References:
1 Program overview: Integrated solid waste management, Oran, Algeria (R20 Regions of Climate Action, 2015); http://www.regions20.org/images/Oran%20Waste%20Overview.pdf. 2 Freed, J.R., Driscoll, W., Lee, E., and Lindsay, C. Greenhouse gas emission factors for management of selected materials in municipal solid waste (1999). 3 Algeria – General Information – (Geohive database, 2008); http://www.geohive.com/cntry/algeria.aspx. 4 CAIT Climate Data Explorer Database – (World Resources Institute, 2012); http://cait.wri.org/historical. 5 SWEEP-Net. Country Report on the solid waste management in Algeria (2010); http://www.sweep-net.org/ckfinder/userfiles/files/country-profiles/RA%20ALGERIE%20ANG.pdf. 6 Rural population (% of total population) – (The World Bank, 2014); http://data.worldbank.org/indicator/SP.RUR.TOTL.ZS. 7 Environmental service incentives system in the state of Acre, Brazil: Lessons for policies, programmes and strategies for jurisdiction-wide REDD+ (World Wildlife Fund, 2013); http://assets.wwf.org.uk/downloads/sisa_report_english.pdf?_ga=1.122401611.1195062068.1454649940. 8 State by State Deforestation in the Brazilian Amazon (Brazilian Institute of Space Research (INPE) via Mongabay, 2014); http://www.mongabay.com/brazil-state_deforestation.html. 9 Bulter, R. A. Amazon deforestation jumps in Brazil, but remains historically low. Mongabay (27 November 2015); http://news.mongabay.com/2015/11/amazon-deforestation-jumps-in-brazil/. 10 Boucher, D., Roquemore, S., and Fitzhugh, E. Brazil’s Success in Reducing Deforestation. Union of Concerned Scientists.-Tropical Conservation Science 6 (3), 426-445 (2013); http://tropicalconservationscience.mongabay.com/content/v6/TCS-2013_Vol_6(3)_426-445-Boucher_et_al.pdf. 11 Global Forest Watch – (World Resources Institute, 2014); http://www.globalforestwatch.org/country/BRA. 12 Plano Estadual de Prevenção e Controle do Desmatamento no Acre – PPCD/AC – (Governo do Acre, Secretaria Estadual de Meio Ambiente (SEMA), Rio Branco, 2010). 13 Laloe, F. Waste and Recycling in Belo Horizonte – (Green Growth Best Practices, 2014); http://www.ggbp.org/case-studies/brazil/waste-and-recycling-belo-horizonte. 14 Waste to energy for more effective landfill site management. Renewable Energy Policy in Cities: Selected Case Studies – (International Renewable Energy Agency (IRENA), 2012); https://www.irena.org/Publications/RE_Policy_Cities_CaseStudies/IRENA%20cities%20case%203%20Belo%20Horizonte.pdf. 15 2 degree inventory of greenhouse gas emissions – (Prefeitura de Belo Horizonte, 2012). 16 Brazil – (Geohive, 2014), http://www.geohive.com/cntry/brazil.aspx. 17 Climate action in British Columbia: 2014 progress report – (British Columbia Ministry of Environment, 2014); http://www2.gov.bc.ca/assets/gov/environment/climate-change/reports-and-data/provincial-ghg-inventory-report-bcs-pir/2014-progress-to-targets.pdf. 18 Tax Bulletin (Bulletin MFT-CT 005) – (British Columbia Ministry of Finance. (2015); http://www.sbr.gov.bc.ca/documents_library/bulletins/mft-ct_005.pdf.
19 Elgie, S., & McClay, J. BC’s carbon tax shift after five years: Results. Sustainable Prosperity (2013);http://sustainableprosperity.ca/sites/default/files/publications/files/BC%27s%20Carbon%20Tax%20Shift%20after%205%20Years%20-%20Results.pdf. 20 Murray, B.C., & and Rivers, N. British Columbia’s revenue-neutral carbon tax: A review of the latest “grand experiment” in environmental policy. NI WP 15-04. Durham, NC: Duke University (2015); https://nicholasinstitute.duke.edu/sites/default/files/publications/ni_wp_15-04_full.pdf. 21 Table 134-0004 Supply and disposition of refined petroleum products, monthly (cubic metres); Table 405-0002 Gasoline and Other Petroleum Fuels Sold, annual (litres x 1,000); and Table 129-0003 Sales of natural gas, monthly – (Statistics Canada); http://www5.statcan.gc.ca/cansim/a01?lang=eng. 22 Canada’s Emission Trends – (Environment Canada, 2014); http://ec.gc.ca/ges-ghg/E0533893-A985-4640-B3A2-008D8083D17D/ETR_E%202014.pdf. 23 Annual report on Shenzhen emissions trading scheme first-year operation: Compliance period I (2013-2014) – (China Emissions Exchange, 2014); http://www.ieta.org/assets/China-WG/shenzhen-2013etsreport.pdf. 24 Green, F. & Stern, N. China’s “new normal”: structural change, better growth, and peak emissions, (2015); http://www.lse.ac.uk/GranthamInstitute/wp-content/uploads/2015/06/Chinas_new_normal_green_stern_June_2015.pdf. 25 Climate Action Tracker, (2015); http://climateactiontracker.org/countries/china.html. 26 A look at China’s pilot carbon markets towards 2017 national ETS. Climate Policy Observer (5 October 2015), http://climateobserver.org/chinas-carbon-markets-towards-2017-national-ets/. 27 China’s 2010 Population Census – (National Bureau of Statistic of China, 2013); http://www.stats.gov.cn/english/statisticaldata/censusdata/. 28 Hamburg climate action plan 2007-2012, update 2011-2012. Communication of the Senate to the Hamburg Parliament – (City of Hamburg, 2012); http://www.hamburg.de/contentblob/3959638/data/download-update-2011-12-englisch.pdf. 29 Status quo report – (City of Hamburg, 2013); http://urbantransform.eu/wp-content/uploads/sites/2/2015/07/Status-Quo-Report_Hamburg.pdf. 30 Communication of Senate to the Citizenship. Climate Action Plan 2007-2012 - Final Report and overall balance – (National Statistical Institute North, 2012); http://www.hamburg.de/contentblob/4052736/data/klimaschutzkonzept-abschlussbericht.pdf. 31 Rajasthan pips Gujarat in solar power, becomes No. 1 in country. The Times of India. (2015, June 23); http://timesofindia.indiatimes.com/india/Rajasthan-pips-Gujarat-in-solar-power-becomes-No-1-in-country/articleshow/47776965.cms. 32 Chadha, M. Indian state of Rajasthan simplifies regulations to boost solar power capacity by 25 GW. CleanTechnica. (8 October 2014); http://cleantechnica.com/2014/10/08/indian-state-rajasthan-simplifies-regulations-boost-solar-power-capacity-25-gw/. 33 Growth rate calculated from yearly levels of installed solar capacity, taken from: Ministry of New and Renewable Energy, via: Jai, S. Solar Power at 4,000, Rajasthan in Lead. Business Standard (6 June 2015);http://www.business-standard.com/article/economy-policy/solar-power-capacity-touches-4-000-mw-rajasthan-races-ahead-of-gujarat-115060500726_1.html. 34 CO2 Baseline Database – (India’s Central Electricity Authority, 2014). 35 Vishnoi, A. Is Modi government's target to increase solar power capacity to five-fold in seven years achievable? The Economic Times (22 August 2015);http://articles.economictimes.indiatimes.com/2015-08-22/news/65739641_1_indian-railways-solar-power-solar-energy-corporation. 36 India solar handbook – (Bridge to India, 2015); http://www.bridgetoindia.com/our-reports/india-solar-handbook/.
37 Good practices in City Energy Efficiency: Cape Town-Kuyasa Settlement, South Africa- LowIncome Energy Efficiency Housing Project – (World Bank Energy Sector Management Assistance Program (ESMAP), 2012); http://www.esmp.org/sites/esmap.org/files/Kuyasa_EECI_Housing_FinalCaseStudy_Africa.pdf. 38 Clean Development Mechanism Simplified Project Design Document for Small Scale Project Activities – (United Nations Framework Convention on Climate Change, 2005). 39 Statistics for the City of Cape Town – (City of Cape Town, 2012); https://www.capetown.gov.za/en/stats/Documents/City_Statistics_2012.pdf. 40 Living Conditions of Households in South Africa, 2008-2009 – (Statistics South Africa, 2011); http://www.statssa.gov.za/publications/P0310/P03102008.pdf 41 California Advanced Clean Cars Summary – (California Environmental Protection Agency (CalEPA), Air Resources Board); http://www.arb.ca.gov/msprog/clean_cars/acc%20summary-final.pdf. 42 Executive order B-16-2012, California Office of the Governor (2012, March 23); http://gov.ca.gov/news.php?id=17472. 43 State agency greenhouse gas reduction report card – (California Environmental Protection Agency (CalEPA), 2015); http://www.climatechange.ca.gov/climate_action_team/reports/2015_CalEPA_Report_Card.pdf. 44 Staff Report: Initial Statement of Reasons for Proposed Rulemaking, Public Hearing to Consider the “LEV III” Amendments to the California Greenhouse Gas and Criteria Pollutant Exhaust and Evaporative Emissions Standards and Test Procedures and to the On-Board Diagnostic System Requirements for Passenger Cars, Light-Duty Trucks, and Medium-Duty Vehicles, and to the Evaporative Emission Requirements for Heavy-Duty Vehicles. – (California Environmental Protection Agency (CalEPA), Air Resources Board, 2011); http://www.arb.ca.gov/regact/2012/leviiighg2012/levisor.pdf. 45 EMFAC Web Database – (California Environmental Protection Agency Air Resources Board, 2011); http://www.arb.ca.gov/emfac/. 46 Highway statistics series – (U.S. Department of Transportation, Federal Highway Administration (FHWA), 2012); https://www.fhwa.dot.gov/policyinformation/statistics/2012/vm1.cfm. 47 Emissions of Greenhouse Gases in the U.S. – (United States Energy Information Administration (US EIA), 2011); http://www.eia.gov/environment/emissions/ghg_report/tables_ghg.cfm.