Embed Size (px)
Citation preview

Algorithms for Assistive Technology for Blind Pedestrians to Cross
Roads Safely
January 2017
PROJECT NO. UIC 2117-9060-02-C
PREPARED BY
The Urban Transportation Center at the University of Illinois at Chicago

THE URBAN TRANSPORTATION CENTER AT THE UNIVERSITY OF ILLINOIS AT CHICAGO
Algorithms for Assistive Technology for Blind Pedestrians to Cross Roads Safely
January 2017
UIC 2117-9060-02-C
Prepared For National Center for Transit Research Center for Urban Transportation Research University of South Florida
The Urban Transportation Center University of Illinois at Chicago
412 S. Peoria St., 340 CUPPAH, Chicago, IL 60607-7036 www.utc.uic.edu

1
Algorithms for Assistive Technology for Blind Pedestrians to Cross Roads Safely A Project Conducted in the Electrical and Computer Engineering Department
Directed by: Rashid Ansari College of Engineering, University of Illinois at Chicago (UIC)
Objectives/Tasks: The long-term goal of the program is to develop a prototype device which will demonstrate the feasibility of the assistive technology to help blind pedestrians. In the proposed project, we developed technology to address two components of the technology needed for the long-term project: (a) Reliable traffic light detection and (b) Image-based Geo-localization.
Background: Blind and visually impaired pedestrians are having increasing difficulty knowing when it is safe to cross streets because, with the advent of hybrid vehicles, cars are becoming quieter. The visually impaired used to be able to determine when it was safe to cross streets as they could hear cars approaching. Now there are increasing numbers of hybrid models being purchased by consumers, and this problem is becoming quite serious. The Department of Electrical and Computer Engineering became aware of this issue when one of its volunteers met with some visually impaired individuals at Friedman Place, a non-profit Supportive Living Community for blind and visually impaired adults, and learned they view these cars as the “silent killer.” In the long term our research group, led by Rashid Ansari, ECE Professor and Department head, plans to develop a small assistive device, possibly wearable, that will enable blind and visually disabled pedestrians to safely cross streets. In the proposed project with modest support we developed technology to address two components of the overall technology needed for the long-term project: reliable traffic light detection and image-based geo-localization.
Research Accomplishments and Deliverables: Our deliverables were methods and algorithms with improved performance for the tasks of reliable traffic light detection and image-based geo-localization. The methods and algorithms ae described in refereed conference proceedings articles [1,2]. Traffic light detection: In the past few years, several research efforts were undertaken and papers published on regular traffic light detection. Some attempts have been made to detect traffic light signals but a comprehensive method was not available. The main goal of our work in this project was to develop technology to be integrated in a simple wearable device for blind people to help them navigate outdoors to perform their everyday life activities and, in particular, to cross streets safely [1]. The problem of automated traffic light in the absence of infrastructure is addressed. Traffic light scenes captured in camera images are analyzed using a proposed method in which various alternatives were examined and an algorithm was devised to detect traffic lights by first selecting possible candidates for traffic light detection by performing traffic light color extraction, pruning the large candidate set using traffic light properties, carrying out recognition and classification of lights before finally deciding on the traffic light signal. When tested on a set of image data, the algorithm achieved good results with the estimated correct detection rate of the prototype determined to be above 90 %. The detection of pedestrian traffic signals indicating ``walk’’ and ``don’t walk’’ was also considered and the algorithm devised for this problem also yielded good results, again with an estimated correct detection rate better than 90 %. Details of the algorithm are described in an MS thesis [3].

2
Image-based geo-localization: Accurate information about the location and orientation of a camera in mobile devices is central to the utilization of location-based services (LBS). Most of such mobile devices rely on GPS data but this data is subject to inaccuracy due to imperfections in the quality of the signal provided by satellites. This shortcoming has spurred the research into improving the accuracy of localization. Since mobile devices have a camera, a major thrust of this research has been directed at acquiring the local scene and applying image retrieval techniques by querying a GPS-tagged image database to find the best match for the acquired scene. The techniques are however computationally demanding. To overcome the high complexity of those techniques, we investigated the use of inertial sensors as an aid in image-retrieval-based approach [2]. Armed with information of media other than images, such as data from the GPS module along with orientation sensors such as accelerometer and gyro, we sought to limit the number of candidate images that should be considered for finding the best match. Specifically, data from the orientation sensors (heading) along with Dilution of Precision (DOP) from GPS are used to find the angle of view and the estimate of location. In [2] we presented the analysis of the reduction in the image set size for the search as well as simulations to demonstrate the effectiveness in a fast implementation with acceptable location error.
Student support: In performing this research, one graduate student in the Department of Electrical and Computer Engineering was partially supported as a research assistant during the period January 1 – August 15, 2014.
1. M. Salarian, A. Manavella, R. Ansari, “A vision-based system for traffic light recognition,” SAIIntelligent Systems Conference (IntelliSys 2015), London, UK, pp. 747 – 753, November 10-11,2015. DOI: 10.1109/IntelliSys.2015.7361224
2. M. Salarian, A. ManavellaR. Ansari, “Accurate Localization in Dense Urban Area Using GoogleStreet View Images,” SAI Intelligent Systems Conference (IntelliSys 2015), London, UK, pp.485 – 490, November 10-11, 2015. DOI: 10.1109/IntelliSys.2015.7361184.
3. Andrea Manavella, “Traffic Light Detection for Portable Assistive Device to Aid BlindPedestrians”, Department of Electrical and Computer Engineering, University of Illinois atChicago, Spring 2015.

Seediscussions,stats,andauthorprofilesforthispublicationat:https://www.researchgate.net/publication/306276749
Avisionbasedsystemfortrafficlightsrecognition
ConferencePaper·November2015
DOI:10.1109/IntelliSys.2015.7361224
CITATION
1
READS
44
3authors,including:
Someoftheauthorsofthispublicationarealsoworkingontheserelatedprojects:
FractalimagecodingViewproject
Non-UniformFFTimplementationsandApplicationsViewproject
MahdiSalarian
UniversityofIllinoisatChicago
19PUBLICATIONS48CITATIONS
SEEPROFILE
RashidAnsari
UniversityofIllinoisatChicago
205PUBLICATIONS2,841CITATIONS
SEEPROFILE
AllcontentfollowingthispagewasuploadedbyMahdiSalarianon26August2016.
Theuserhasrequestedenhancementofthedownloadedfile.

SAI Intelligent Systems Conference 2015November 10-11, 2015 | London, UK
A vision based system for Traffic Lights Recognition
Mehdi SalarianElectrical and
Computer Engineering
University of Illinois at Chicago
Chicago, Illinois 60607
Email: [email protected]
Andrea ManavellaElectrical and
Computer Engineering
University of Illinois at Chicago
Chicago, Illinois 60607
Email: [email protected]
Rashid AnsariElectrical and
Computer Engineering
University of Illinois at Chicago
Chicago, Illinois 60607
Email: [email protected]
Abstract—In this article a traffic light recognition with statusdetection system is introduced. The system is evaluated from ageneric point of view but the applications range from IntelligentTransportation System (ITS) to visual impaired and color visiondeficiencies aid to safely cross streets. The algorithm is basedon color segmentation in HSV color space. After that candidatesreduction is performed using a pipeline approach to speed up thealgorithm. Resulting candidates are input to feature extractionand support vector machine is then applied. For the training ofthe Support Vector Machine a database with images collected inChicago is used. Unlike other works the purpose is to evaluatedifferent performance according to the feature extraction. Inparticular HOG, HAAR and LBP features are compared. Thepurpose is also to create a database to be used from otherresearchers. The result is accurate and reliable provided thatgood quality images are input to the system.
Keywords—Traffic Light Recognition; SVM; Driver AssistanceSystems
I. INTRODUCTION
Reliable traffic light recognition has been one of the mainchallenging problems since the introduction of autonomousvehicles. Beside systems for lane and obstacles detection,pedestrian collision avoidance, cruise control with steeringassist and parking aid system. Traffic light recognition hasbecome really important for Driver Assistance Systems (DAS).It provides essential information to the driver on intersectionsand crosswalks and it can reduce the number of crashes formissed traffic light due to distraction. A wearable devicecould be designed for the visually impaired and the blind tohelp them safely cross streets. The recognition pipeline basedon visual systems can be implemented in several ways butgenerally the algorithm can be divided in few main steps thatare described in the following.
A. Candidates Detection
The first part is to detect possible candidates for traffic light,the most used approach is through color extraction ( red andgreen ), other algorithms use blobs detection since the lightscan be approximated to blobs [9]. Different color spaces suchas HSV [3], HSI [7], RGB [1], [2] Normalized RGB [4], [5] orLAB[10], YCbCr [8]) are used for different practical reasonsfrom simplicity to set a threshold to reduce the sensitivity tolight condition changes. Then based on the used color space athreshold is set to distinguish between red and green. Detectionis strictly dependent on how the threshold is set. The narrowerthe threshold the lower the number of candidates but the higher
the miss rate. The wider the threshold range the higher thenumber of candidates but the lower the chance to miss a trafficlight. A robust color segmentation method is required in orderto achieve high detection rate while keeping low the falsedetections.
B. Candidates Reduction
Binary images obtained after the threshold has applied containnoise due to the real environment. A lot of candidates arepresent at this point due to the similarity between of the trafficlights to other objects (car tail lights of lights with red color,objects or even things worn by people). Morphological filtersare applied to remove noise [1], [2], [3], [4], [6], [7] andenhance the shape of the traffic light . Furthermore physicalfeatures such as area, ratio, dimension and shapes are used toremove false candidates[2], [3], [6], [8], [9], [11], [12]. Themain disadvantage using color segmentation is the high numberof false candidates that have to be removed.
C. Recognition and Classification
Part of the remaining candidates that passed the previous stepcould still be a false detection. Some of the features of thetraffic light are really hard to find due to light variationsand different scene, this step verifies the candidate based onstatistics data. Features are extracted from the original image( Haar Features [4], Histogram of Oriented Gradient [13]or Local Binary Patterns [14] ) and input to trained NeuralNetworks or Support Vector Machines and the result is yes/notraffic light present.
D. Decision Algorithm
The final decision on the traffic light is made, this final stepgives the result to the user (green, red, no traffic light ).Temporal correlation [10] is one of the most used, the trafficlight will appear in a sequence of frames and its center isexpected to be almost in the same position in sequentialframes. If a traffic light is found for at least few consecutiveframes and its center is within a range then it is considered atraffic light and the output is set as traffic light found. Furtherprocessing can be done mapping the position of the trafficlights creating a map and then integrate the system with gps[15]: If the system detects a traffic light then the algorithmchecks for the presence of the traffic light in that area. Themain disadvantage of this approach is that a map has to becreated and due to the gps uncertainty (even 60 meters ormore in the metro area ) the result is not reliable as expected.
978-1-4673-7606-8/15/$31.00 c© 2015 IEEE 747 | P a g e

SAI Intelligent Systems Conference 2015November 10-11, 2015 | London, UK
Fig. 1: Steps used to find the thresholds in the color segmen-tation step
II. ALGORITHM
A. Color Extraction
After resizing image to 1600 x 1200 pixels in order to reducethe computation time, all objects with red and green colorshould be extracted. In the first step, it seems better to gofrom RGB (Red, blue, Green) color space to HSV (Hue, nSaturation, Value). With this method is possible to determinethe color of each pixel using the Hue without having it affectedfrom the brightness. Setting the threshold for finding red andgreen is a crucial task that has an important role in the nextsteps. A statistical approach is used. The procedure for findingthreshold for a better color segmentation is shown in Fig. 1.
This procedure consist of below steps:
Database creation: A set of images representing the trafficlight (red and green) in different conditions are taken (day,sunset, rain ). This are then used to extract values of the HSVparameters in order to have the lowest missing rate in the firststep of the Detection. For this work images are taken usingthe camera Canon EOS-550D.
Manual ROI selection: The images from the previous stepare opened and Traffic lights are selected manually by user.
Histogram creation: The selected ROI after transferring toHSV is used to make six different histograms (Hue, Saturationand value for red and green light).
Threshold computation: Using the Gaussian method an accu-racy of 3σ is used to find the range for each HSV parameter forboth red and green lights. This guarantees that 99.7 % of pixelswill be selected correctly. The accuracy of this step is highlydepend on the quality of the Database. In the other hands, Redand Green have a wide range of difference according to the ageand the manufacturer of the traffic light and light condition. Inorder to cover most cases data set should contain traffic lightswith as many variations as possible.
Resulting parameters for segmentation are:
Fig. 2: Histogram obtained manually extracting the light ROIusing a database of 100 images with ”stop” and ”go”.
Hred ≥ 0.95 ∪Hred ≤ 0.1
Sred ≥ 0.6
Vred ≥ 0.5
0.3 ≤ Hgreen ≤ 0.55
Sgreen ≥ 0.3
Vgreen ≤ 0.5
B. Morphological operations
Dilation and Erosion
By applying color segmentation some of pixels belonging tothe traffic light may be removed because the range is outside ofthe threshold. This can be due to shadows, structure reflectionand also imperfect white balance of the camera (that canchange the color of the object from the original one). Anapproach that reduces this effect is the Morphological dilationwith a diamond seed. The size of the seed can vary but the bestperformance for 1600x1200 pixels images has been achievedexperimentally using a diamond seed of size = 4 pixels. If animage contains a lot of red or green small objects (i.e. brickwall for red and tree leaves for green) it is possible to havethose objects bigger and thus removed in the next steps becauseof the properties not similar to traffic light (i.e circularity).Some false negative can arise using this approach from theunion of a traffic lighta and a near objects with same color.
C. Candidates Reduction
In order to have a fast recognition step, the number ofcandidates should be reduced as much as possible. In thisway the Support Vector Machine can be applied on a fewcandidates.
Considering some properties of the traffic light, it is possibleto keep the candidates that have such properties whileremoving the others, this task requires a fine tuning since
978-1-4673-7606-8/15/$31.00 c© 2015 IEEE 748 | P a g e

SAI Intelligent Systems Conference 2015November 10-11, 2015 | London, UK
Fig. 3: Original Image
Fig. 4: Color Segmentation
Fig. 5: After Dilation
Fig. 6: After Erosion
wrong setting of the properties can easily create false negative:
Light Area:
The minimum area to be considered can be computed knowingthe maximum distance at which the traffic light must bedetected and the focal length of the camera. Here the minimumDiameterMin = 15 pixels. This leads to a circular area of:
AreaMin =π ∗DiameterMin
4= 176 pixels
Candidates with area less than 176 pixels are removed. Amaximum value for the area cannot be set since the user canpoint directly to the traffic light. However the traffic light hangson a pole at an height and experimentally we found that wenever have traffic lights greater than DiameterMax = 60 pixels
AreaMax =π ∗DiameterMax
4= 11304 pixels
However AreaMax must be tuned based on the application,for autonomous vehicles this parameter would be lower thanfor pedestrian application ( pedestrian can point into a trafficlight while the car keeps always a certain distance from thetraffic light).
Convex Area:
The light of the traffic light must be whole detected, if there areholes in the light it means that the HSV parameter were muchdifferent from the range selected for the red and green. Noholes are allowed in the light, the convex area is a parameterthat computes the area of the smallest polygon that can containthe candidate object. If the object contains holes then theconvex area would be much greater than the regular objectsarea. Therefore Area and Convex area are compared and ifthe absolute difference is outside of the 40 % range then theobject must be removed.
Fig. 7: Candidates after basic properties check
978-1-4673-7606-8/15/$31.00 c© 2015 IEEE 749 | P a g e

SAI Intelligent Systems Conference 2015November 10-11, 2015 | London, UK
Circularity:
Circularity is one of the most important features of the trafficlight. Assuming that the camera is in the middle of the streetthe light appears to be a circle. One of the most accurate wayto detect if an object is circular is using the circular HoughTransform. It requires that the desired features be specified insome parametric form ( in our case the circle equation x2 +y2 = r2 ). Since the traffic lights can be taken from differentangles, the shape that is found using Hough Transform is anellipse with below equation:
(xa
)2
+(yb
)2
= 1 (1)
Multiple circles can be found starting from one object andMulticircle removal procedure is needed. Those candidateshave not to be considered because the original object was notcircular. An algorithm detects this condition and remove theobject.
Fig. 8: Candidates after circularity check with Hough trans-form and Multicircle removal
Background Checking:
Even by applying constraints related to dimensions and shapeof a candidate some false candidates would still appear (aregular red or green light could pass the test in the dimensionconstraints of the previous steps). It is important to add onestep for candidate reduction based on color properties of thetraffic light. A possible solution is to check whether the regionaround light is dark enough or not. The algorithm searches fordark pixels below the light for red traffic light (above for greenones). The average of the RGB values is computed for a givennumber of pixels according to the traffic light size:
Th =LightDiameter
3(2)
According to experimental result best value for the thresholdis ThresholdDark = 100.
Fig. 9: Candidates after background check is performed
D. Recognition and Classification
Features Extraction:
So far only features based on the properties of the trafficlight have been used to reduce the number of candidates. Nowfeatures can be extracted from the remaining candidates: LPB,HOG and Haar features.
Support Vector Machine
In After the features have been extracted using one of theabove descriptors (Haar, LBP and HOG) they are vectors withdifferent dimension according to the descriptor selected andthe parameters.
F = d1, d2, ..., dMax(3)
Given a set of features corresponding to different input con-ditions (i.e. traffic light vs no traffic light), the support vectormachine should to decide whether the result belongs to thefirst or the second group. This is performed using Viola-Jonesalgorithm as provided by Matlab libraries. Before testing, theSVM must be trained with the following steps:
1) Detect Positive Candidates: :Red and green traffic lightare selected from the original images and manually labeled astraffic lights. These will form the positive training set
2) Detect Negative Candidates: : Images with no traffic lightsare selected and labeled as no traffic lights. This will form thenegative training set.
3) Cascade Training: :Features from every image of thepositive set are extracted and classified as traffic light.
4) Cascade Verification: :Negative images from the negativeset are used to verify that no traffic light is detected (this erroris called false negative).
The accuracy of the algorithm strictly depends on the trainingset. The higher the number of images with possible orientationand light conditions in the training the higher detection rate.
978-1-4673-7606-8/15/$31.00 c© 2015 IEEE 750 | P a g e

SAI Intelligent Systems Conference 2015November 10-11, 2015 | London, UK
Fig. 10: The purpose of the SVM is to differentiate trafficlights from other possible objects using features extraction
E. Decision Algorithm
After the recognition part has been performed two possiblescenario can be appeared:
• Multiple Detection: The multiple detection is possiblesince several scenes are with 2 traffic lights. If theyhave the same color then there are no problem. Theissue is present when the color is different. In this casethe traffic light that is closer must be selected.
• Single candidate: If there is only one candidate itcould be either a traffic light a false positive.
III. RESULTS
A. Training
Fig. 11: TRAINING A - Path followed during the first trainingperformed. It mainly covers a length of 5 km in a low densityarea in Chicago.
In order to see the performance of the algorithm, the Supportvector machine has been trained for sample from different partof the city where the scene can be really different (skyscrapersvs trees). In particular two test set of images have been usedtaken in different area of the city of Chicago as displayedin Fig. 11 and 12. Training A contains around 300 sample
Fig. 12: TRAINING B - Path followed during the secondtraining performed. It covers a length of 5 km in a high densityarea in downtown Chicago.
images while Training B contains 800 images. Images containred, green and no traffic light.
B. Test
In Three parameters are used to evaluate the performance:
• True Positives (TP): Is the number of traffic lightscorrectly detected in the image
• False Positives (FP): Is the number traffic lightsdetected but not present in the original image.
• False Negatives (FN): In the presence of the trafficlights the algorithm cannot detect them. Miss a redsign is dangerous so the optimization of the wholealgorithm has been done so that the number of missedred light is as low as possible.
A global evaluation is done using Precision and Recall pa-rameters. The former accounts for false positives (FP) and thelatter for false negatives (FN).
P =TP
TP + FP(4)
R =TP
TP + FN(5)
C. Accuracy
In this section the accuracy of the algorithm is computedusing two different training set. The accuracy is comparedfor different features extraction, in particular HAAR, HOGand LBP. The comparison of the results confirms that thealgorithm achieves high accuracy. The highest precision (86.2%) is for Haar features while the highest Recall (97.4 %) withLBP features. Although Haar seems to be the best from thecomparison there is not a sharp winner. Indeed, the result aresimilar and choosing among the features must be done withthe goal of the project in mind. (i.e timing required by thetraining as shown in table V)
978-1-4673-7606-8/15/$31.00 c© 2015 IEEE 751 | P a g e
SAI Intelligent Systems Conference 2015November 10-11, 2015 | London, UK
Fig. 13: Reduction of the candidates according to thesteps: (1)Dilation, (2)Erosion, (3)Properties check, (4)Circular-ity, (5)Multicircle Removal, (7)Background Check, (8)SVM,(9)Decision Tree
TABLE I: Result using HAAR features
Training TP FP FN Precision Recall
A 150 31 13 82.8 % 92 %
B 150 24 7 86.2 % 95.5 %
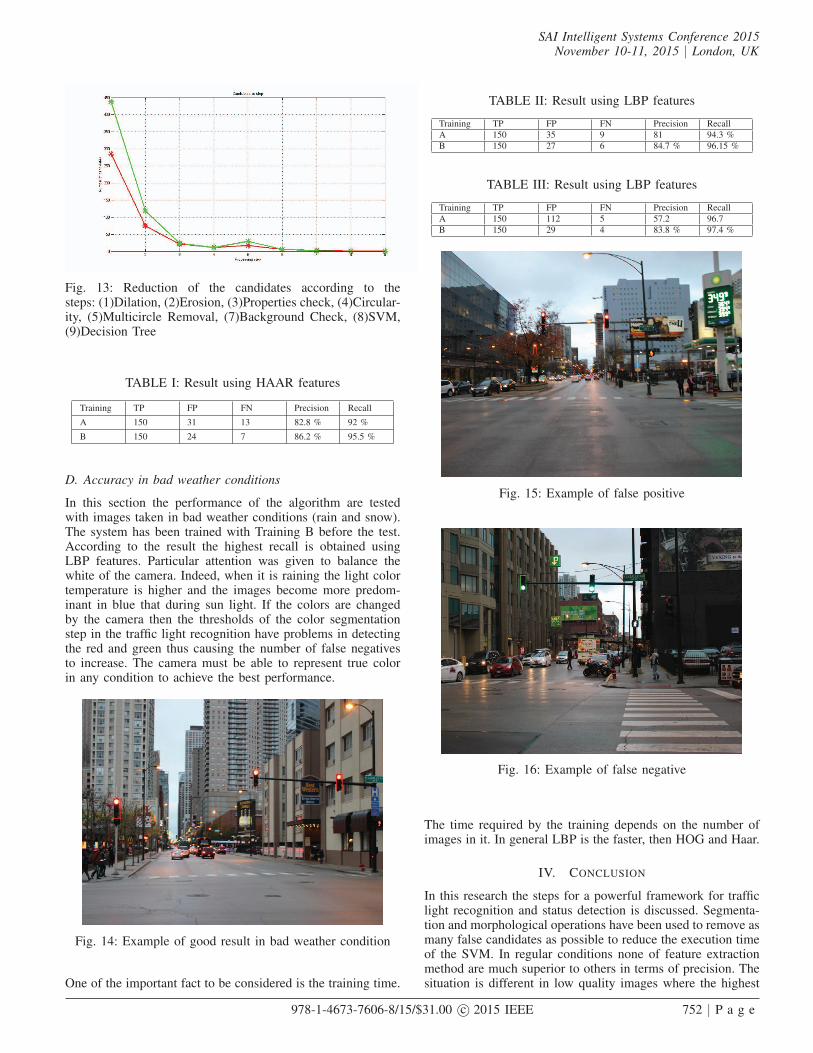
D. Accuracy in bad weather conditions
In this section the performance of the algorithm are testedwith images taken in bad weather conditions (rain and snow).The system has been trained with Training B before the test.According to the result the highest recall is obtained usingLBP features. Particular attention was given to balance thewhite of the camera. Indeed, when it is raining the light colortemperature is higher and the images become more predom-inant in blue that during sun light. If the colors are changedby the camera then the thresholds of the color segmentationstep in the traffic light recognition have problems in detectingthe red and green thus causing the number of false negativesto increase. The camera must be able to represent true colorin any condition to achieve the best performance.
Fig. 14: Example of good result in bad weather condition
One of the important fact to be considered is the training time.
TABLE II: Result using LBP features
Training TP FP FN Precision Recall
A 150 35 9 81 94.3 %
B 150 27 6 84.7 % 96.15 %
TABLE III: Result using LBP features
Training TP FP FN Precision Recall
A 150 112 5 57.2 96.7
B 150 29 4 83.8 % 97.4 %
Fig. 15: Example of false positive
Fig. 16: Example of false negative
The time required by the training depends on the number ofimages in it. In general LBP is the faster, then HOG and Haar.
IV. CONCLUSION
In this research the steps for a powerful framework for trafficlight recognition and status detection is discussed. Segmenta-tion and morphological operations have been used to remove asmany false candidates as possible to reduce the execution timeof the SVM. In regular conditions none of feature extractionmethod are much superior to others in terms of precision. Thesituation is different in low quality images where the highest
978-1-4673-7606-8/15/$31.00 c© 2015 IEEE 752 | P a g e

SAI Intelligent Systems Conference 2015November 10-11, 2015 | London, UK
TABLE IV: Accuracy comparison in adverse weather condi-tions
Training TP FP FN Precision Recall
HOG 56 44 14 56 % 80 %
HAAR 56 49 15 53.3 % 78.8 %
LBP 56 52 11 51.5 % 83.5 % %
TABLE V: Time required to train the SVM
Training HOG LBP HAAR
A 900 s (15 m) 1320 s (22 m) 2100 s (35 m)
B 8856 s (2.46 h) 4940 s (4.15 h) 38160 s (10.6 h)
recall (83.5 %) is achieved using LBP features extraction.Despite similar performance can be found in other researches,the focus of this research was to make a wide database of trafficlight images able to cover most conditions. Our database willbe shared so other researchers can use it.
A. Future work
Further steps can be added to make the system more reliable.
• Improvement of the Database: At this point around2000 images from the city and around are present,more images and video should be taken in the suburbsas well to train the algorithm also in a less populatedarea. The system could be also trained for other coun-tries provided that some steps of the pre-processingare tuned (i.e light area, shape)
• Integration with GPS and Inertial sensors: Datafrom these sensors can be helpful for narrowing regionof interest in which the traffic light must be searched.Mapping of the traffic lights of a small area has beendone in [15]
REFERENCES
[1] A. Ramananadan, C. Anning, J.A Farrell, V. Anh, M. Barth, Real TimeComputer Vision/DGPS-Aided Inertial Navigation System for Lane LevelVehicle Navigation, Intelligent Transportation Systems, 2012
[2] Y. Li, M. Gu, Z. Cai, Real Time arrow traffic light recognition systemfor intelligent vehicle, School of Information Science and Engineering,2012
[3] M. Diaz Cabrera, P. Cerri, Sanchez Medina, Suspended traffic lightsdetection and distance estimation using color features, Anchorage, AK,2012
[4] J. Gong, Y. jiang, G. Xiong, C. Guan, G. Tao, H. Chen, The recog-nition and tracking of traffic lights based on color segmentation andCAMSHIFT for intelligent vehicles, La Jolla, California, 2010
[5] M. Omachi, S. Omachi, Detection of traffic lights using structuralinformation , Beijin, China, 2010
[6] U. Ozguner , K, Redmill, J. Liu, Y. Shen, A robust video based trafficlight detection algorithm for intelligent vehicles , Xian, China, 2009
[7] Tae-Hyun, J. In-Hak, C. Seong, Detection of traffic lights for vision basedcar navigation systems , Hsinchu, Taiwan, 2006
[8] C. Yu, Y. Lang, C. Huang, Traffic lights detection during day and nightconditions by a camera , Beijin, China, 2010
[9] R. De Charette, F. Nashshibi, Real time visual traffic lights recognitionbased on spot light detection and adaptive traffic lights template , Xi’an,China, 2009
[10] George Siogkas, Evangelos Skodras, Evangelos Dermatas, Traffic lightsdetection in adverse conditions using color, symmetry and spatiotemporalinformation , ECE, Greece, 2009
[11] Y. Li, Z. X. Cai, M. Q. Gu, Y. Yan, Traffic lights detection recognitionbased on morphology filtering and statistical classification , Shanghai,China, 2011
[12] J. Ying, X. Chen, P. Gao, Z. Xiong, A new traffic lights detection andrecognition algorithm for electronic travel aid , ICICIP, Control andInformation Processing, 2011
[13] Chulhoon Jang, Chansoo Kim, Dongchul Kim, Minchae Lee, My-oungho Sunwoo, Multiple exposure images based traffic light recognition, IEEE, Dearborn, Michigan, 2014
[14] Cheng-Chin Chiang, Ming-Che Ho, Hong-Sheng Liao, Andi Pratama,Wei-Cheng Syu, Detecting and recognizing traffic lights by genetic ap-proximate ellipse detection and spatial texture layouts , ICIC Interntional,2011
[15] Jesse Levinstong, Jake Askeland, Jennifer Dolson, Sebastian Thrun,Traffic light mapping, Localization and state detection for autonomousvehicles , IEEE, Shanghai, China, 2011
978-1-4673-7606-8/15/$31.00 c© 2015 IEEE 753 | P a g e
View publication statsView publication stats

SAI Intelligent Systems Conference 2015 November 10-11, 2015 | London, UK
485 | P a g e 978-1-4673-7606-8/15/$31.00 ©2015 IEEE
Accurate Localization in Dense Urban Area using Google Street View Images
Mahdi Salarian School of Electrical and Computer
Engineering University of Illinois at Chicago
Chicago, IL Email: [email protected]
Andrea Manavella School of Electrical and Computer
Engineering University of Illinois at Chicago
Chicago, IL Email: [email protected]
Rashid Ansari School of Electrical and Computer
Engineering University of Illinois at Chicago
Chicago, IL Email: [email protected]
Abstract—Accurate information about the location and orientation of a camera in mobile devices is central to the utilization of location-based services (LBS). Most of such mobile devices rely on GPS data but this data is subject to inaccuracy due to imperfections in the quality of the signal provided by satellites. This shortcoming has spurred the research into improving the accuracy of localization. Since mobile devices have a camera, a major thrust of this research has been directed at acquiring the local scene and applying image retrieval techniques by querying a GPS-tagged image database to find the best match for the acquired scene. The techniques are however computationally demanding. To overcome the high complexity of those techniques, we investigated the use of inertial sensors as an aid in image-retrieval-based approach. Armed with information of media other than images, such as data from the GPS module along with orientation sensors such as accelerometer and gyro, we sought to limit the number of candidate images that should be considered for finding the best match. Specifically, data from the orientation sensors (heading) along with Dilution of Precision (DOP) from GPS are used to find the angle of view and the estimate of location. We present analysis of the reduction in the image set size for the search as well as simulations to demonstrate the effectiveness in a fast implementation with acceptable location error.
Keywords—mobile device; LBS; Geotagged-images; TF-IDF; GSV
I. INTRODUCTION The problem of finding the accurate location of a mobile
device has attracted extensive attention recently. Most of the current approaches find the device location by using a GPS module or by estimating its distance from cellular towers. Although GPS accuracy may be adequate for many applications, its performance is variable and often falls short due to its dependence on the satellite navigation system. Accuracy is crucial for some applications that rely on LBS technologies such as those needed by blind and visually impaired people. Although GPS may work well in vehicles, its performance is unsatisfactory in mobile devices carried by pedestrians who usually move at speeds less than 8 km/hr. This is especially so when pedestrians are close to tall walls or buildings. The inaccuracy therefor is more pronounced in dense parts of cities like the downtown locations.
It has been observed that the average localization errors of mobile phone GPS are in the range of 50-100 meters [1]. This
has led some researchers to investigate the use of inertial sensors or cameras to improve GPS-based location accuracy. Using images captured with cameras they examined whether it is possible to get accurate positions of a query image using computer vision techniques. They used approaches that are based on searching the best match for a query image in a database of Geo-referenced images with accurate GPS coordinates. One of these databases is a suitable set of Google Street View (GSV) images. GSV images are acquired with high-precision measurement and mapping devices. The images and the associated data can be used as a reference database [2]. By obtaining the best match for an image in the database to a query image it is feasible to estimate the coordinates of a query acquired with a hand-held or wearable device.
The key idea underlying this approach is scene recognition using feature extraction and matching techniques. There are a number of existing successful methods of effectively accomplishing this and these are categorized as image retrieval methods. To carry out this task, a variety of techniques that rely on scale invariant feature such as SIFT [3], SURF [4] or Dense SIFT are used. These feature extraction techniques have been shown to give better performance than prior algorithms such as MSER [9]. The large number of images typically stored in the database result in a very large number of features which need to be searched many times for each query. To reduce complexity, prior knowledge of location has been used to narrow down the search space. For example in [5] a city scale dataset is partitioned into smaller datasets that are searched close to coarse location of user. Some researchers have created their own datasets and made them available for study and comparison of results. The databases contain images captured with their devices or downloaded from websites such as Flicker or services like GSV. In our research we downloaded GSV images directly to populate our database. Because our goal is finding more accurate device location to help pedestrians, especially those who are visually impaired, we confined our database to images viewed from the perspective of a person walking on a sidewalk. The rest of the paper is organized as follows. After describing related work in section II, the method for generating our dataset is presented in section III. Section IV describes our proposed method of local search and Homography verification. Experimental results and conclusion are presented in Section V.

SAI Intelligent Systems Conference 2015 November 10-11, 2015 | London, UK
486 | P a g e 978-1-4673-7606-8/15/$31.00 ©2015 IEEE
(a)
(b)
Fig. 1. Corresponding images from camera and Google Street view when GPS can see clear sky a: image by camera b: Image from Google street view
II. RELATED WORK Recent advances in computer vision capabilities have
made it possible to reliably recognize many natural objects in outdoor environment. One of the applications of this capability is in the search of a massive collection of Geo-tagged images on the internet to find the best match to a query image [6] and then infer the location from the data associated with the geo-tagged image. There are a variety of methods to accomplish this. For instance Reitmayr and Drummond [7] utilized an edge-based method to get street facades based on a three-dimensional model. Other efforts sought to improve on this method and modify it by using an initializing step based on an accurate GPS antenna [8]. The most commonly employed efficient approach with sufficient accuracy for many applications is based on features that can be used for robust matching under changes in scale and the presence of noise. This approach is the basis of the popular Scale-invariant feature transform (SIFT) algorithm and its variations. Use of such features allows the algorithm to reach to satisfactory results even when the query image is acquired from different viewpoints and illumination conditions. Besides these widely used and reliable feature extraction methods, MSER [9] and the compressed histogram of gradient method have been used in some studies [10].
After feature extraction step for images in database, the features of query are searched among all features of database using Content-Based Image Retrieval (CBIR) approaches to recognize the best matching reference image in the database. One of the effective approaches which is widely used is the Bag of Features (BOF) approach whose underlying ideas are borrowed from text retrieval techniques. In this method, which was proposed by Zisserman and Sivic [11], the feature descriptions are quantized to create visual words with a clustering algorithm like k-means. As a result, an image is represented by a histogram of a number of visual words. Each image in database has a unique histogram associated with it. In order to find the best match, the histogram of a query image is compared with all histograms in database to infer which member of the Bag of Words (BOW) database is most similar to query. There are different measures for determine similarity such as the inner product of two BOW vectors. Some of the similarity measures can be calculated such as the computation of the L1 distance. In practice however the inverted file [12] method is commonly used in view of its better performance.
Some research effort has focused on the clustering step to find an efficient quantization technique to assign each feature descriptor to a visual word. For example Hierarchical k-means and approximate k-means are more appropriate when we are dealing with very large amounts of data since regular k-means is unsuitable for use with a huge number of features. Some modifications like soft assignment instead of hard assignment was proposed to compensate for possible incorrectly assignment for a sample feature vector. For instance Philbin [13] used soft assignment for each descriptor. In other methods this usually is not the last step.
Most of the image retrieval techniques perform an additional step in which several candidate images with the closest match are processed further. The number of candidates for each application is different and varies usually from 10 to 100. For making the final selection for the best match an additional task called Homography verification is performed. This step usually utilizes the popular iterative algorithm of Random Sample Consensus or RANSAC [14] to find the best geometric match between query and candidates. In fact this step compensates for the weakness in image retrieval schemes based on BOF due to neglecting geometric information in images.
The approaches mentioned so far do not exploit any knowledge of the approximate GPS coordinates and the camera orientation or heading. To exploit such available knowledge the research reported in [15, 19] proposed a method for using the inertial sensor and BOF to get more accurate result. Recognizing that most of mobile devices like smartphones and even cameras are equipped with inertial GPS and even Inertial Measurement Unit (IMU), we surmised that a search among all reference images in the database is not necessary when rough location and heading in acquiring a query image are available.
We seek to exploit the knowledge of the coarse location and Dilution of Precision (DOP) along with camera heading when the query image is acquired. The query is then directly processed using Homography verification to find best match. We find that we have variable number of plausible candidates and often more than 20 images to be processed with RANSAC. However the search is substantially reduced and serves as the basis of a practical approach suitable for a real-world application.

SAI Intelligent Systems Conference 2015 November 10-11, 2015 | London, UK
487 | P a g e 978-1-4673-7606-8/15/$31.00 ©2015 IEEE
a b c d
e f g hFig. 2. Some candidates for a sample query
III. DATASET CREATION Since the introduction of GSV, some researchers have
used its images to create datasets for studies. The GSV service covers most of US cities and more than 10 countries in 4 continents. Although it is available free for access, the creation of a dataset that contains a large collection, for example thousands, of images requires that permission be sought from Google for downloading images. With approval for such access and by utilizing the GSV API, the images can be downloaded directly from a URL. In past image dataset creation, Panorama images were usually downloaded and split into 10 or more parts. In our dataset, we downloaded images for each coordinate for which a GSV Panorama image exists. A JavaScript program was used to find all coordinates in a region specified by a center and radius that have a unique Panorama image. Then a URL request containing latitude, longitude, pitch, yaw, heading and FOV such as that shown in (1) below for MATLAB use, is sent to get images for creating the dataset: http://maps.googleapis.com/maps/api/streetview?size=1400x1200&location=',lat,long,&fov=60&heading=10&pitch=10&sensor=true&key=AIzaSrAXLYIw71e1c-4e4F9pgTT93OxhI_Qa_WQ (1) Sample URL request for downloading image from Google street view
Since the aim of this research is localization by a pedestrian, pitch and FOV are assigned to 10 and zero to get images similar to what a pedestrian would observe. For each coordinate we extracted 12 images to cover every 30 degree by changing the heading. The dataset contains the coordinates and heading of all images. The coordinates are sufficiently accurate because Google vehicles are equipped by accurate measurement units. We visually verified that, for the choice of the pitch and yaw parameters, the corresponding images from the camera and GSV were similar.
This was done by acquiring parameters from our hand-held device including camera, GPS and IMU, and sending those parameter to our MATLAB code in (1). The results were visually evaluated. Figure 1 shows a sample result when we have highly accurate coordinates. It is clear that image of GSV is from the same scene with a different viewpoint. For this research more than 24000 images corresponding to more than 2000 locations were downloaded. For each image the SIFT descriptor is calculated by using the Vlfeat library [17].
IV. PROPOSED METHOD Our proposed method consists of two steps. Step 1 – Query Image and Sensor Data Acquisition: The first step consists of acquiring the query image along with the associated coordinate and heading data to be obtained with the combination of a cell phone and hardware consisting of the GPS module, a camera, and an IMU. For each video frame we save the coordinates and heading data. Our experiments showed that the heading acquired from IMU is usually accurate enough while the coordinate may not be adequately accurate for the pedestrian use. The estimate of the inaccuracy is inferred from the Dilution of Precision (DOP) taken from GPS module and then calculating the Estimated Position Error (EPE). This value is actually the radius of the light blue circle around estimated coordinates as seen on Google map, illustrated in Figure 6.b. We therefore chose to consider EPE as parameter to narrow down the search area. The EPE is computed as follows:
(98% accuracy)= (2) where the Horizontal DOP (HDOP) is directly extracted from GPS module and User Equivalent Range Error (UERE) is computed in the standard error model tables for GPS [18].

SAI Intelligent Systems Conference 2015 November 10-11, 2015 | London, UK
488 | P a g e 978-1-4673-7606-8/15/$31.00 ©2015 IEEE
Fig. 3. Sample query
Fig. 4. (a) Result for =40 and =60 (b) Result for =40 and = 15
Knowledge of uncertainty in the locations enables us to infer how many images should be searched. So in locations with a wide view of the sky we do not need to use localization based on image search since data from GPS has sufficient accuracy and is reliable for navigation. Images to be searched in the database near given coordinates are determined using the criterion of distance computed using (3).
(3)
In (3) R is the average earth radius of 6371 kilometers. The number of resulting coordinates are directly associated with EPE that represents GPS uncertainty. Another parameter used here is query’s heading. Only the images with camera heading in the range of degree are selected in the next step. The candidates for 8 closest images are shown in Figure 2 for the query image of Figure 3.
Step 2 – Procedure for selecting the best candidate: In next step all of those candidate images are fed to a
Homography verification algorithm. Before applying RANSAC, the best match features are found with the criterion:
Where is distance between feature of dataset
image and closest feature in the query image , and is second closest feature in the image . The choice
of =1.8 was found to work well and is close to values used in other implementations. Next we consider the task of initialization.
Initialization: Result: How to acquire the best candidates for all the images si in
where d=number of images in the dataset
find if find when
end Send selected image to the Homography verification step (RANSAC) to find the best match.
In our method is set to 1.2 to cover a bigger region of search to reduce the error due to 98% accuracy of . The results of implementing the algorithm for two different values of are shown in Figure 4. We investigated the performance for different values of . Figure 5 shows relationship between number of candidate images and for both a dense and sparse urban area of Chicago. It can be inferred that the number of

SAI Intelligent Systems Conference 2015 November 10-11, 2015 | London, UK
489 | P a g e 978-1-4673-7606-8/15/$31.00 ©2015 IEEE
images is almost the same for these two regions. If the approximate heading data is available, is selected for limiting number of images fed to Homography verification. Although the quality of images in our database is not really high as in other databases but it is adequate for the purpose of this work. To generate features we used Vlfeat library and DSIFT as a descriptors. Before applying feature extraction all images are resized to 300×400 pixel. To speed up our algorithm parallel processing is used to accelerate the feature extraction procedure. By using our proposed method, the procedure for finding the best match is essentially the same for selected smaller region and city-scale problem.
The proposed method can be applied to a database with thousands of images. The only difference for a city-scale dataset and limited area dataset is the search for closest coordinate with available GSV image. This step, described earlier, executes fast and can be used in real-time applications. Experimental results show that in a location with a clear view of the sky, the GPS inaccuracy is low so none of the images in dataset will be selected in phase1, meaning that our localization system no longer needs refinement. In this situation GPS data is reliable and the error is acceptable for our application. Refining coordinates in such a situation is not reasonable because GSV images are available once almost every 12 meters while GPS uncertainty may be less than that value. Even if the image density is higher, for example 4 images per meter, it will not provide better result for outdoor localization. To evaluate effectiveness of our method some sample images with different cameras were taken in a dense area of Chicago where there was a train track overhead. The heading data and camera coordinates were saved simultaneously. Consider the image in Figure 6(a). There are 53 candidate images for this query. Feeding those candidates to Homography verification step gives us the result in Figure 6(c). If we use directly coordinate of the best match, we have the position in Figure 6(d) that is really close to our real position. Another refinement step can be applied by considering the use of the affine fundamental matrix.
V. CONCLUSION AND FURTHER WORK In this paper a method for better localization based on
image retrieval is proposed. We considered the fact that nowadays most of mobile devices such as smartphones are equipped with different inertial sensors which were not available until recently. So for accurate localization instead of searching among a city-scale dataset it is significantly more efficient to limit the search space. Our ultimate purpose is to design a system to help pedestrians who are visually impaired to navigate conveniently even in dense area of cities.
Use of data from GPS along with heading data from sensors makes it possible to improve location coordinates even
in a challenging situation illustrated in the sample image shown in Figure 6. Although our proposed method seems to be successful in most of the cases, it was found to fail in some of the samples especially when the quality of images are not good in the dataset. In future we plan to use improved feature extraction methods, for example ASIFT, to evaluate associated performance. Also, we will use regular methods like TF-IDF and inverted file techniques to evaluate results. It is clear that performance of our method is high in terms of accuracy. Here not only the number of candidate images are limited but also the same Homography verification step that is common in the most retrieval approaches has been considered as a last step. Refining coordinates by considering the affine fundamental matrix between query and best match is another step that is worth exploring. The ultimate goal of our research is to develop a more accurate device for localization. This research is a primary step toward our goal and could benefit from other techniques such as visual odometry as a complementary method.
Fig. 5. a A sample for average number of candidate images versus radius in dense area of Chicago for =15 (Orange) and 30 (Blue)
Fig. 5. b A sample for average number of candidate images versus radius in urban area of Chicago for =15 (Orange) and 30 (Blue)

SAI Intelligent Systems Conference 2015 November 10-11, 2015 | London, UK
490 | P a g e 978-1-4673-7606-8/15/$31.00 ©2015 IEEE
Fig. 6. (a) query (b) Coordinate of query (c) Best match (d) Modified position
REFERENCES [1] G.Schroth, R. Huitl, D. Chen, M. Abu-Alqumsan, A. Al-Nuaimi,and E.
Steinbach. Mobile visual location recognition. IEEE Signal Processing Magazine, 28(4):77–89, 2011.
[2] A. R. Zamir, A. Darino, and M. Shah, “Street view challenge: Identification of commercial entities in street view imagery,” in 2011 10th International Conference on Machine Learning and Applications (ICMLA), vol. 2, pp, 380–383, IEEE, 2011.
[3] D. Lowe. Distinctive image features from scale-invariant keypoints, International Journal of Computer Vision, 60(2):91–110, 2004.
[4] H. Bay, A. Ess, T. Tuytelaars, L. Van Gool, "SURF: Speeded Up Robust Features", Computer Vision and Image Understanding (CVIU), Vol. 110, No. 3, pp. 346-359, 2008.
[5] J. Zhang, A. Hallquist, E. Liang, and A. Zakhor, location-based image retrieval for urban environments, 18th IEEE conference in image processing, 2011.
[6] G. Schindler, M. Brown, and R. Szeliski. City-scale location recognition. In Proc. IEEE Conf. on Computer Vision and Pattern Recognition (CVPR), volume 0, page 1–7, 2007.
[7] G. Reitmayr and T. W. Drummond. Going out: Robust tracking for outdoor augmented reality. In Proc. Intl. Symp. on Mixed and Augmented Reality (ISMAR), pages 109–118, 2006.
[8] G. Reitmayr and T. Drummond. Initialisation for visual tracking in urban environments. In Proc. Intl. Symp. on Mixed and Augmented Reality (ISMAR), pages 161–160, 2007.
[9] Donoser M, Bischof H (2006) Efficient maximally stable extremal region (MSER) tracking. In: Proceedings of conference on computer vision and pattern recognition, pp 553–560.
[10] G. Schroth, R. Huitl, D. Chen, Mobil visual recognition, IEEE SIGNAL PROCESSING MAGAZINE, p77-89, JULY 2011.
[11] J. Sivic and A. Zisserman, “Video Google: A text retrieval approach to object matching in videos,” in n Proc. IEEE Int. Conf. Compter Vision, Nice, France, Oct. 2003, pp. 1470–1477.
[12] I. Witten, A. Moffat, and T. Bell, Managing Gigabytes: Compressing and Indexing Documents and Images. San Mateo, CA: Morgan Kaufmann, 1999.
[13] J. Philbin, O. Chum, M. Isard3, J.Sivic, A.Zisserman Improving Particular Object Retrieval in Large Scale Image Databases, IEEE Conference on Computer Vision and Pattern Recognition, CVPR 2008.
[14] M. A. Fischler and R. C. Bolles. Random sample consensus: A paradigm for model fitting with applications to image analysis andautomated cartography. Communications of the ACM, 24(6):381–395,1981.
[15] Tao Guan, Yunfeng He, Juan Gao, Jianzhong Yang, and Junqing Yu , On-Device Mobile Visual Location Recognition by Integrating Vision and Inertial Sensors, IEEE transactions on multimedia,vol. 15, No. 7, Novemner 2013.
[16] M.Salarian, H.Hassanpour. "A New Fast No Search Fractal Image Compression in DCT Domain.", Conf Proc international conference on machine vision, pp.62-66, 2007.
[17] http://www.vlfeat.org. [18] M. Sharif a, A. Stein a, Ernst M. Schetselaar, Integrated approach to
predict confidence of GPS measurement. [19] arXiv:1502.00319

THE URBAN TRANSPORTATION CENTER AT THE UNIVERSITY OF ILLINOIS AT CHICAGO
Algorithms for Assistive Technology for Blind Pedestrians to Cross Roads Safely
January 2017
UIC 2117-9060-02-C
Prepared For National Center for Transit Research Center for Urban Transportation Research University of South Florida
The Urban Transportation Center University of Illinois at Chicago
412 S. Peoria St., 340 CUPPAH, Chicago, IL 60607-7036 www.utc.uic.edu