Embed Size (px)
Citation preview
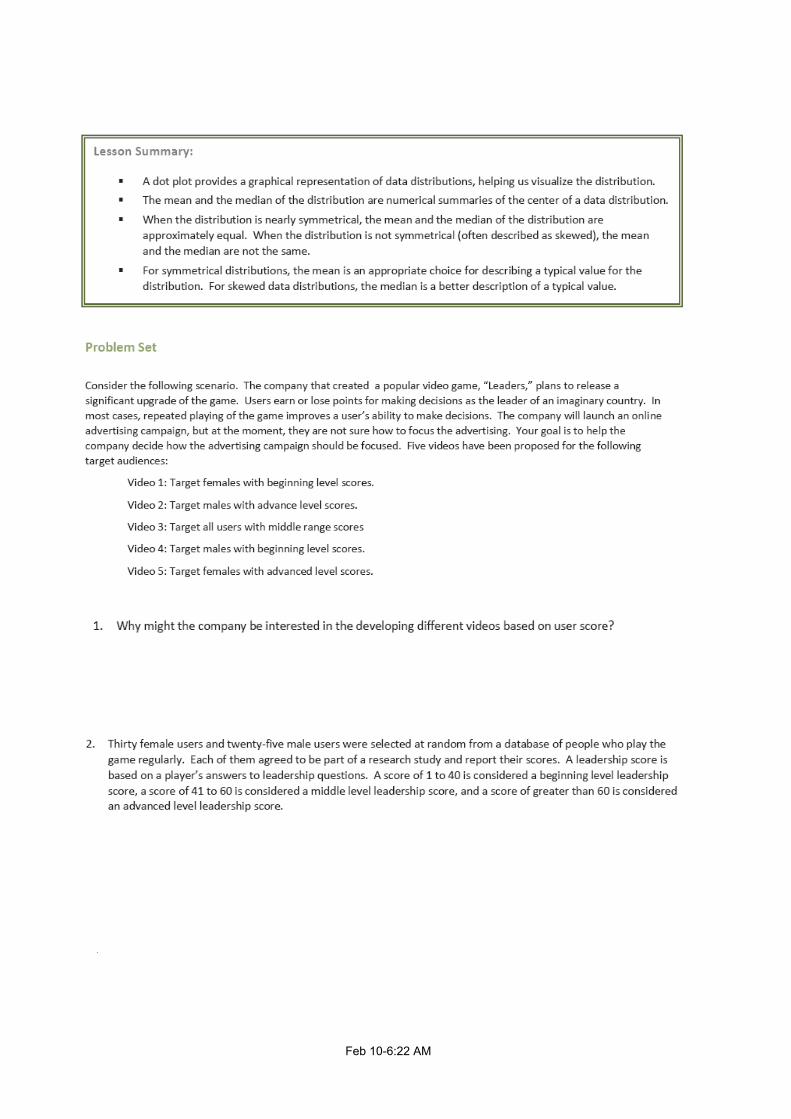
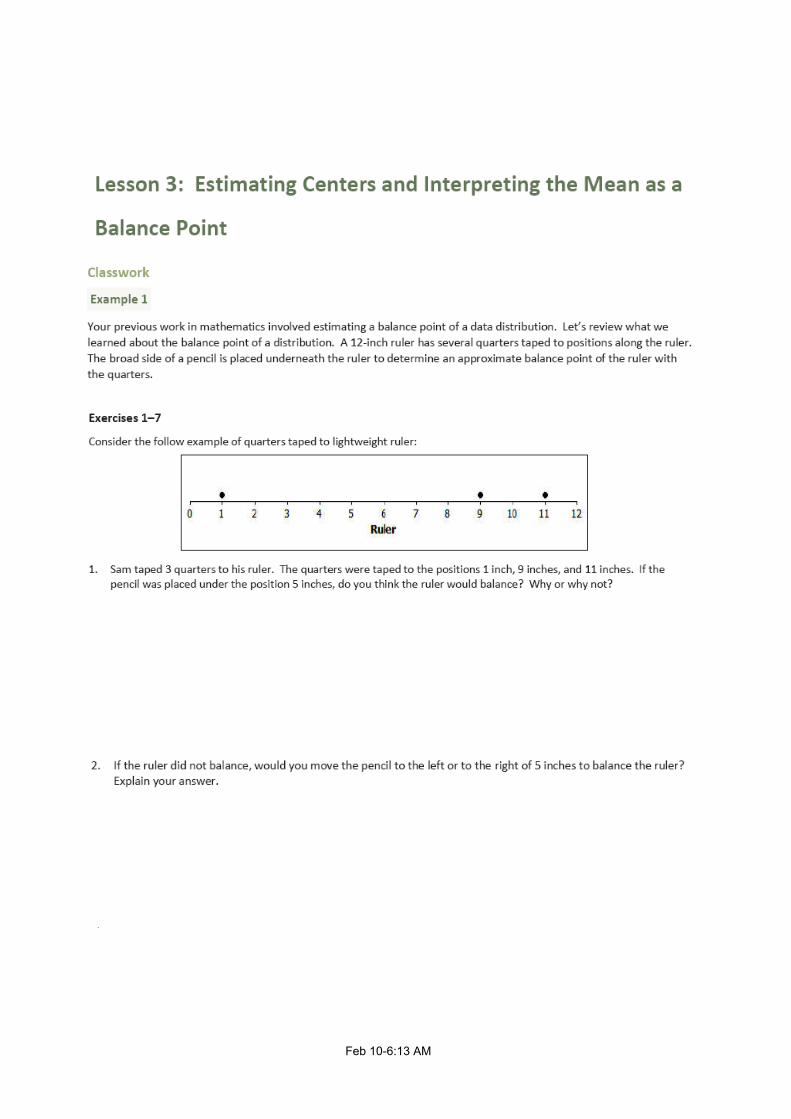
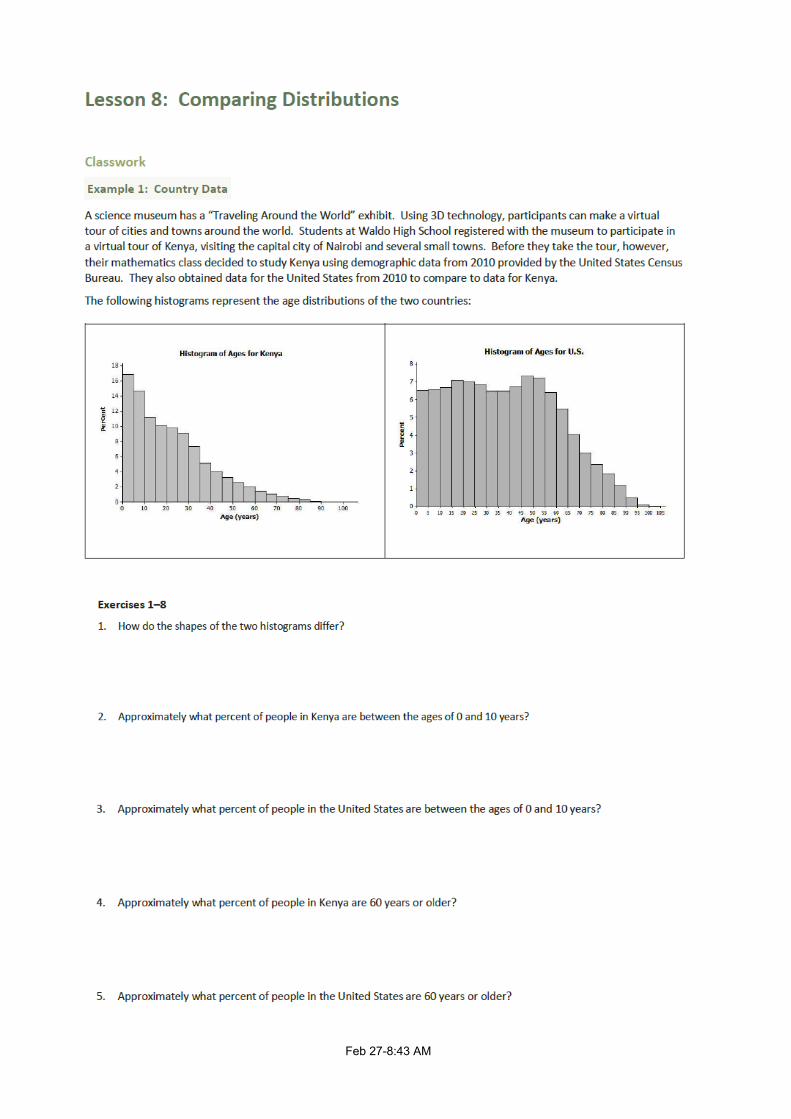
Algebra Students
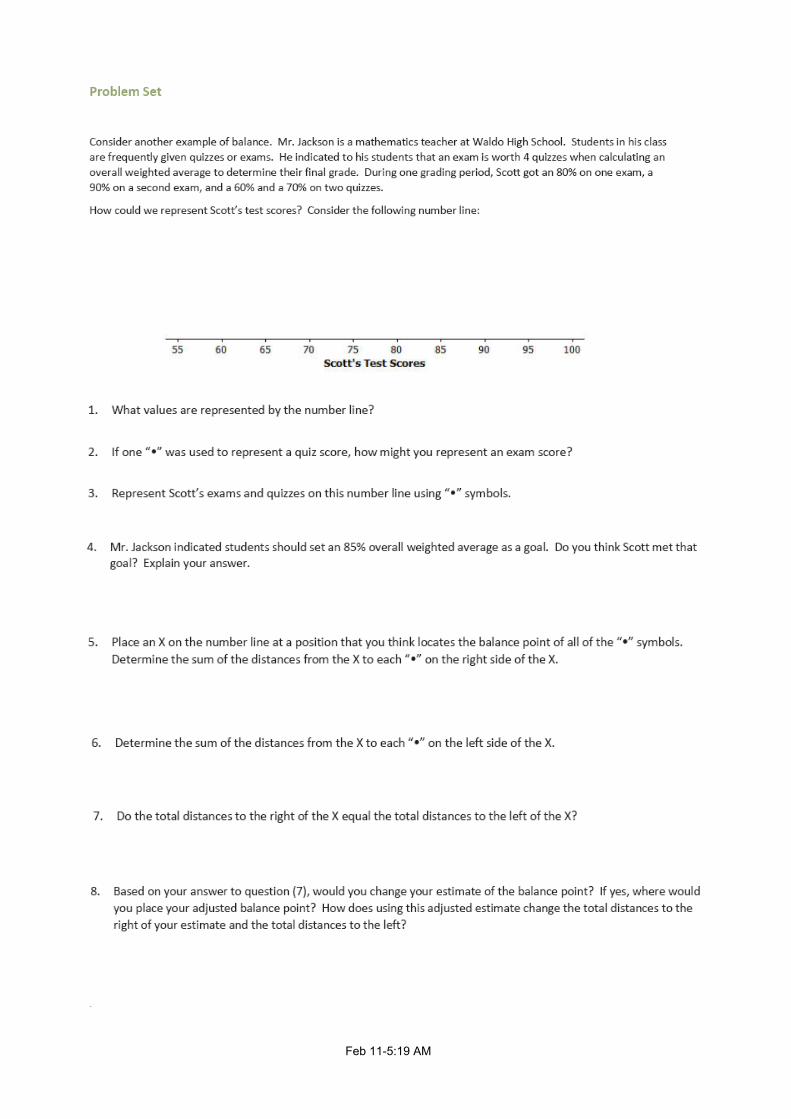
You have 2 assignments. You may do them in any order and you may use one assignment to help you with the other.
You will need access to a graphing calculator. You may use the one on Delta Mathfor Delta Math. You may also choose to get the TI 84 app for your phone.
• Delta Math assignment STATISTICSUse videos to assist you with the material
• The STATISTICS packet you were given in class for "Emergency Use Only". You can download it here if necessary.
We will go over this material when we return to school. You may contact your teacher via REMIND or email if you have any questions or concerns.
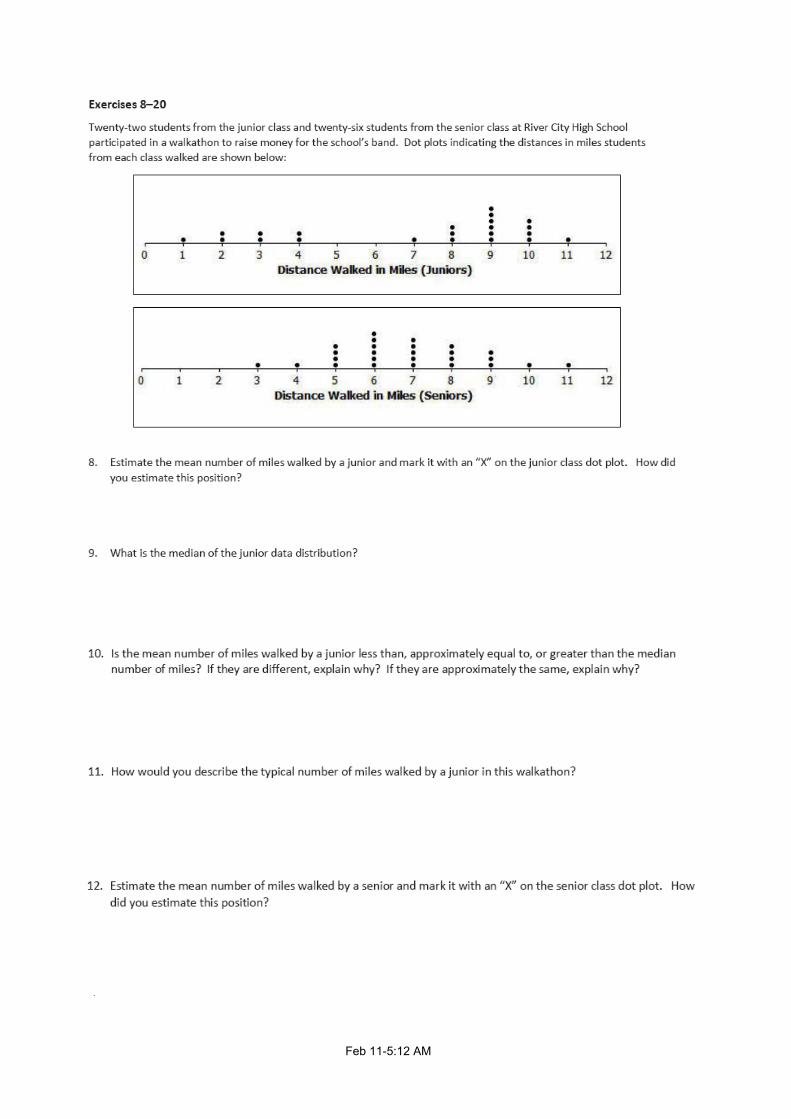
.
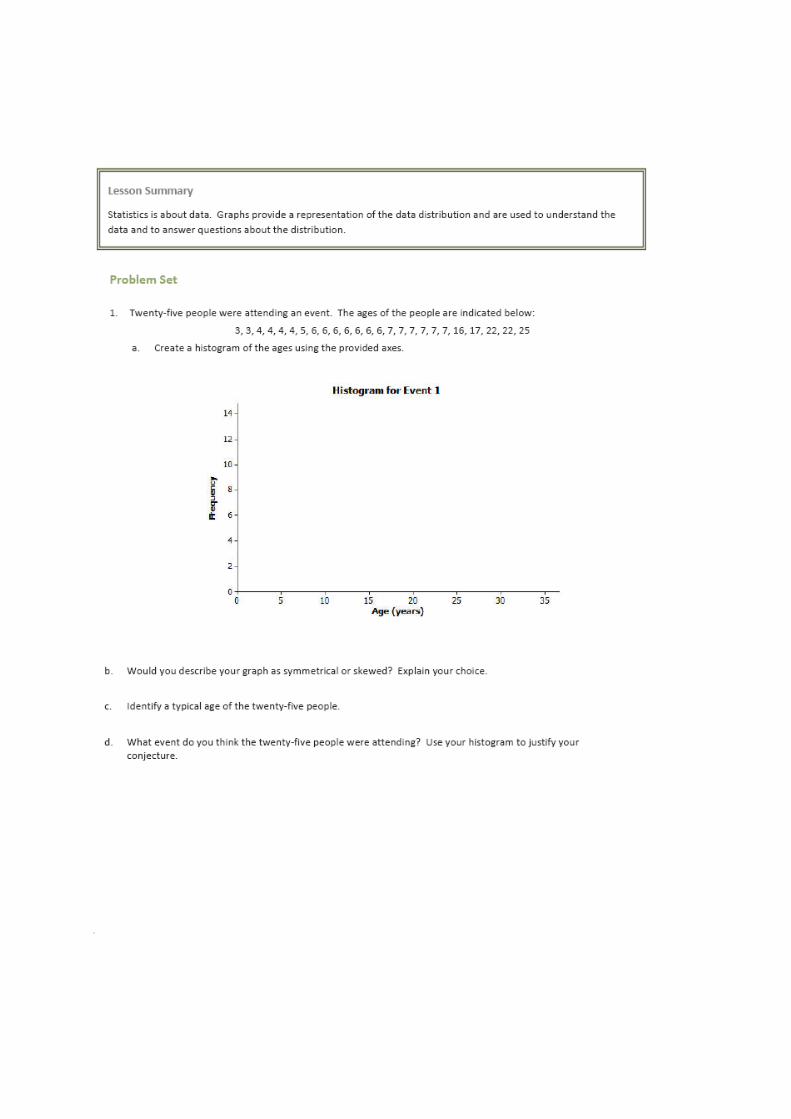
Feb 106:13 AM
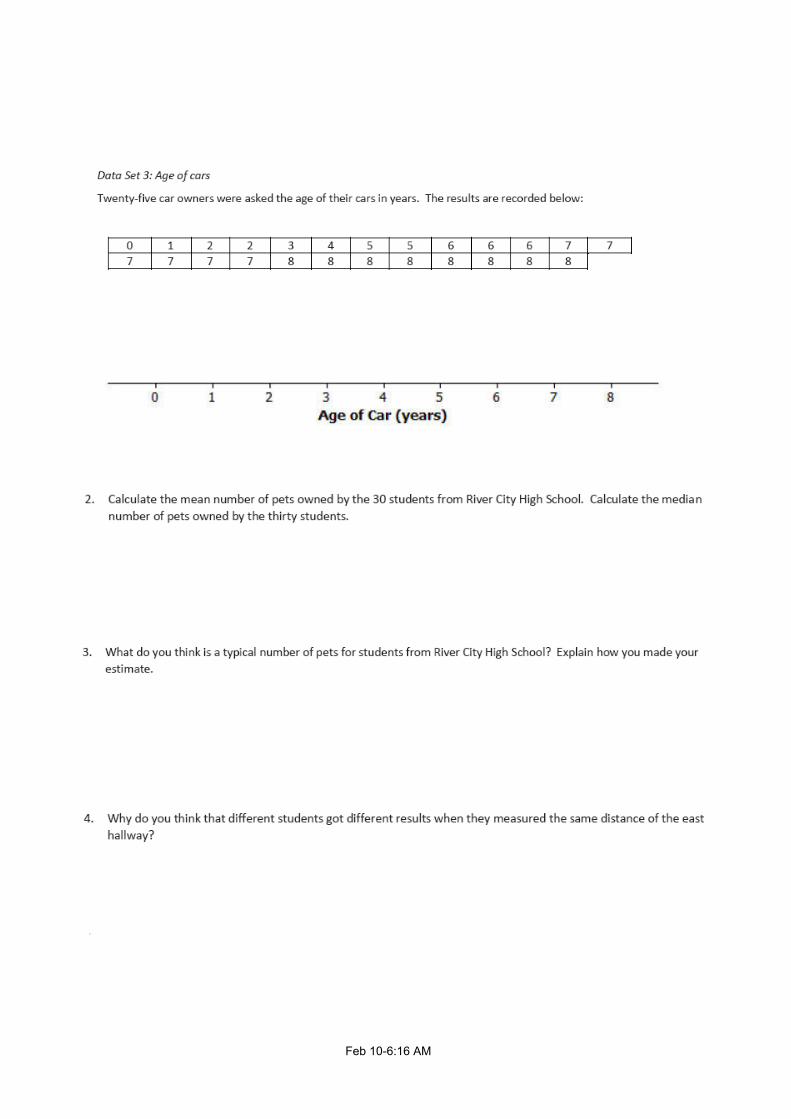
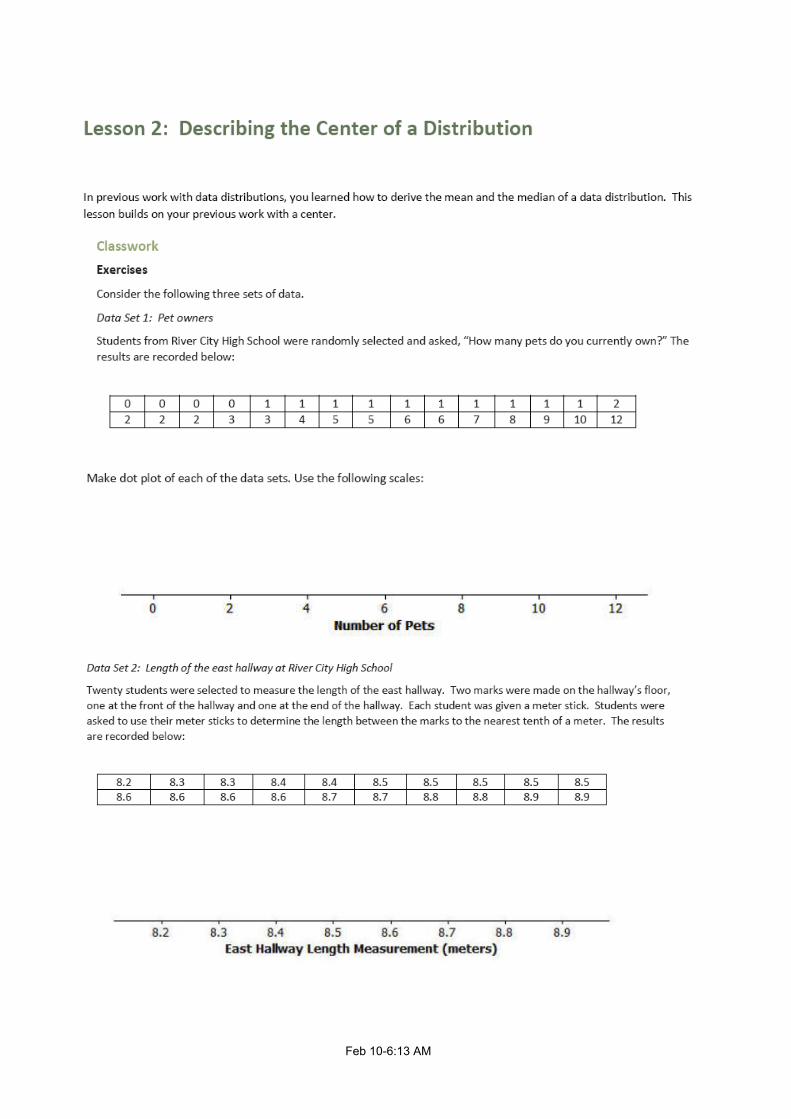
Feb 106:16 AM
.
Feb 106:19 AM
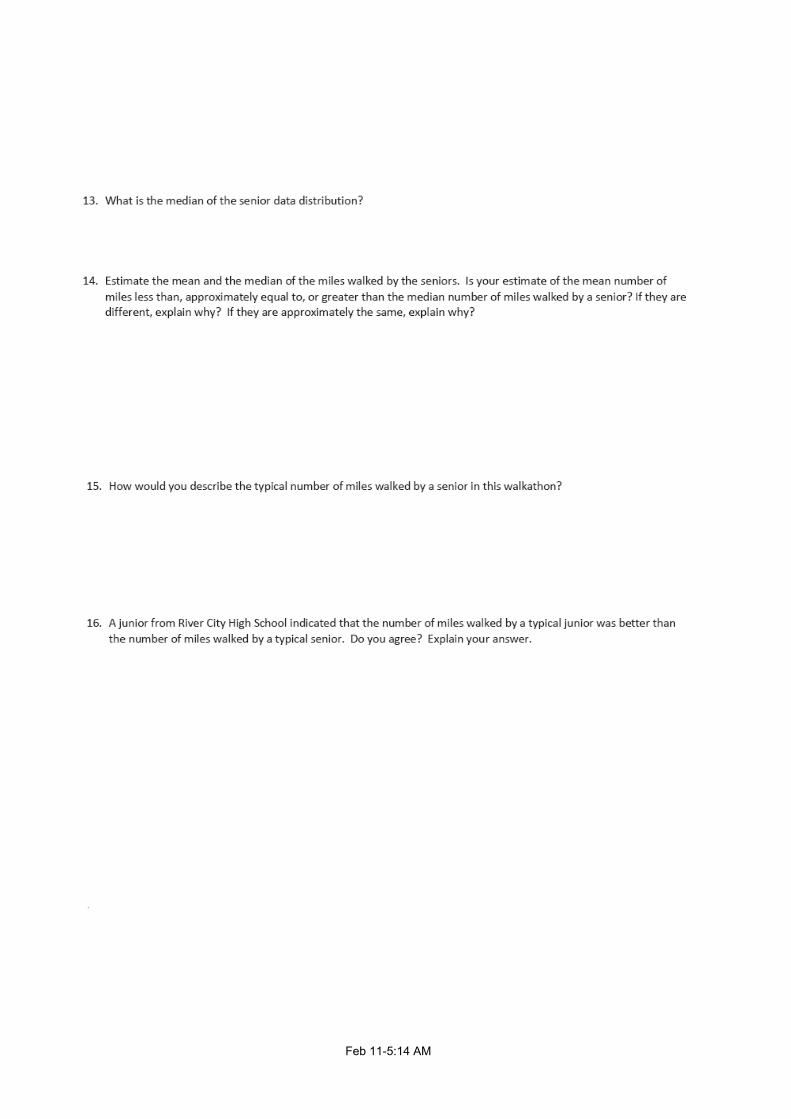
.
Feb 106:22 AM
.
Feb 106:24 AM
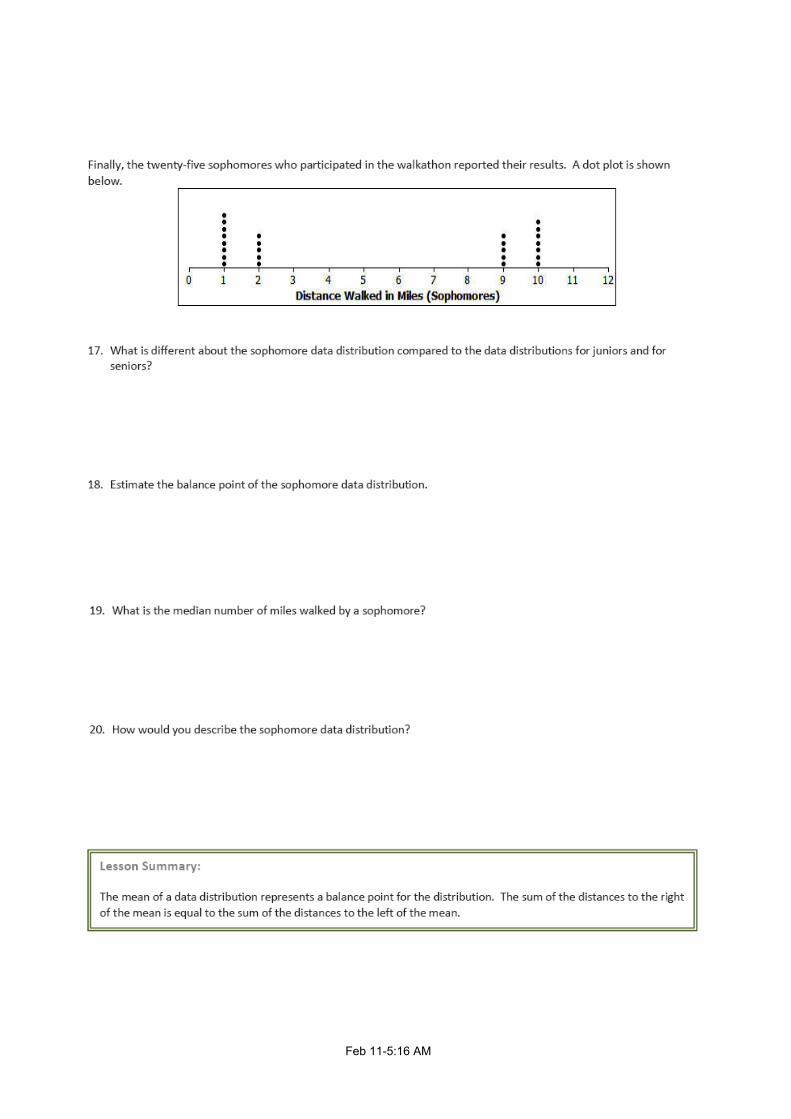
.
Feb 115:40 AM
.
Feb 106:13 AM
.
Feb 115:11 AM
.
Feb 115:12 AM
.
Feb 115:14 AM
.
Feb 115:16 AM
Feb 115:33 AM
.
Feb 115:19 AM
.
Feb 115:22 AM
.
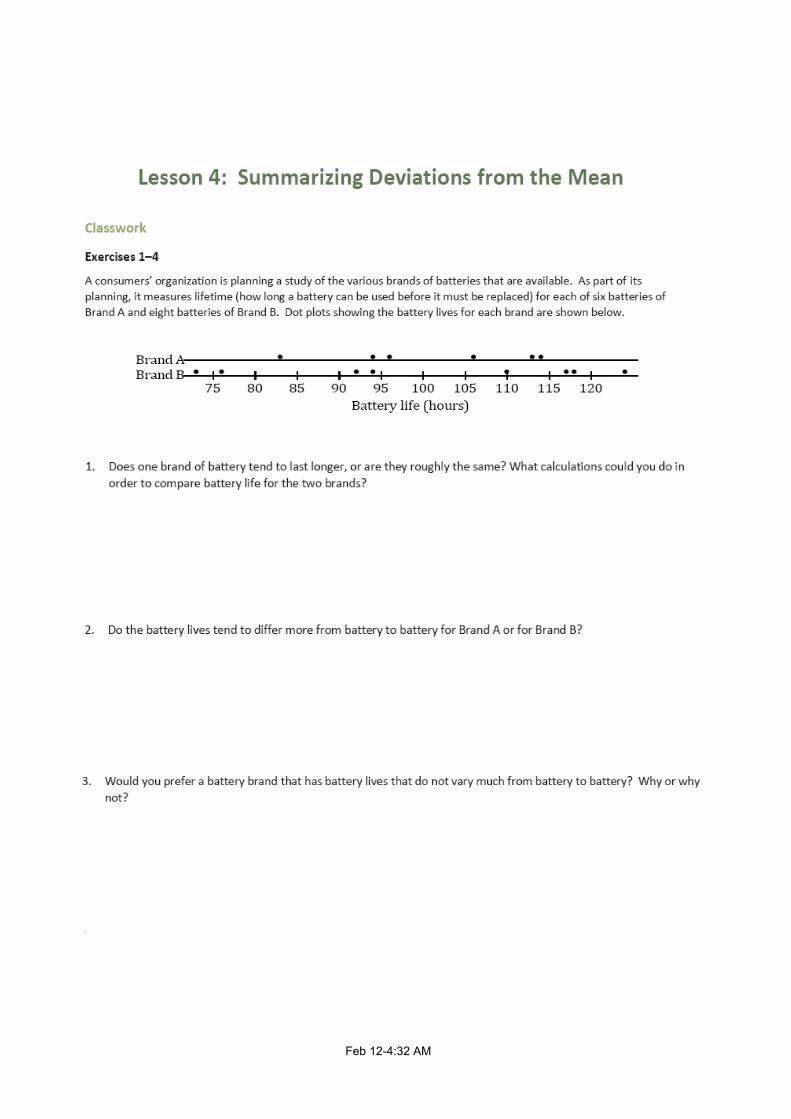
Feb 124:32 AM
.
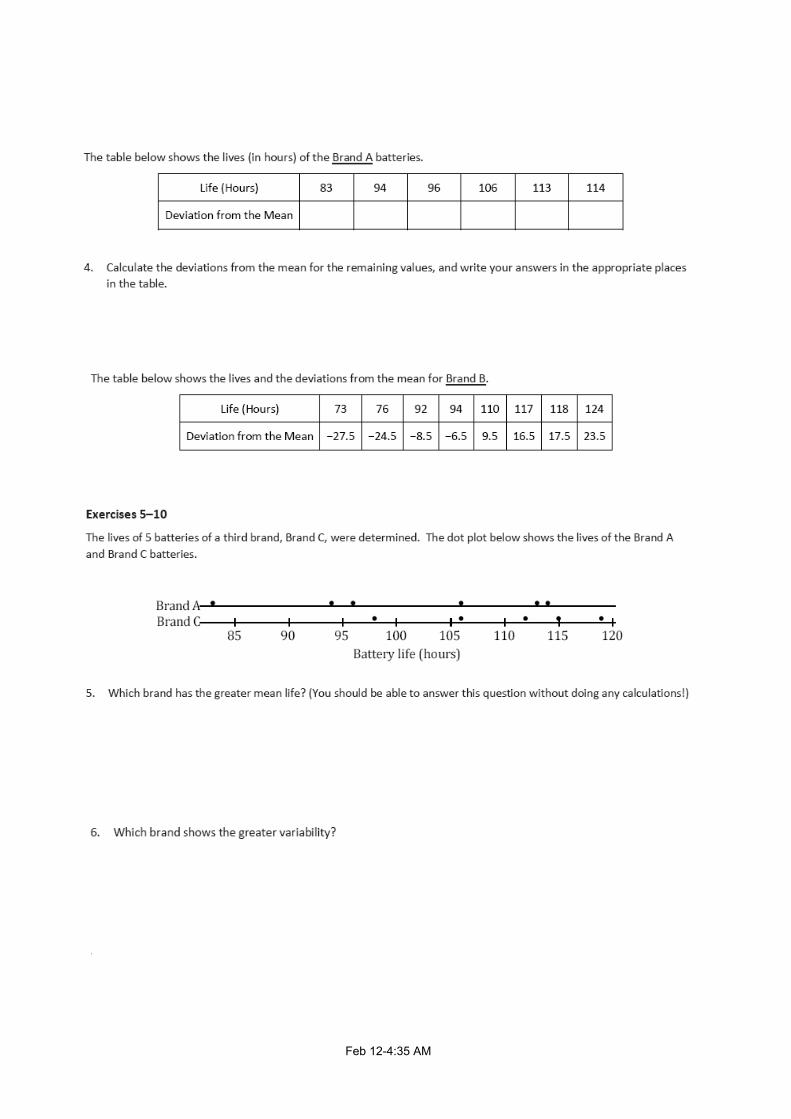
Feb 124:35 AM
.
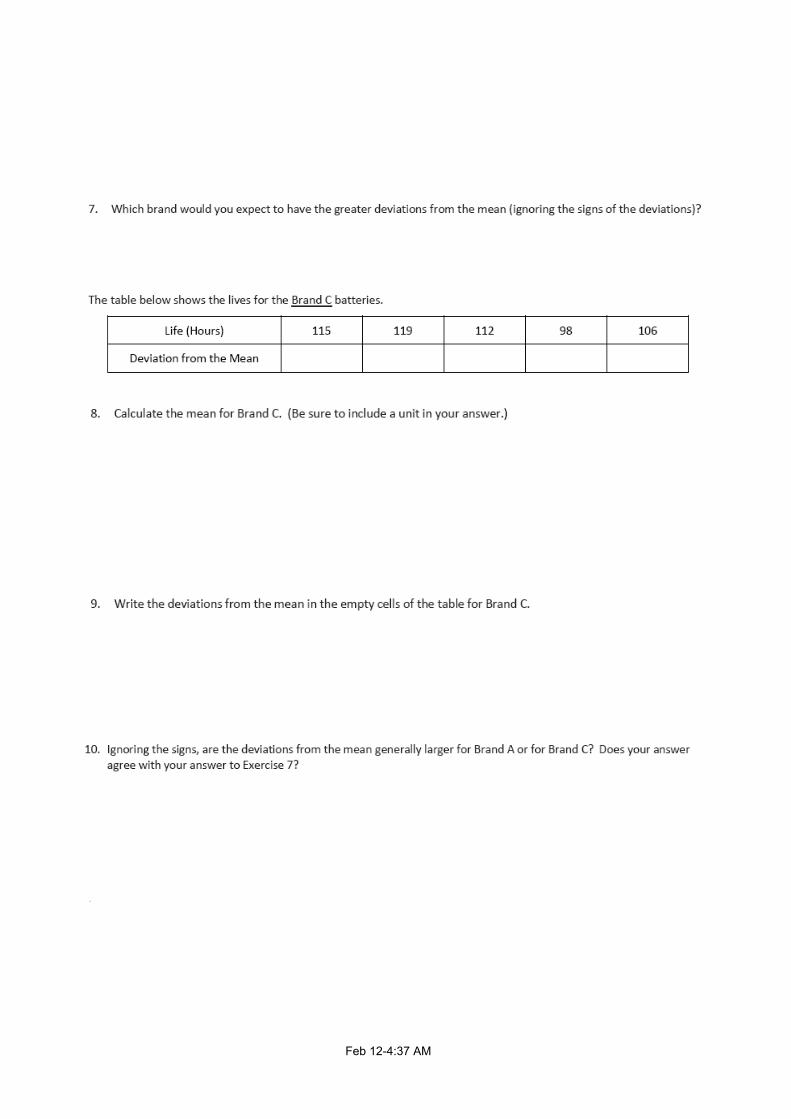
Feb 124:37 AM
.
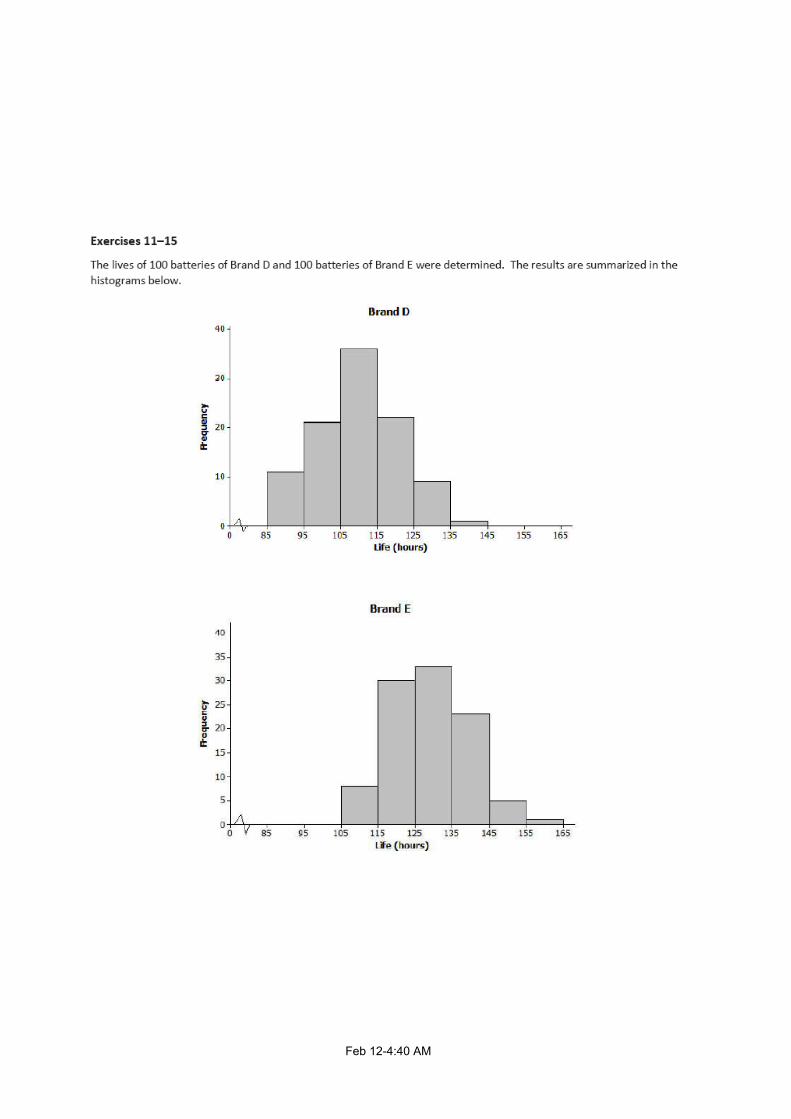
Feb 124:40 AM
Feb 124:41 AM
.
Feb 124:49 AM
.
Feb 124:52 AM
.
Feb 149:34 AM
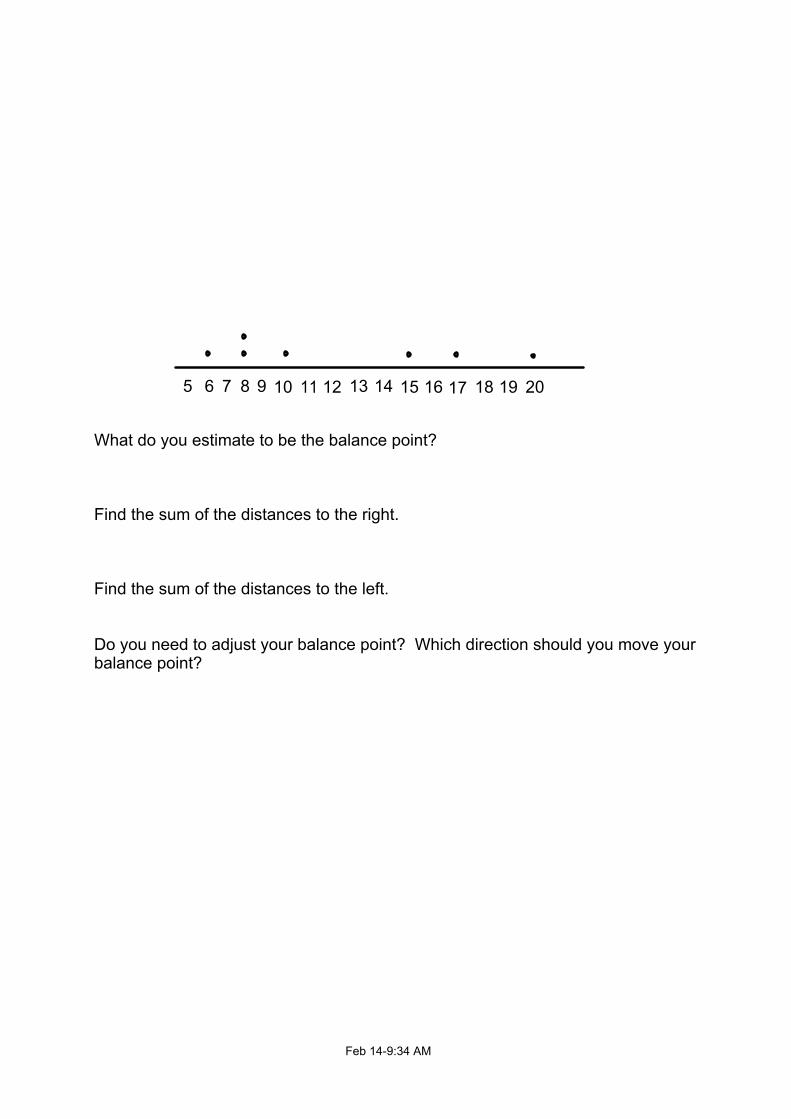
5 6 7 8 9 10 11 12 13 14 15 16 17 18 19 20
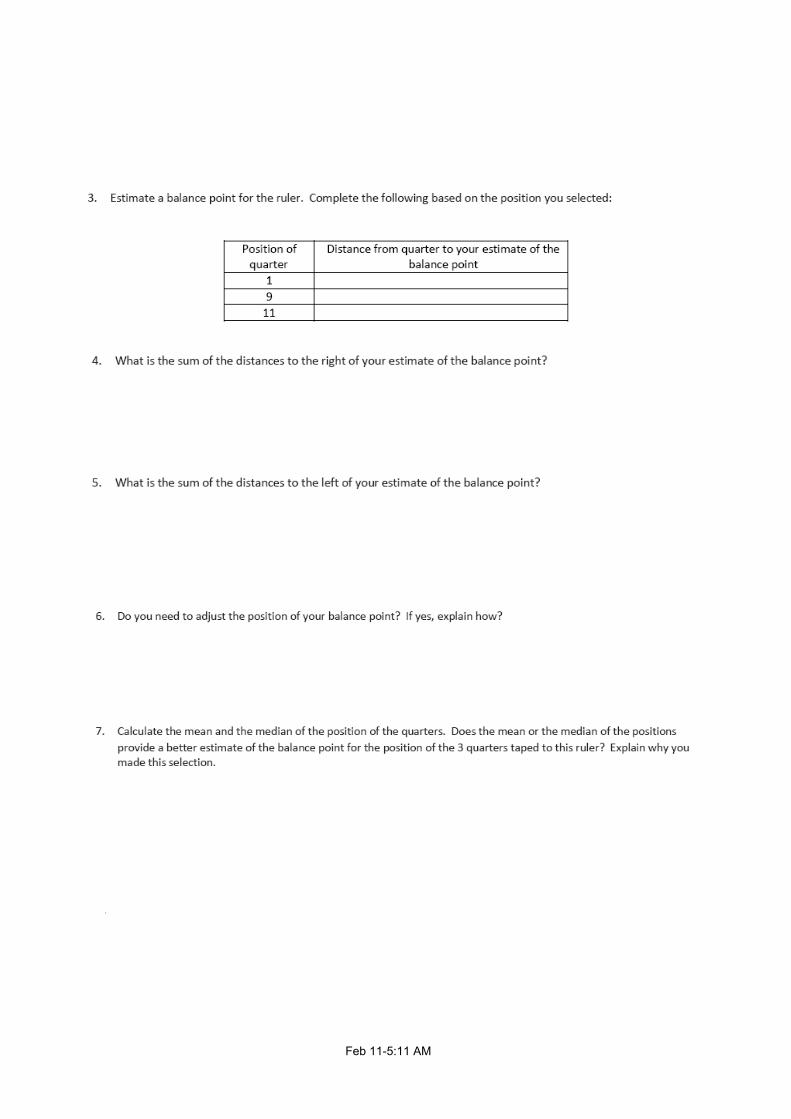
What do you estimate to be the balance point?
Find the sum of the distances to the right.
Find the sum of the distances to the left.
Do you need to adjust your balance point? Which direction should you move your balance point?

Feb 149:58 AM
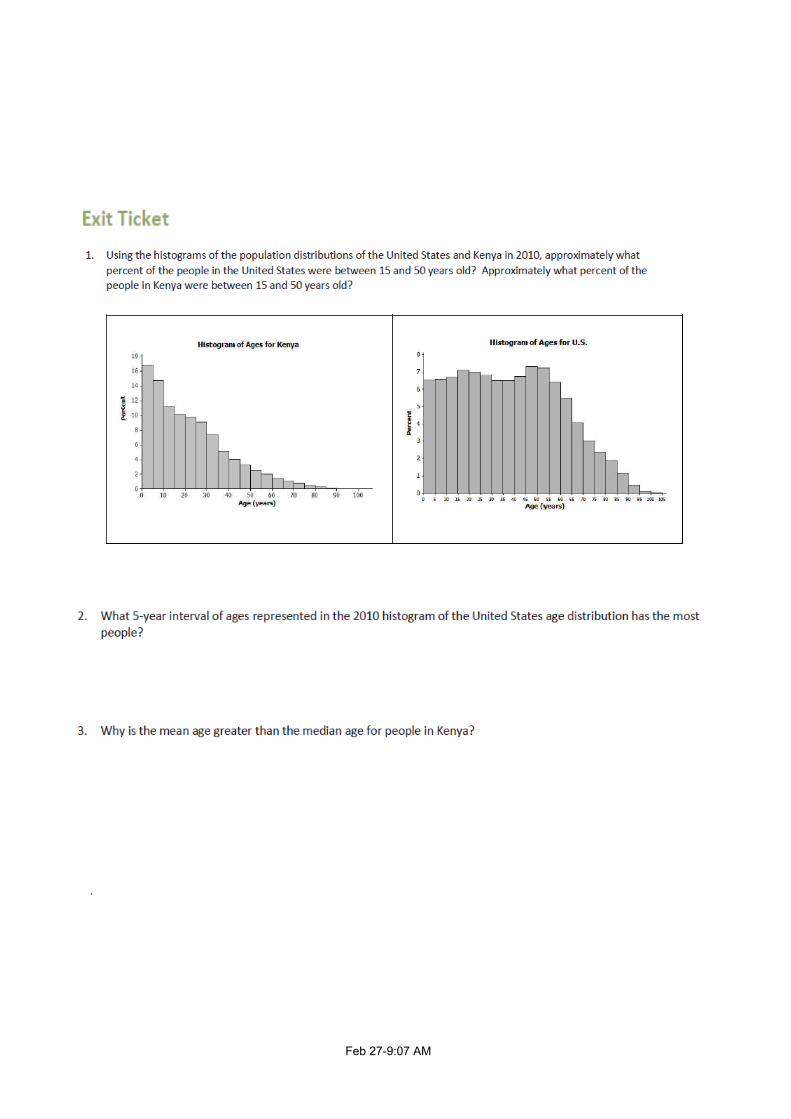
20 21 22 23 24 25 26 27 28 29 31 3230Number of hours spent playing video games
What is the median number of hours spent playing video games in a month? What is the mean number of hours spent playing video games in a month?
Is the mean greater than or less than the median? Why?
What is the typical number of hours spent in a month by a student playing video games?
34 35 36 37 38 39 41 4240
Number of miles run by members of the track team in one week
What is the mean number of miles run by a runner? What is the median number of miles run?
What is the typical number of miles run by a runner in a week?
.
Feb 1410:32 AM
.
Feb 258:51 AM
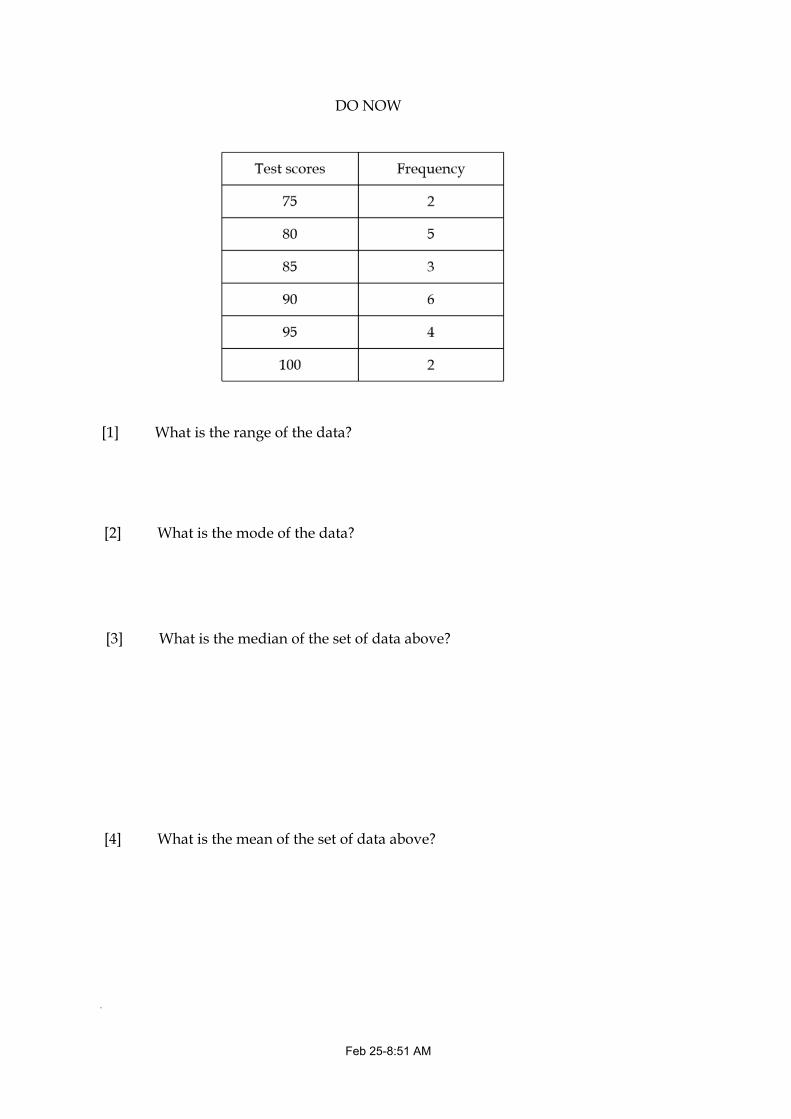
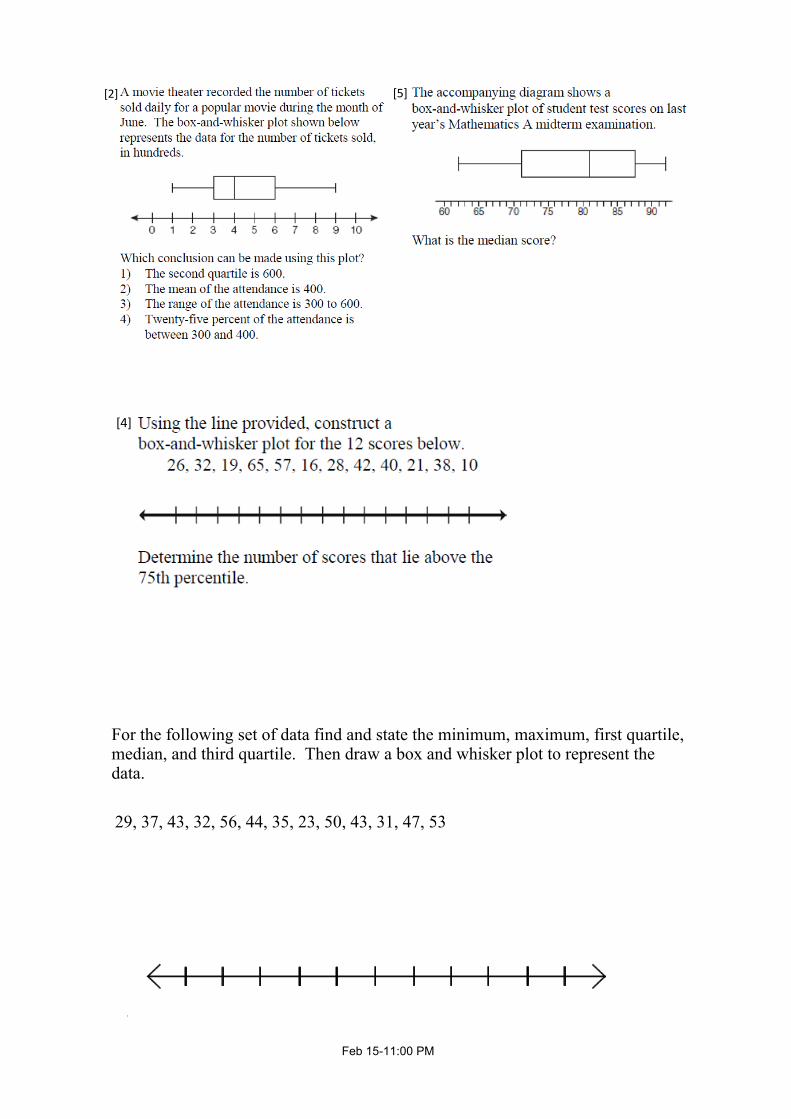
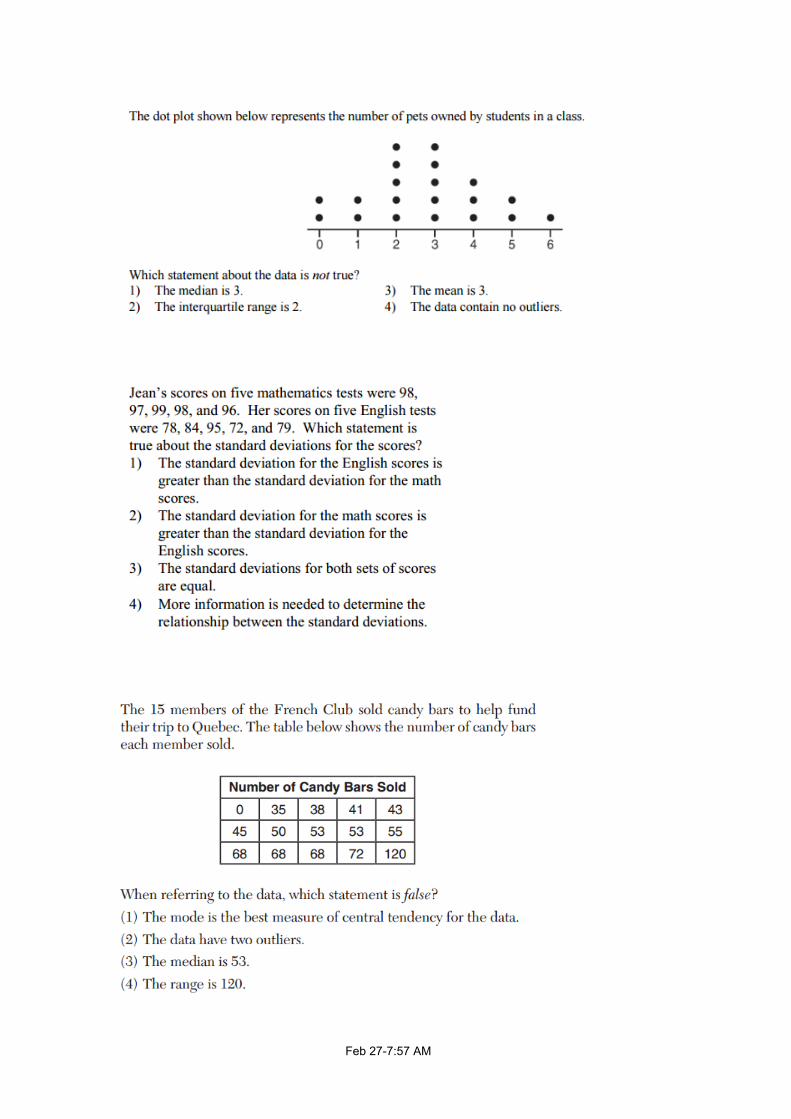
[3] What is the median of the set of data above?
DO NOW
[1] What is the range of the data?
[2] What is the mode of the data?
[4] What is the mean of the set of data above?
.
Feb 253:50 PM
xD

Feb 147:23 AM
.
Feb 147:23 AM
.
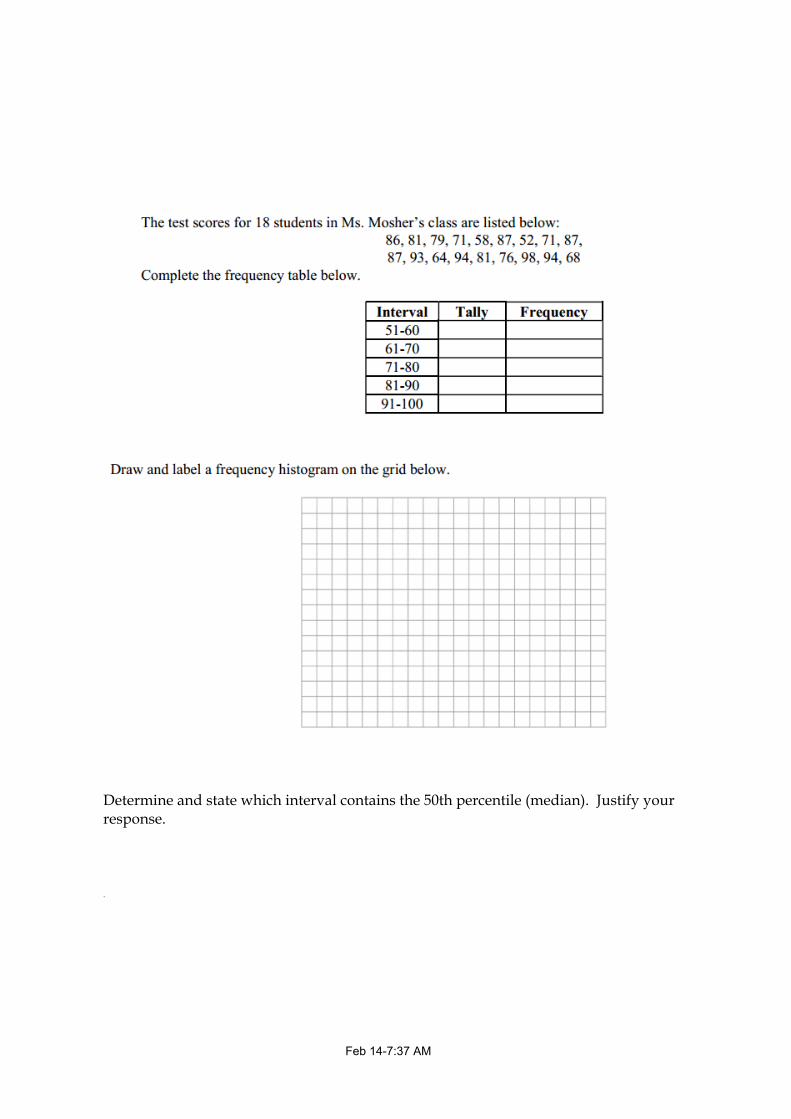
Feb 147:37 AM
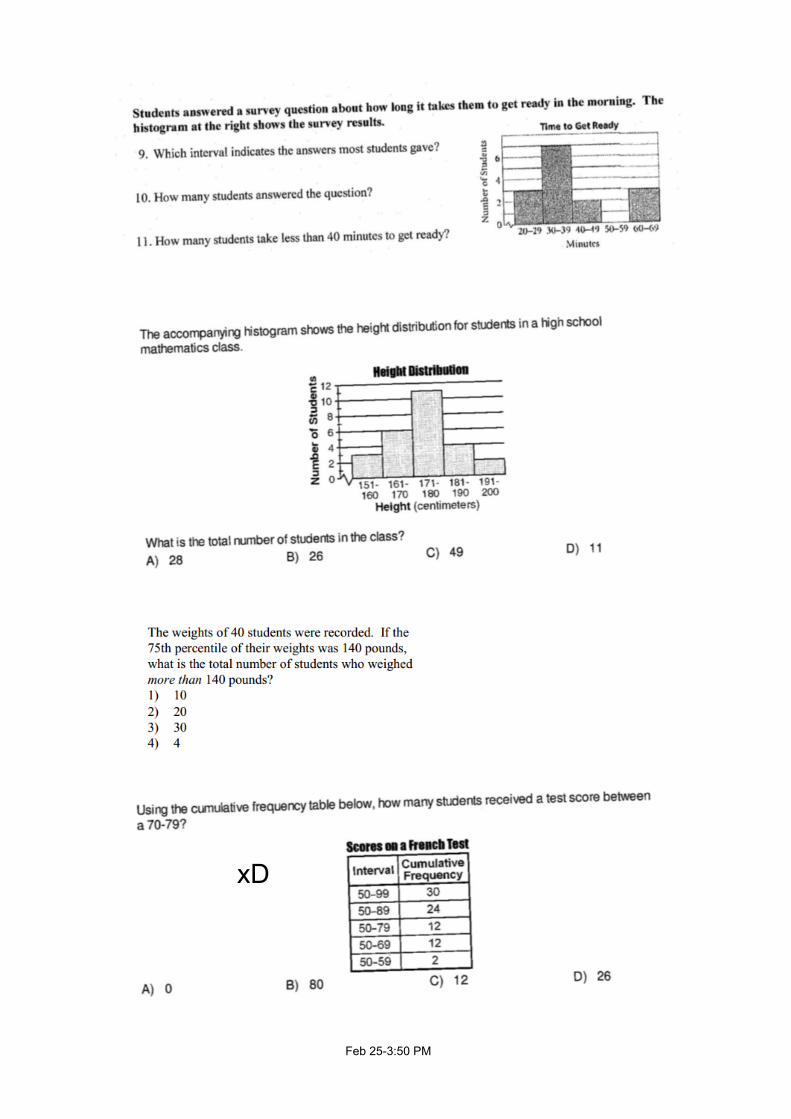
Determine and state which interval contains the 50th percentile (median). Justify your response.
.
Feb 157:49 PM
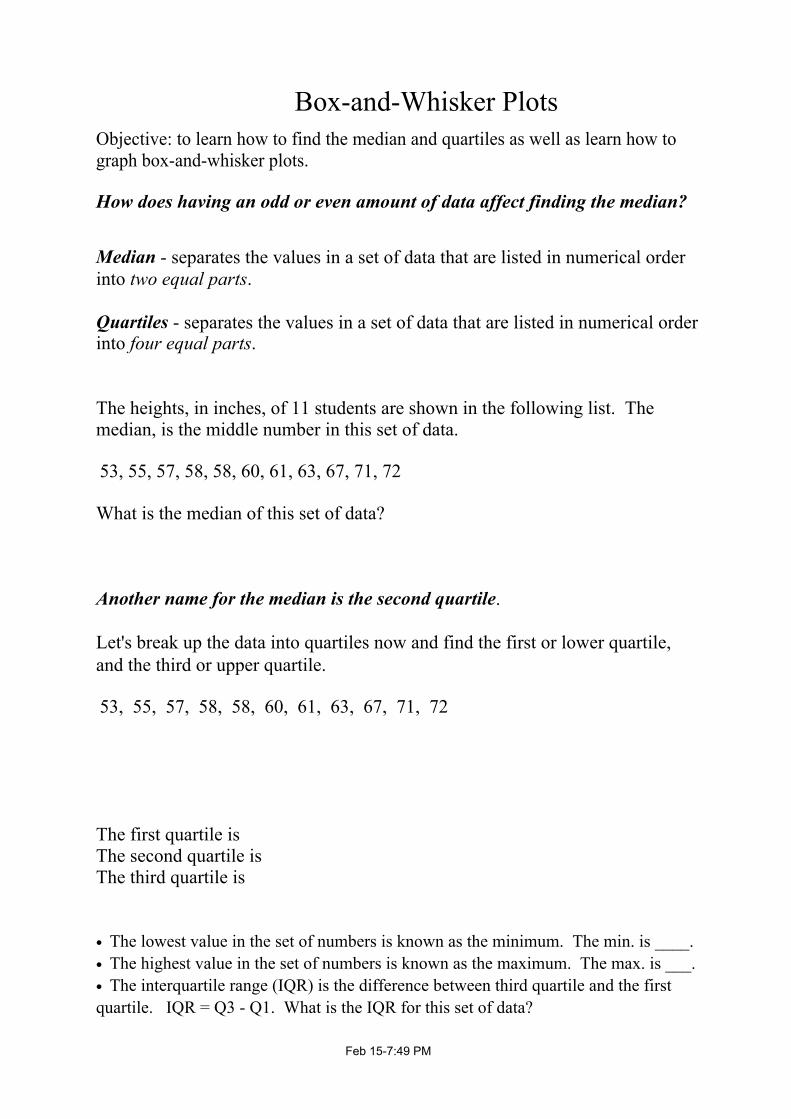
BoxandWhisker PlotsObjective: to learn how to find the median and quartiles as well as learn how to graph boxandwhisker plots.
Median separates the values in a set of data that are listed in numerical order into two equal parts.
Quartiles separates the values in a set of data that are listed in numerical order into four equal parts.
The heights, in inches, of 11 students are shown in the following list. The median, is the middle number in this set of data.
53, 55, 57, 58, 58, 60, 61, 63, 67, 71, 72
What is the median of this set of data?
Another name for the median is the second quartile.
Let's break up the data into quartiles now and find the first or lower quartile, and the third or upper quartile.
53, 55, 57, 58, 58, 60, 61, 63, 67, 71, 72
The first quartile is The second quartile isThe third quartile is
• The lowest value in the set of numbers is known as the minimum. The min. is ____.• The highest value in the set of numbers is known as the maximum. The max. is ___.• The interquartile range (IQR) is the difference between third quartile and the first quartile. IQR = Q3 Q1. What is the IQR for this set of data?
How does having an odd or even amount of data affect finding the median?
Feb 1510:48 PM
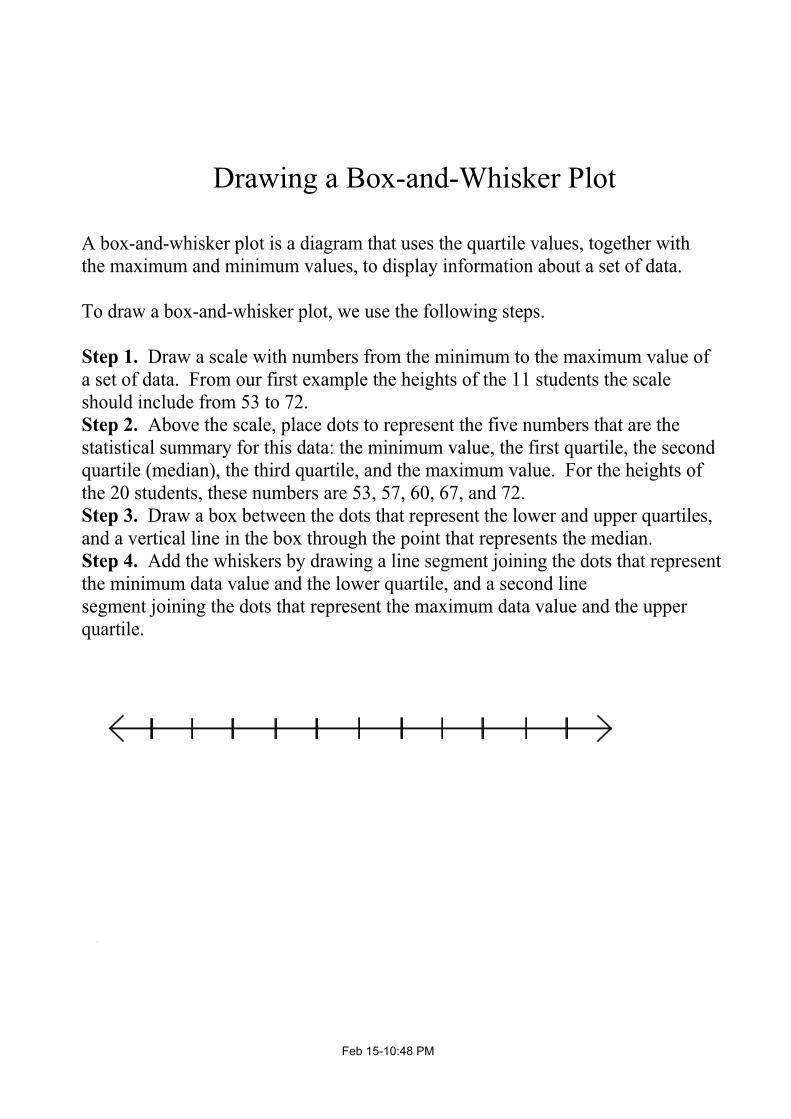
Drawing a BoxandWhisker Plot
A boxandwhisker plot is a diagram that uses the quartile values, together with the maximum and minimum values, to display information about a set of data.
To draw a boxandwhisker plot, we use the following steps.
Step 1. Draw a scale with numbers from the minimum to the maximum value of a set of data. From our first example the heights of the 11 students the scale should include from 53 to 72.Step 2. Above the scale, place dots to represent the five numbers that are the statistical summary for this data: the minimum value, the first quartile, the second quartile (median), the third quartile, and the maximum value. For the heights of the 20 students, these numbers are 53, 57, 60, 67, and 72.Step 3. Draw a box between the dots that represent the lower and upper quartiles, and a vertical line in the box through the point that represents the median.Step 4. Add the whiskers by drawing a line segment joining the dots that represent the minimum data value and the lower quartile, and a second line segment joining the dots that represent the maximum data value and the upper quartile.
.
Feb 1510:51 PM
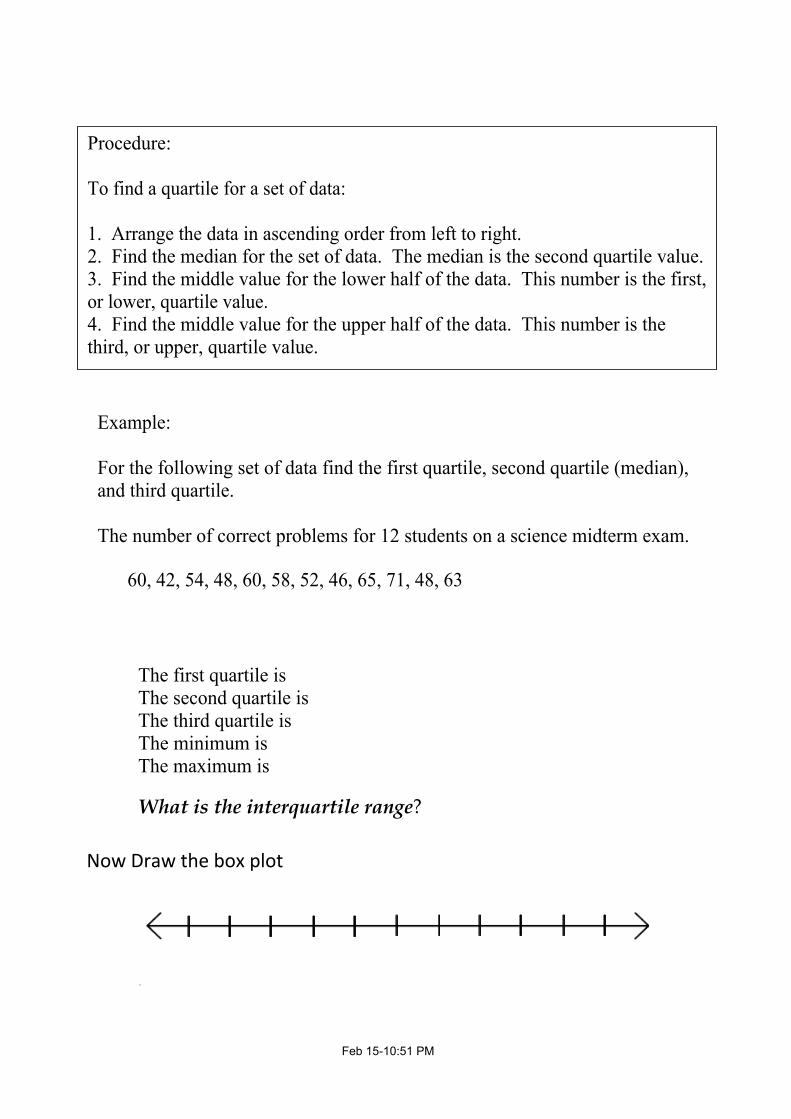
Procedure:
To find a quartile for a set of data:
1. Arrange the data in ascending order from left to right.2. Find the median for the set of data. The median is the second quartile value.3. Find the middle value for the lower half of the data. This number is the first, or lower, quartile value.4. Find the middle value for the upper half of the data. This number is the third, or upper, quartile value.
Example:
For the following set of data find the first quartile, second quartile (median), and third quartile.
The number of correct problems for 12 students on a science midterm exam.
60, 42, 54, 48, 60, 58, 52, 46, 65, 71, 48, 63
The first quartile is The second quartile isThe third quartile isThe minimum isThe maximum is
Now Draw the box plot
.
What is the interquartile range?
Feb 1510:53 PM
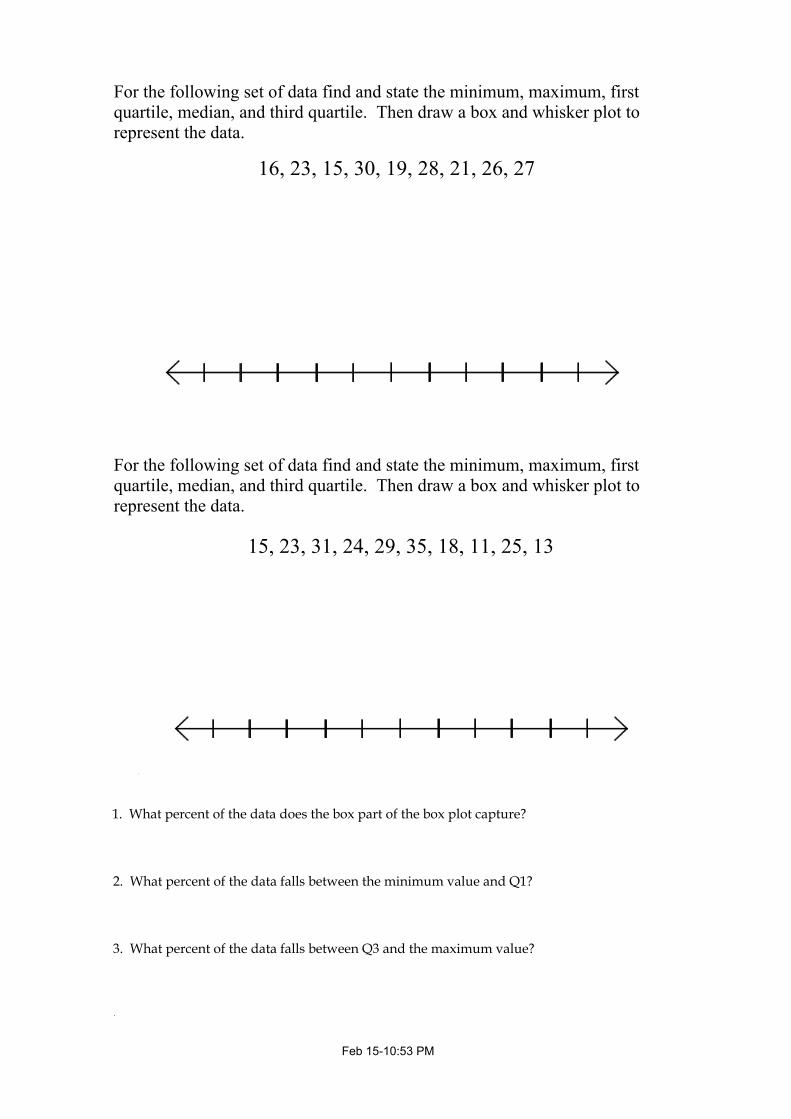
For the following set of data find and state the minimum, maximum, first quartile, median, and third quartile. Then draw a box and whisker plot to represent the data.
16, 23, 15, 30, 19, 28, 21, 26, 27
For the following set of data find and state the minimum, maximum, first quartile, median, and third quartile. Then draw a box and whisker plot to represent the data.
15, 23, 31, 24, 29, 35, 18, 11, 25, 13
.
1. What percent of the data does the box part of the box plot capture?
2. What percent of the data falls between the minimum value and Q1?
3. What percent of the data falls between Q3 and the maximum value?
.
Feb 1510:57 PM
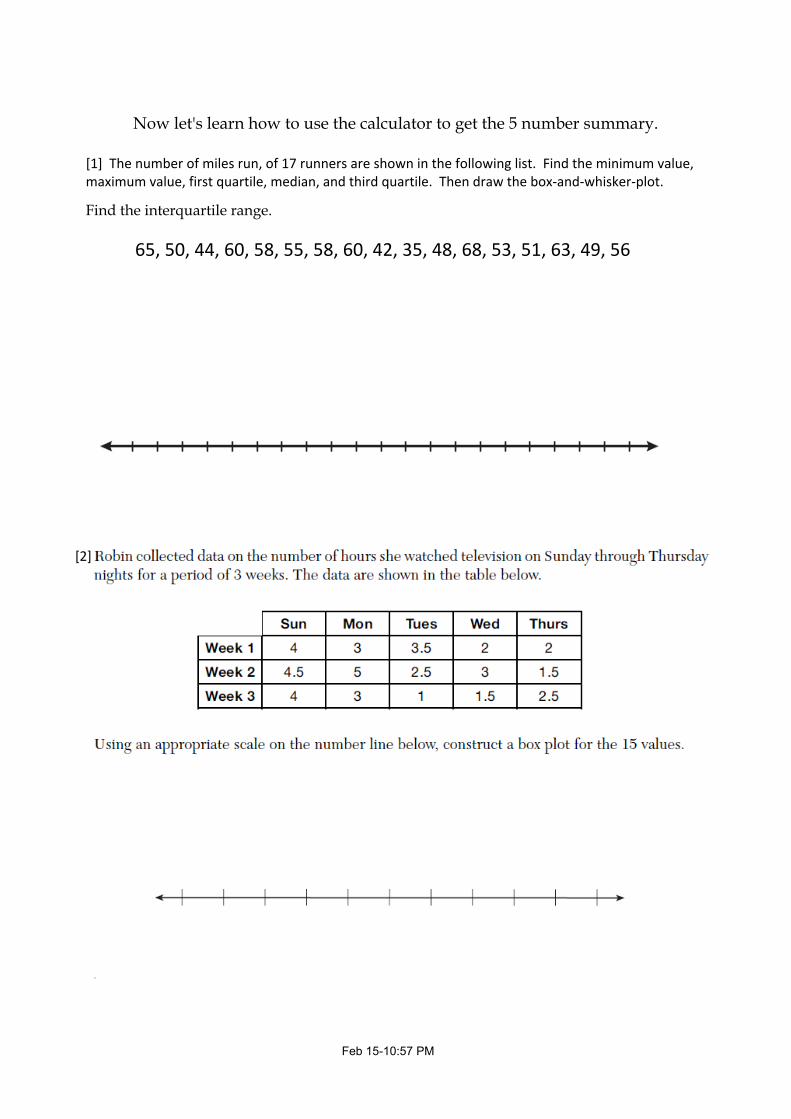
65, 50, 44, 60, 58, 55, 58, 60, 42, 35, 48, 68, 53, 51, 63, 49, 56
[1] The number of miles run, of 17 runners are shown in the following list. Find the minimum value, maximum value, first quartile, median, and third quartile. Then draw the box‐and‐whisker‐plot.
[2]
.
Now let's learn how to use the calculator to get the 5 number summary.
Find the interquartile range.
Feb 1511:19 PM
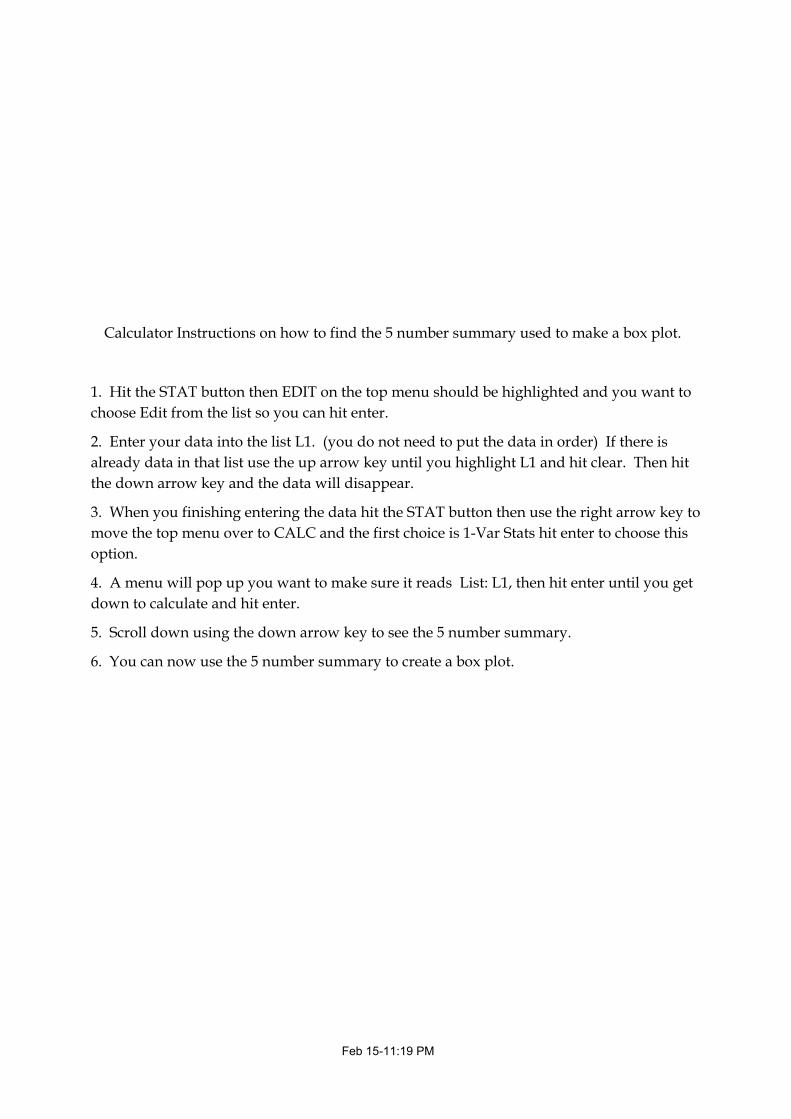
Calculator Instructions on how to find the 5 number summary used to make a box plot.
1. Hit the STAT button then EDIT on the top menu should be highlighted and you want to choose Edit from the list so you can hit enter.
2. Enter your data into the list L1. (you do not need to put the data in order) If there is already data in that list use the up arrow key until you highlight L1 and hit clear. Then hit the down arrow key and the data will disappear.
3. When you finishing entering the data hit the STAT button then use the right arrow key to move the top menu over to CALC and the first choice is 1Var Stats hit enter to choose this option.
4. A menu will pop up you want to make sure it reads List: L1, then hit enter until you get down to calculate and hit enter.
5. Scroll down using the down arrow key to see the 5 number summary.
6. You can now use the 5 number summary to create a box plot.
Feb 1510:58 PM
[3]
[1] [2]
[4]
.
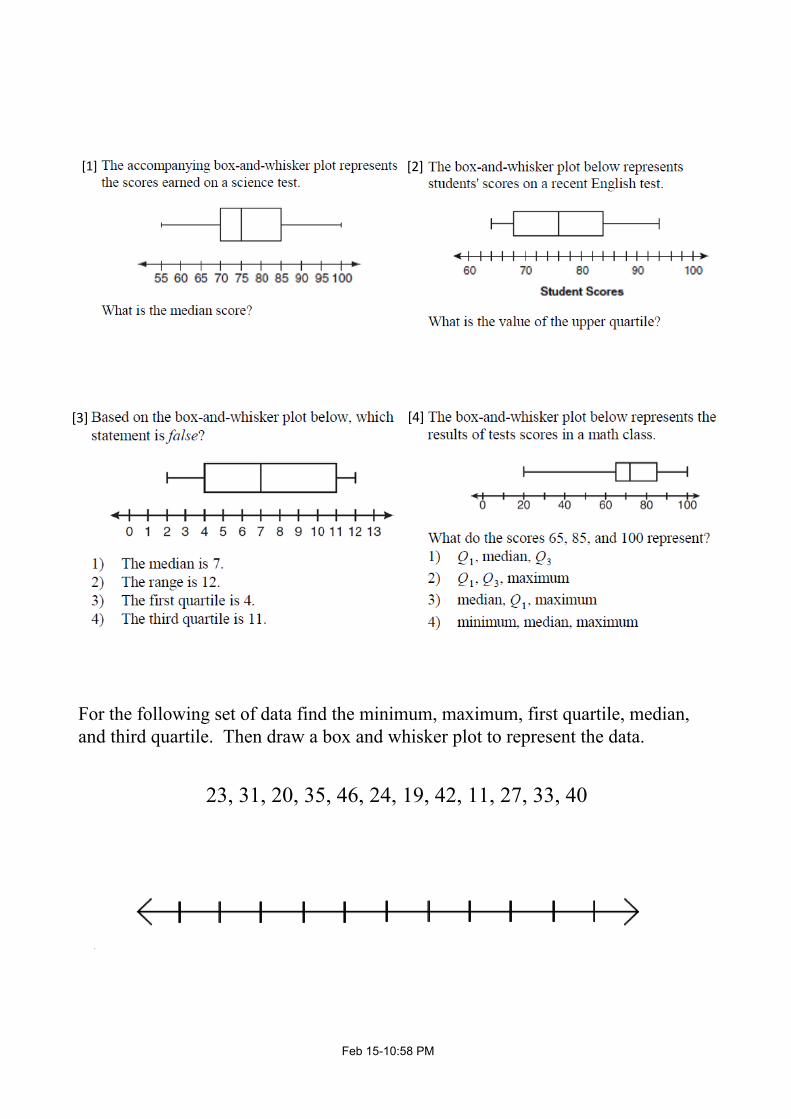
For the following set of data find the minimum, maximum, first quartile, median, and third quartile. Then draw a box and whisker plot to represent the data.
23, 31, 20, 35, 46, 24, 19, 42, 11, 27, 33, 40
Feb 1511:00 PM
[2]
[4]
.
[5]
For the following set of data find and state the minimum, maximum, first quartile, median, and third quartile. Then draw a box and whisker plot to represent the data.
29, 37, 43, 32, 56, 44, 35, 23, 50, 43, 31, 47, 53
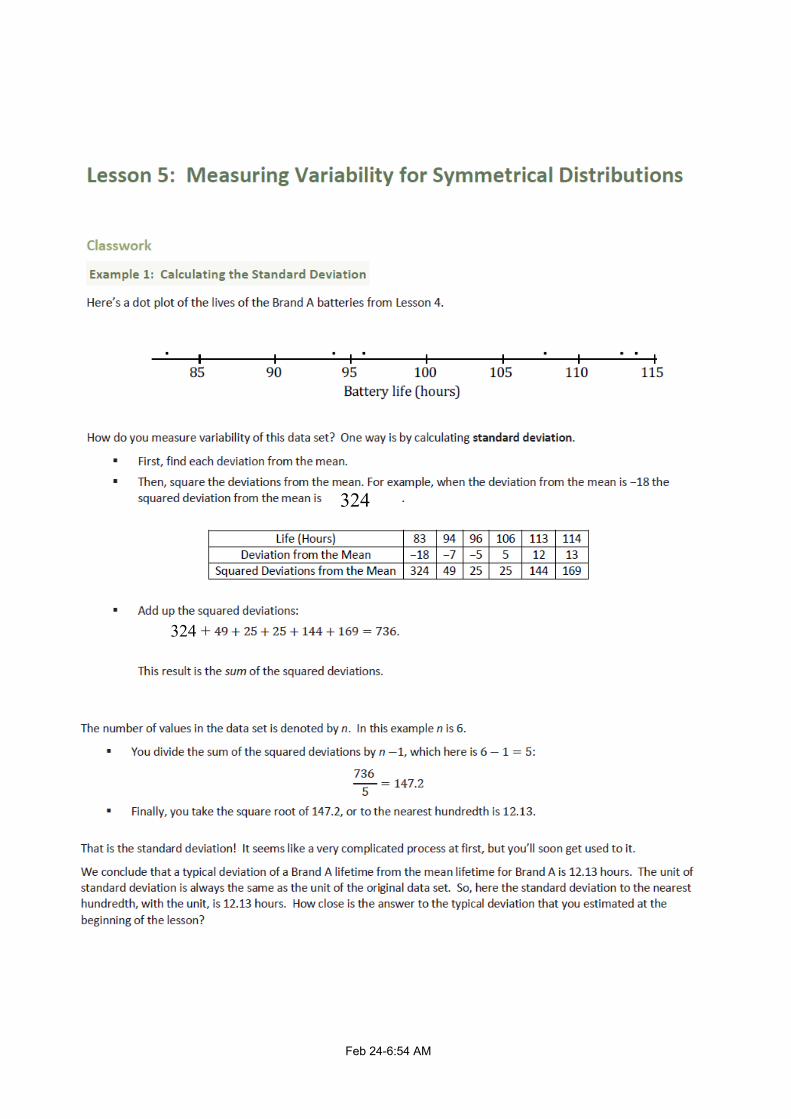
Feb 246:54 AM
324
324 +
Feb 246:56 AM
.
Feb 246:57 AM
.
Feb 246:58 AM

Feb 246:59 AM
.
Feb 246:59 AM
.
Feb 256:49 AM
Feb 242:54 PM
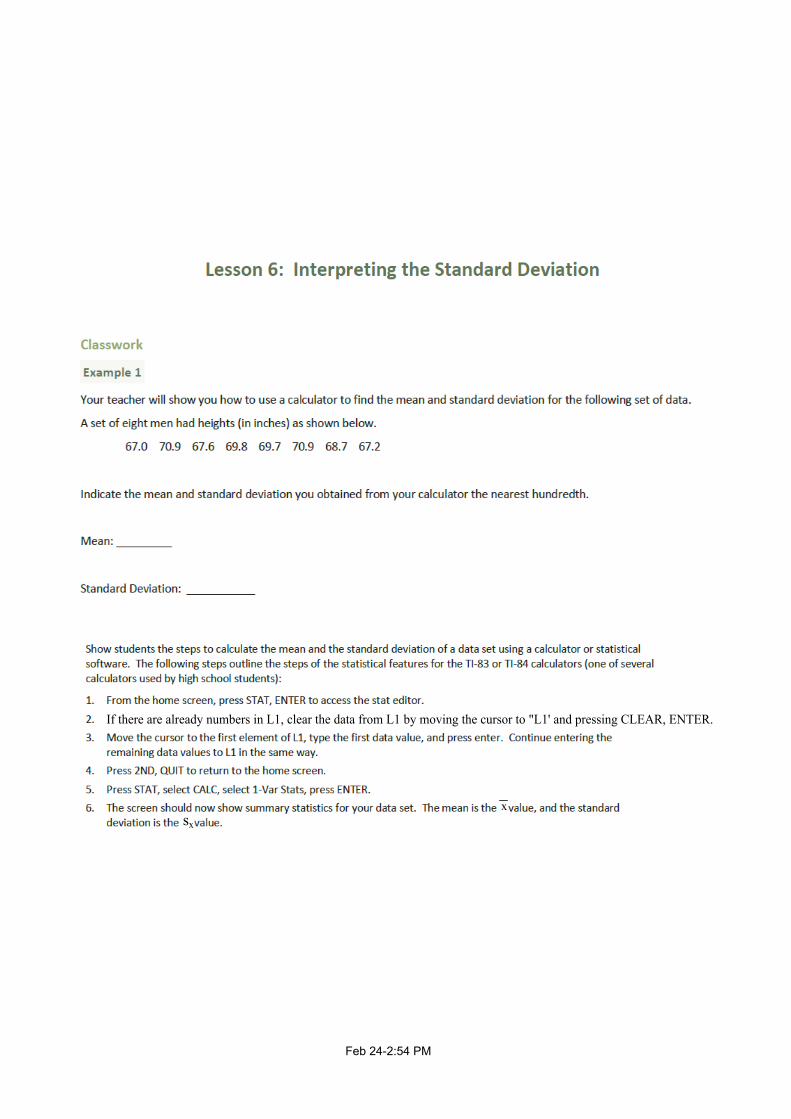
If there are already numbers in L1, clear the data from L1 by moving the cursor to "L1' and pressing CLEAR, ENTER.
xsx
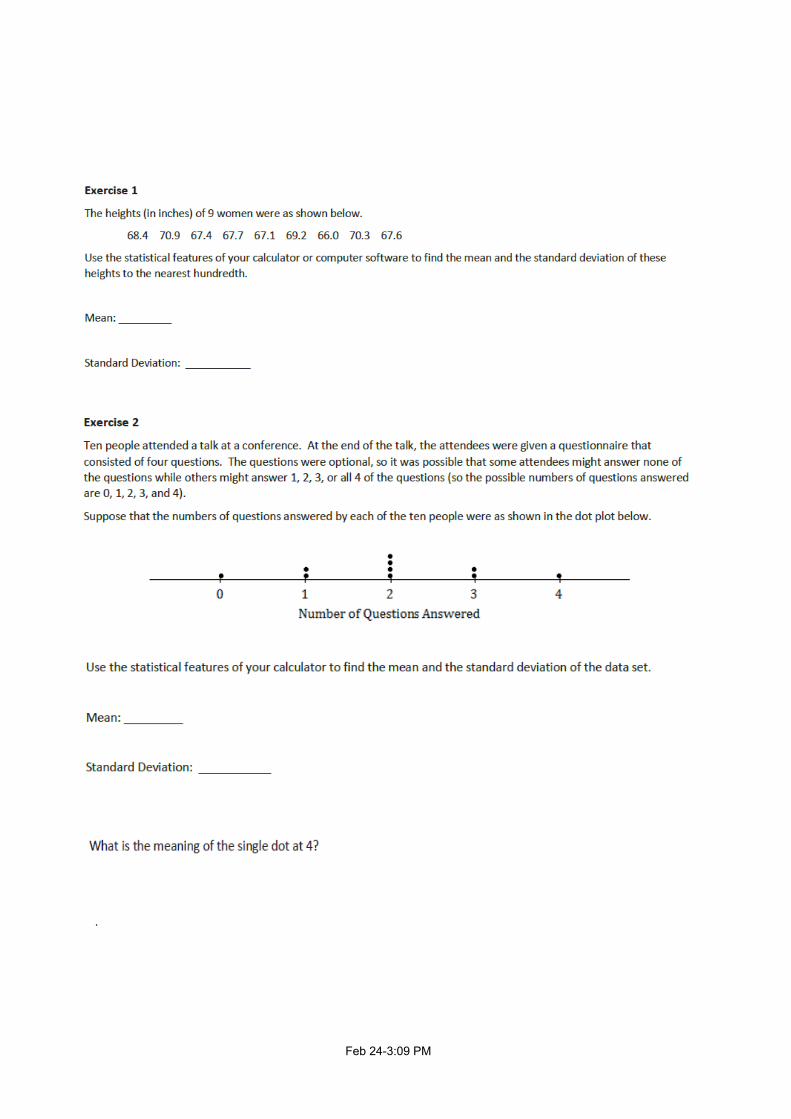
Feb 243:09 PM
.
Feb 243:11 PM
.
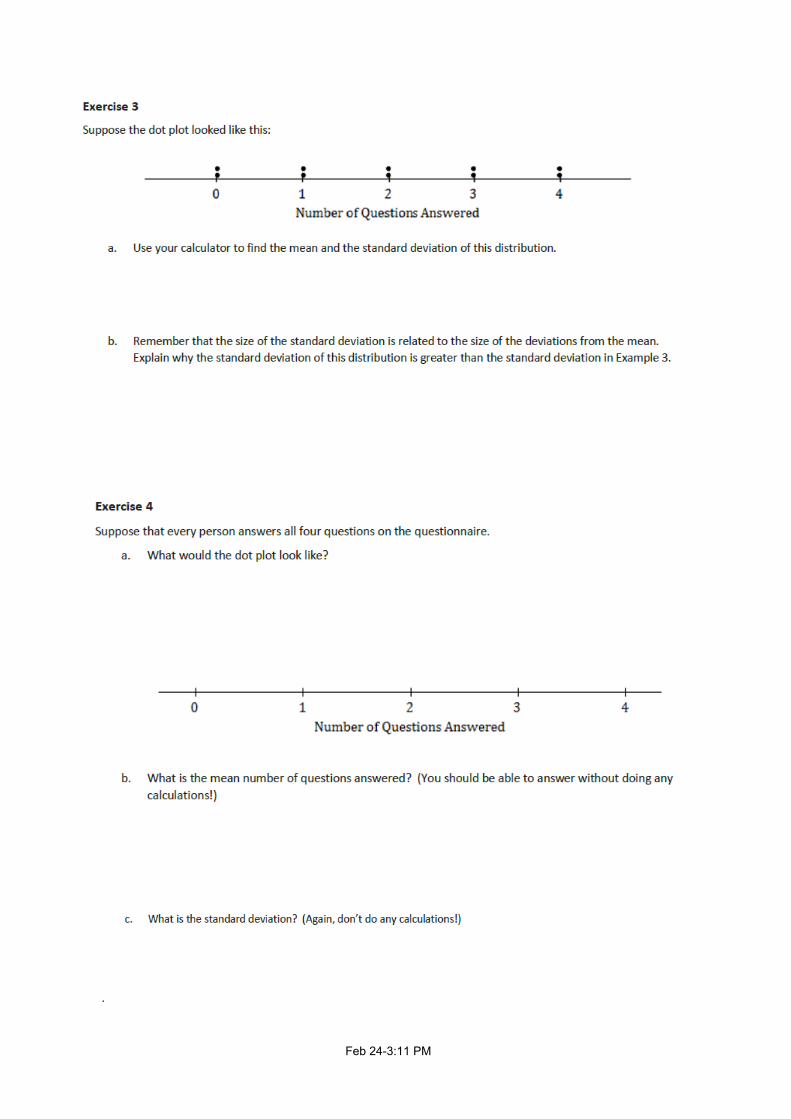
Feb 243:18 PM
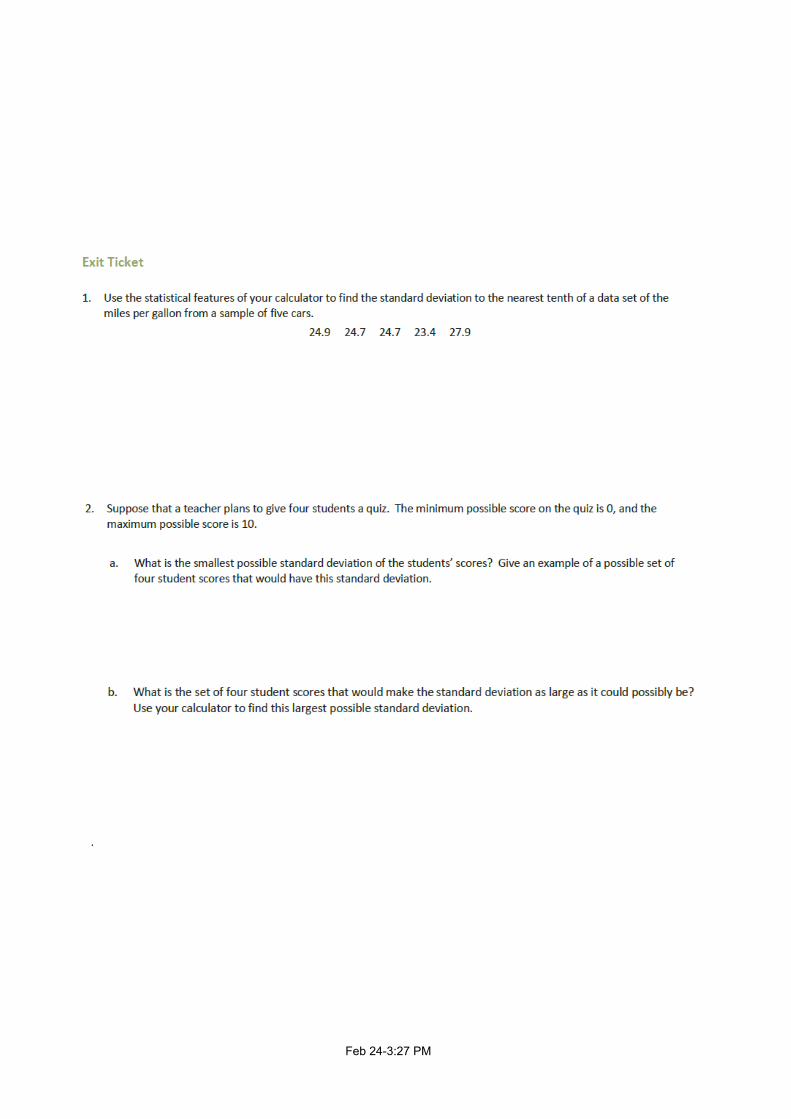
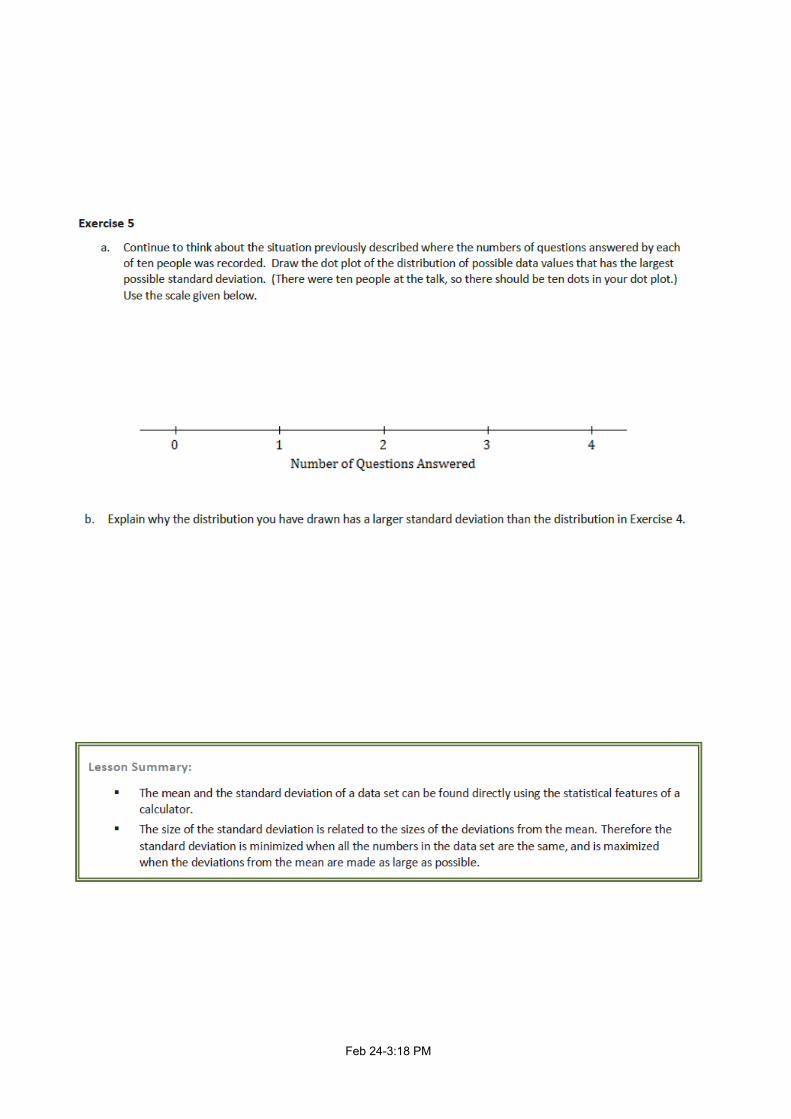
Feb 243:27 PM
.
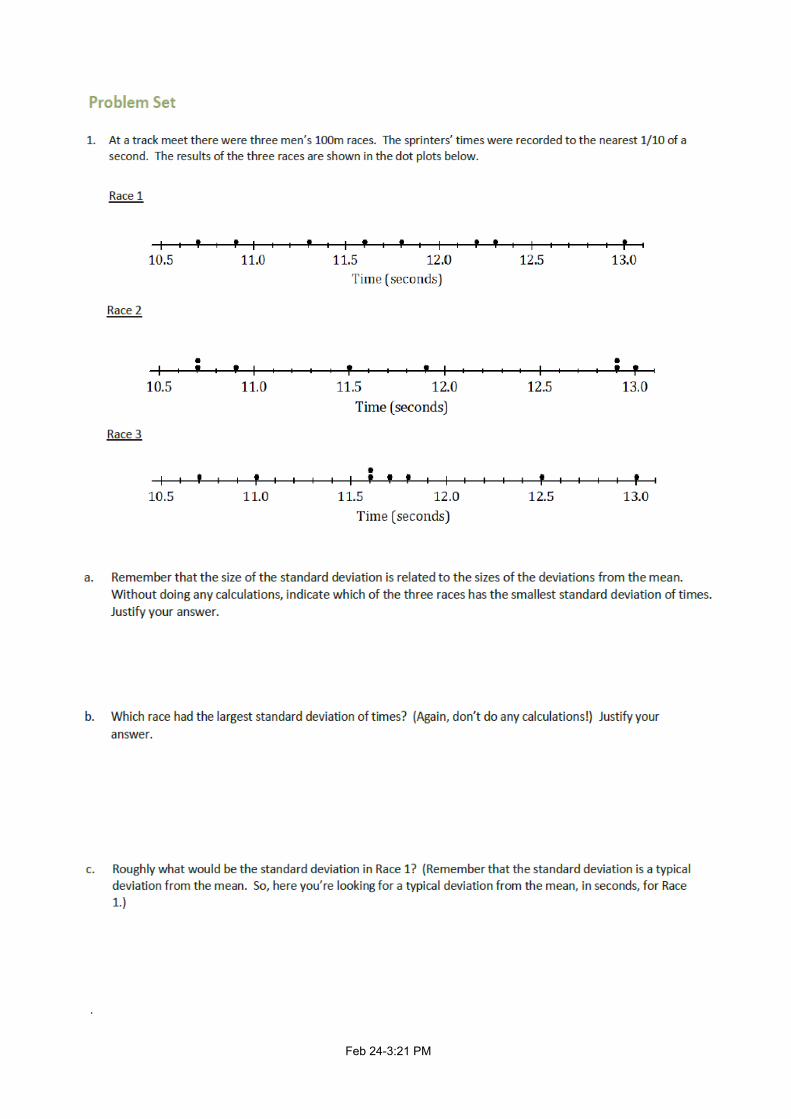
Feb 243:21 PM
.
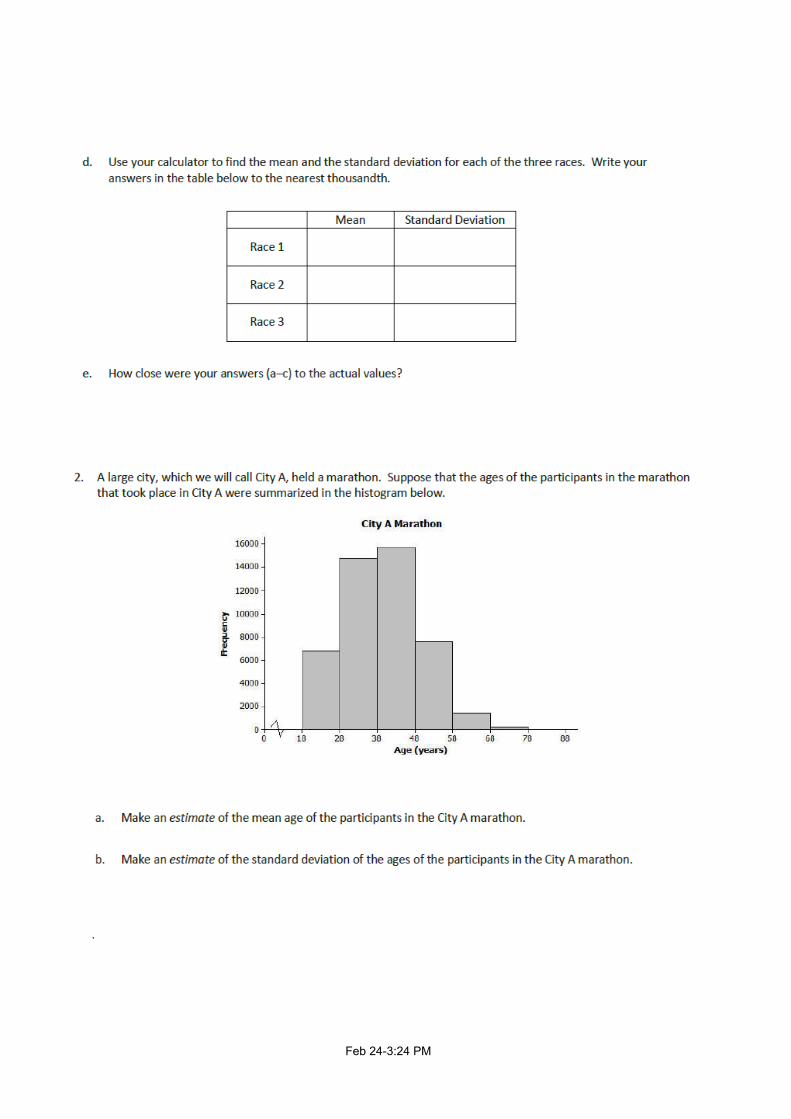
Feb 243:24 PM
.
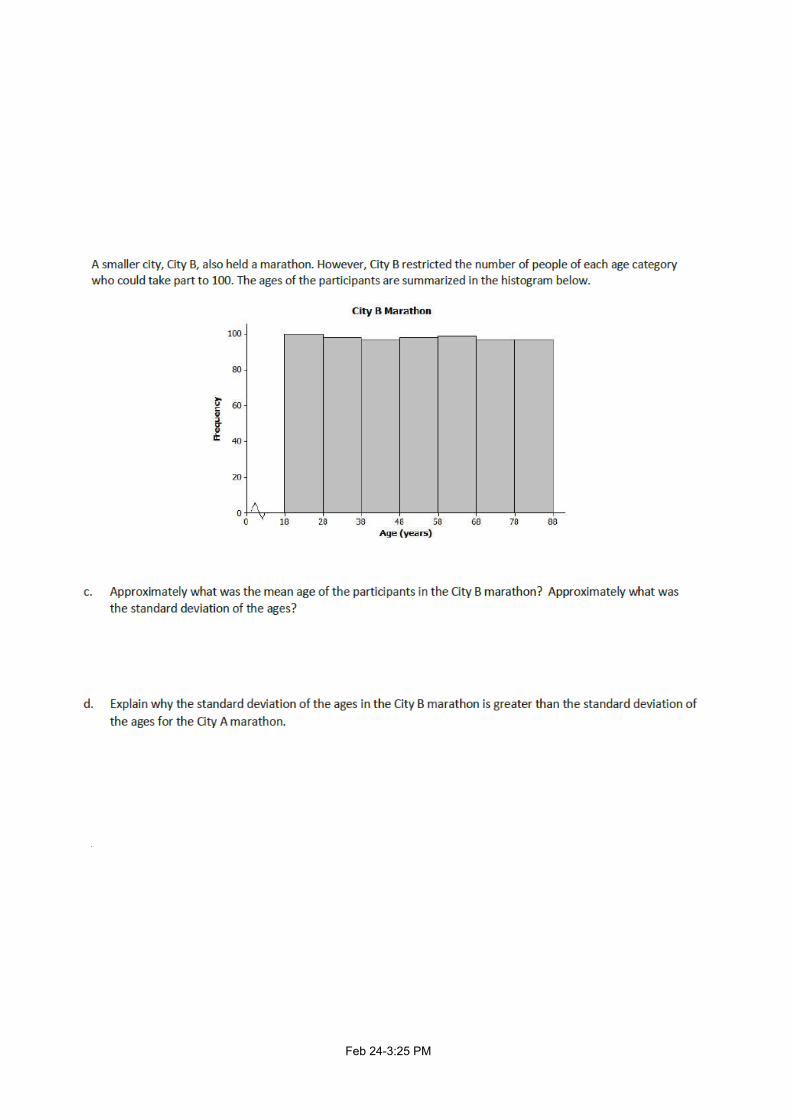
Feb 243:25 PM
.
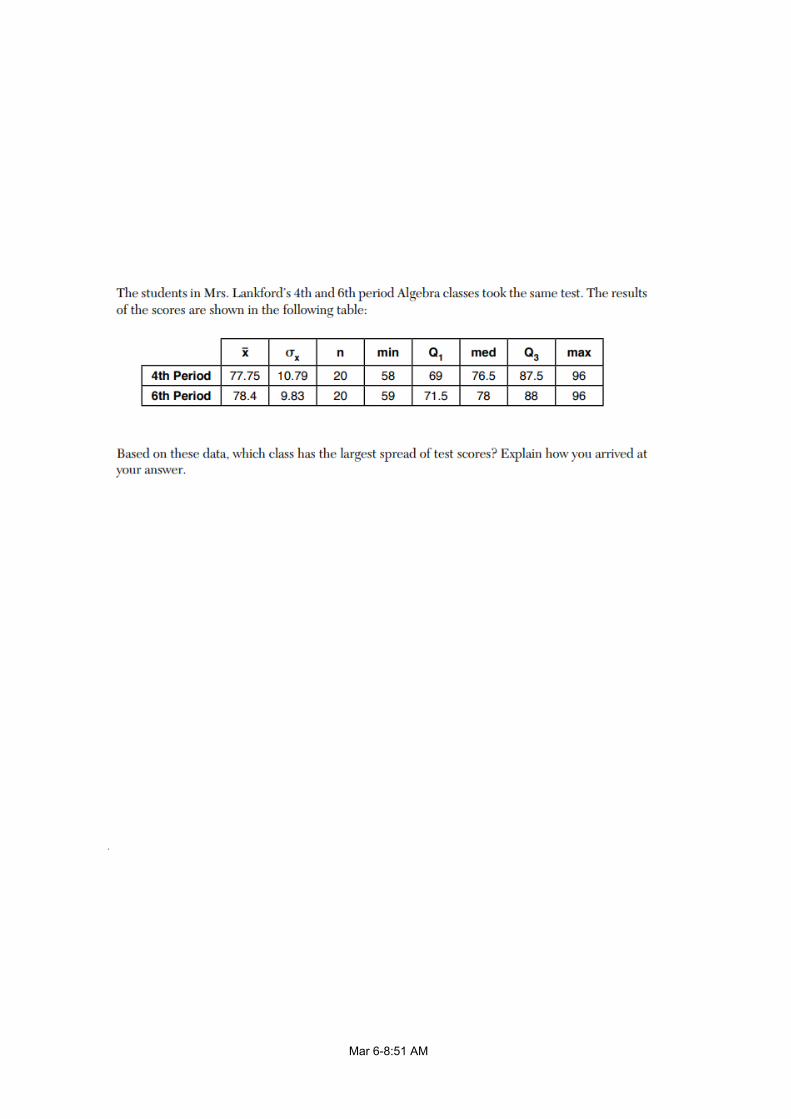
Mar 68:51 AM
.
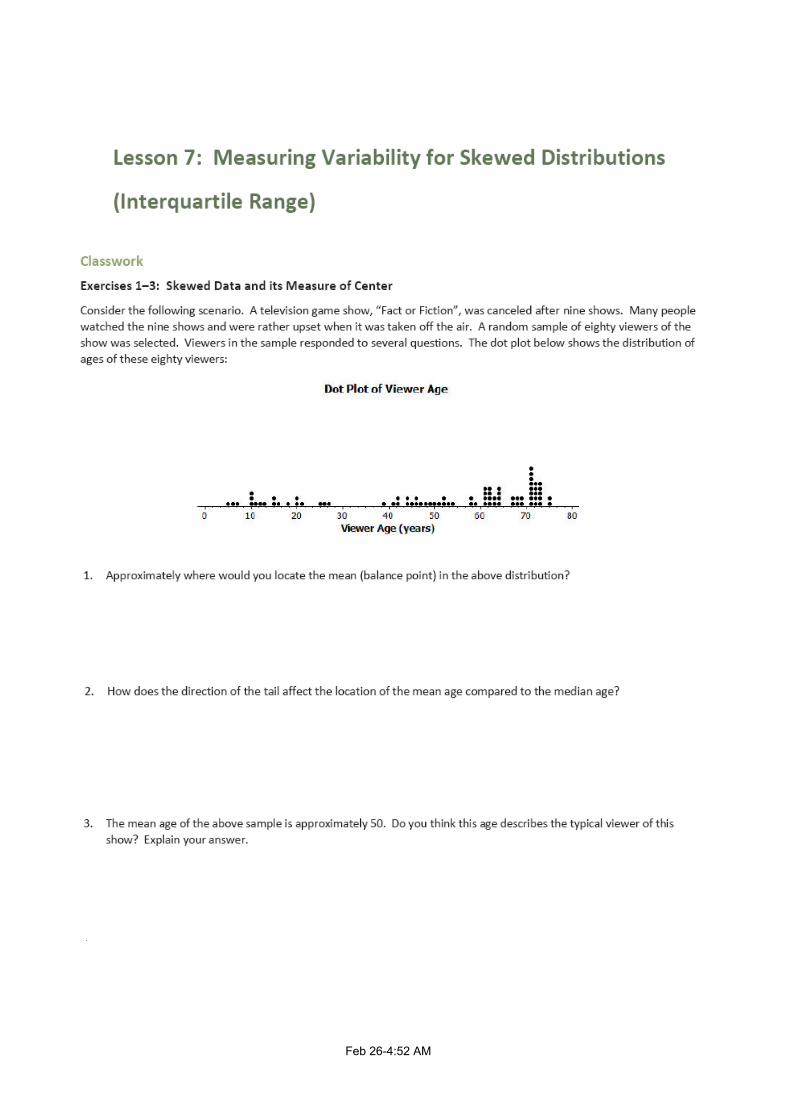
Feb 264:52 AM
.
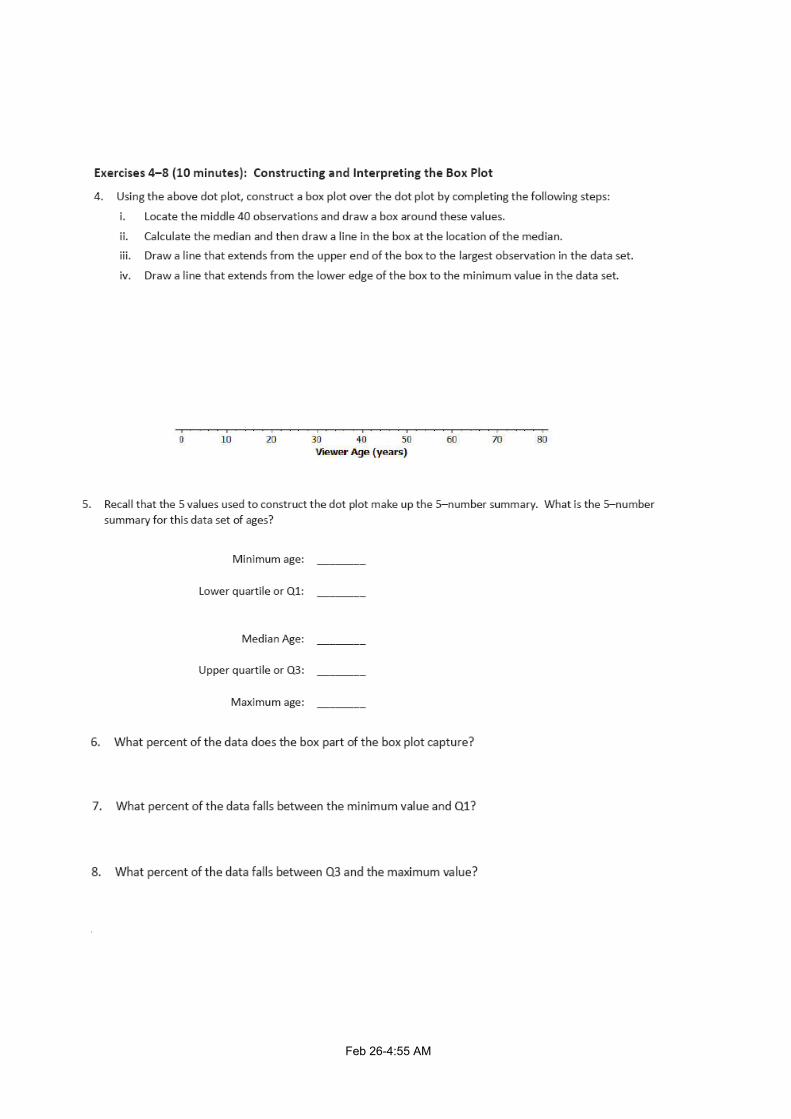
Feb 264:55 AM
.
Feb 265:02 AM
.
Feb 265:06 AM
.
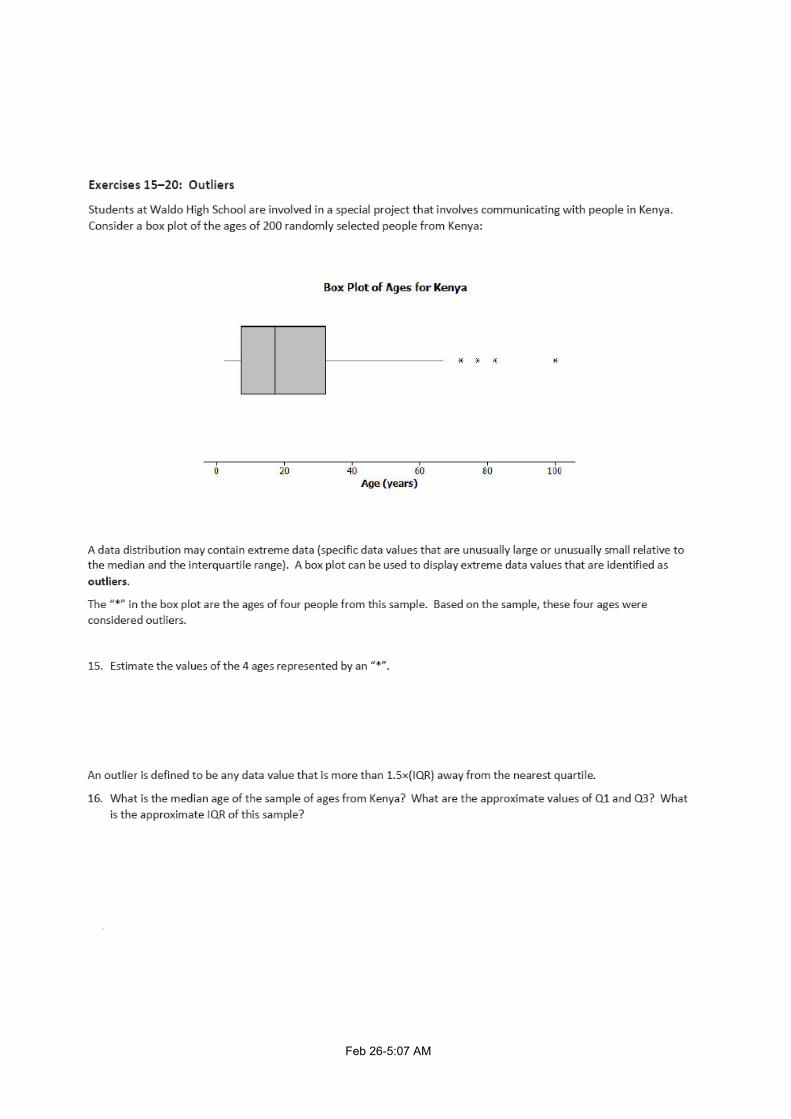
Feb 265:07 AM
.
Feb 265:08 AM
Feb 265:20 AM
.
Feb 265:10 AM
Feb 265:13 AM
.
Feb 265:15 AM
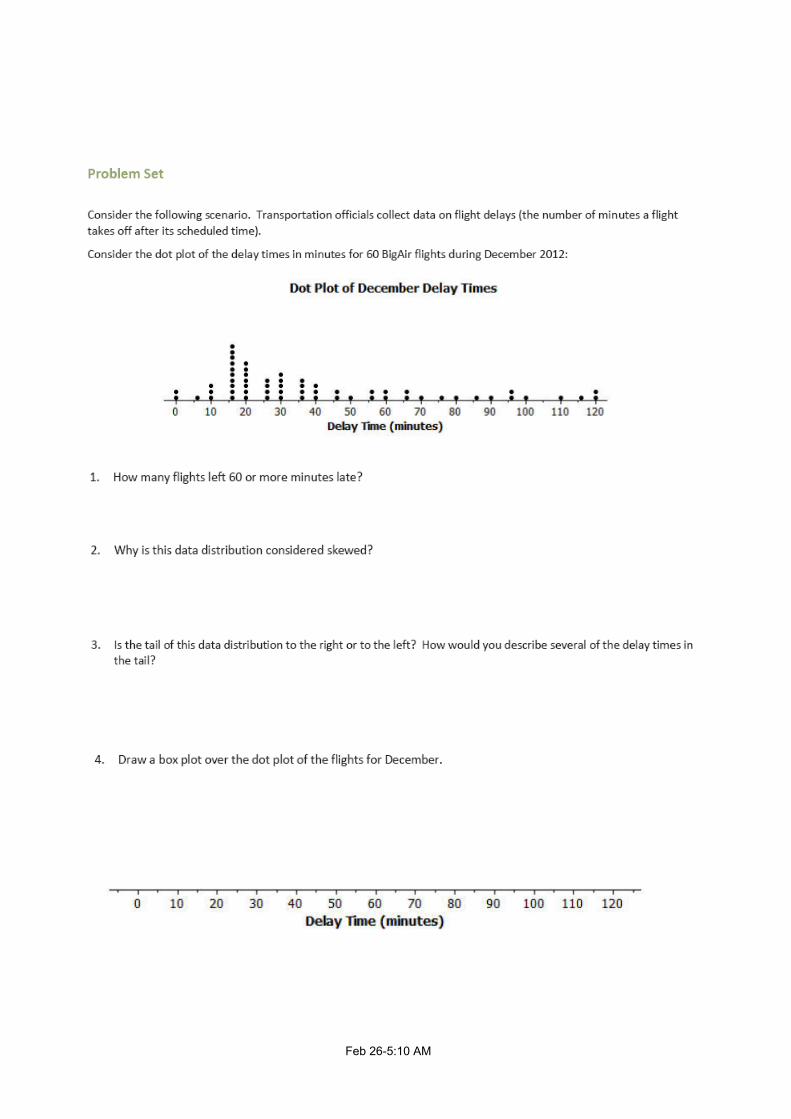
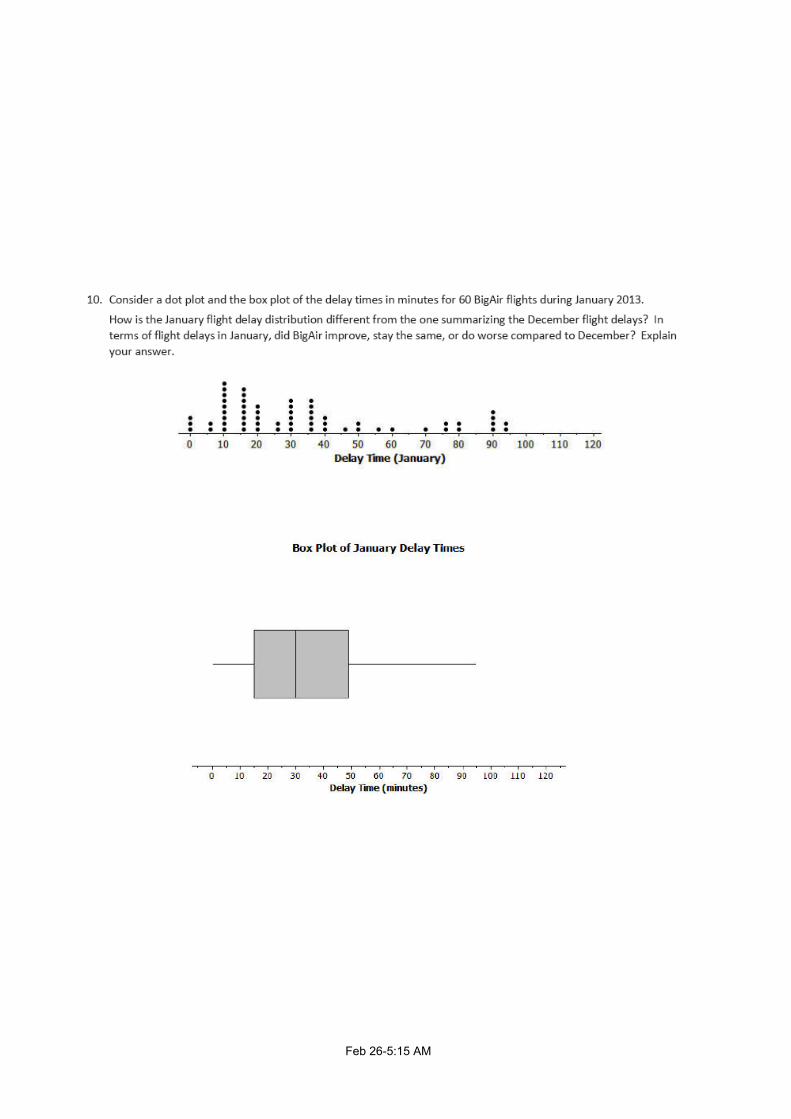
Feb 278:43 AM
Feb 278:54 AM
Feb 278:56 AM
.
Feb 278:58 AM
Feb 279:07 AM
.
Mar 54:32 AM
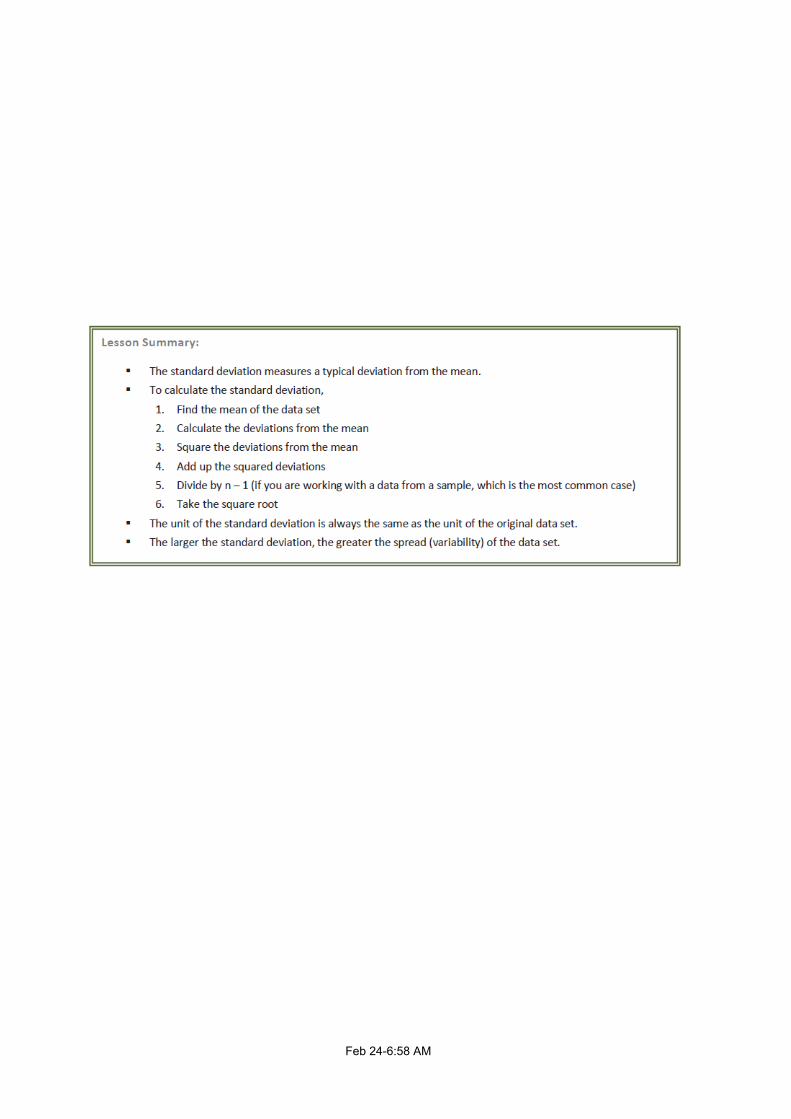
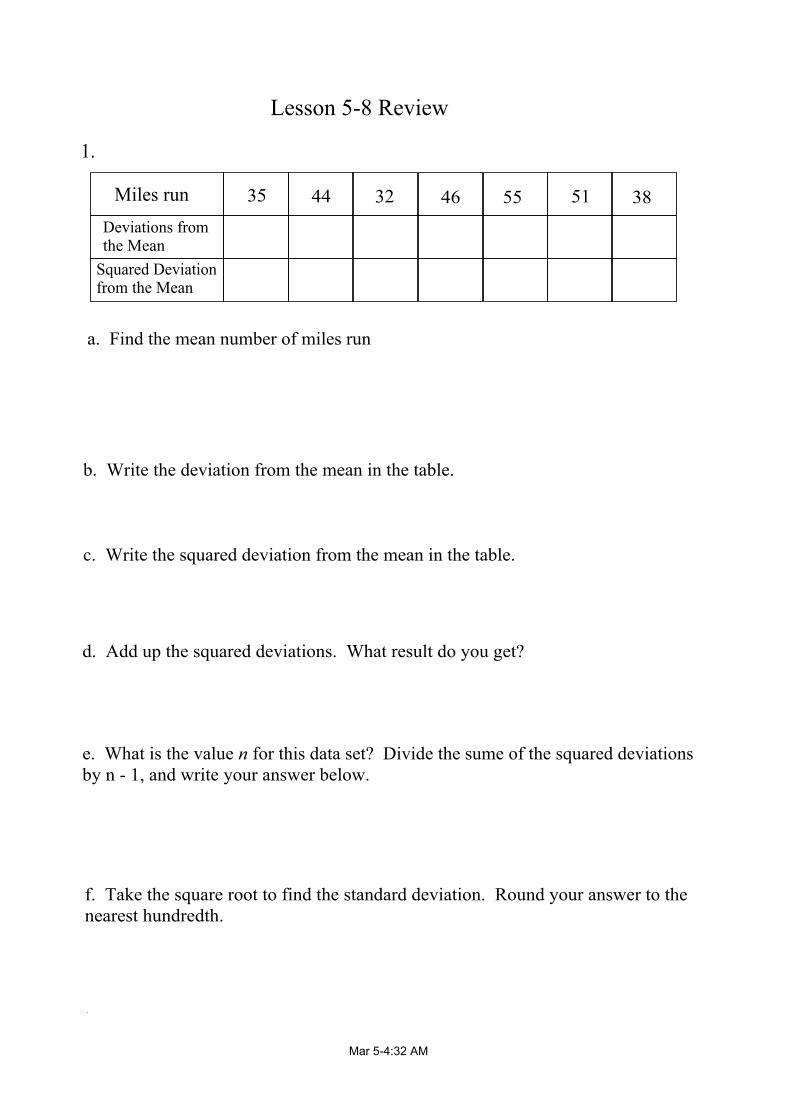
Lesson 58 Review
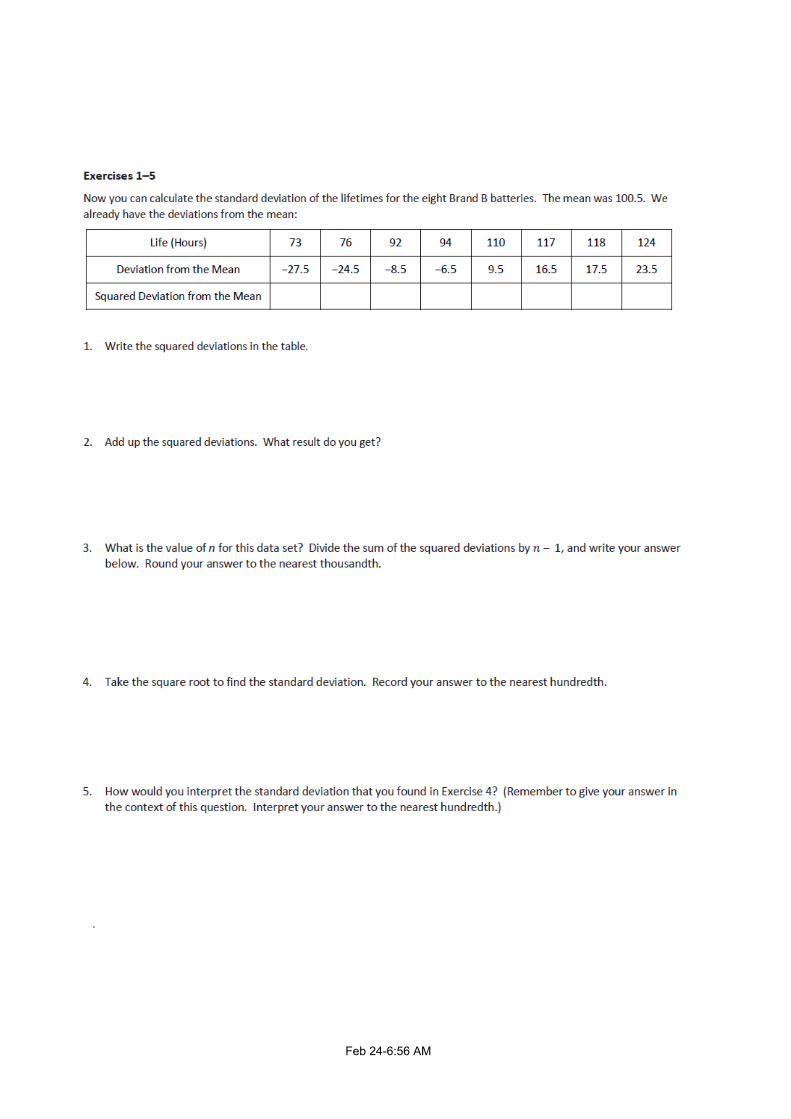
Miles runDeviations fromthe MeanSquared Deviationfrom the Mean
1.
a. Find the mean number of miles run
b. Write the deviation from the mean in the table.
c. Write the squared deviation from the mean in the table.
d. Add up the squared deviations. What result do you get?
e. What is the value n for this data set? Divide the sume of the squared deviations by n 1, and write your answer below.
f. Take the square root to find the standard deviation. Round your answer to the nearest hundredth.
.
35 44 32 46 55 51 38
Mar 55:51 AM
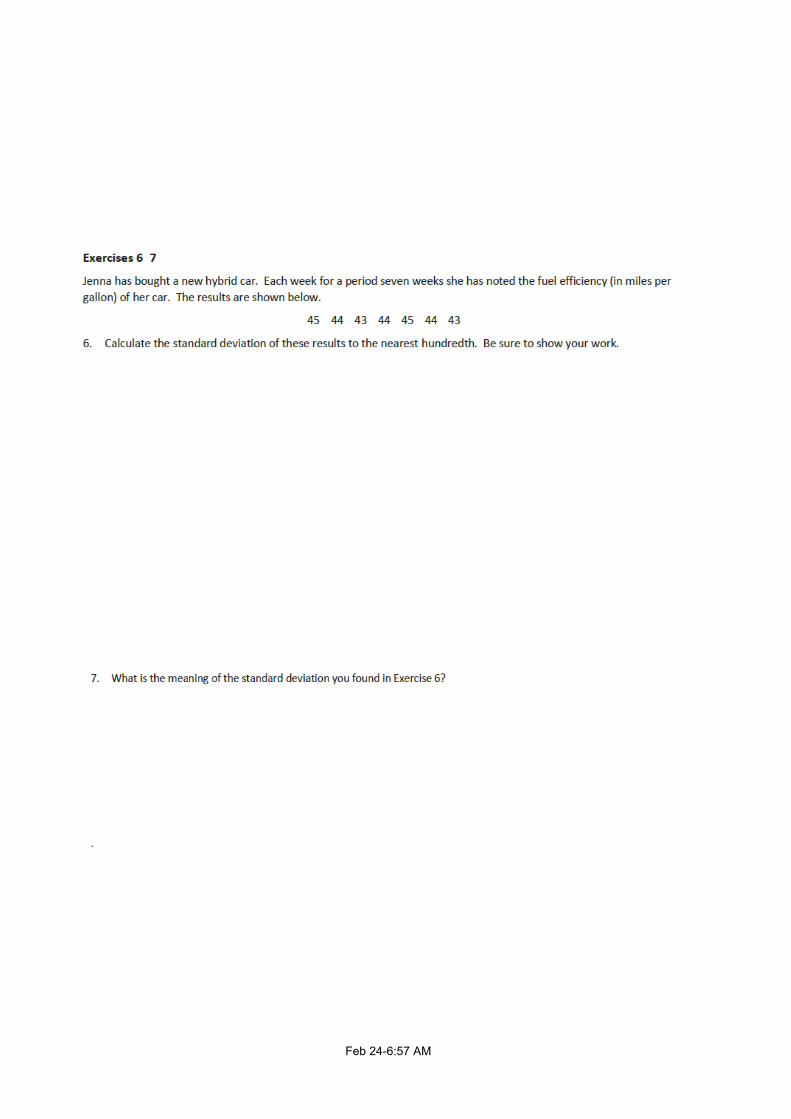
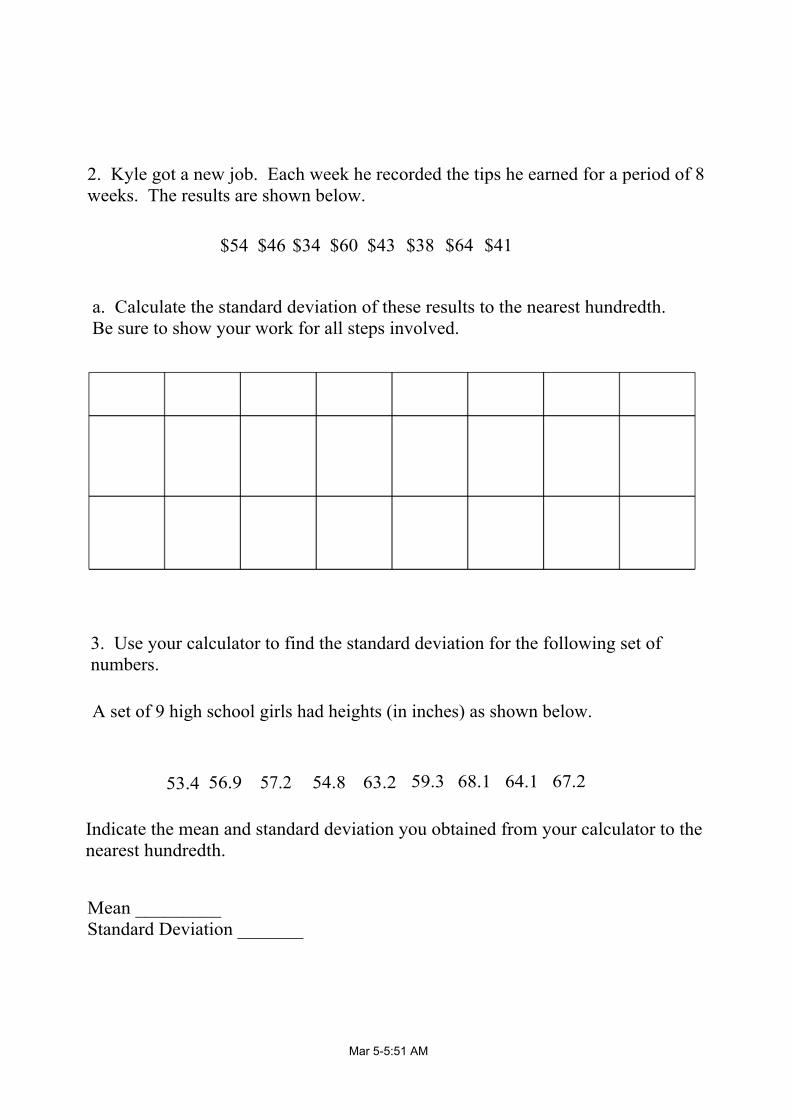
2. Kyle got a new job. Each week he recorded the tips he earned for a period of 8 weeks. The results are shown below.
$54 $46 $34 $60 $43 $38 $64 $41
a. Calculate the standard deviation of these results to the nearest hundredth. Be sure to show your work for all steps involved.
3. Use your calculator to find the standard deviation for the following set of numbers.
A set of 9 high school girls had heights (in inches) as shown below.
53.4 56.9 57.2 54.8 63.2 64.168.159.3 67.2
Indicate the mean and standard deviation you obtained from your calculator to the nearest hundredth.
Mean _________Standard Deviation _______
Mar 56:11 AM
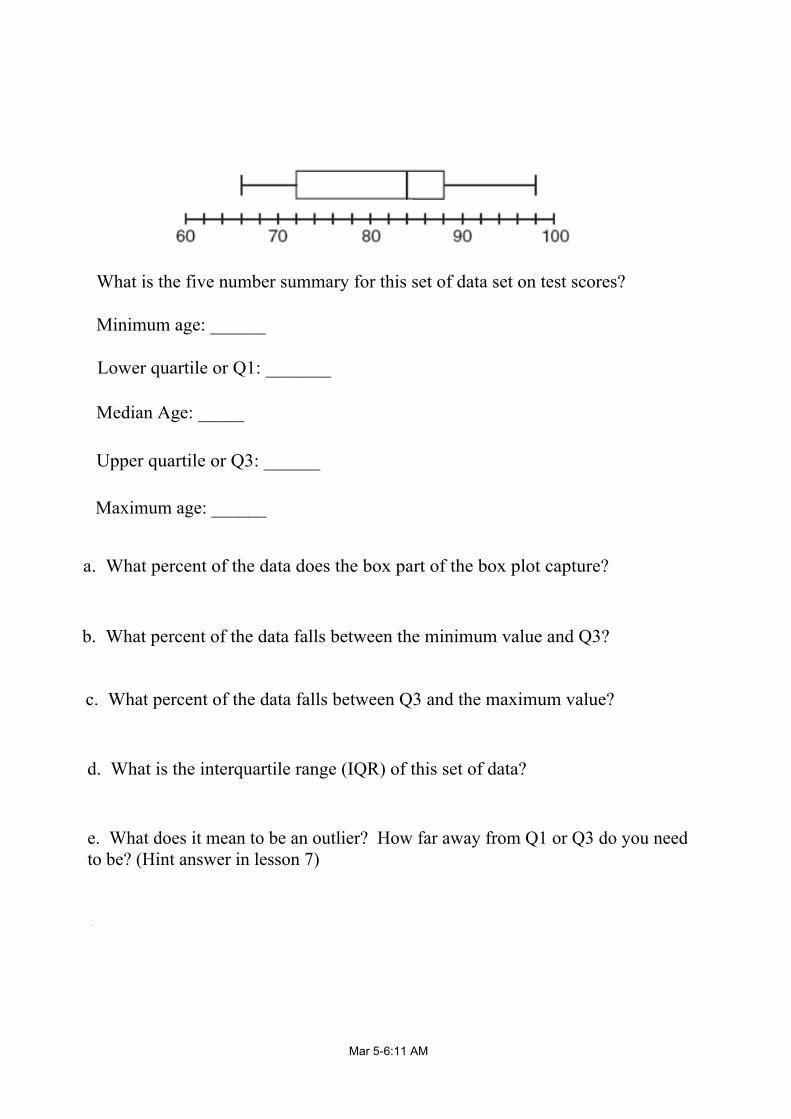
What is the five number summary for this set of data set on test scores?
Minimum age: ______
Lower quartile or Q1: _______
Median Age: _____
Upper quartile or Q3: ______
Maximum age: ______
a. What percent of the data does the box part of the box plot capture?
b. What percent of the data falls between the minimum value and Q3?
c. What percent of the data falls between Q3 and the maximum value?
d. What is the interquartile range (IQR) of this set of data?
e. What does it mean to be an outlier? How far away from Q1 or Q3 do you need to be? (Hint answer in lesson 7)
.
Mar 56:44 AM
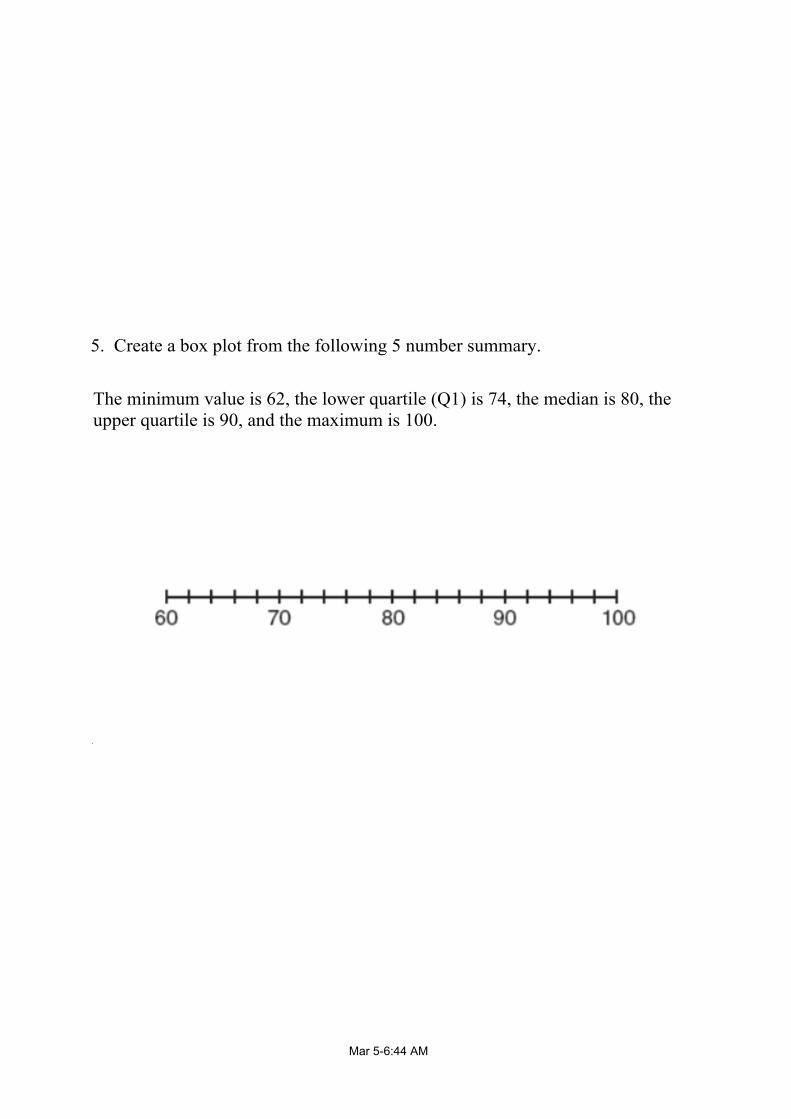
5. Create a box plot from the following 5 number summary.
The minimum value is 62, the lower quartile (Q1) is 74, the median is 80, the upper quartile is 90, and the maximum is 100.
.
Mar 56:21 AM
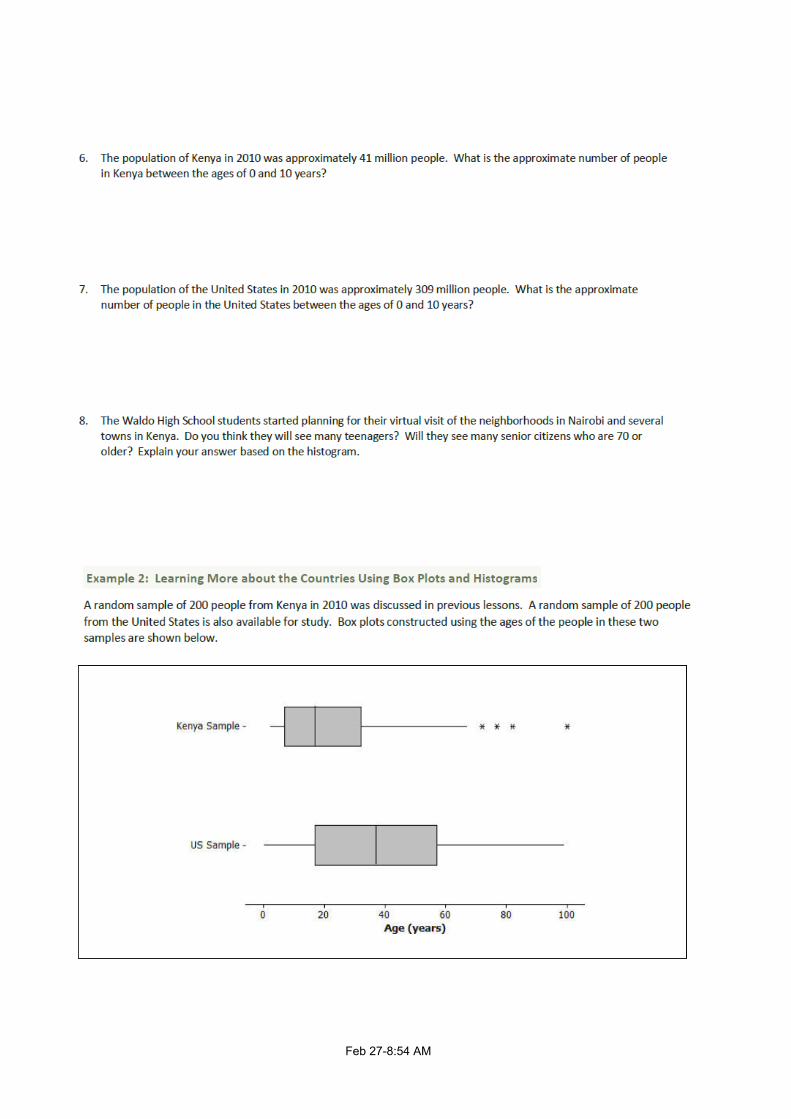
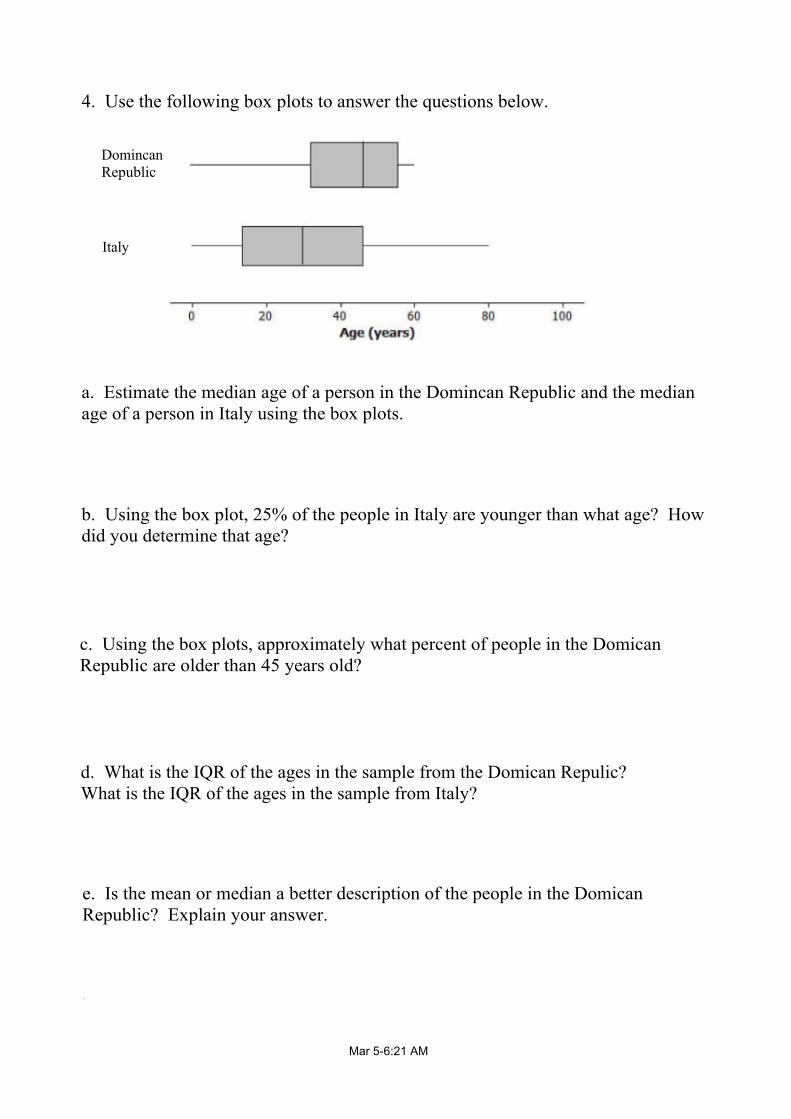
DomincanRepublic
Italy
4. Use the following box plots to answer the questions below.
a. Estimate the median age of a person in the Domincan Republic and the median age of a person in Italy using the box plots.
b. Using the box plot, 25% of the people in Italy are younger than what age? How did you determine that age?
c. Using the box plots, approximately what percent of people in the Domican Republic are older than 45 years old?
d. What is the IQR of the ages in the sample from the Domican Repulic? What is the IQR of the ages in the sample from Italy?
.
e. Is the mean or median a better description of the people in the Domican Republic? Explain your answer.
Jan 266:42 AM
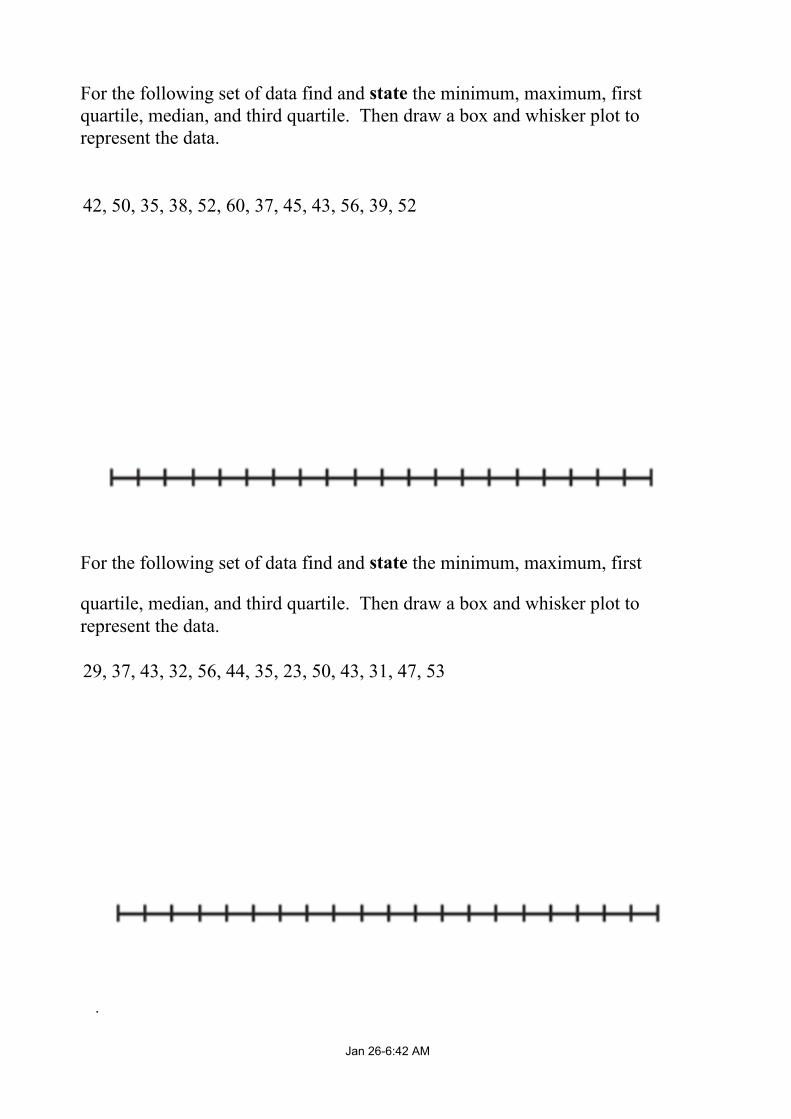
For the following set of data find and state the minimum, maximum, first quartile, median, and third quartile. Then draw a box and whisker plot to represent the data.
42, 50, 35, 38, 52, 60, 37, 45, 43, 56, 39, 52
For the following set of data find and state the minimum, maximum, first
quartile, median, and third quartile. Then draw a box and whisker plot to represent the data.
29, 37, 43, 32, 56, 44, 35, 23, 50, 43, 31, 47, 53
.
Feb 277:57 AM