Embed Size (px)
Citation preview
Algebra Connections Technology Thread 1
Algebra ConnectionsTechnology Thread
For more information about the materials you find in this packet, contact:
Chris Mikles(888) 808-4276
[email protected] site: www.cpm.org
Algebra Connections Technology Thread 2
1-1. GETTING TO KNOW YOU
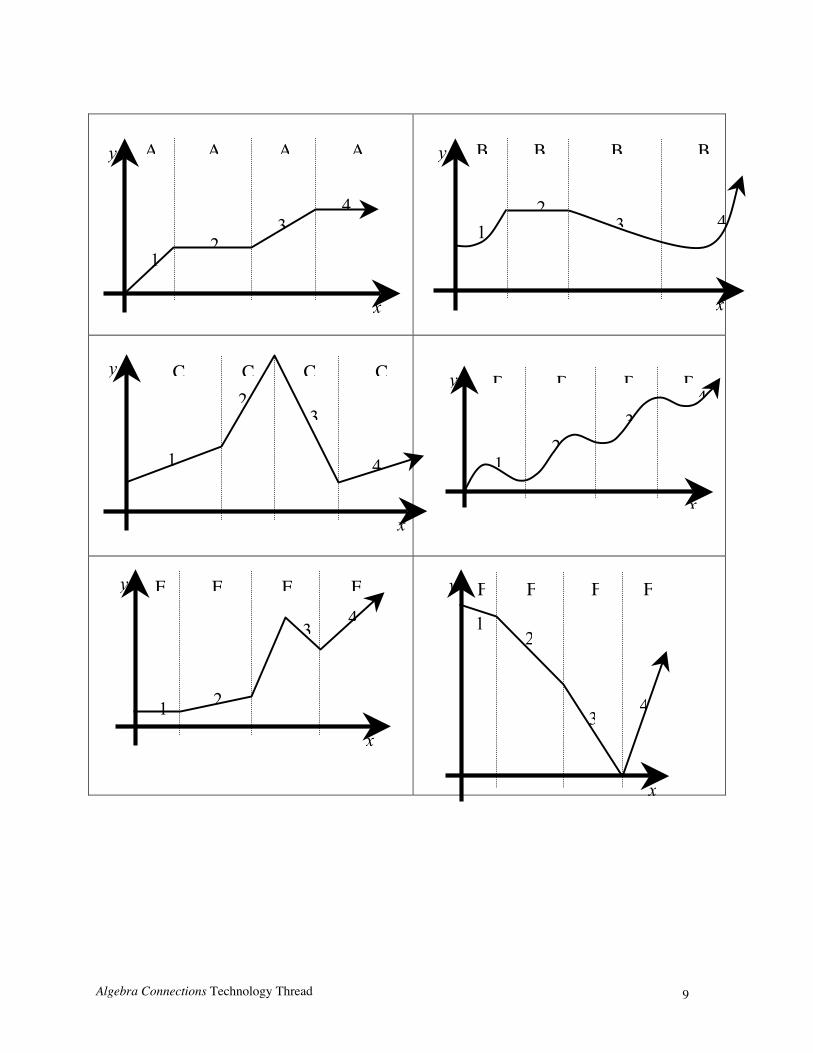
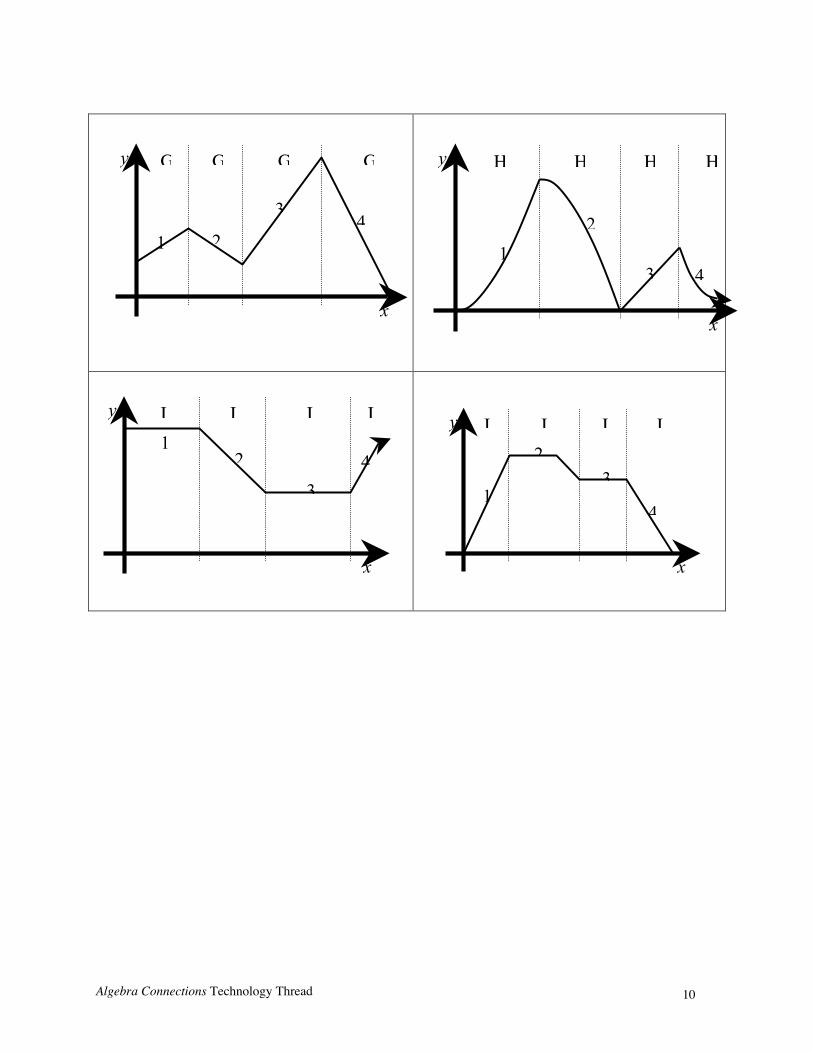
How can a graph tell a story? Today you will find your team members and then willwork together to write a story for a graph.
Your Task: Your teacher will give you one part of a graph. Find the students in the classwho have the other pieces of the same graph. When you find all of the students whosegraph parts belong with yours, sit down together as a team.
As a team, come up with a story that could be represented by your team’s graph. Thinkcarefully about each part of the graph. Once your team agrees on a story, make sureevery member of the team can describe each part of the story and explain its connectionto the corresponding part of the graph.
1-15. NEWTON’S REVENGE
Have you heard about Newton’s Revenge, the new roller coaster? It’s so big, fast, andscary that people are already starting to talk. Some people are worried about the tunnelthat thrills riders with its very low ceiling.
The closest the ceiling of the tunnel ever comes to the seat of the roller-coaster car is 200cm. Although no accidents have been reported yet, rumors have been spreading that verytall riders have broken their arms as they went through the tunnel with their arms raisedover their heads. Unfortunately, due to these rumors, many tall people have stoppedriding the coaster.
Your Task: Consider how you could determine whether the tunnel is actually safe forany rider, no matter how tall. Discuss the questions below with your team. Be ready toshare your responses with the rest of the class.
What is this problem about? What is it asking you to do?What information can help you answer this question?
How can you get the information you need?
Algebra Connections Technology Thread 3
1-16. One way to determine if the roller coaster is safe is to collect and analyze data.
a. Collect data from each member of your team.
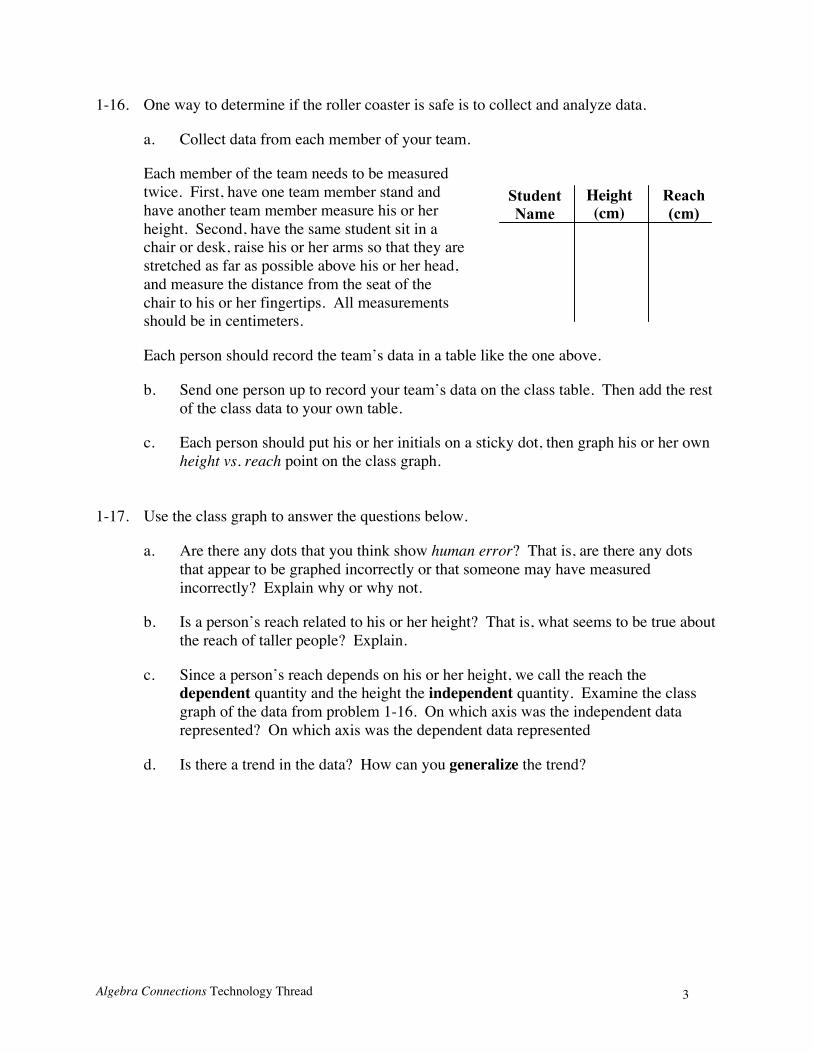
Each member of the team needs to be measuredtwice. First, have one team member stand andhave another team member measure his or herheight. Second, have the same student sit in achair or desk, raise his or her arms so that they arestretched as far as possible above his or her head,and measure the distance from the seat of thechair to his or her fingertips. All measurementsshould be in centimeters.
Each person should record the team’s data in a table like the one above.
b. Send one person up to record your team’s data on the class table. Then add the restof the class data to your own table.
c. Each person should put his or her initials on a sticky dot, then graph his or her ownheight vs. reach point on the class graph.
1-17. Use the class graph to answer the questions below.
a. Are there any dots that you think show human error? That is, are there any dotsthat appear to be graphed incorrectly or that someone may have measuredincorrectly? Explain why or why not.
b. Is a person’s reach related to his or her height? That is, what seems to be true aboutthe reach of taller people? Explain.
c. Since a person’s reach depends on his or her height, we call the reach thedependent quantity and the height the independent quantity. Examine the classgraph of the data from problem 1-16. On which axis was the independent datarepresented? On which axis was the dependent data represented
d. Is there a trend in the data? How can you generalize the trend?
StudentName
Height(cm)
Reach(cm)
Algebra Connections Technology Thread 4
7-10. NEWTON’S REVENGE REVISITED
Today you will use your new knowledge of y = mx + b to solve “Newton’s Revenge,”problem 1-15, which is summarized below.
Newton’s Revenge, the new roller coaster, has a tunnel that thrills riders with its very lowceiling. The closest the ceiling of the tunnel ever comes to the seat of the roller-coastercar is 200 cm. Although no accidents have yet been reported, rumors have beenspreading that very tall riders have been injured as they went through the tunnel withtheir arms raised over their heads. The management needs your help in convincing thepublic that the roller coaster is safe.
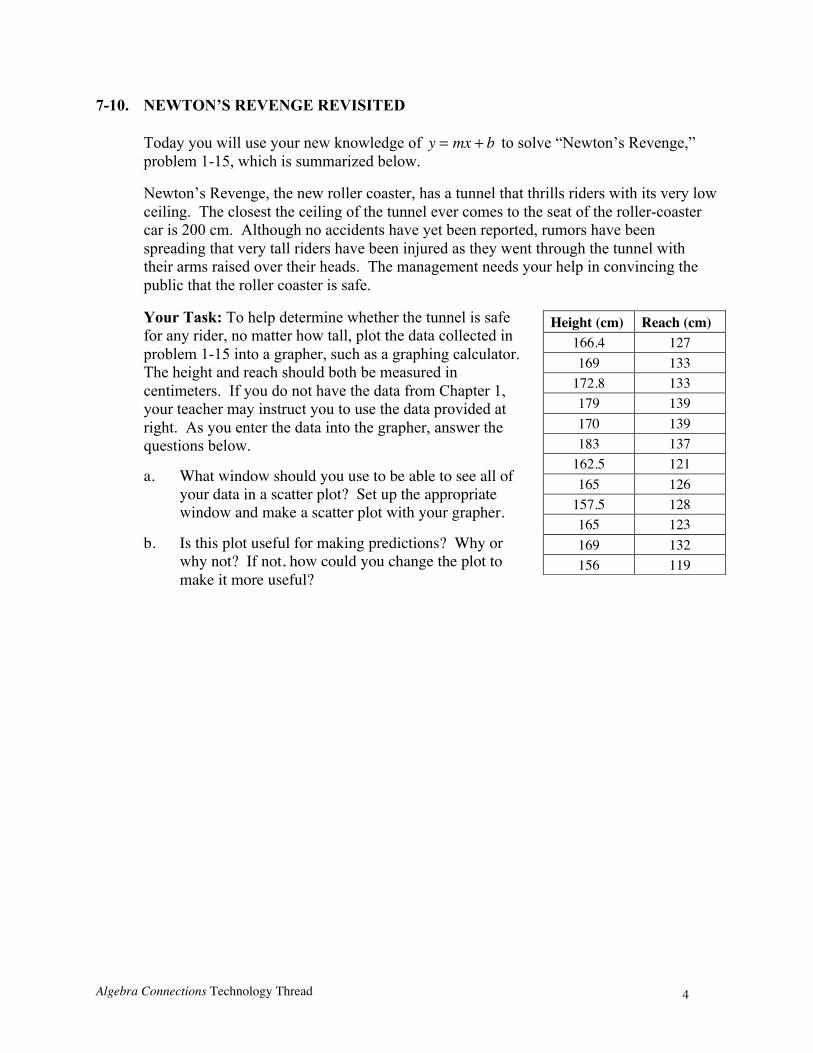
Your Task: To help determine whether the tunnel is safefor any rider, no matter how tall, plot the data collected inproblem 1-15 into a grapher, such as a graphing calculator.The height and reach should both be measured incentimeters. If you do not have the data from Chapter 1,your teacher may instruct you to use the data provided atright. As you enter the data into the grapher, answer thequestions below.
a. What window should you use to be able to see all ofyour data in a scatter plot? Set up the appropriatewindow and make a scatter plot with your grapher.
b. Is this plot useful for making predictions? Why orwhy not? If not, how could you change the plot tomake it more useful?
Height (cm) Reach (cm)166.4 127169 133
172.8 133179 139170 139183 137
162.5 121165 126
157.5 128165 123169 132156 119
Algebra Connections Technology Thread 5
7-12 Use your grapher to help you find the trend line (the equation ofthe line that best approximates your data). Once you have anequation that can best represent the data, you will be able to use theequation to verify that the roller coaster is safe.
If you have not done so already, set the window on your grapher toshow the x-axis from 0 to your highest x-value and the y-axis from0 to your highest y-value.
a. Guess an equation that you think might come close to your data. Enter the equationinto your grapher and graph it in the same window as your data. Did you comeclose?
b. Change the numbers in your equation to numbers you think might fit the data moreclosely. Graph the equation again and see what happens. Keep trying new numbersuntil you find an equation that you think comes close to fitting the data. What isyour equation?
c. Now reset the window to zoom in on your data. Does your equation still seem to fitthe data well? If not, adjust your equation until you are satisfied with how it fits thedata.
d. Zoom back out and find the y-intercept. What does this point represent? Does thismake sense? If necessary, change your equation so that your equation makes senseat x = 0 .
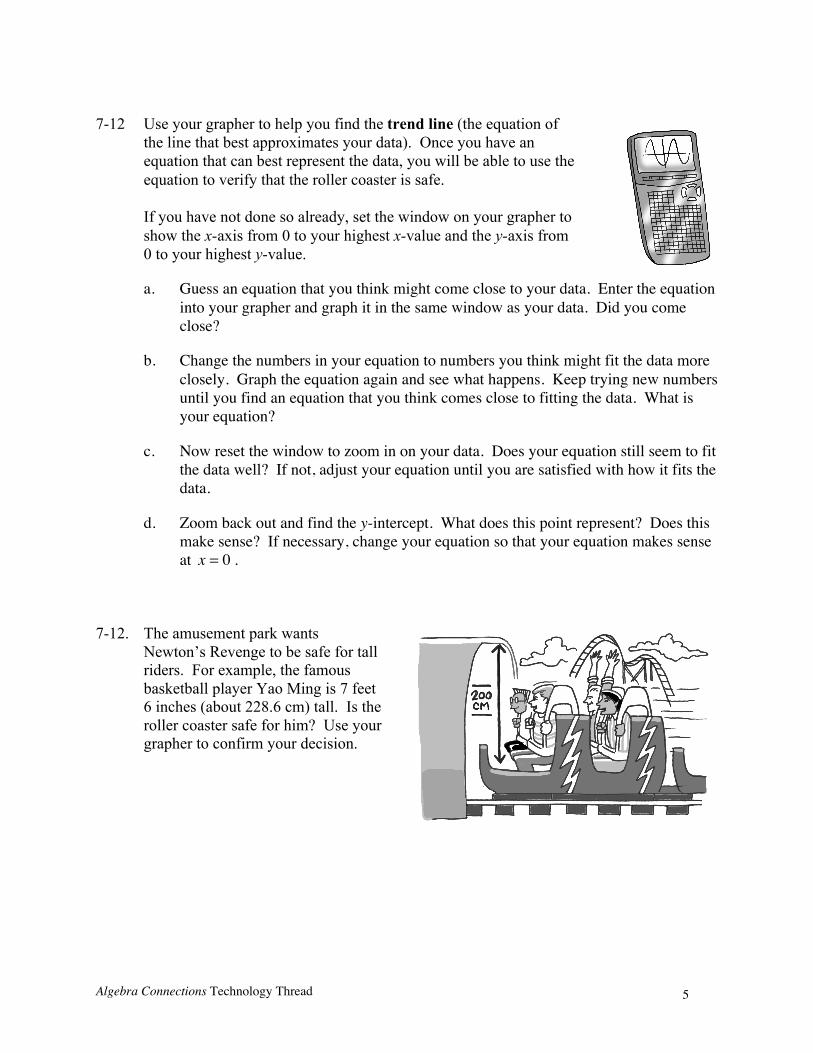
7-12. The amusement park wantsNewton’s Revenge to be safe for tallriders. For example, the famousbasketball player Yao Ming is 7 feet6 inches (about 228.6 cm) tall. Is theroller coaster safe for him? Use yourgrapher to confirm your decision.
Algebra Connections Technology Thread 6
7-53. SLOPE WALK
Congratulations! The president of the Line Factory has presented your class with aspecial challenge: She now wants a way to find the equation of a line generated when acustomer walks in front of a motion detector. That way, a customer can simply walk aline to order it from the factory.
Your Task: Once a motion detector has been set up with the correct software, have avolunteer walk away from the motion detector at a constant rate. In other words, he orshe should walk the same speed the entire time. Then, once a graph is generated, find theequation of the line. Also find the equation of a line formed when a different volunteerwalks toward the motion detector at a constant rate.
What do you expect the first graph to look like? Why?
What will be different about the two graphs?What would happen if the volunteer did not walk at a constant rate?
How does the volunteer’s speed affect the graph?
7-54. WALK THE WALK
To impress the president, you have decided to reverse the process: Write instructions fora client on how to walk in front of the motion detector in order to create a graph for agiven rule.
Each team in the class will be assigned one or two rules from the list below. Then, as ateam, decide how to walk so that you will get the graph for your rule. After the entireteam understands how to walk, one member will try to graph the line by walking in frontof the motion detector. Pay close attention to detail! Your team only has two tries!
a.
�
y = 3x +2 b. y = −x +10
c.
�
y = 6 d.
�
y = 2x + 4
e. y = −2x +13 f.
�
y = x +5
g.
�
y = −0.5x +15 h.
�
y =1.5x + 3
Algebra Connections Technology Thread 7
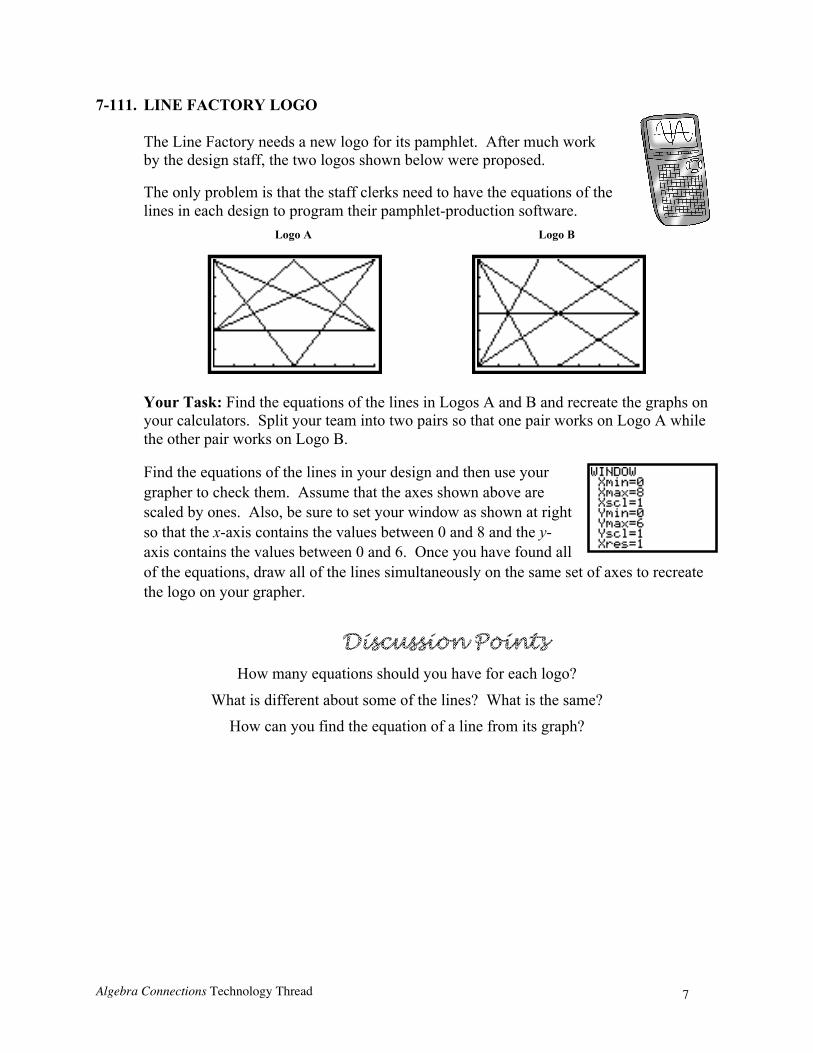
7-111. LINE FACTORY LOGO
The Line Factory needs a new logo for its pamphlet. After much workby the design staff, the two logos shown below were proposed.
The only problem is that the staff clerks need to have the equations of thelines in each design to program their pamphlet-production software.
Logo A Logo B
Your Task: Find the equations of the lines in Logos A and B and recreate the graphs onyour calculators. Split your team into two pairs so that one pair works on Logo A whilethe other pair works on Logo B.
Find the equations of the lines in your design and then use yourgrapher to check them. Assume that the axes shown above arescaled by ones. Also, be sure to set your window as shown at rightso that the x-axis contains the values between 0 and 8 and the y-axis contains the values between 0 and 6. Once you have found allof the equations, draw all of the lines simultaneously on the same set of axes to recreatethe logo on your grapher.
How many equations should you have for each logo?
What is different about some of the lines? What is the same?How can you find the equation of a line from its graph?
Algebra Connections Technology Thread 8
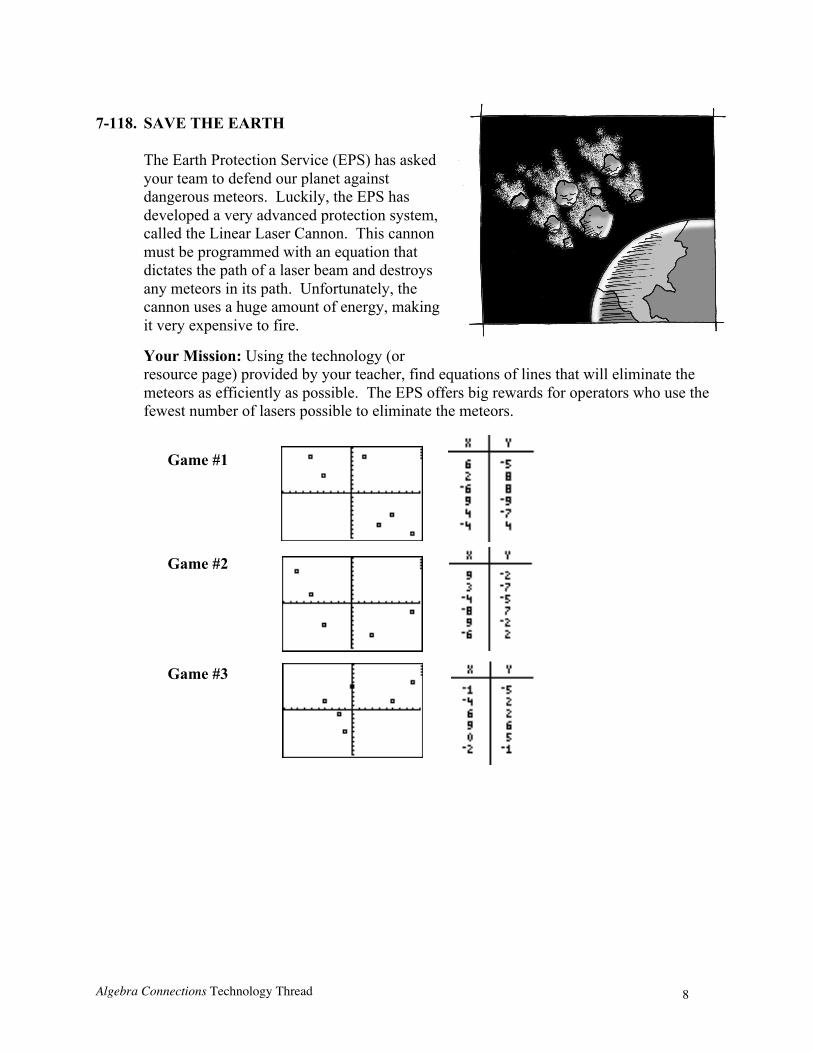
7-118. SAVE THE EARTH
The Earth Protection Service (EPS) has askedyour team to defend our planet againstdangerous meteors. Luckily, the EPS hasdeveloped a very advanced protection system,called the Linear Laser Cannon. This cannonmust be programmed with an equation thatdictates the path of a laser beam and destroysany meteors in its path. Unfortunately, thecannon uses a huge amount of energy, makingit very expensive to fire.
Your Mission: Using the technology (orresource page) provided by your teacher, find equations of lines that will eliminate themeteors as efficiently as possible. The EPS offers big rewards for operators who use thefewest number of lasers possible to eliminate the meteors.
Game #1
Game #2
Game #3
Algebra Connections Technology Thread 9
A A A A
12
34
y
x
B B B B
12
3 4
y
x
C C C C
1
23
4
y
x
D D D D
12
34
y
x
E E E E
1 2
34
y
x
F F F F
12
34
y
x
Algebra Connections Technology Thread 10
G G G G
1 2
34
y
x
H H H H
12
3 4
y
x
I I I I1
2
34
y
x
J J J J
1
23
4
y
x