Embed Size (px)
DESCRIPTION
Poster in MindTheGap conference about the comparison and efficiency of haplotype methods to detect selection either hard or soft selective sweeps. Methods tested: iHS, xp-eHH, EHHST, xp-EHHST and XPCLR. Soon there will be a publication including also hapflk and more scenarios.
Citation preview
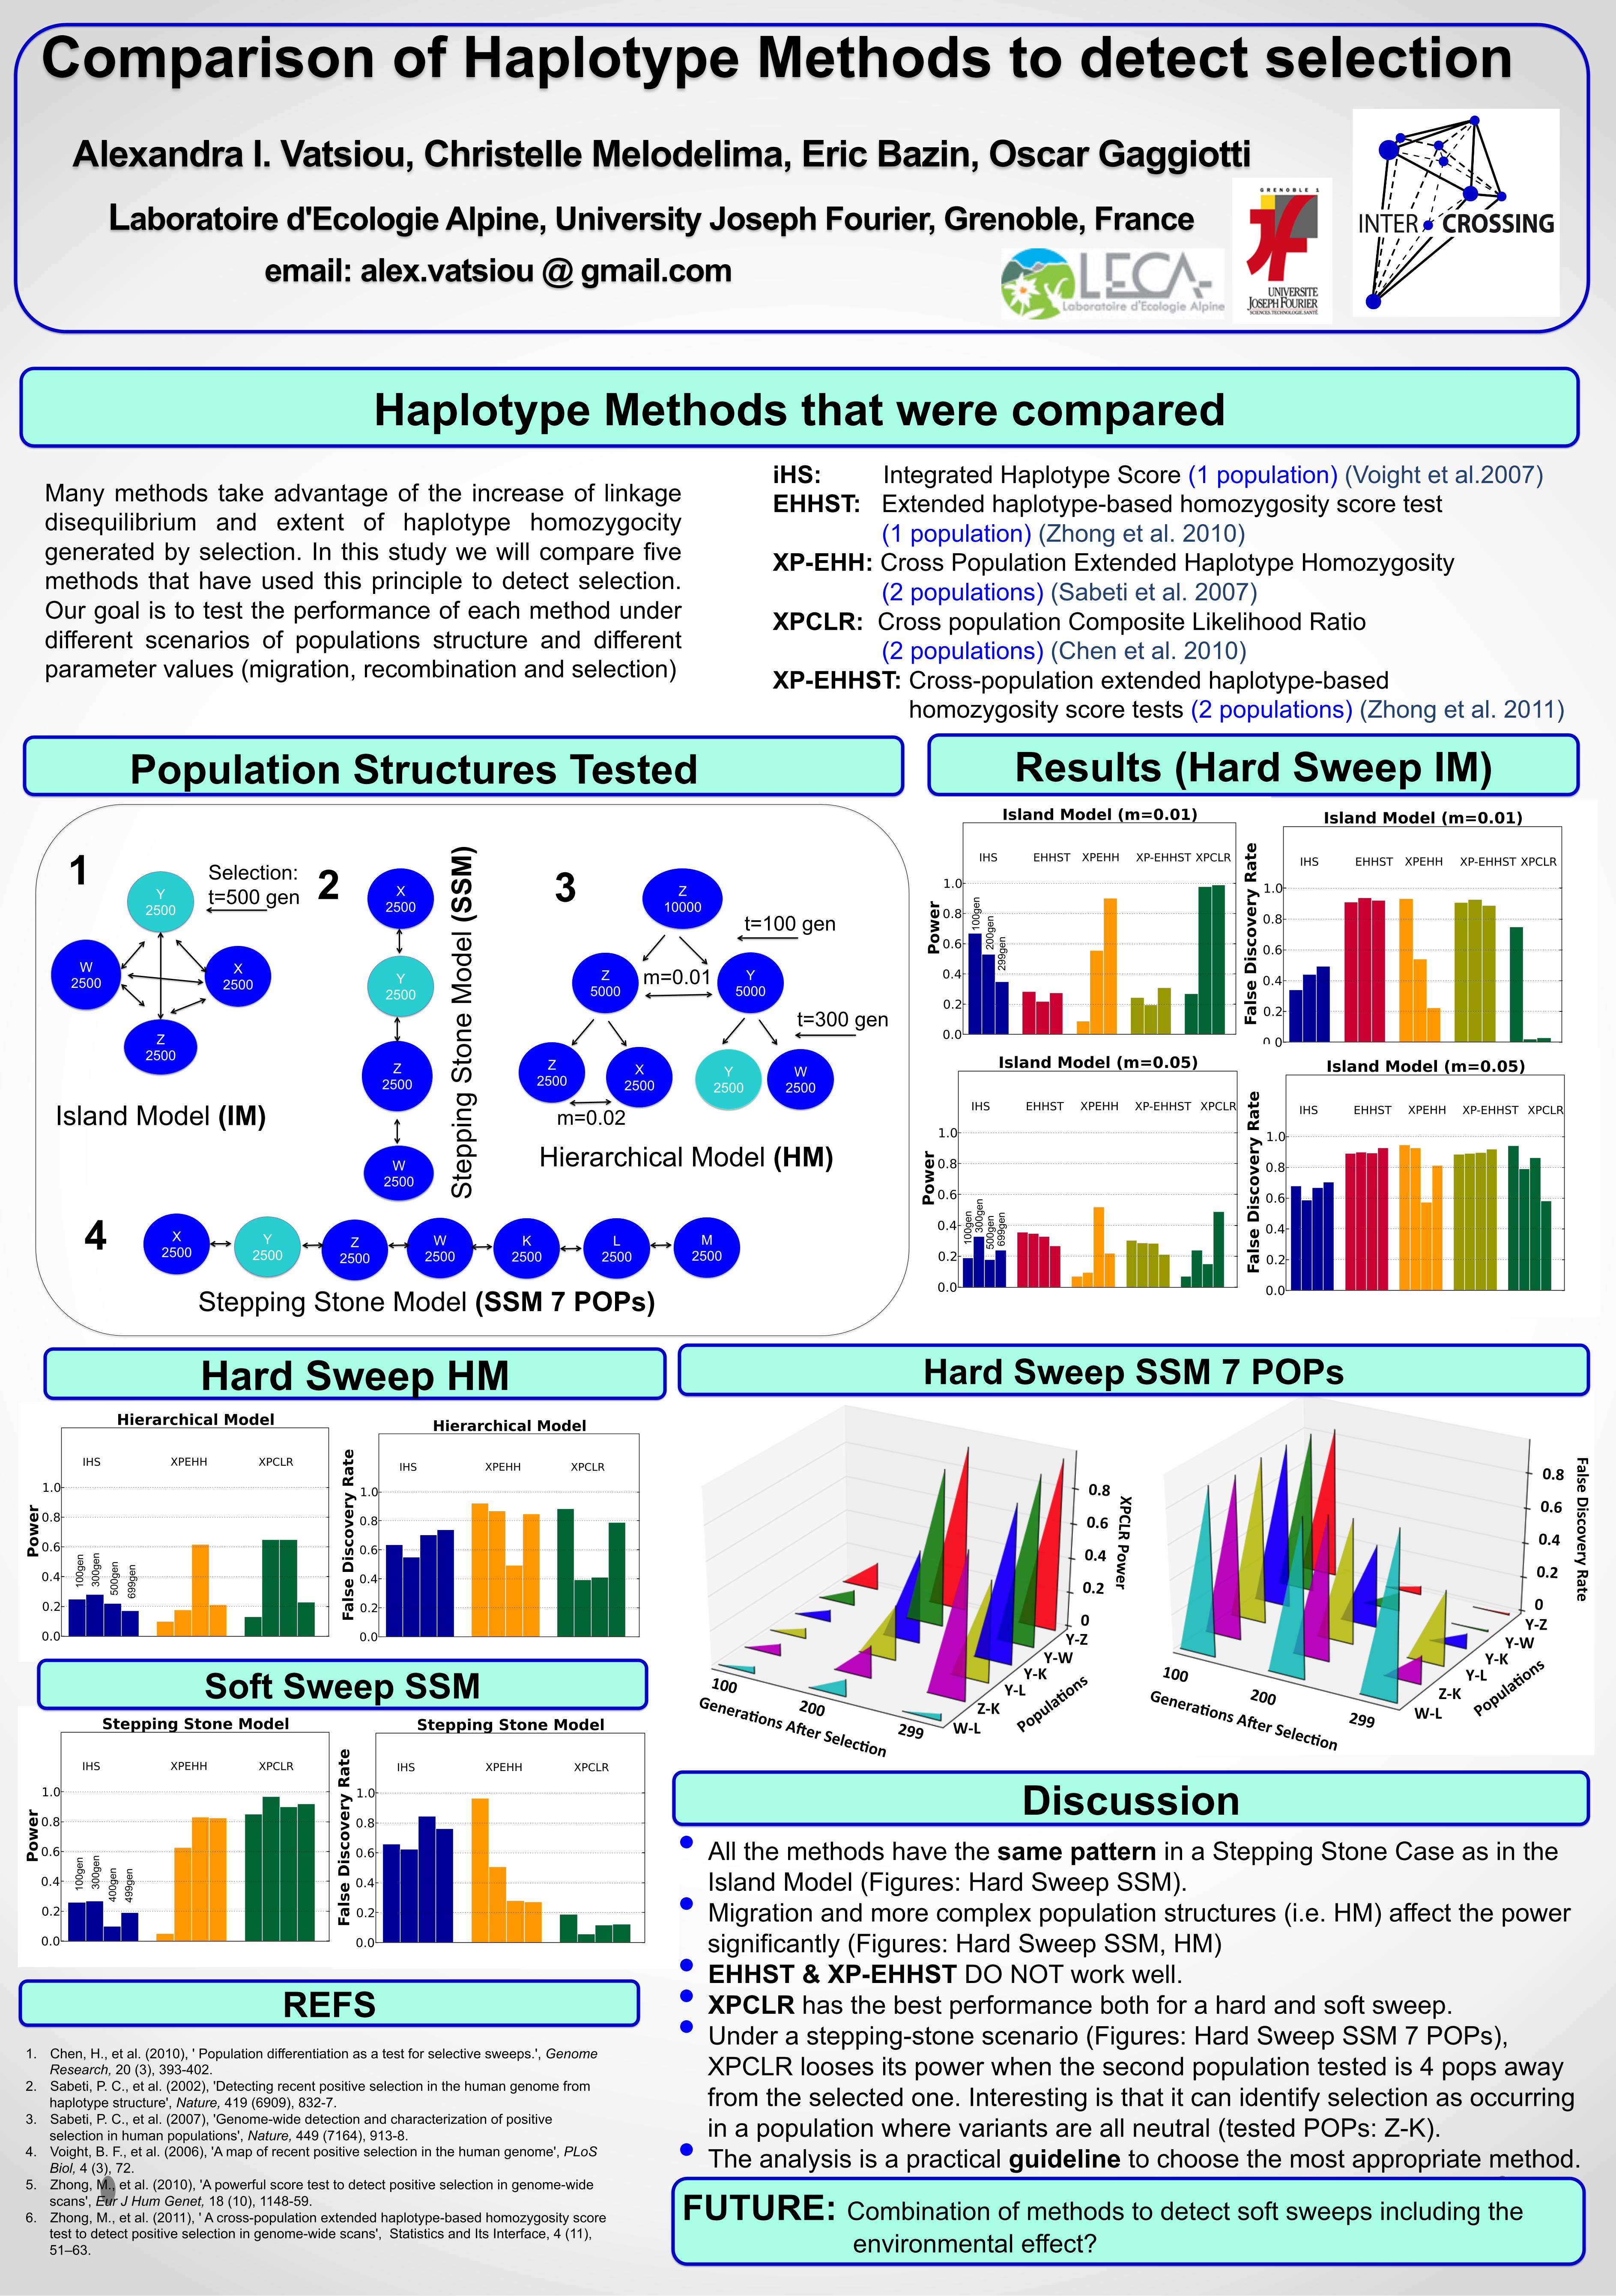
Comparison of Haplotype Methods to detect selection Alexandra I. Vatsiou, Christelle Melodelima, Eric Bazin, Oscar Gaggiotti Laboratoire d'Ecologie Alpine, University Joseph Fourier, Grenoble, France email: alex.vatsiou @ gmail.com
X 2500
Z 2500
W 2500
Y 2500
Island Model (IM)
iHS: Integrated Haplotype Score (1 population) (Voight et al.2007) EHHST: Extended haplotype-based homozygosity score test (1 population) (Zhong et al. 2010) XP-EHH: Cross Population Extended Haplotype Homozygosity (2 populations) (Sabeti et al. 2007) XPCLR: Cross population Composite Likelihood Ratio (2 populations) (Chen et al. 2010) XP-EHHST: Cross-population extended haplotype-based homozygosity score tests (2 populations) (Zhong et al. 2011)
Haplotype Methods that were compared
Y 2500
X 2500
W 2500
Z 2500
Ste
ppin
g S
tone
Mod
el (S
SM)
1
Population Structures Tested Results (Hard Sweep IM)
REFS 1. Chen, H., et al. (2010), ' Population differentiation as a test for selective sweeps.', Genome
Research, 20 (3), 393-402. 2. Sabeti, P. C., et al. (2002), 'Detecting recent positive selection in the human genome from
haplotype structure', Nature, 419 (6909), 832-7. 3. Sabeti, P. C., et al. (2007), 'Genome-wide detection and characterization of positive
selection in human populations', Nature, 449 (7164), 913-8. 4. Voight, B. F., et al. (2006), 'A map of recent positive selection in the human genome', PLoS
Biol, 4 (3), 72. 5. Zhong, M., et al. (2010), 'A powerful score test to detect positive selection in genome-wide
scans', Eur J Hum Genet, 18 (10), 1148-59. 6. Zhong, M., et al. (2011), ' A cross-population extended haplotype-based homozygosity score
test to detect positive selection in genome-wide scans', Statistics and Its Interface, 4 (11), 51–63.
Many methods take advantage of the increase of linkage disequilibrium and extent of haplotype homozygocity generated by selection. In this study we will compare five methods that have used this principle to detect selection. Our goal is to test the performance of each method under different scenarios of populations structure and different parameter values (migration, recombination and selection)
Z 10000
Z 5000
W 2500
Y 2500
X 2500
Z 2500
Y 5000
Hierarchical Model (HM)
t=100 gen
t=300 gen
Selection: t=500 gen 2 3
Y 2500
X 2500
L 2500
Z 2500
W 2500
K 2500
M 2500
4 Stepping Stone Model (SSM 7 POPs)
m=0.01
m=0.02
Soft Sweep SSM
Hard Sweep HM
100#200#
299#
Genera+ons#A/er#Selec+on#
False#Discovery#Rate#
Y;W#
Y;L#
Y;Z#
Z;K#W;L#
Y;K#
0.8##0.6##0.4##0.2##0#
100#200#
299#
Genera+ons#A/er#Selec+on#
XPCLR#Power#
Y:W#
Y:L#
Y:Z#
Z:K#W:L#
Y:K#
0.8##0.6##0.4##0.2##0#
Discussion • All the methods have the same pattern in a Stepping Stone Case as in the
Island Model (Figures: Hard Sweep SSM). • Migration and more complex population structures (i.e. HM) affect the power significantly (Figures: Hard Sweep SSM, HM) • EHHST & XP-EHHST DO NOT work well. • XPCLR has the best performance both for a hard and soft sweep. • Under a stepping-stone scenario (Figures: Hard Sweep SSM 7 POPs), XPCLR looses its power when the second population tested is 4 pops away from the selected one. Interesting is that it can identify selection as occurring in a population where variants are all neutral (tested POPs: Z-K). • The analysis is a practical guideline to choose the most appropriate method.
699g
en
500g
en
300g
en
100g
en
499g
en
300g
en
400g
en
100g
en
FUTURE: Combination of methods to detect soft sweeps including the environmental effect?
Hard Sweep SSM 7 POPs
100g
en
200g
en
299g
en
100g
en
500g
en
699g
en
300g
en