Embed Size (px)
DESCRIPTION
METHODS FOR SYNTHESISING EVIDENCE FROM STUDIES EVALUATING DIAGNOSTIC PERFORMANCE OF A MEDICAL TEST FOR ECONOMIC DECISION MODELLING. Alex Sutton & Nicola Cooper Centre for Biostatistics and Genetic Epidemiology, Department of Health Sciences, University of Leicester, UK. - PowerPoint PPT Presentation
Citation preview

METHODS FOR SYNTHESISING EVIDENCE
FROM STUDIES EVALUATING DIAGNOSTIC PERFORMANCE
OF A MEDICAL TEST FOR ECONOMIC DECISION
MODELLINGAlex Sutton & Nicola Cooper
Centre for Biostatistics and Genetic Epidemiology, Department of Health Sciences, University of Leicester,
UK.Acknowledgements: Steve Goodacre (University of
Sheffield) Jo Lord (NICE)
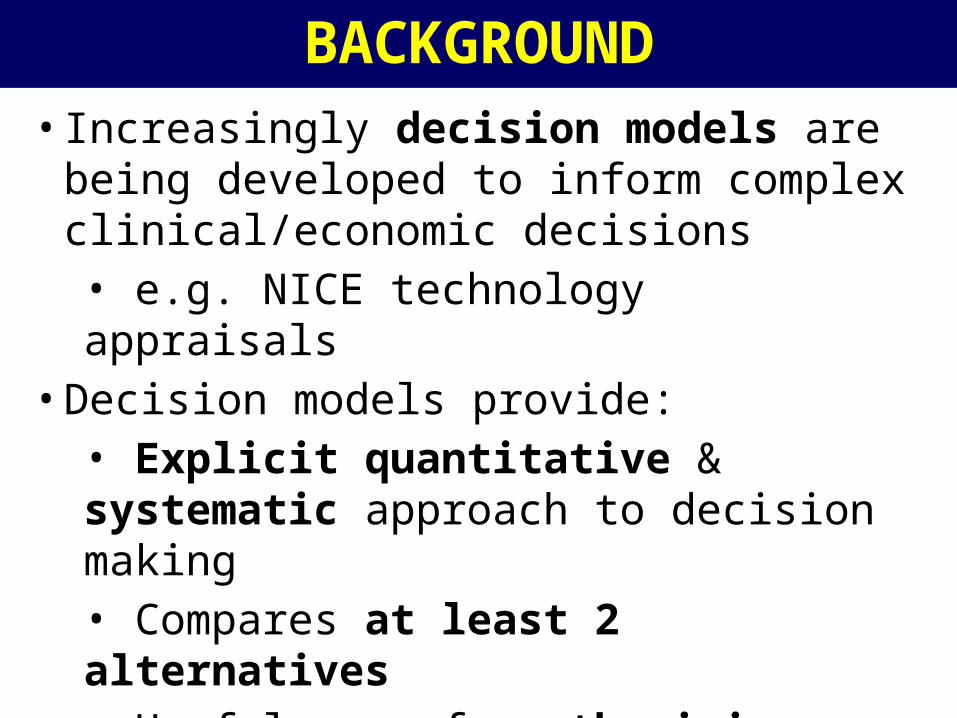
• Increasingly decision models are being developed to inform complex clinical/economic decisions • e.g. NICE technology appraisals
• Decision models provide:• Explicit quantitative & systematic approach to decision making• Compares at least 2 alternatives• Useful way of synthesising evidence from multiple sources (e.g. effectiveness data from trials, adverse event rates from observational studies, etc.)
BACKGROUND
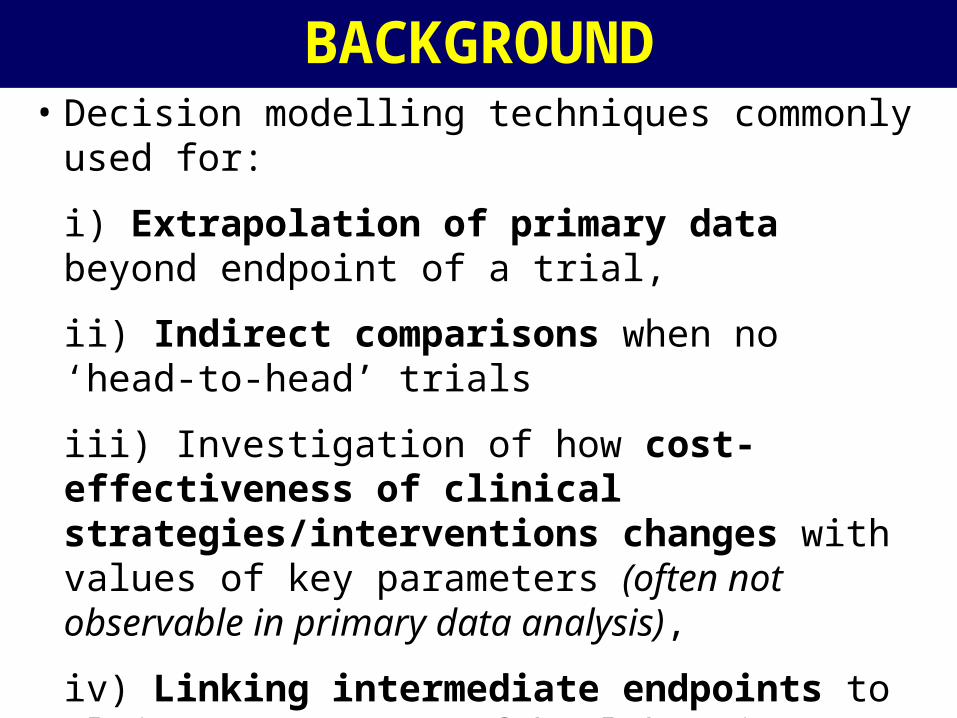
• Decision modelling techniques commonly used for:
i) Extrapolation of primary data beyond endpoint of a trial,
ii) Indirect comparisons when no ‘head-to-head’ trials
iii) Investigation of how cost-effectiveness of clinical strategies/interventions changes with values of key parameters (often not observable in primary data analysis),
iv) Linking intermediate endpoints to ultimate measures of health gain (e.g. QALYs)
v) Incorporation of country specific data relating to disease history and management.
BACKGROUND
BACKGROUND
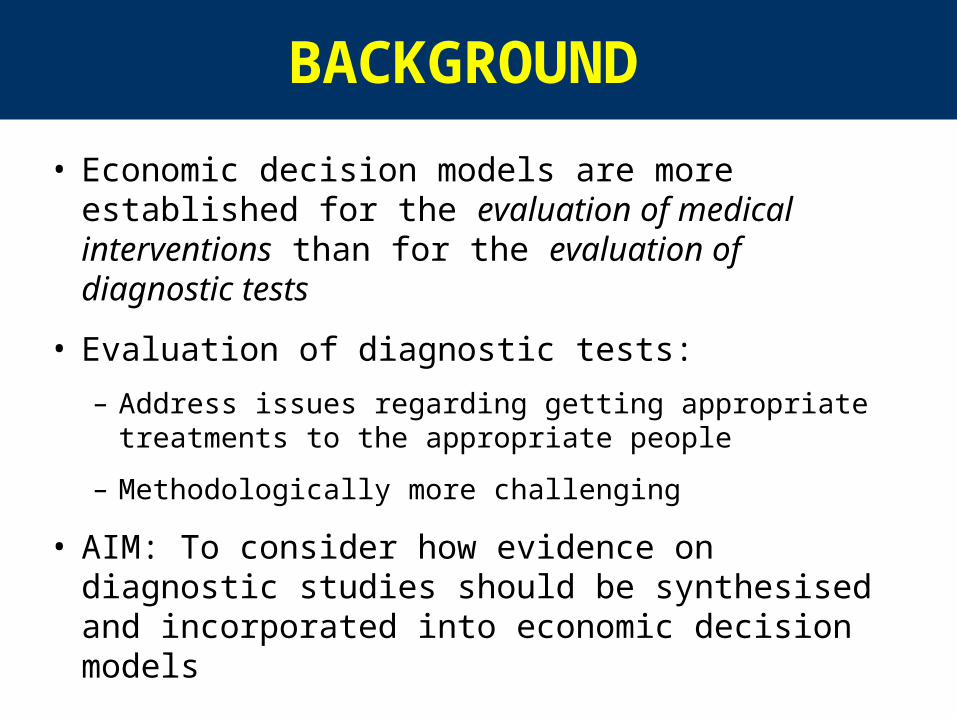
• Economic decision models are more established for the evaluation of medical interventions than for the evaluation of diagnostic tests
• Evaluation of diagnostic tests:
– Address issues regarding getting appropriate treatments to the appropriate people
– Methodologically more challenging
• AIM: To consider how evidence on diagnostic studies should be synthesised and incorporated into economic decision models

OUTLINE
1. Comprehensive decision modelling
2. Clinical evaluation of diagnostic tests
3. Meta-analysis of diagnostic tests
4. Economic evaluation of diagnostic tests
5. Putting it all together: Economic decision model for deep vein thrombosis (DVT)
6. Discussion

1) COMPREHENSIVE DECISION MODELLING
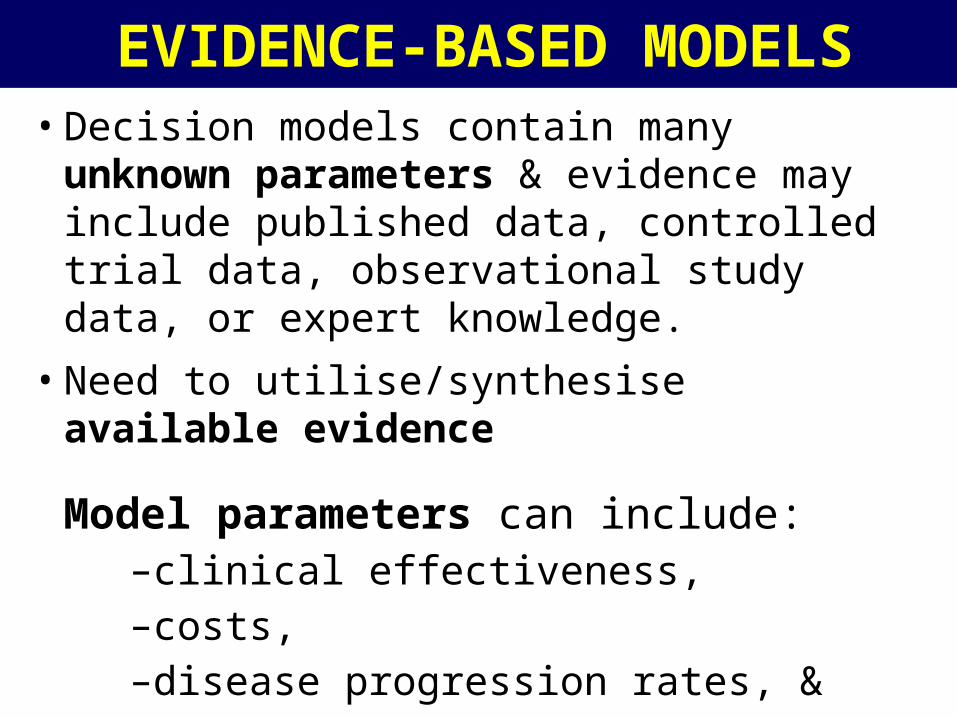
• Decision models contain many unknown parameters & evidence may include published data, controlled trial data, observational study data, or expert knowledge.
• Need to utilise/synthesise available evidence
• Model parameters can include: –clinical effectiveness, –costs, –disease progression rates, &–utilities
EVIDENCE-BASED
MODELS
EVIDENCE-BASED
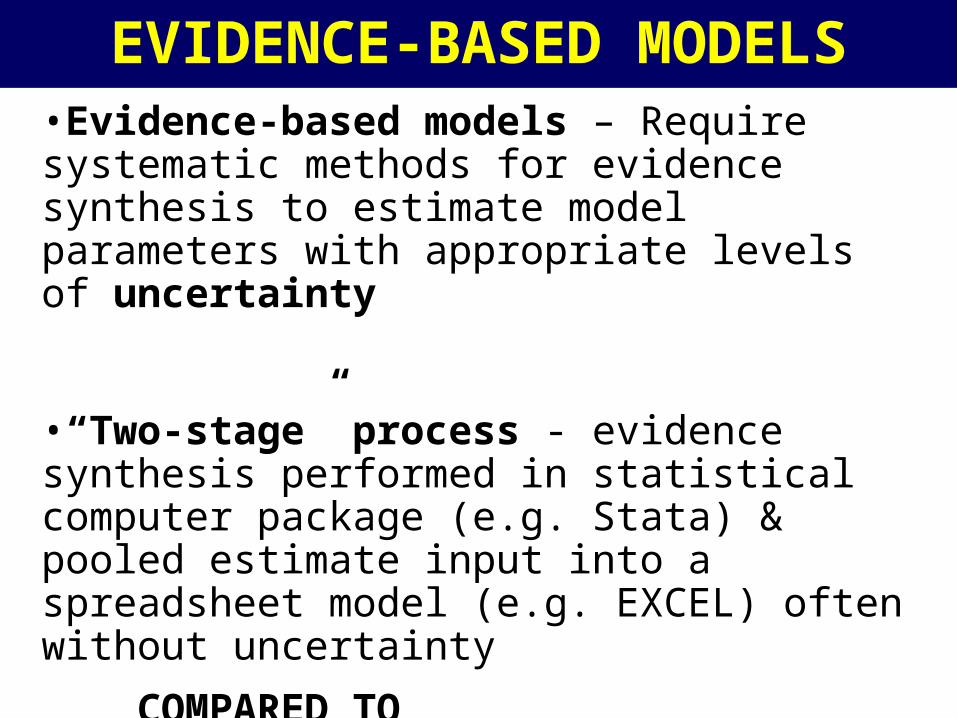
MODELS•Evidence-based models – Require systematic methods for evidence synthesis to estimate model parameters with appropriate levels of uncertainty
•“Two-stage” process - evidence synthesis performed in statistical computer package (e.g. Stata) & pooled estimate input into a spreadsheet model (e.g. EXCEL) often without uncertainty
COMPARED TO
•Single comprehensive framework - incorporating evidence synthesis, data manipulation & model evaluation within one coherent framework

EVIDENCE-BASED
MODELSAdvantages of the single comprehensive modelling framework compared to 2-stage approach:
•Transparent framework as all analysis within in one computer programme
•Facilitates sensitivity analysis & updating
•Distribution for pooled result(s) estimated from evidence synthesis, transformed into appropriate format & input into model – no distributional assumption necessary
-2.95 -2.90 -2.85 -2.80 -2.75 -2.70 -2.65
02
46
81
0
-2.95 -2.90 -2.85 -2.80 -2.75 -2.70 -2.65
02
46
81
0
-2.95 -2.90 -2.85 -2.80 -2.75 -2.70 -2.65
02
46
81
0
-2.95 -2.90 -2.85 -2.80 -2.75 -2.70 -2.65
02
46
81
0
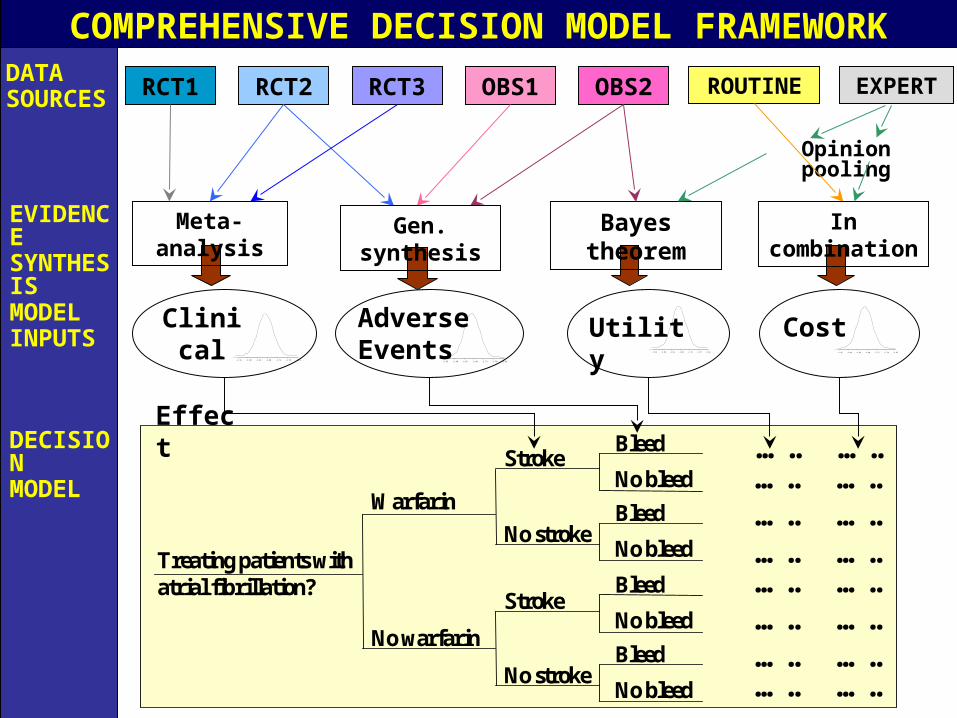
RCT1 RCT2 RCT3 OBS1 OBS2 ROUTINE EXPERTDATA SOURCES
Gen. synthesisMeta-analysisEVIDENCESYNTHESIS
COMPREHENSIVE DECISION MODEL FRAMEWORK
DECISIONMODEL Stroke
No strokeTreating patients with atrial fibrillation?
Warfarin
No warfarin
Stroke
No stroke
Bleed
No bleed
Bleed
No bleed
Bleed
No bleed
Bleed
No bleed
….. …..….. …..
….. …..….. …..….. …..….. …..
….. …..….. …..
Clinical Effect
MODEL INPUTS
Adverse Events
Utility Cost
Opinion pooling
Bayes theorem In combination
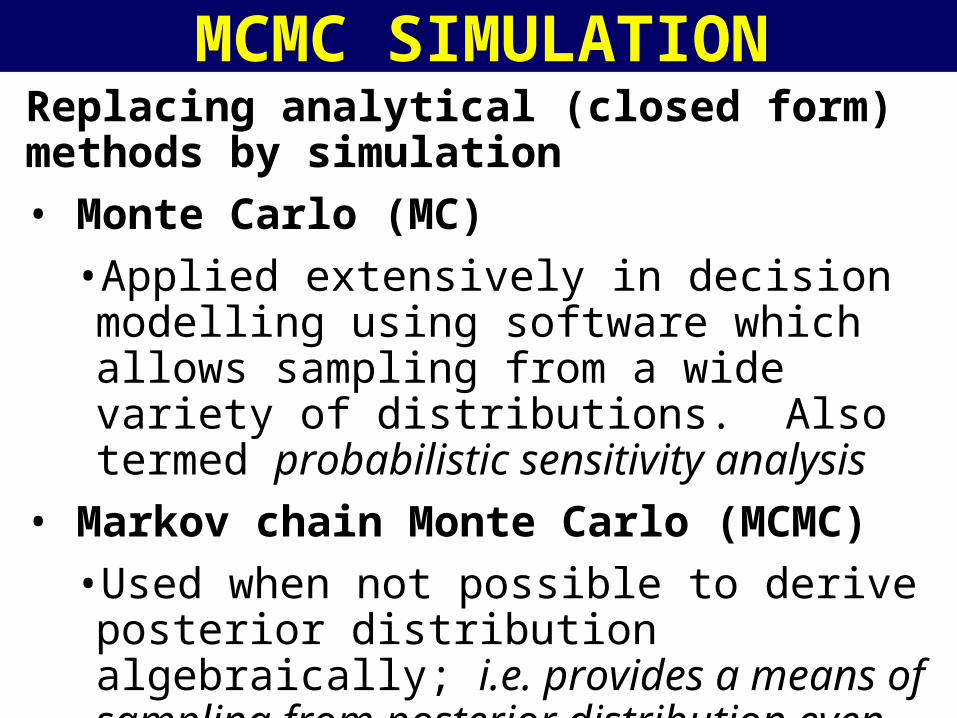
MCMC SIMULATIONReplacing analytical (closed form) methods by simulation• Monte Carlo (MC)
• Applied extensively in decision modelling using software which allows sampling from a wide variety of distributions. Also termed probabilistic sensitivity analysis
• Markov chain Monte Carlo (MCMC) • Used when not possible to derive posterior distribution algebraically; i.e. provides a means of sampling from posterior distribution even when form of that distribution unknown
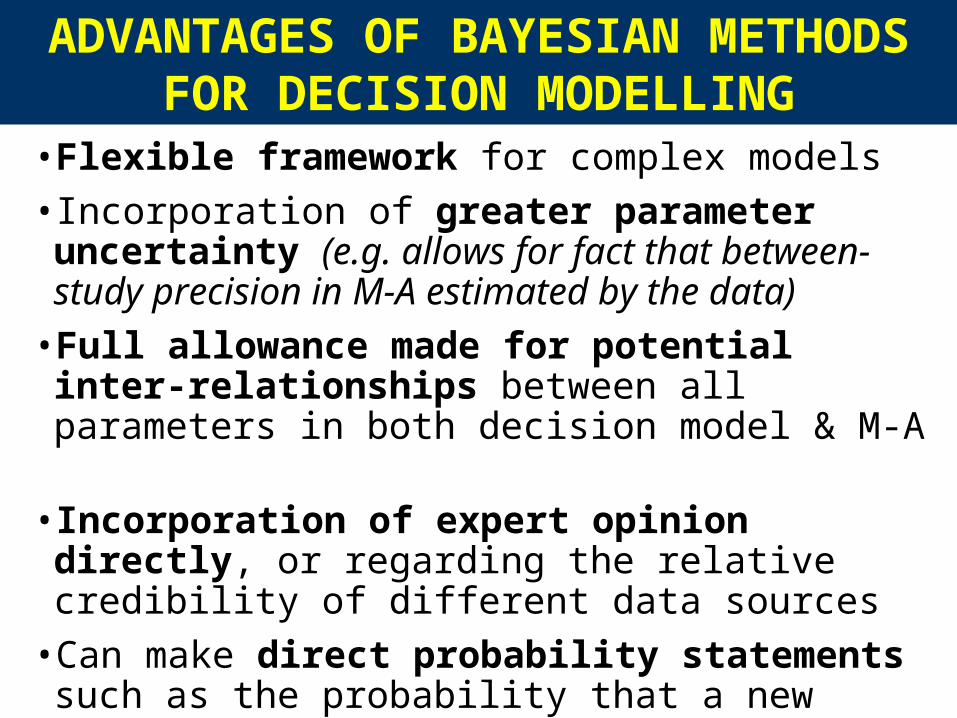
• Flexible framework for complex models
• Incorporation of greater parameter uncertainty (e.g. allows for fact that between-study precision in M-A estimated by the data)
• Full allowance made for potential inter-relationships between all parameters in both decision model & M-A
• Incorporation of expert opinion directly, or regarding the relative credibility of different data sources
• Can make direct probability statements such as the probability that a new treatment is cost effective (CEACs)
WinBUGS – freely available Bayesian specialist software http://www.mrc-bsu.cam.ac.uk/bugs/welcome.shtml
ADVANTAGES OF BAYESIAN METHODS FOR DECISION MODELLING
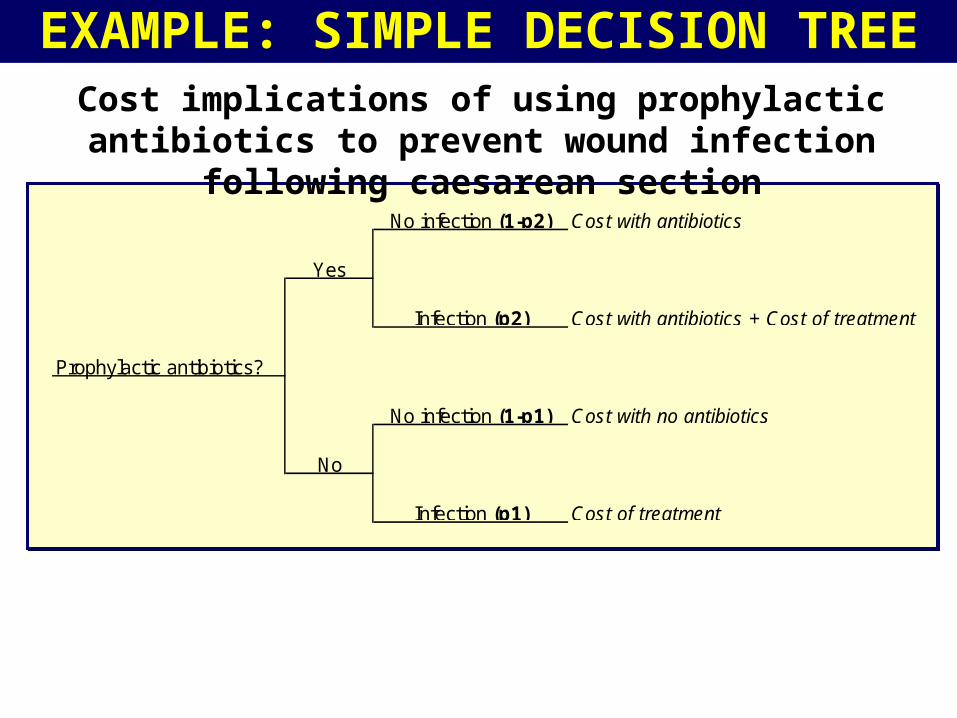
Cost implications of using prophylactic antibiotics to prevent wound infection following caesarean section
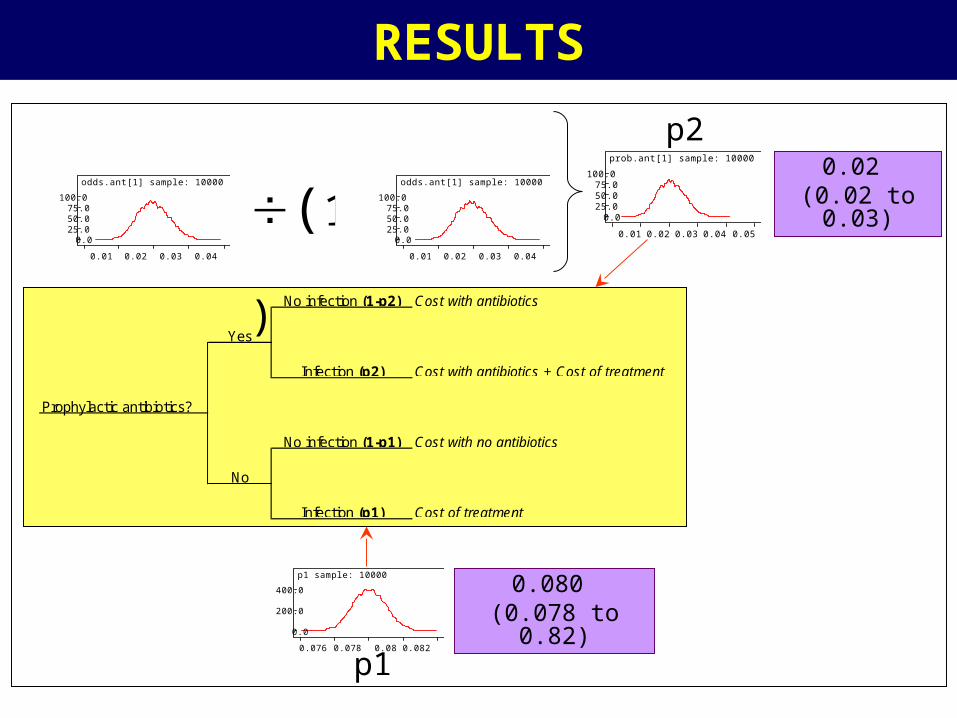
EXAMPLE: SIMPLE DECISION TREE
No infection (1-p2) Cost with antibiotics
Yes
Infection (p2) Cost with antibiotics + Cost of treatment
Prophylactic antibiotics?
No infection (1-p1) Cost with no antibiotics
No
Infection (p1) Cost of treatment
• Current rate of wound infection in UK taken from large registry (p1)=6000/75000 (8%)
• Want to estimate p2 for UK hospitals

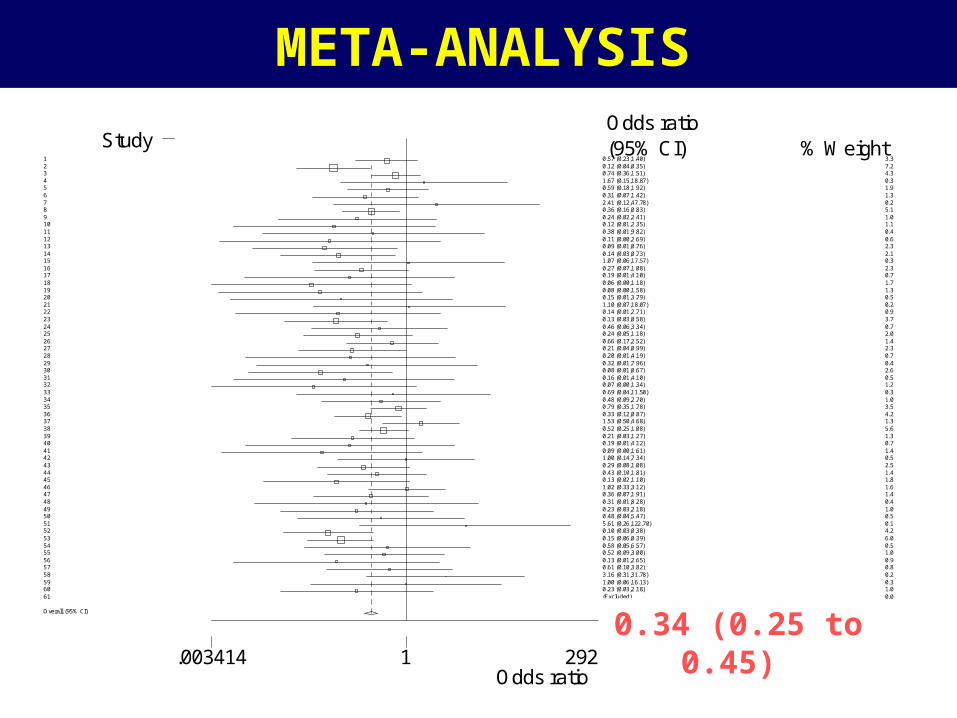
1) Cochrane review of 61 RCTs (Smaill & Hofmeyr 2001) evaluating prophylactic antibiotics use for caesarean section
2) Meta-analysis of 61 RCTs to obtain Odds Ratio (OR)
METHOD OUTLINE
Odds ratio.003414 1 292.892
Study % Weight Odds ratio (95% CI) 0.57 (0.23,1.40) 1 3.3 0.12 (0.04,0.35) 2 7.2 0.74 (0.36,1.51) 3 4.3 1.67 (0.15,18.87) 4 0.3 0.59 (0.18,1.92) 5 1.9 0.31 (0.07,1.42) 6 1.3 2.41 (0.12,47.78) 7 0.2 0.36 (0.16,0.83) 8 5.1 0.24 (0.02,2.41) 9 1.0 0.12 (0.01,2.35) 10 1.1 0.38 (0.01,9.82) 11 0.4 0.11 (0.00,2.69) 12 0.6 0.09 (0.01,0.76) 13 2.3 0.14 (0.03,0.73) 14 2.1 1.07 (0.06,17.57) 15 0.3 0.27 (0.07,1.08) 16 2.3 0.19 (0.01,4.10) 17 0.7 0.06 (0.00,1.18) 18 1.7 0.08 (0.00,1.58) 19 1.3 0.15 (0.01,3.79) 20 0.5 1.10 (0.07,18.07) 21 0.2 0.14 (0.01,2.71) 22 0.9 0.13 (0.03,0.58) 23 3.7 0.46 (0.06,3.34) 24 0.7 0.24 (0.05,1.18) 25 2.0 0.66 (0.17,2.52) 26 1.4 0.21 (0.04,0.99) 27 2.3 0.20 (0.01,4.19) 28 0.7 0.32 (0.01,7.96) 29 0.4 0.08 (0.01,0.67) 30 2.6 0.16 (0.01,4.10) 31 0.5 0.07 (0.00,1.34) 32 1.2 0.69 (0.04,11.50) 33 0.3 0.48 (0.09,2.70) 34 1.0 0.79 (0.35,1.78) 35 3.5 0.33 (0.12,0.87) 36 4.2 1.53 (0.50,4.68) 37 1.3 0.52 (0.25,1.08) 38 5.6 0.21 (0.03,1.27) 39 1.3 0.19 (0.01,4.12) 40 0.7 0.09 (0.00,1.61) 41 1.4 1.00 (0.14,7.34) 42 0.5 0.29 (0.08,1.08) 43 2.5 0.43 (0.10,1.81) 44 1.4 0.13 (0.02,1.10) 45 1.8 1.02 (0.33,3.12) 46 1.6 0.36 (0.07,1.91) 47 1.4 0.31 (0.01,8.28) 48 0.4 0.23 (0.03,2.18) 49 1.0 0.48 (0.04,5.47) 50 0.5 5.61 (0.26,122.70) 51 0.1 0.10 (0.03,0.38) 52 4.2 0.15 (0.06,0.39) 53 6.0 0.58 (0.05,6.57) 54 0.5 0.52 (0.09,3.00) 55 1.0 0.13 (0.01,2.65) 56 0.9 0.61 (0.10,3.82) 57 0.8 3.16 (0.31,31.78) 58 0.2 1.00 (0.06,16.13) 59 0.3 0.23 (0.03,2.18) 60 1.0
61 0.0 (Excluded)
0.36 (0.30,0.44) Overall (95% CI)
META-ANALYSIS
0.34 (0.25 to 0.45)
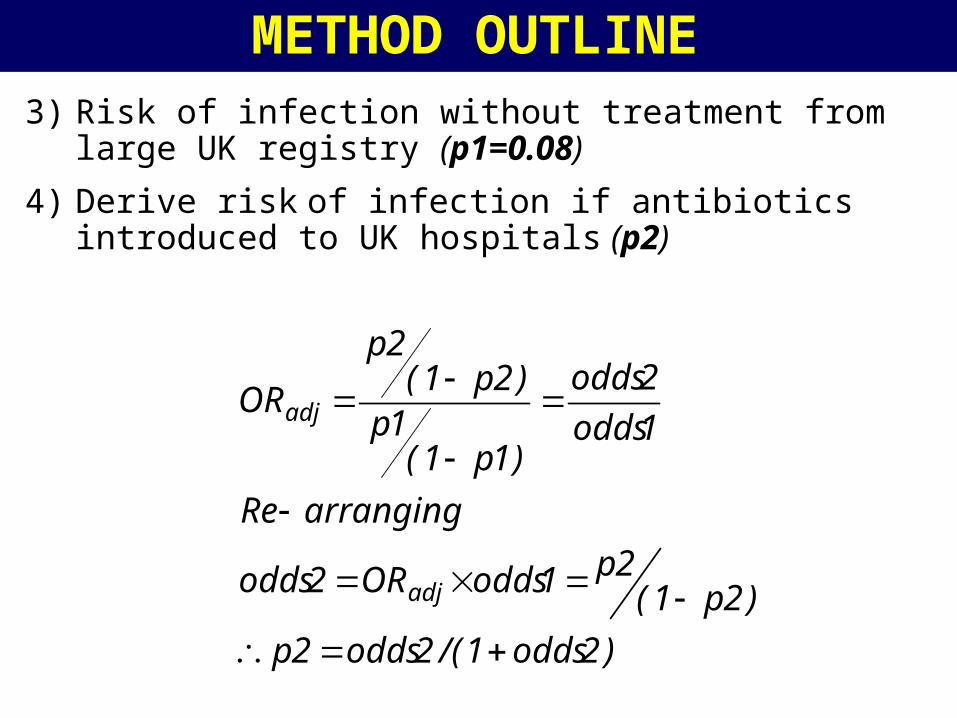
3) Risk of infection without treatment from large UK registry (p1=0.08)
4) Derive risk of infection if antibiotics introduced to UK hospitals (p2)
METHOD OUTLINE
)2odds1/(2odds2p
)2p1(2p1oddsOR2odds
arrangingRe
1odds
2odds
)1p1(1p
)2p1(2p
OR
adj
adj
RESULTS
0.080 (0.078 to 0.82)
p1 sample: 10000
0.076 0.078 0.08 0.082
0.0
200.0
400.0
p1
No infection (1-p2) Cost with antibiotics
Yes
Infection (p2) Cost with antibiotics + Cost of treatment
Prophylactic antibiotics?
No infection (1-p1) Cost with no antibiotics
No
Infection (p1) Cost of treatment
p20.02
(0.02 to 0.03)
prob.ant[1] sample: 10000
0.01 0.02 0.03 0.04 0.05
0.0 25.0 50.0 75.0 100.0
(1+ )
odds.ant[1] sample: 10000
0.01 0.02 0.03 0.04
0.0 25.0 50.0 75.0 100.0
odds.ant[1] sample: 10000
0.01 0.02 0.03 0.04
0.0 25.0 50.0 75.0 100.0
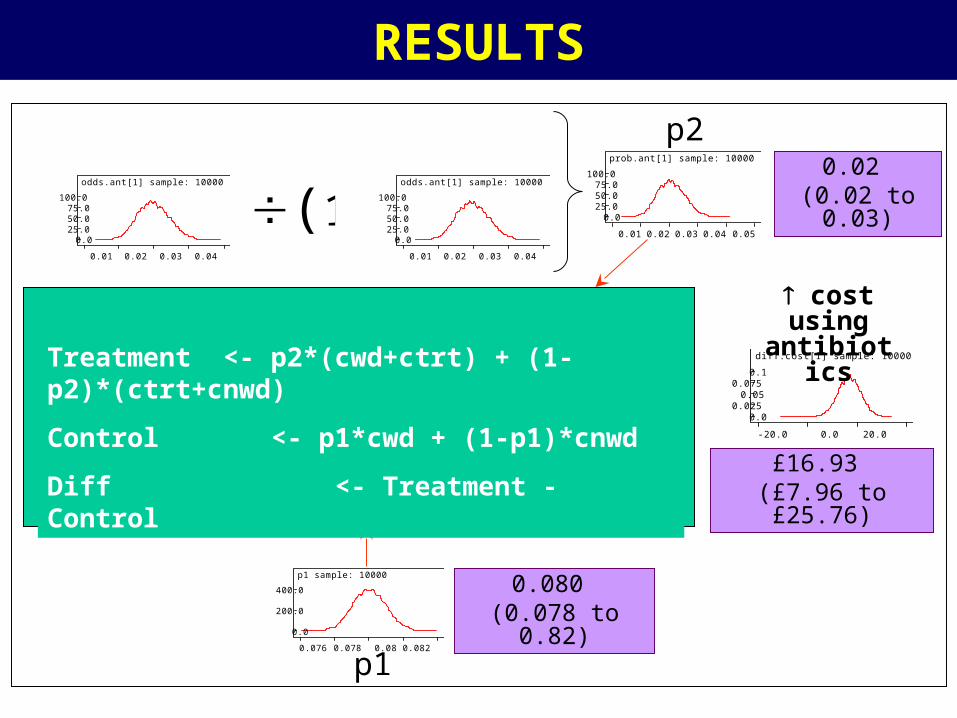
0.02 (0.02 to 0.03)(1+
)
p2
RESULTS
0.080 (0.078 to 0.82)
p1 sample: 10000
0.076 0.078 0.08 0.082
0.0
200.0
400.0
p1
No infection (1-p2) Cost with antibiotics
Yes
Infection (p2) Cost with antibiotics + Cost of treatment
Prophylactic antibiotics?
No infection (1-p1) Cost with no antibiotics
No
Infection (p1) Cost of treatment
odds.ant[1] sample: 10000
0.01 0.02 0.03 0.04
0.0 25.0 50.0 75.0 100.0
prob.ant[1] sample: 10000
0.01 0.02 0.03 0.04 0.05
0.0 25.0 50.0 75.0 100.0
odds.ant[1] sample: 10000
0.01 0.02 0.03 0.04
0.0 25.0 50.0 75.0 100.0
diff.cost[1] sample: 10000
-20.0 0.0 20.0
0.0 0.025 0.05 0.075 0.1
cost using antibiotics
£16.93 (£7.96 to £25.76)
Treatment <- p2*(cwd+ctrt) + (1-p2)*(ctrt+cnwd)
Control <- p1*cwd + (1-p1)*cnwd
Diff <- Treatment - Control

-10
-5
0
5
10
15
20
25
30
35
40
-0.005 0 0.005 0.01 0.015 0.02 0.025
Incremental utility
Inc
rem
en
tal
co
st
RESULTS: COST-EFFECTIVENESS PLANE
Bayesian (MCMC) simulations
Treatment more effective but more costly
Treatment dominates
Control dominates
Treatment less costly but less effective
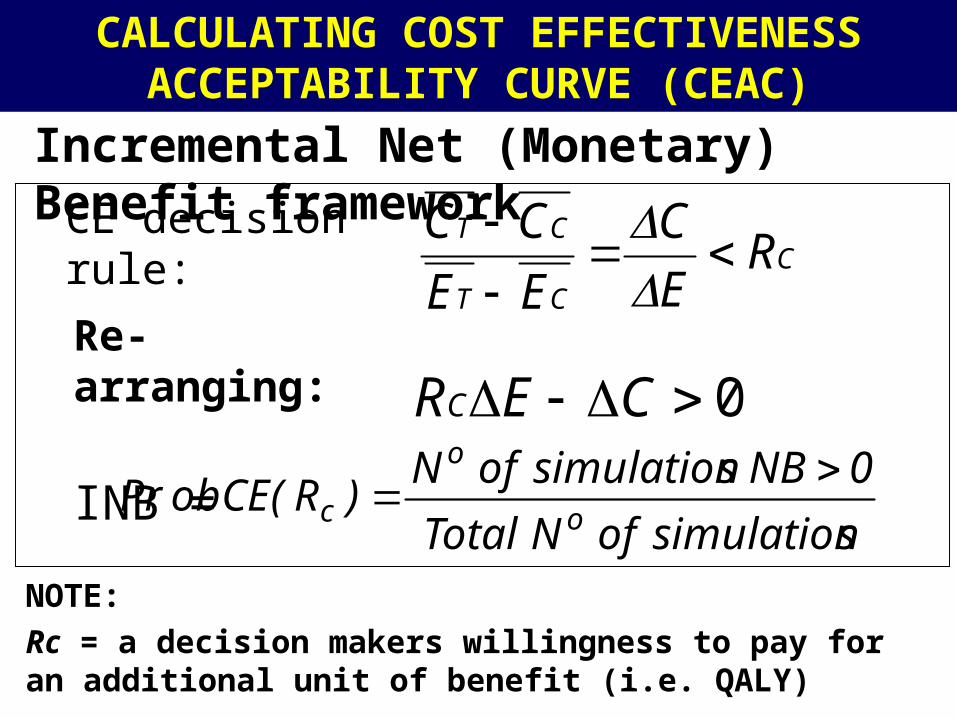
CALCULATING COST EFFECTIVENESS
ACCEPTABILITY CURVE (CEAC)
Incremental Net (Monetary) Benefit framework
NOTE:
Rc = a decision makers willingness to pay for an additional unit of benefit (i.e. QALY)
C
CT
CTR
E
C
EE
CC
0 CERC
CE decision rule:
Re-arranging:
INB =
ssimulationofNTotal
0NBssimulationofN)R(obCEPr
o
o
c
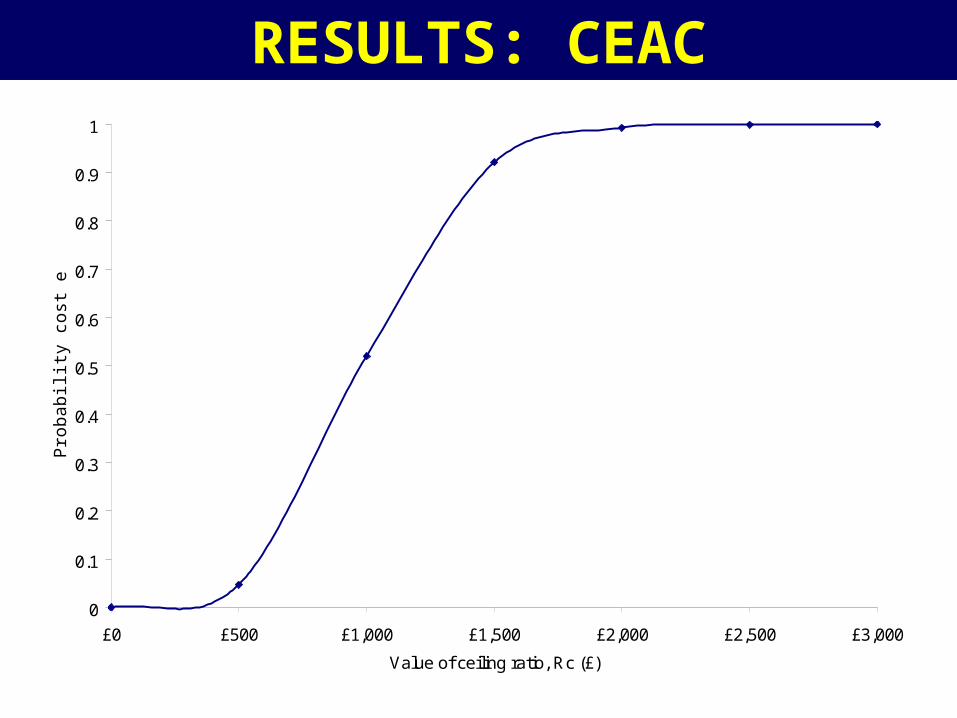
RESULTS: CEAC
0
0.1
0.2
0.3
0.4
0.5
0.6
0.7
0.8
0.9
1
£0 £500 £1,000 £1,500 £2,000 £2,500 £3,000
Value of ceiling ratio, Rc (£)
Pro
ba
bili
ty c
ost
eff
ect
ive
2) CLINICAL EVALUATION OF DIAGNOSTIC TESTS

EVALUATION OF DIAGNOSTIC TESTS
• Consider a population to be made up of 2 groups:– Those with a disease
– Those without the disease
• A test aims to identify people as belonging to one of these two groups
• Often a ‘Gold Standard’ test can perfectly distinguish groups, but cannot be used in routine practice (eg pathology)
• Other imperfect tests are available, yielding continuous diagnostic markers
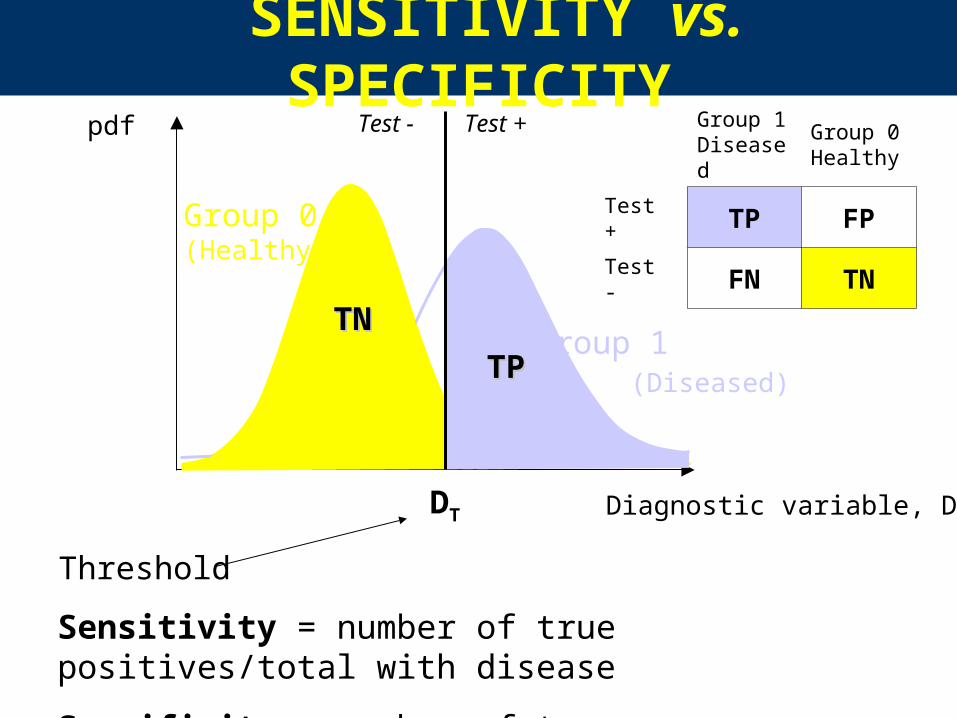
SENSITIVITY vs. SPECIFICITYpdf
Diagnostic variable, D
Group 0(Healthy)
Group 1 (Diseased)TPTP
TNTN
Group 1Diseased
Group 0Healthy
Test + TP FP
Test - FN TN
DT
Test +Test -
Threshold
Sensitivity = number of true positives/total with disease
Specificity = number of true negatives/total without disease
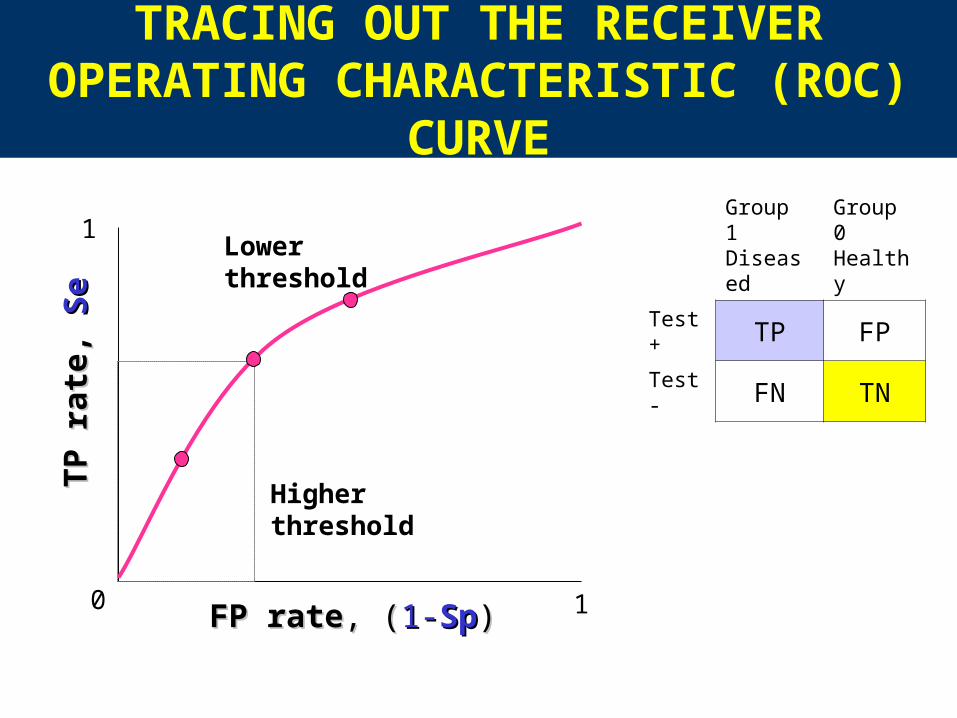
TRACING OUT THE RECEIVER OPERATING CHARACTERISTIC
(ROC) CURVEGroup 1Diseased
Group 0Healthy
Test + TP FP
Test - FN TN
TP
rat
e,T
P r
ate,
Se
Se
FP rateFP rate,, ((1-1-SpSp))0
1
1
Lower threshold
Higherthreshold

SELECTING THE THRESHOLD
Accuracy (Se x Sp)
T
Ignores relative opportunity costs of FP and FN results
Point T gives Point T gives Max accuracyMax accuracythreshold Dthreshold DTT
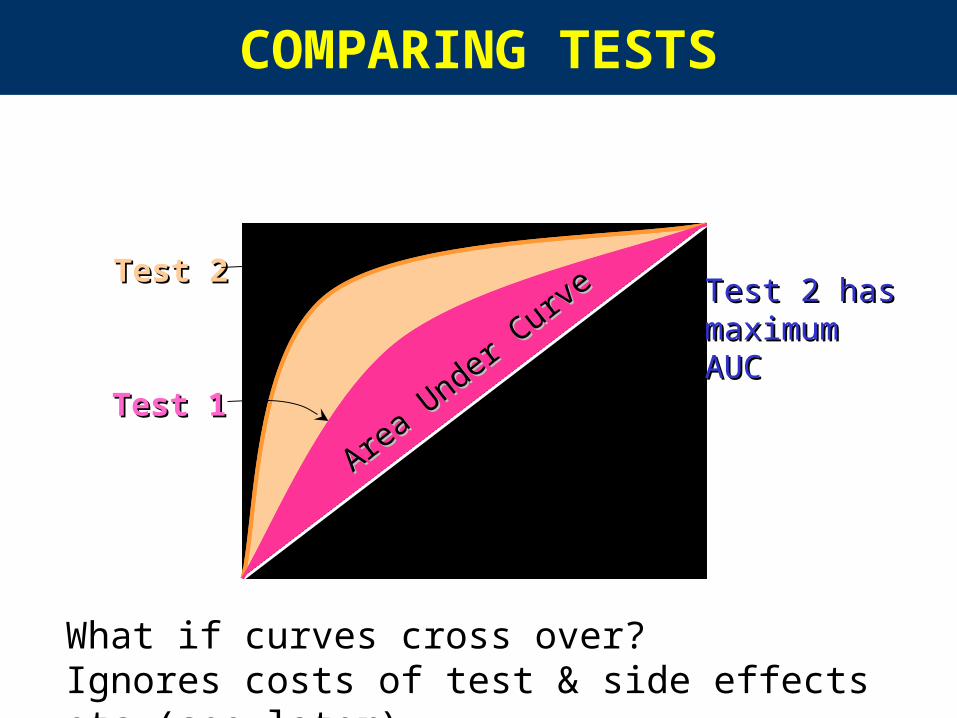
COMPARING TESTS
Area Under C
urve
Area Under C
urve
What if curves cross over?Ignores costs of test & side effects etc (see later)
Test 2 has Test 2 has maximummaximumAUC AUC
Test 2Test 2
Test 1Test 1

3) META-ANALYSIS OF DIAGNOSTIC TEST EVALUATION DATA
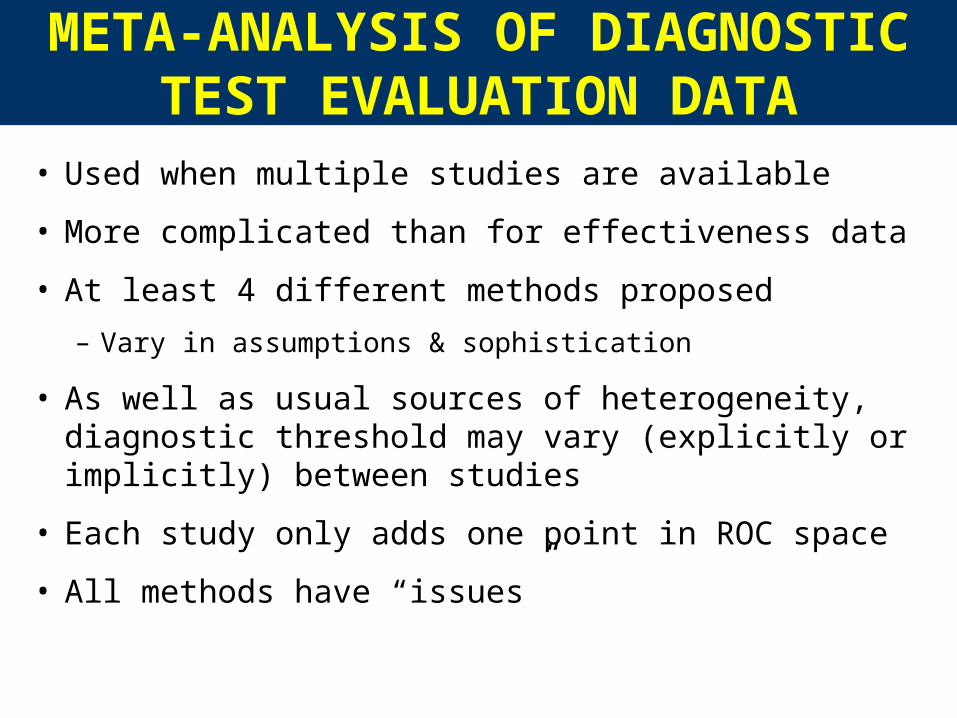
META-ANALYSIS OF DIAGNOSTIC TEST EVALUATION DATA
• Used when multiple studies are available
• More complicated than for effectiveness data
• At least 4 different methods proposed
– Vary in assumptions & sophistication
• As well as usual sources of heterogeneity, diagnostic threshold may vary (explicitly or implicitly) between studies
• Each study only adds one point in ROC space
• All methods have “issues”
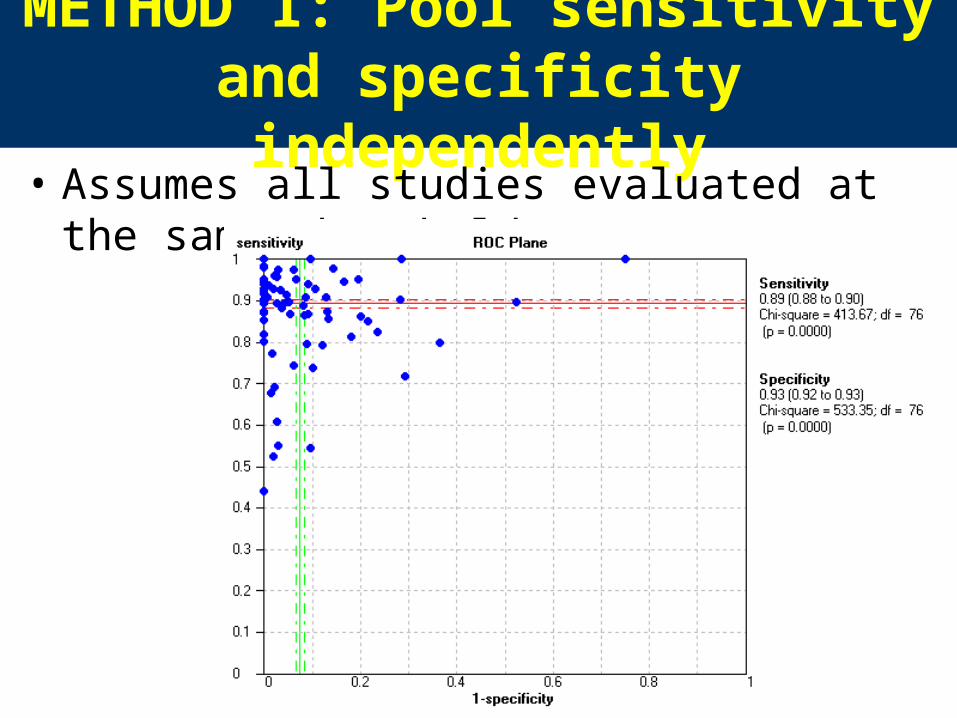
METHOD 1: Pool sensitivity and specificity independently
• Assumes all studies evaluated at the same threshold

METHOD 2: Sens. & Spec. Bivariate meta-analysis
model• Correlation between sensitivity and specificity
taken into account
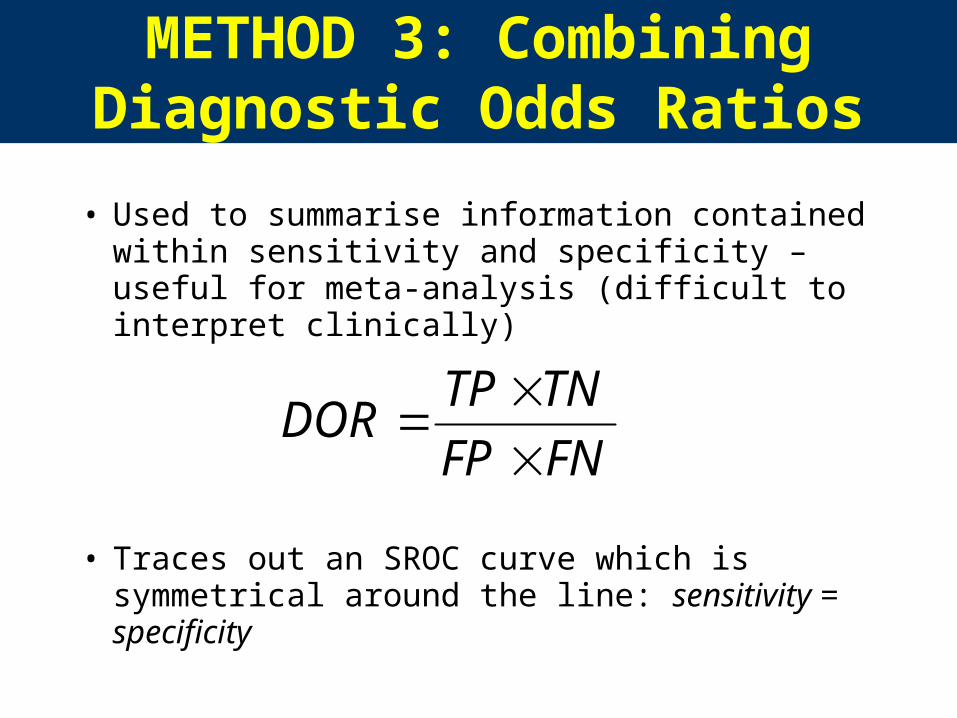
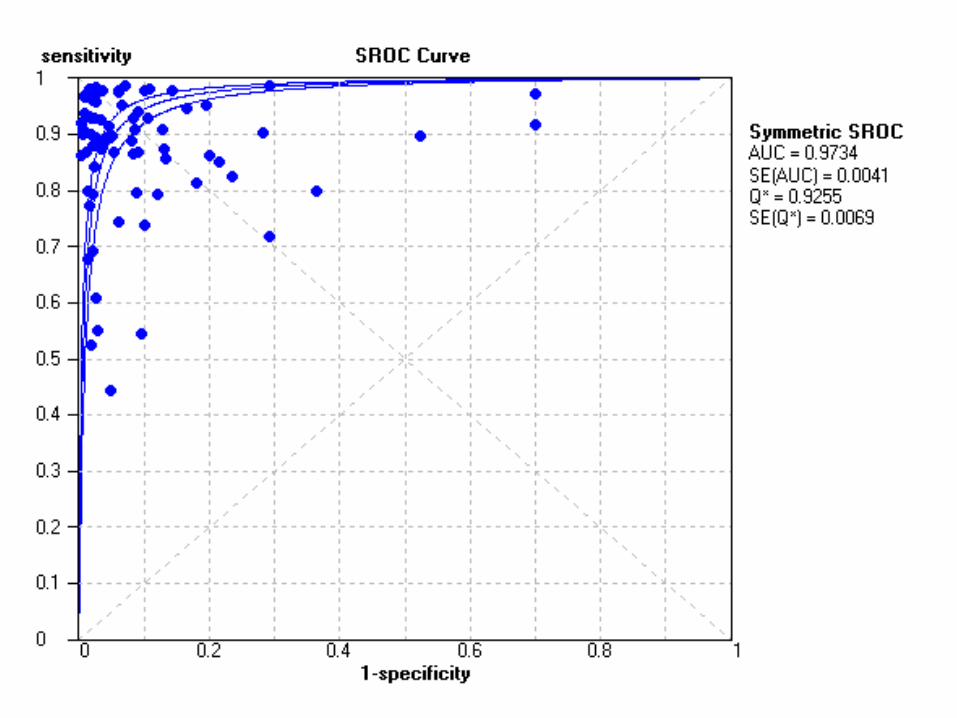
METHOD 3: Combining Diagnostic Odds Ratios
• Used to summarise information contained within sensitivity and specificity – useful for meta-analysis (difficult to interpret clinically)
• Traces out an SROC curve which is symmetrical around the line: sensitivity = specificity
FNFP
TNTPDOR
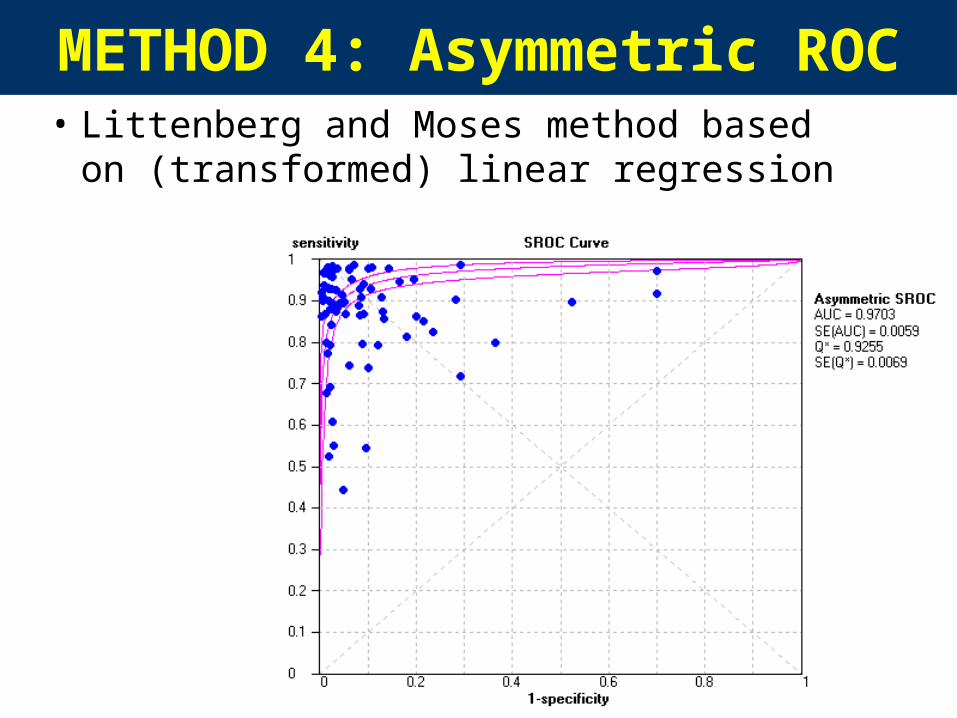
METHOD 4: Asymmetric ROC
• Littenberg and Moses method based on (transformed) linear regression

ISSUES
• Output format of models is different: points, ellipses, SROC curves
• None of these methods allow for explicit incorporation of threshold data (even if know)
• Further options of fixed/random study effects and weighting schemes
– Can make a lot of difference!
• Not clear multiple summary data necessary better than one good IPD study from which ROC can be derived???
• Little work done how these methods ‘interface’ with a decision models
4) ECONOMIC EVALUATION OF DIAGNOSTIC TESTS
• For a full (economic) evaluation consider “bigger picture” of how test(s) fit in with treatment and clinical outcomes beyond the test (as well as costs)
• Decision modelling techniques used to evaluate diagnosis because:
i) RCT evaluation through to treatment and clinical outcomes can be large, costly and lengthy
ii) All tests/test combinations of interest may not have been compared in RCTs
• Diagnostic test models outlined using an individual study of diagnostic performance (Laking et al., submitted)
DIAGNOSTIC TEST DECISION MODELS
-2.95 -2.90 -2.85 -2.80 -2.75 -2.70 -2.65
02
46
81
0
-2.95 -2.90 -2.85 -2.80 -2.75 -2.70 -2.65
02
46
81
0
-2.95 -2.90 -2.85 -2.80 -2.75 -2.70 -2.65
02
46
81
0
-2.95 -2.90 -2.85 -2.80 -2.75 -2.70 -2.65
02
46
81
0
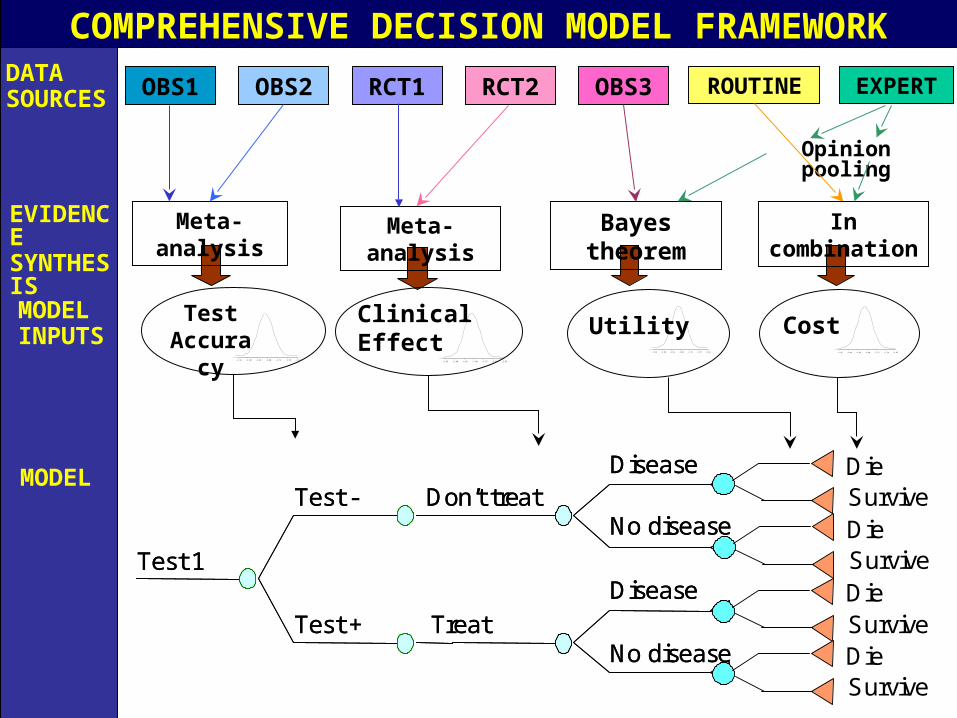
OBS1 OBS2 RCT1 RCT2 OBS3 ROUTINE EXPERTDATA SOURCES
Meta-analysisEVIDENCESYNTHESIS
COMPREHENSIVE DECISION MODEL FRAMEWORK
Clinical Effect
Utility Cost
Opinion pooling
Bayes theorem In combination
Test -
Test +
Disease
No disease
Disease
No disease
Don’t treat
Treat
Test 1
Test -
Test +
Disease
No disease
Disease
No disease
Don’t treat
Treat
Test 1
DieSurviveDieSurviveDieSurviveDieSurvive
Test Accuracy
MODEL INPUTS
Meta-analysis
MODEL

5) EXAMPLE: DIAGNOSTIC TESTING FOR DEEP VEIN THROMBOSIS (DVT)
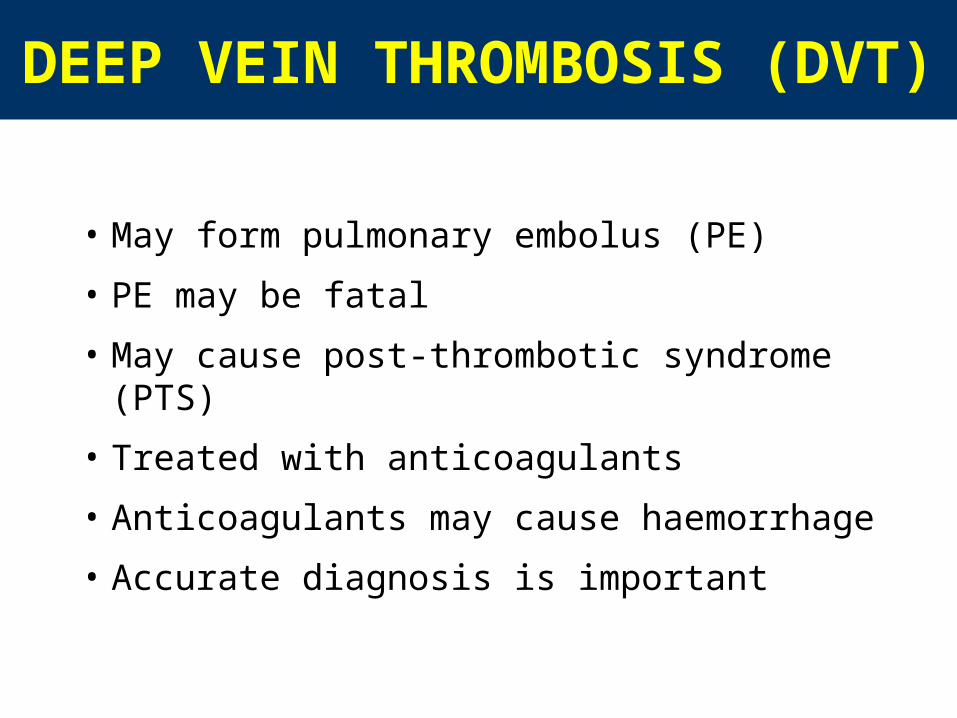
DEEP VEIN THROMBOSIS (DVT)
• May form pulmonary embolus (PE)
• PE may be fatal
• May cause post-thrombotic syndrome (PTS)
• Treated with anticoagulants
• Anticoagulants may cause haemorrhage
• Accurate diagnosis is important
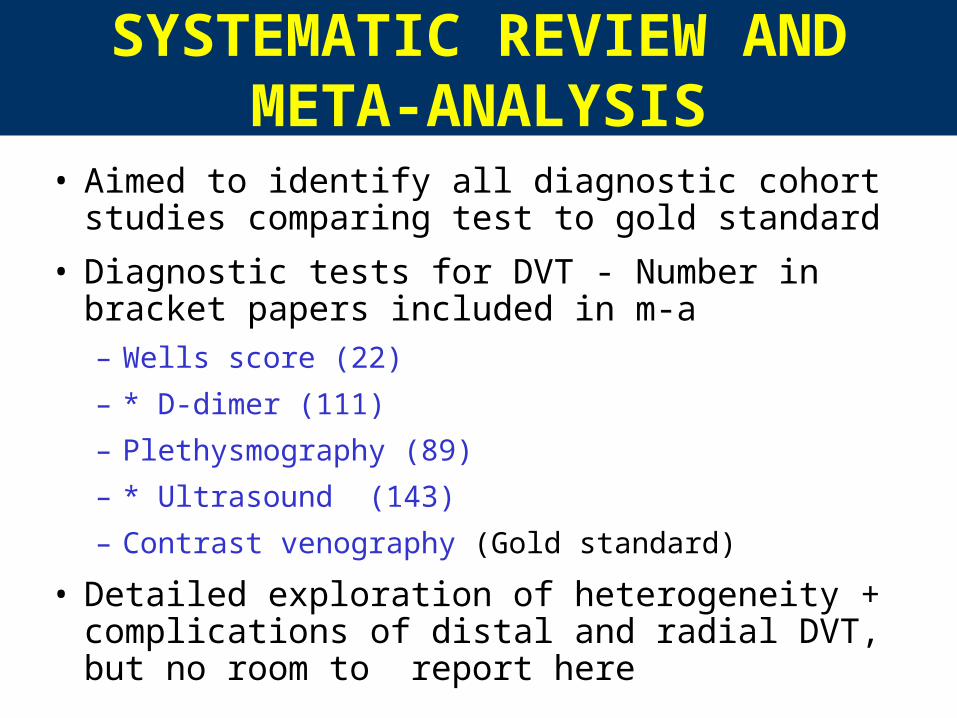
SYSTEMATIC REVIEW AND META-ANALYSIS
• Aimed to identify all diagnostic cohort studies comparing test to gold standard
• Diagnostic tests for DVT - Number in bracket papers included in m-a– Wells score (22)
– * D-dimer (111)
– Plethysmography (89)
– * Ultrasound (143)
– Contrast venography (Gold standard)
• Detailed exploration of heterogeneity + complications of distal and radial DVT, but no room to report here
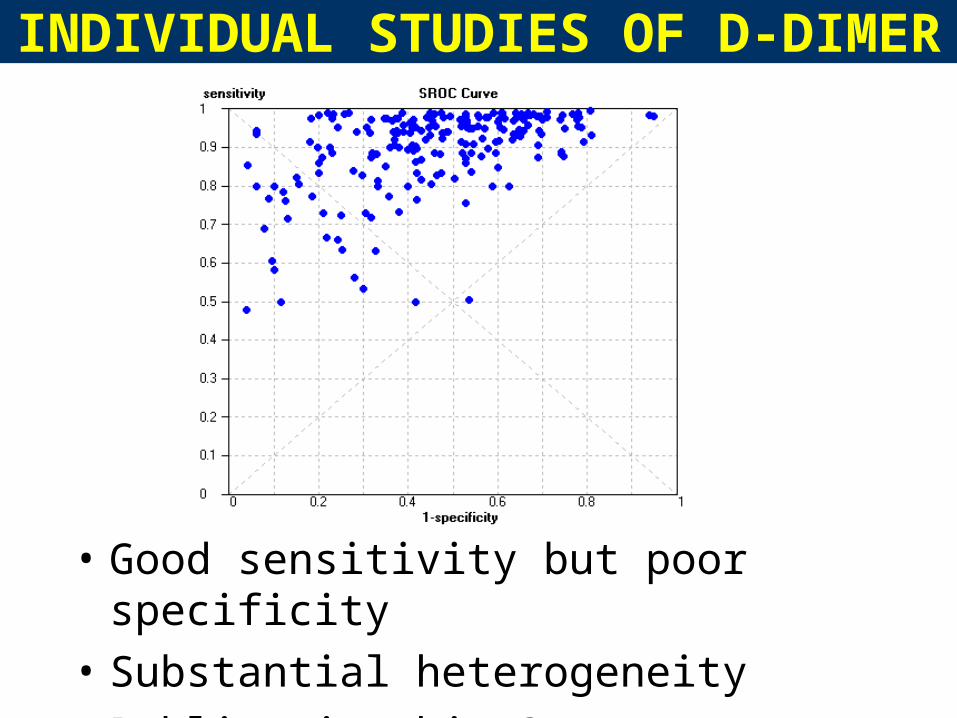
INDIVIDUAL STUDIES OF D-DIMER
• Good sensitivity but poor specificity
• Substantial heterogeneity
• Publication bias?

INDIVIDUAL ULTRASOUND STUDIES
• High accuracy
• Needs a (highly) trained operator (expensive)

DVT DECISION MODELOBJECTIVE: To evaluate the cost-effectiveness
of diagnostic strategies for DVT
In “real” evaluation:
– Literature review: 16 diagnostic strategies
– NHS survey: 11 additional strategies
– Theoretical: 5 additional “strategies”
– 32 possible options using combinations of tests
For illustration purposes, evaluating (singularly):
– Ultrasound v. D-dimer v. Nothing (no treat)
– Structure of model post test slightly simplified also

THE MODEL
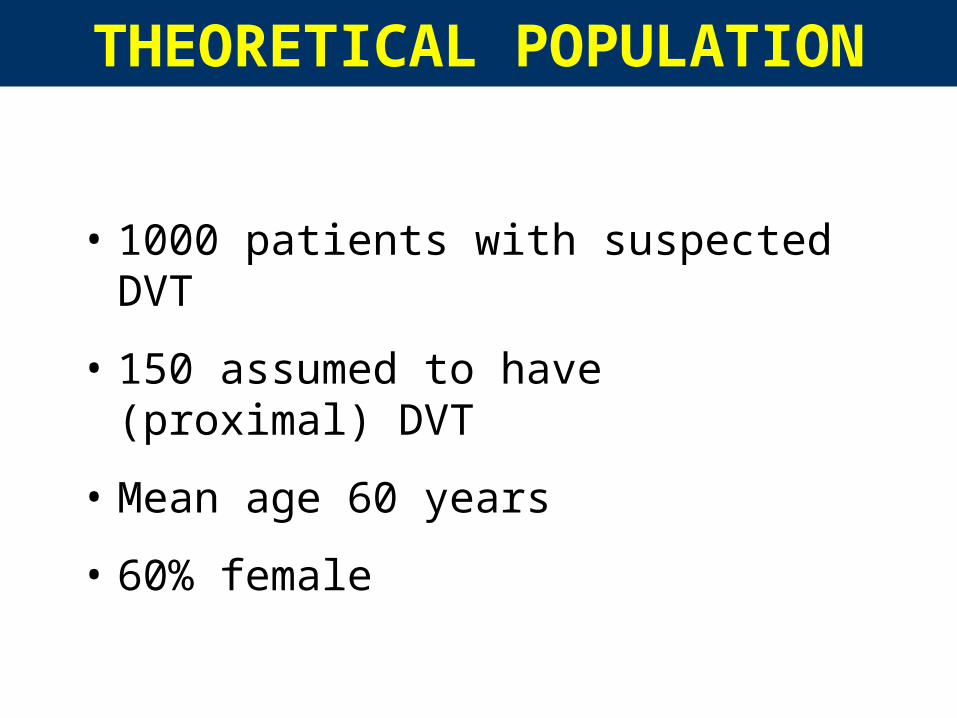
THEORETICAL POPULATION
• 1000 patients with suspected DVT
• 150 assumed to have (proximal) DVT
• Mean age 60 years
• 60% female
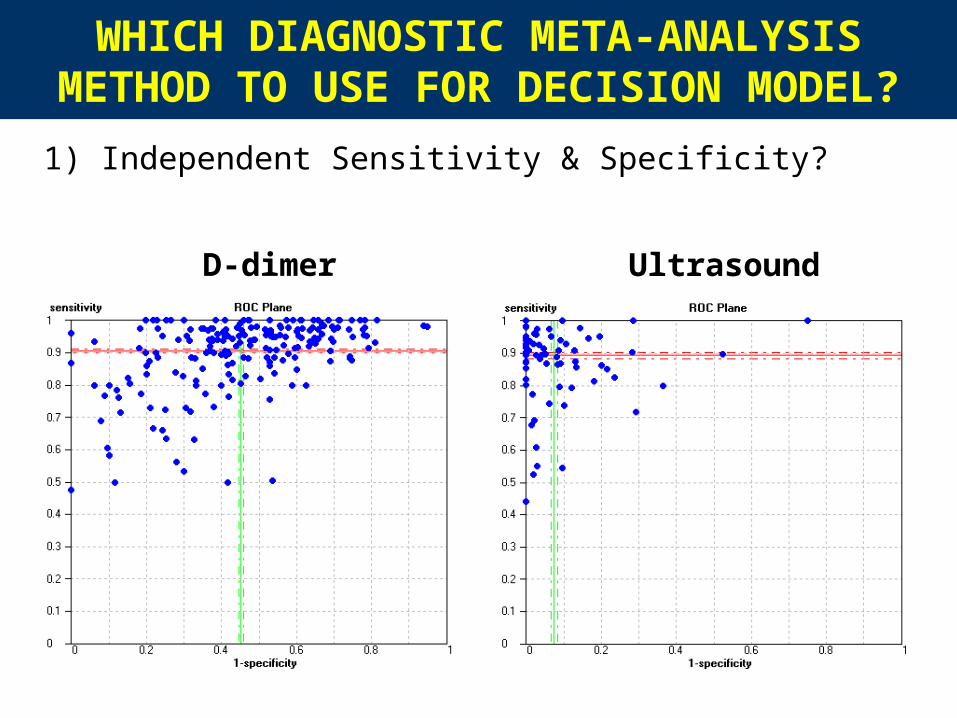
WHICH DIAGNOSTIC META-ANALYSIS METHOD TO USE FOR
DECISION MODEL?1) Independent Sensitivity & Specificity?
D-dimer Ultrasound
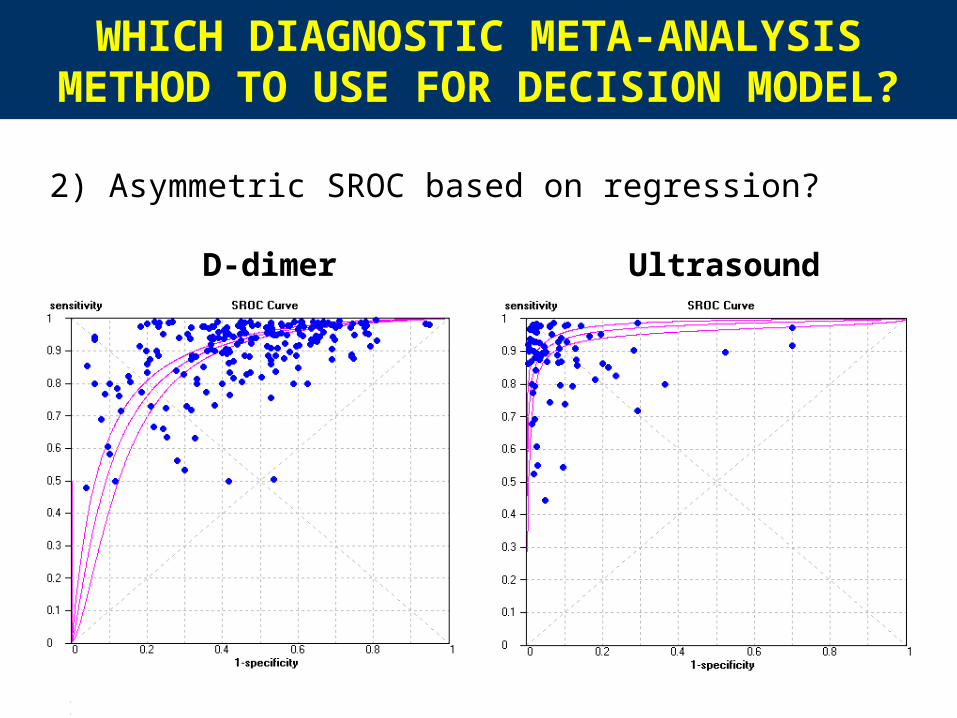
WHICH DIAGNOSTIC META-ANALYSIS METHOD TO USE FOR
DECISION MODEL?
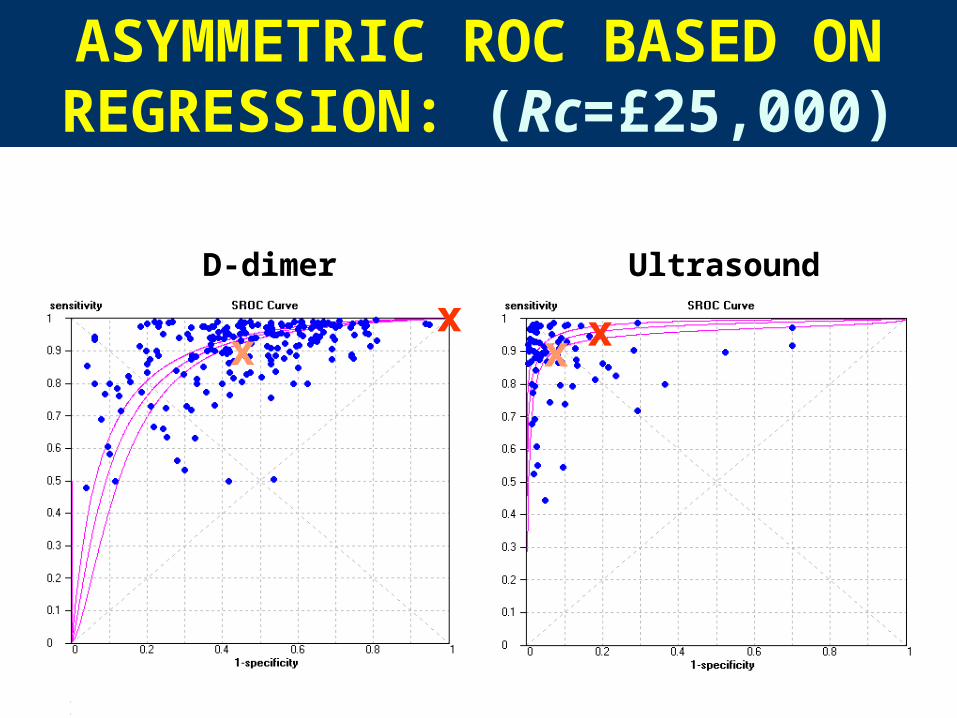
2) Asymmetric SROC based on regression?
D-dimer Ultrasound
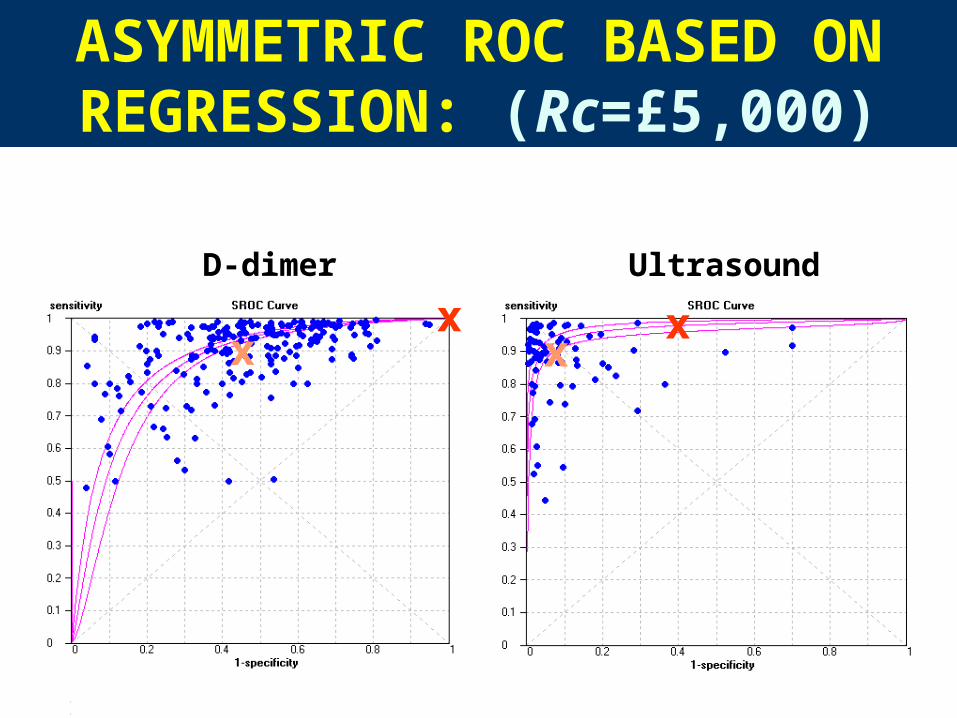
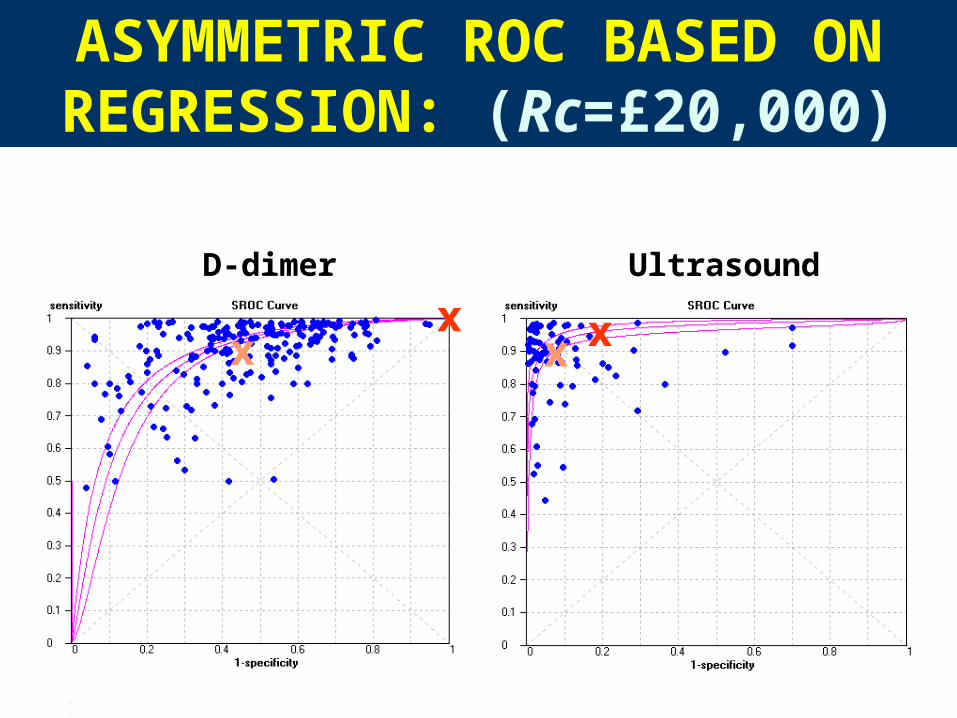
WHICH POINT ON SROC CURVE SHOULD BE USED?
• Evaluate decision model along curve to identify specificity and sensitivity combinations which maximise net benefit (Rceffect – cost, where Rc=decision-makers willingness to pay per additional QALY)– Threshold may change with Rc
– Compare tests using these thresholds
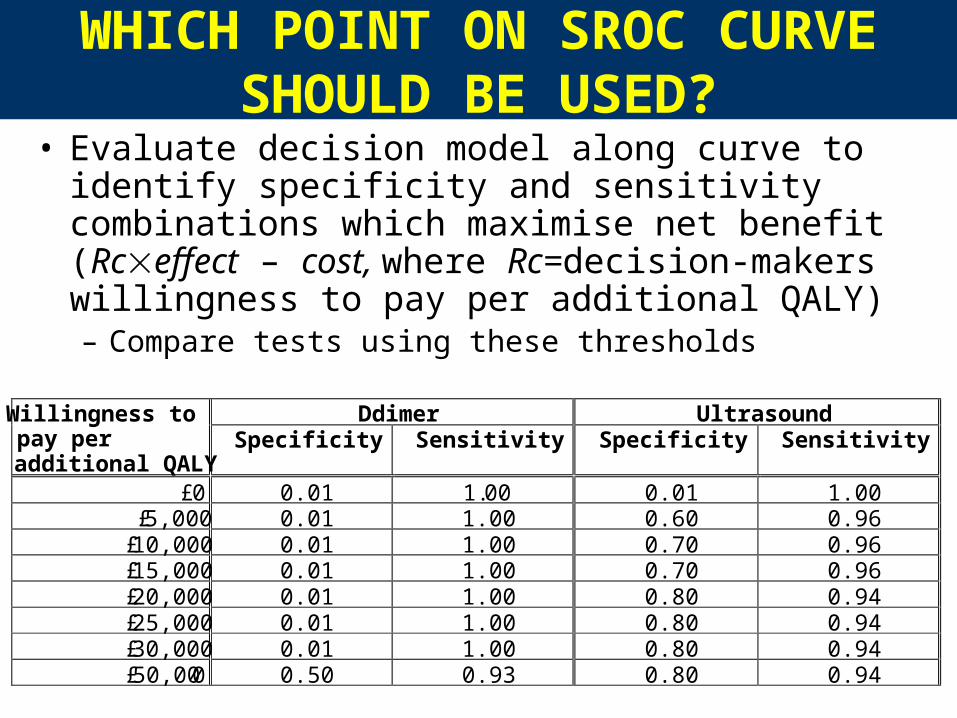
WHICH POINT ON SROC CURVE SHOULD BE USED?
• Evaluate decision model along curve to identify specificity and sensitivity combinations which maximise net benefit (Rceffect – cost, where Rc=decision-makers willingness to pay per additional QALY)– Compare tests using these thresholds
Ddimer Ultrasound Willingness to pay per additional QALY
Specificity Sensitivity Specificity Sensitivity
£0 0.01 1.00 0.01 1.00 £5,000 0.01 1.00 0.60 0.96
£10,000 0.01 1.00 0.70 0.96 £15,000 0.01 1.00 0.70 0.96 £20,000 0.01 1.00 0.80 0.94 £25,000 0.01 1.00 0.80 0.94 £30,000 0.01 1.00 0.80 0.94 £50,000 0.50 0.93 0.80 0.94
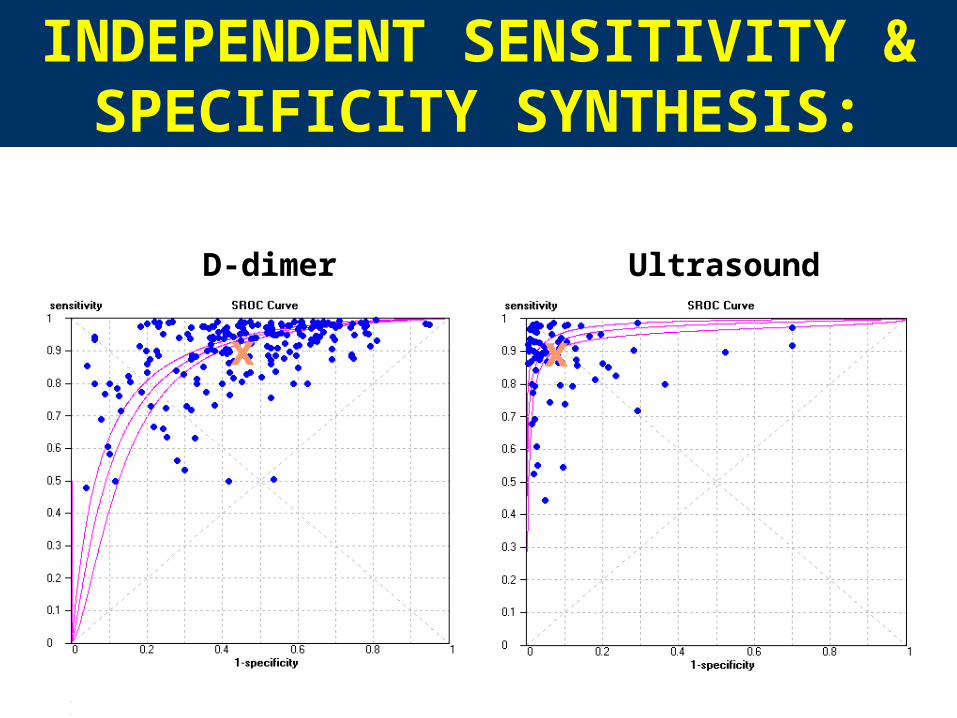
INDEPENDENT SENSITIVITY &
SPECIFICITY SYNTHESIS:
D-dimer Ultrasound
x x
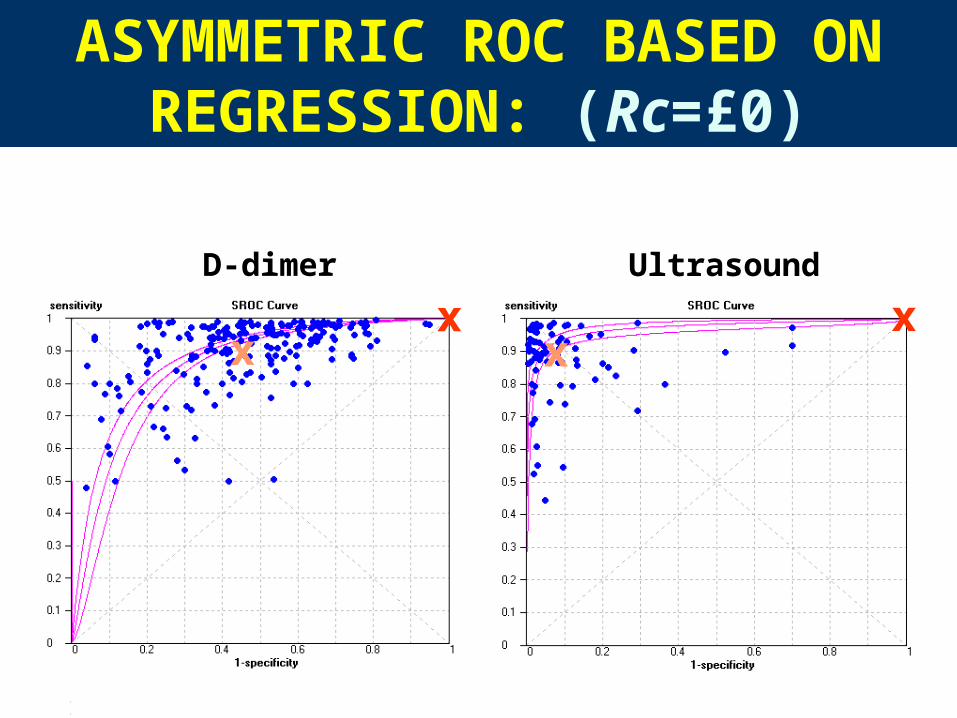
ASYMMETRIC ROC BASED ON REGRESSION: (Rc=£0)
D-dimer Ultrasound
xxx x
D-dimer Ultrasound
xxx x
ASYMMETRIC ROC BASED ON REGRESSION: (Rc=£5,000)

D-dimer Ultrasound
xxx x
ASYMMETRIC ROC BASED ON REGRESSION: (Rc=£10,000)

D-dimer Ultrasound
xxx x
ASYMMETRIC ROC BASED ON REGRESSION: (Rc=£15,000)
D-dimer Ultrasound
xxx x
ASYMMETRIC ROC BASED ON REGRESSION: (Rc=£20,000)
D-dimer Ultrasound
xxx x
ASYMMETRIC ROC BASED ON REGRESSION: (Rc=£25,000)

D-dimer Ultrasound
xxx x
ASYMMETRIC ROC BASED ON REGRESSION: (Rc=£30,000)

D-dimer Ultrasound
xxx x
ASYMMETRIC ROC BASED ON REGRESSION: (Rc=£50,000)
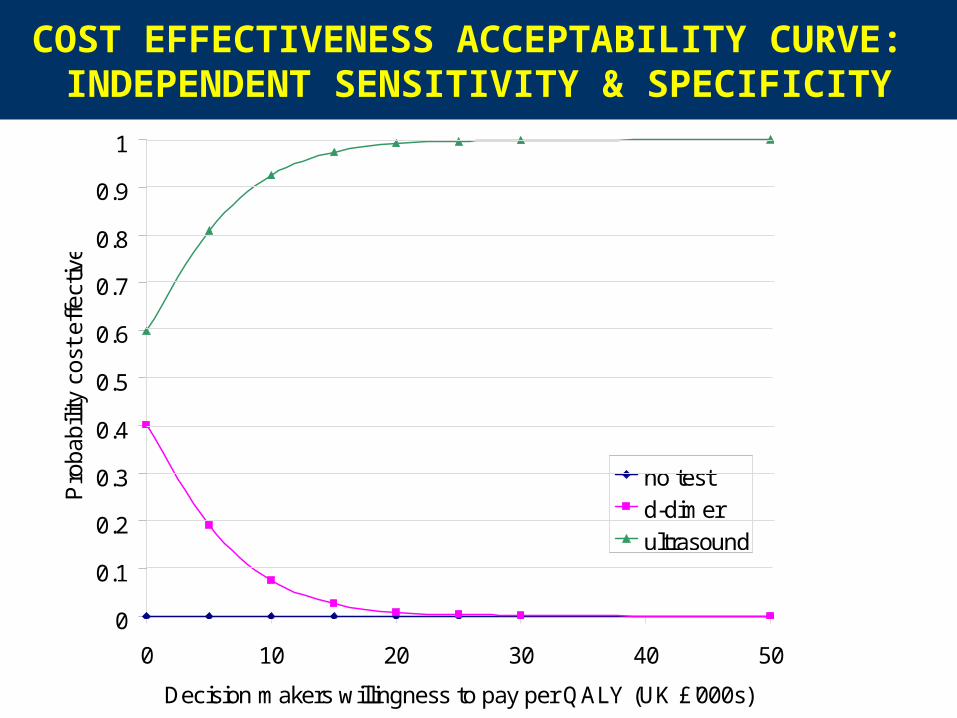
COST EFFECTIVENESS ACCEPTABILITY CURVE:
INDEPENDENT SENSITIVITY & SPECIFICITY
0
0.1
0.2
0.3
0.4
0.5
0.6
0.7
0.8
0.9
1
0 10 20 30 40 50
Decision makers willingness to pay per QALY (UK £'000s)
Pro
babi
lity
cost
eff
ectiv
e
no testd-dimerultrasound

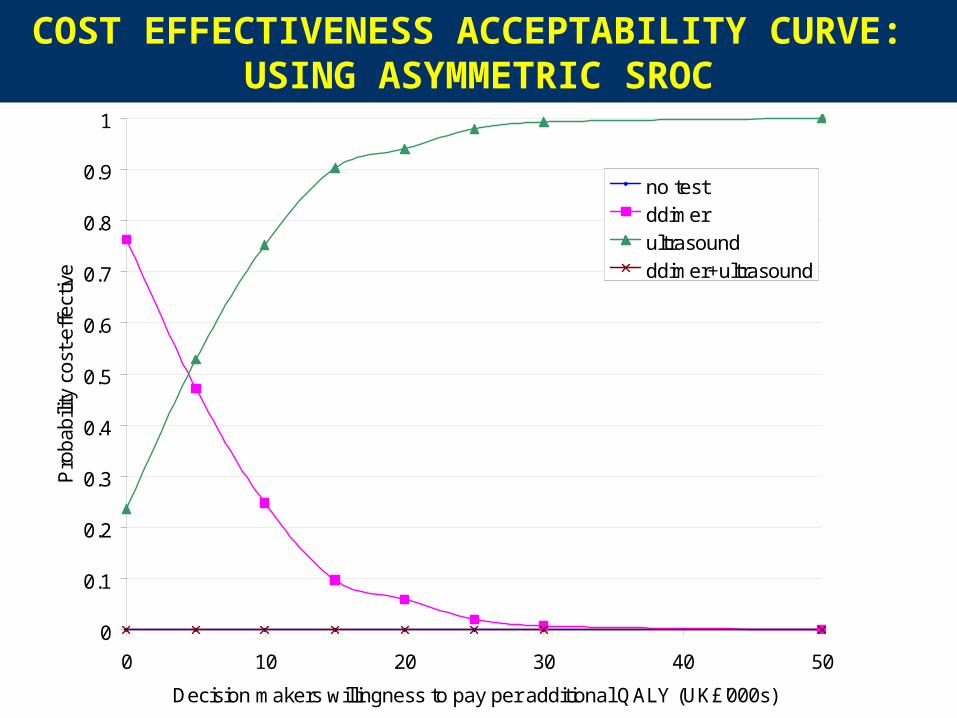
COST EFFECTIVENESS ACCEPTABILITY CURVE:
USING ASYMMETRIC SROC
0
0.1
0.2
0.3
0.4
0.5
0.6
0.7
0.8
0.9
1
0 10 20 30 40 50
Decision makers willingness to pay per additional QALY (UK£'000s)
Pro
babi
lity
cost
-eff
ectiv
e
no testddimerultrasound

EXTENSION: Adding combined strategy
‘Ddimer followed by Ultrasound’
ultrasound
ddimer
COST EFFECTIVENESS ACCEPTABILITY CURVE:
USING ASYMMETRIC SROC
0
0.1
0.2
0.3
0.4
0.5
0.6
0.7
0.8
0.9
1
0 10 20 30 40 50
Decision makers willingness to pay per additional QALY (UK£'000s)
Pro
babi
lity
cost
-eff
ectiv
e
no testddimerultrasoundddimer+ultrasound

6) DISCUSSION
METHODOLOGICAL ISSUES: General
• Although “optimal” point on the ROC curve can be identified – do not “know” corresponding threshold
• Threshold can be explicit (D-Dimer - numeric marker) or implicit (ultrasound – image interpretation)
– Latter may be difficult to build policy on
• Series or batteries of tests
– Issue of independence of diagnostic tests
– Often lack of good data on this, but could be crucial?
– Should we rethink the design of diagnostic studies???
METHODOLOGICAL ISSUES: Example specific
• Meta-analysis of diagnostic tests – substantial unexplained heterogeneity
• Uncertainty regarding effect of treatment
CONCLUSIONS• Evidence based economic evaluation of diagnostic
tests is difficult because of:
– Quality and format of test performance data
• Method of synthesis matters!
– Difficulty in establishing “best” method of synthesis
• Point estimate may be most easy to derive and use, but is it sensible?
– Is evidence synthesis the best way to go?
• One study evaluating all tests more valuable than the 500 in existence??
– Variable ability to move to different operating point on ROC & write related policy recommendations?
REFERENCES1. Cooper NJ, Sutton AJ, Abrams KR, Turner D,
Wailoo A. Comprehensive decision analytical modelling in economic evaluation: A Bayesian approach. Health Economics 2004; 13(3) 203-226
2. Deeks J.J. (2001) Systematic reviews of evaluations of diagnostic and screening tests. In Egger, M., Davey Smith, G. and Altman, D.G., (Eds.) Systematic Reviews in Health Care Meta-analysis in context, 2nd edn. London BMJ Publishing Group
3. Laking G, Lord J. Fischer A. The economics of diagnosis (Submitted)
4. Spiegelhalter DJ and Best NG Bayesian methods for evidence synthesis and complex cost-effectiveness models: an example in hip prostheses. Statistics in Medicine 2003; 22: 3687-3709
1. Cooper NJ, Sutton AJ, Abrams KR, Turner D, Wailoo A. Comprehensive decision analytical modelling in economic evaluation: A Bayesian approach. Health Economics 2004; 13(3) 203-226
2. Deeks J.J. (2001) Systematic reviews of evaluations of diagnostic and screening tests. In Egger, M., Davey Smith, G. and Altman, D.G., (Eds.) Systematic Reviews in Health Care Meta-analysis in context, 2nd edn. London BMJ Publishing Group
3. Laking G, Lord J. Fischer A. The economics of diagnosis (Submitted)
4. Spiegelhalter DJ and Best NG Bayesian methods for evidence synthesis and complex cost-effectiveness models: an example in hip prostheses. Statistics in Medicine 2003; 22: 3687-3709