Embed Size (px)
Citation preview

Alerting with Time Series
github.com/fabxc
@fabxc
Fabian Reinartz, CoreOS
Stream of <timestamp, value> pairs associated with an identifier
http_requests_total{job="nginx",instance="1.2.3.4:80",path="/status",status="200"}
1348 @ 1480502384
1899 @ 1480502389
2023 @ 1480502394
http_requests_total{job="nginx",instance="1.2.3.1:80",path="/settings",status="201"}
http_requests_total{job="nginx",instance="1.2.3.5:80",path="/",status="500"}
...
Time Series
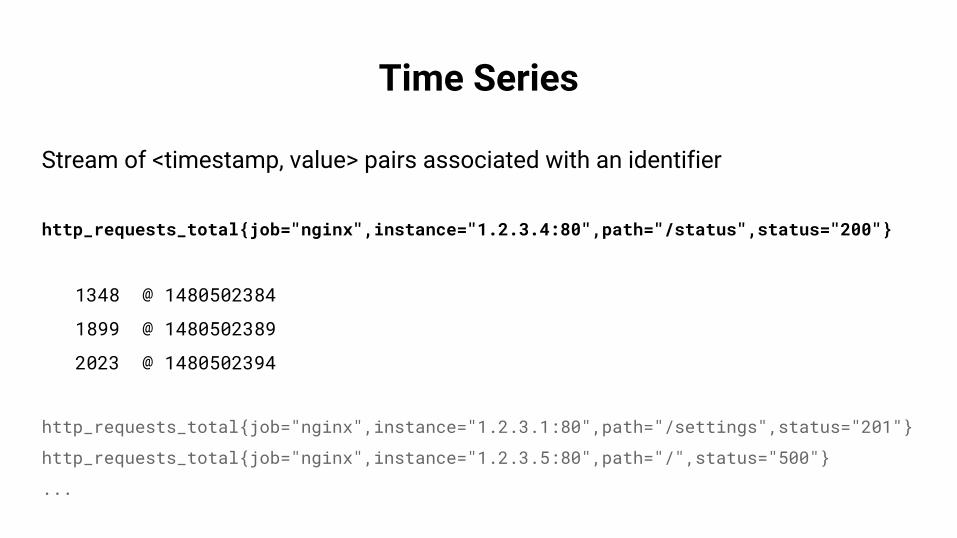
Stream of <timestamp, value> pairs associated with an identifier
sum by(path,status) (rate(http_requests_total{job="nginx"}[5m]))
{path="/status",status="200"} 32.13 @ 1480502384
{path="/status",status="500"} 19.133 @ 1480502394
{path="/profile",status="200"} 44.52 @ 1480502389
Time Series
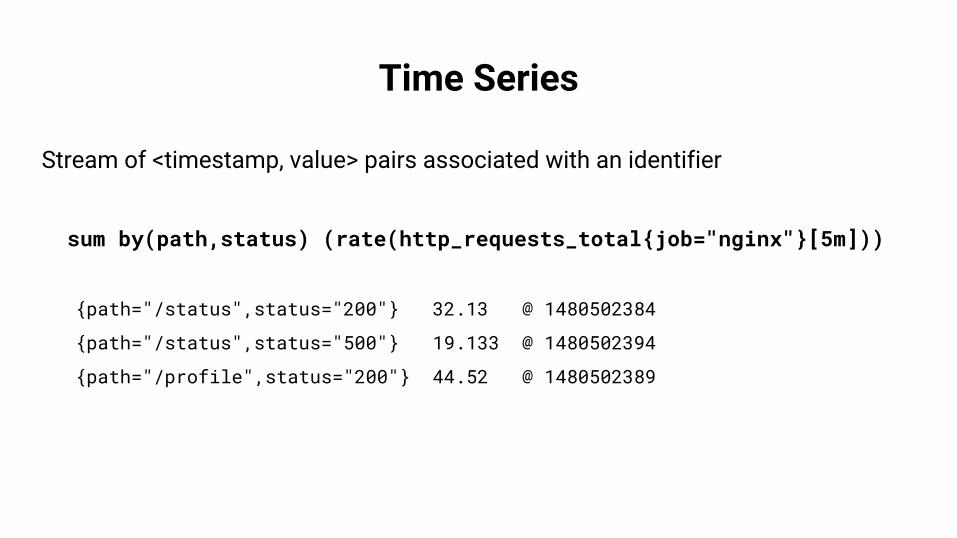
Prometheus
TargetsService Discovery
(Kubernetes, AWS, Consul, custom...)
GrafanaHTTP API
UI
A lot of traffic to monitorMonitoring traffic should not be proportional to user traffic
A lot of targets to monitorA single host can run hundreds of machines/procs/containers/...
Targets constantly changeDeployments, scaling up, scaling down, rolling-updates

Need a fleet-wide viewWhat’s my 99th percentile request latency across all frontends?
Drill-down for investigationWhich pod/node/... has turned unhealthy? How and why?
Monitor all levels, with the same system Query and correlate metrics across the stack

Translate that to
Meaningful Alerting

Anomaly Detection
Automated Alert Correlation
Self-Healing
Machine Learning
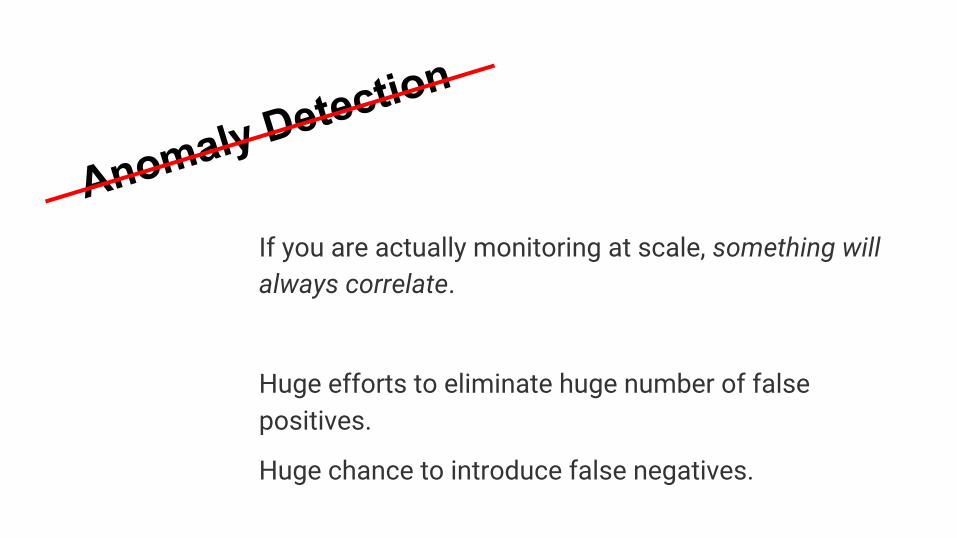
Anomaly Detection
If you are actually monitoring at scale, something will always correlate.
Huge efforts to eliminate huge number of false positives.
Huge chance to introduce false negatives.
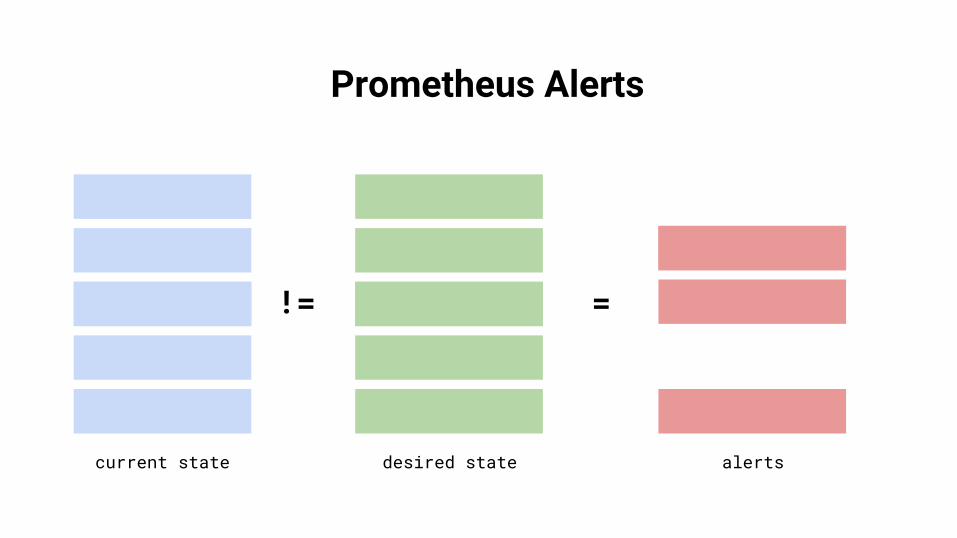
Prometheus Alerts
!= =
current state desired state alerts
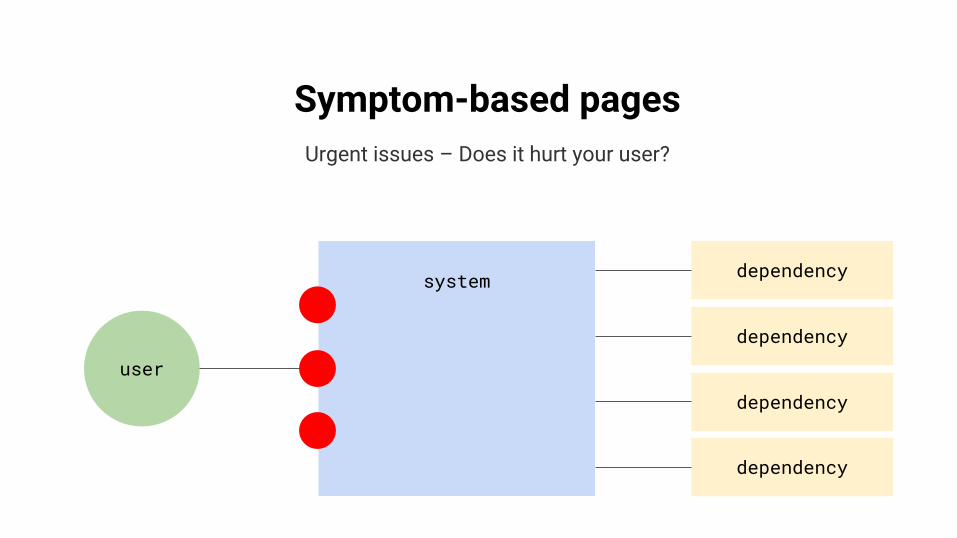
Symptom-based pages Urgent issues – Does it hurt your user?
system
user
dependency
dependency
dependency
dependency

LatencyFour Golden Signals
system
user
dependency
dependency
dependency
dependency
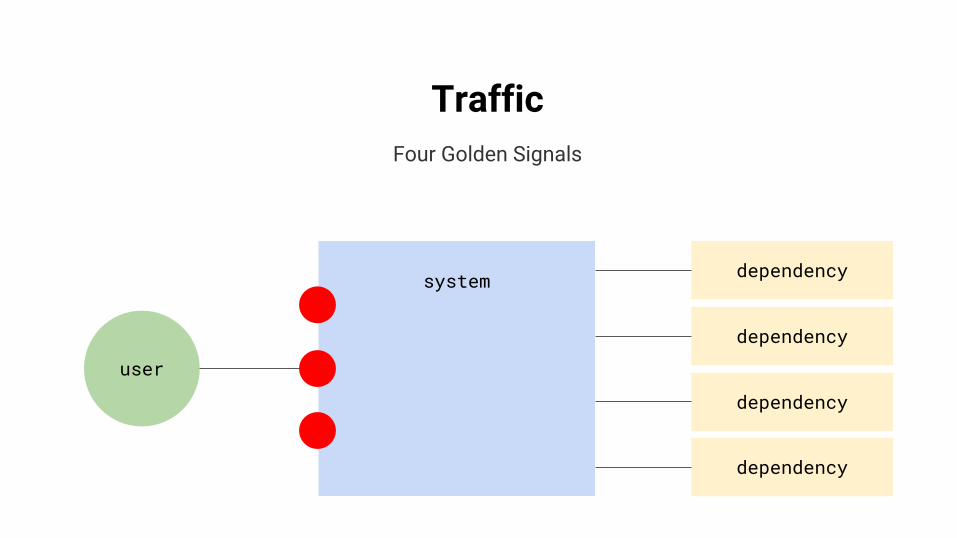
TrafficFour Golden Signals
system
user
dependency
dependency
dependency
dependency
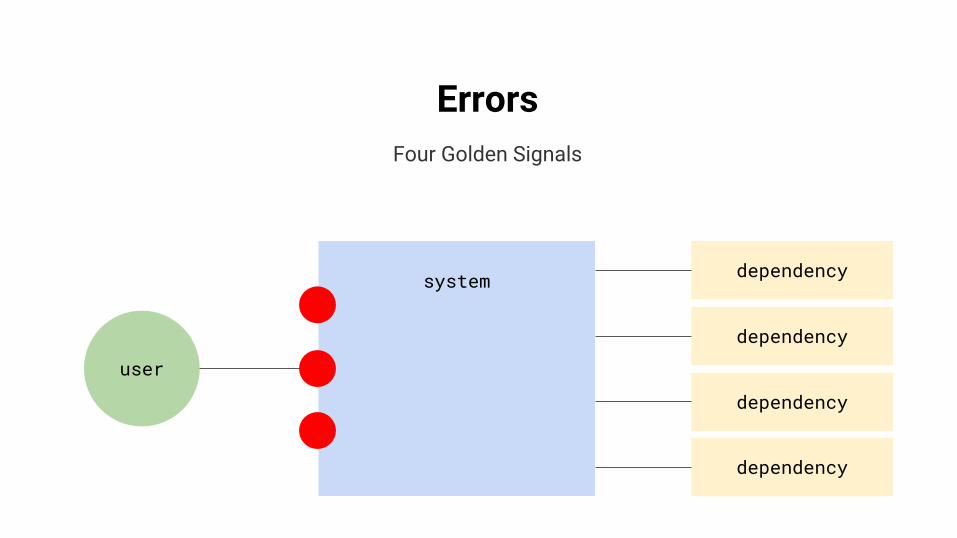
ErrorsFour Golden Signals
system
user
dependency
dependency
dependency
dependency
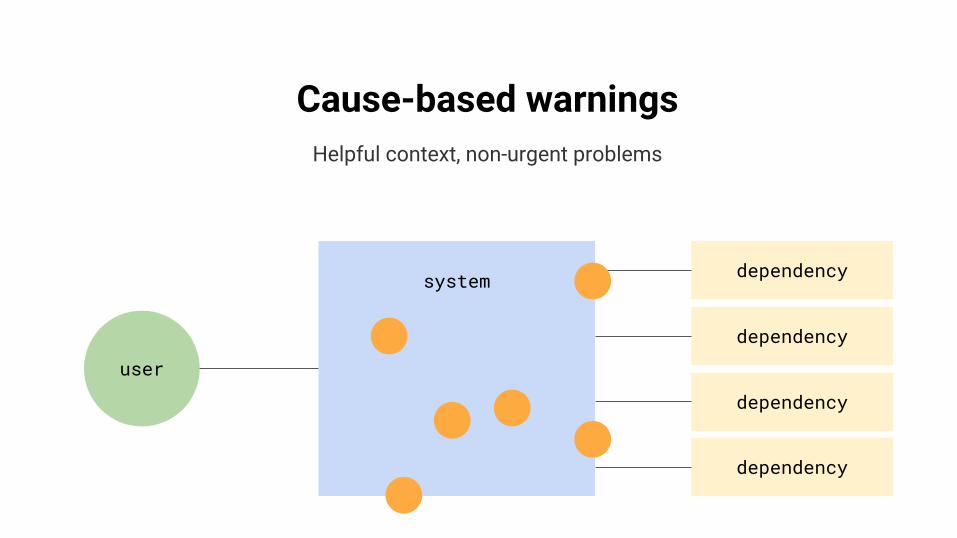
Cause-based warningsHelpful context, non-urgent problems
system
user
dependency
dependency
dependency
dependency
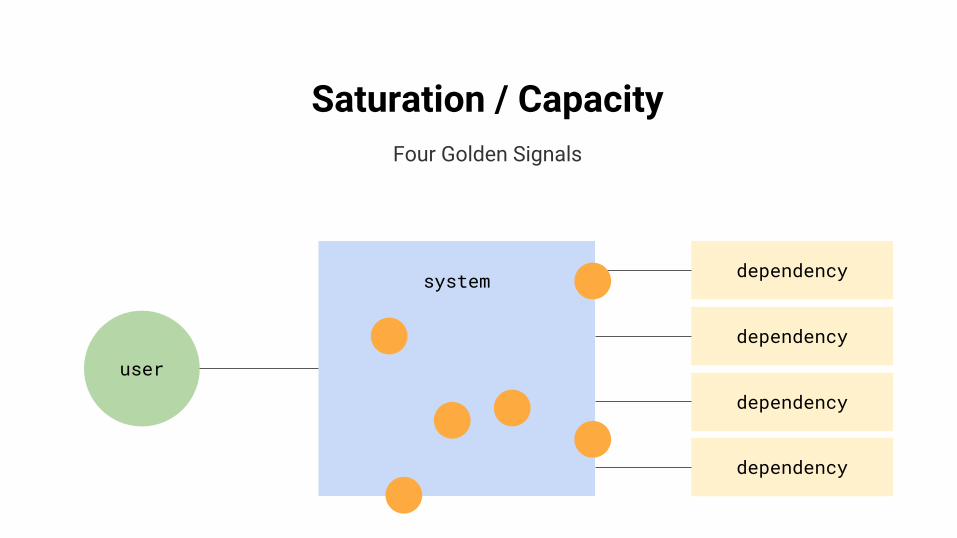
Saturation / CapacityFour Golden Signals
system
user
dependency
dependency
dependency
dependency
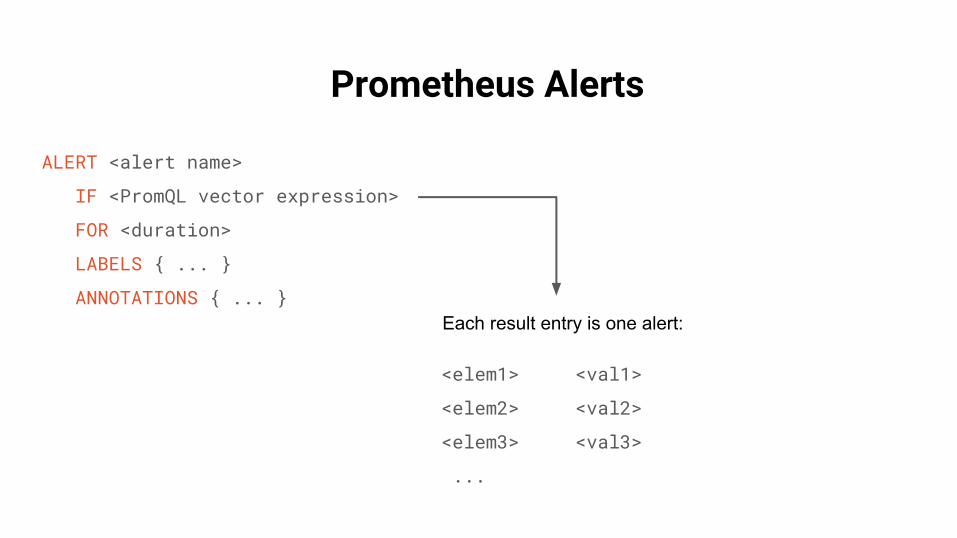
Prometheus Alerts
ALERT <alert name>
IF <PromQL vector expression>
FOR <duration>
LABELS { ... }
ANNOTATIONS { ... }
<elem1> <val1>
<elem2> <val2>
<elem3> <val3>
...
Each result entry is one alert:
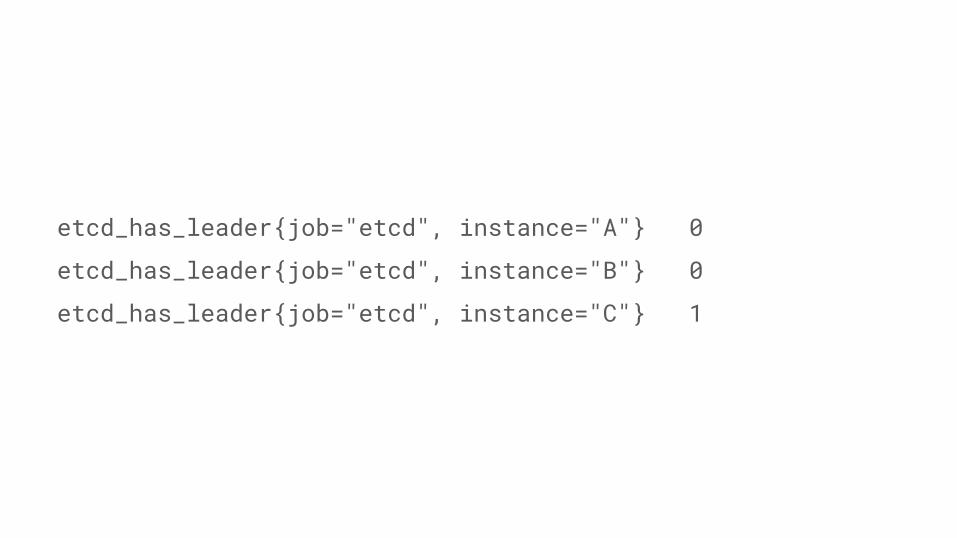
etcd_has_leader{job="etcd", instance="A"} 0
etcd_has_leader{job="etcd", instance="B"} 0
etcd_has_leader{job="etcd", instance="C"} 1
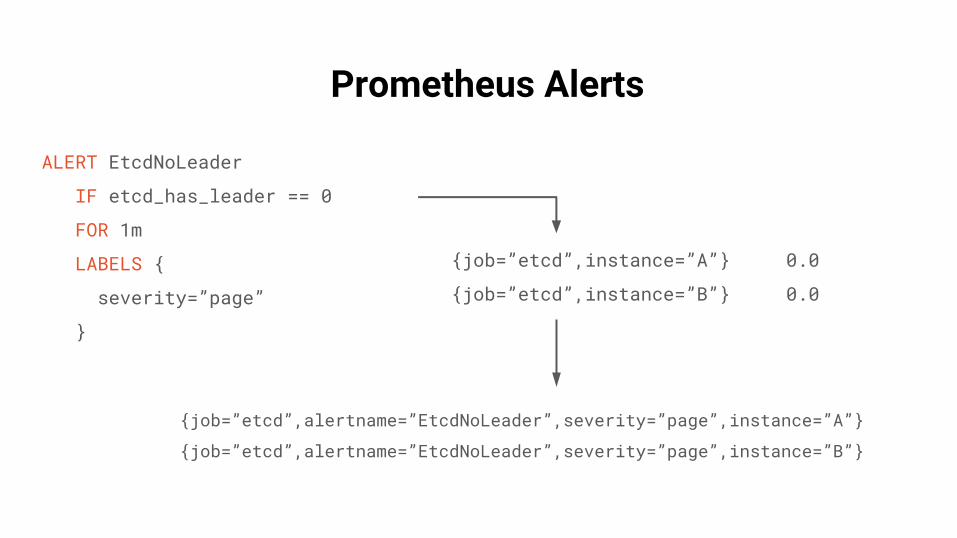
Prometheus Alerts
ALERT EtcdNoLeader
IF etcd_has_leader == 0
FOR 1m
LABELS {
severity=”page”
}
{job=”etcd”,instance=”A”} 0.0
{job=”etcd”,instance=”B”} 0.0
{job=”etcd”,alertname=”EtcdNoLeader”,severity=”page”,instance=”A”}
{job=”etcd”,alertname=”EtcdNoLeader”,severity=”page”,instance=”B”}
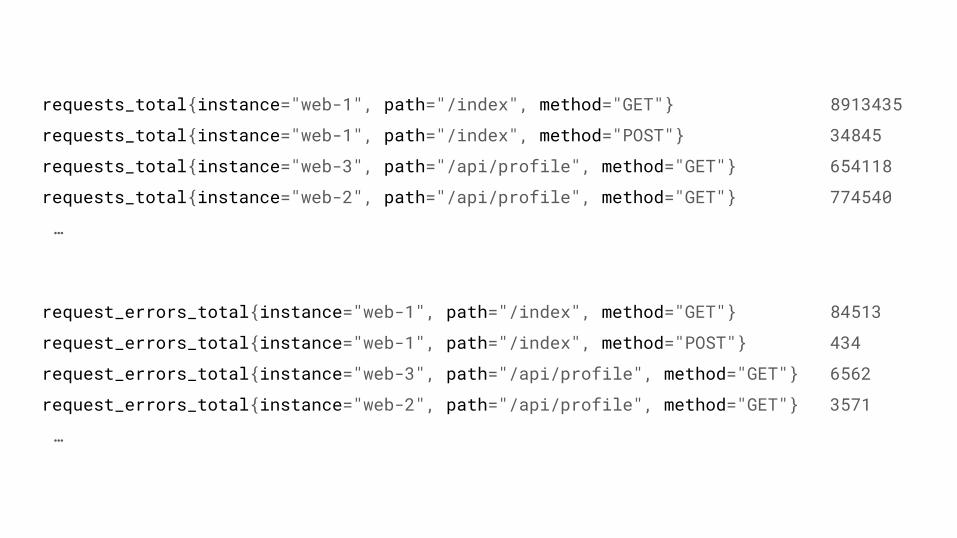
requests_total{instance="web-1", path="/index", method="GET"} 8913435
requests_total{instance="web-1", path="/index", method="POST"} 34845
requests_total{instance="web-3", path="/api/profile", method="GET"} 654118
requests_total{instance="web-2", path="/api/profile", method="GET"} 774540
…
request_errors_total{instance="web-1", path="/index", method="GET"} 84513
request_errors_total{instance="web-1", path="/index", method="POST"} 434
request_errors_total{instance="web-3", path="/api/profile", method="GET"} 6562
request_errors_total{instance="web-2", path="/api/profile", method="GET"} 3571
…
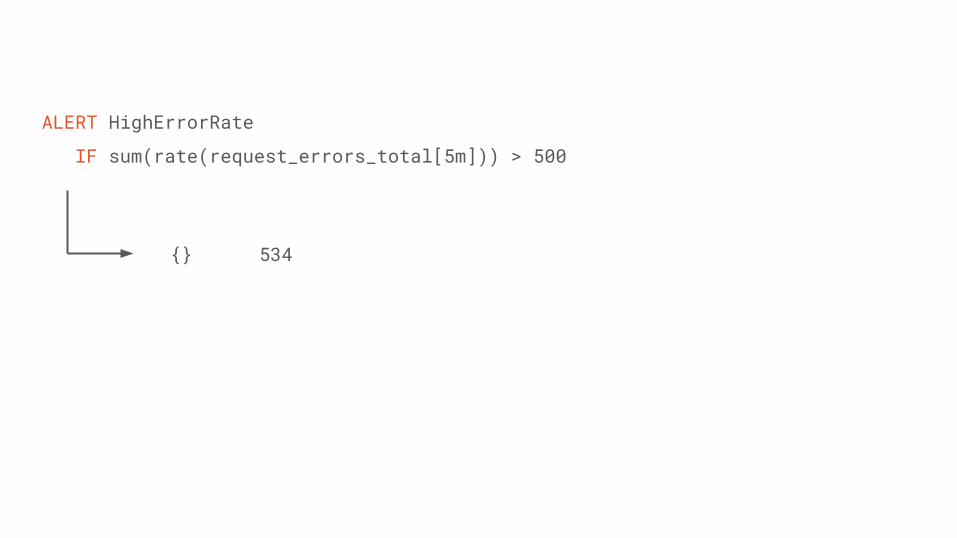
ALERT HighErrorRate
IF sum(rate(request_errors_total[5m])) > 500
{} 534
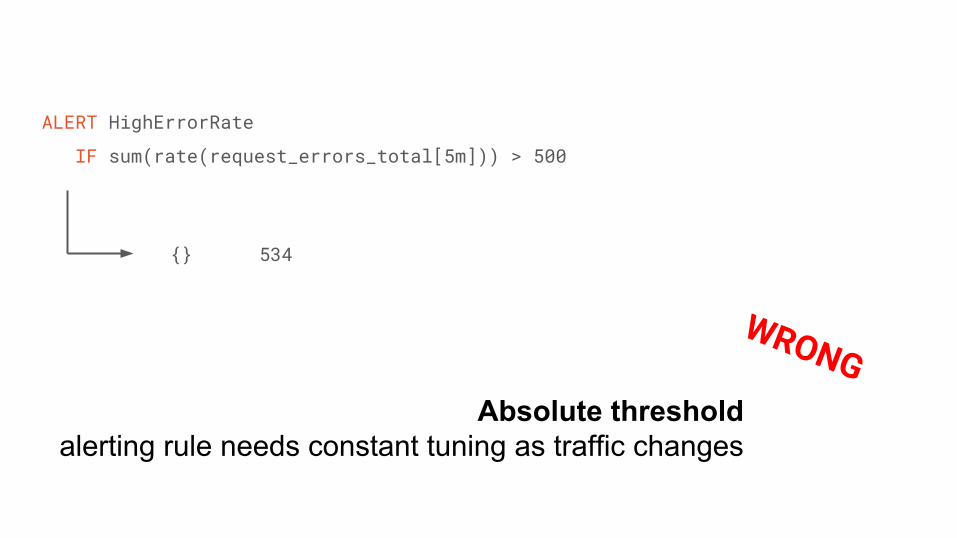
ALERT HighErrorRate
IF sum(rate(request_errors_total[5m])) > 500
{} 534
WRONGAbsolute threshold
alerting rule needs constant tuning as traffic changes
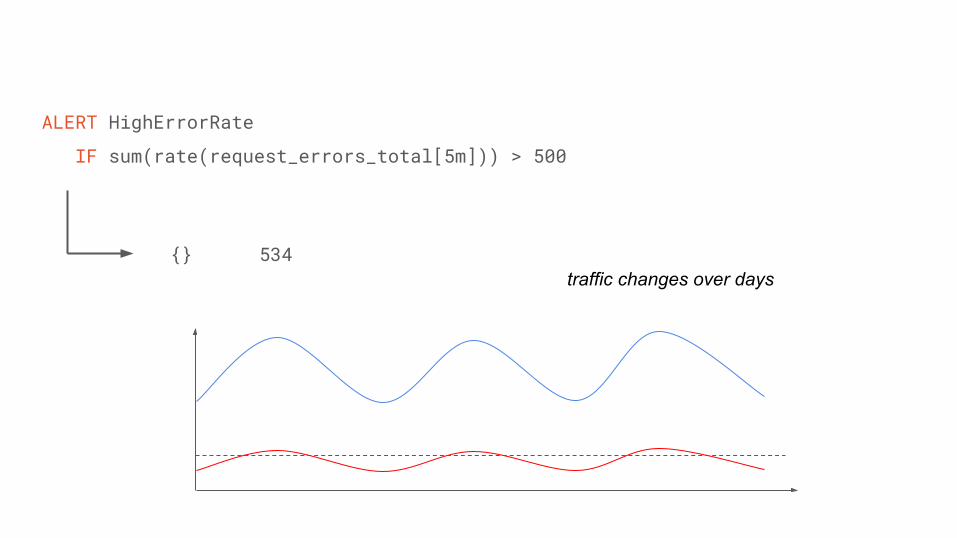
ALERT HighErrorRate
IF sum(rate(request_errors_total[5m])) > 500
{} 534traffic changes over days
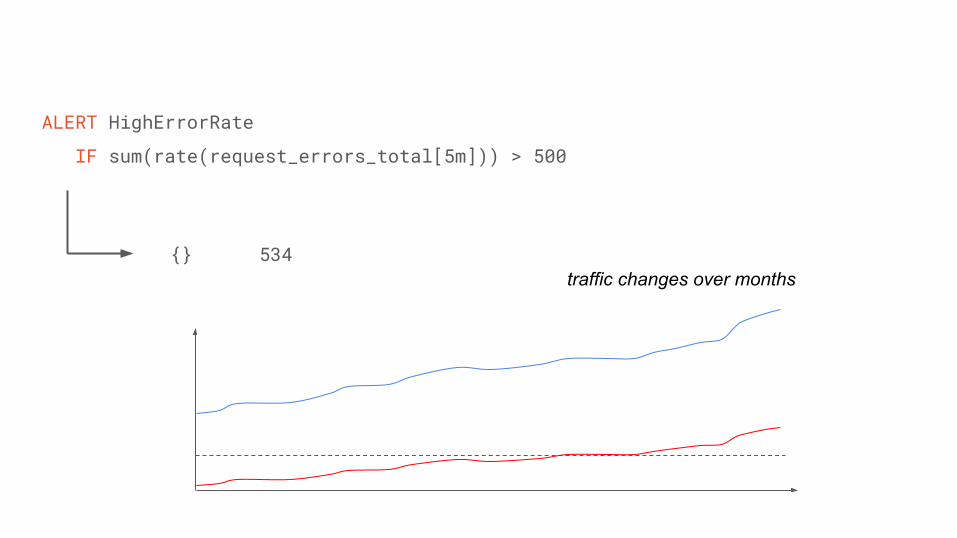
ALERT HighErrorRate
IF sum(rate(request_errors_total[5m])) > 500
{} 534traffic changes over months
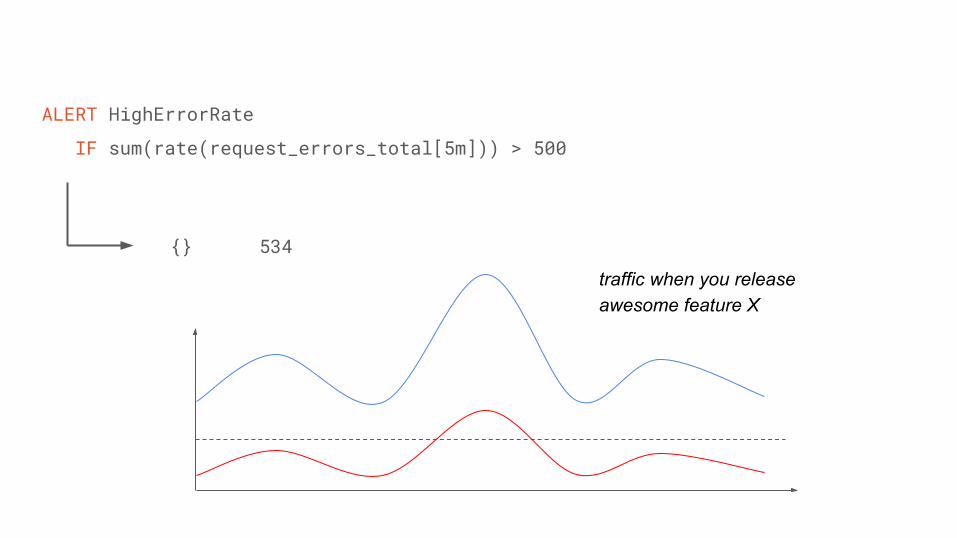
ALERT HighErrorRate
IF sum(rate(request_errors_total[5m])) > 500
{} 534
traffic when you releaseawesome feature X
ALERT HighErrorRate
IF sum(rate(request_errors_total[5m])) /
sum(rate(requests_total[5m])) > 0.01
{} 1.8354
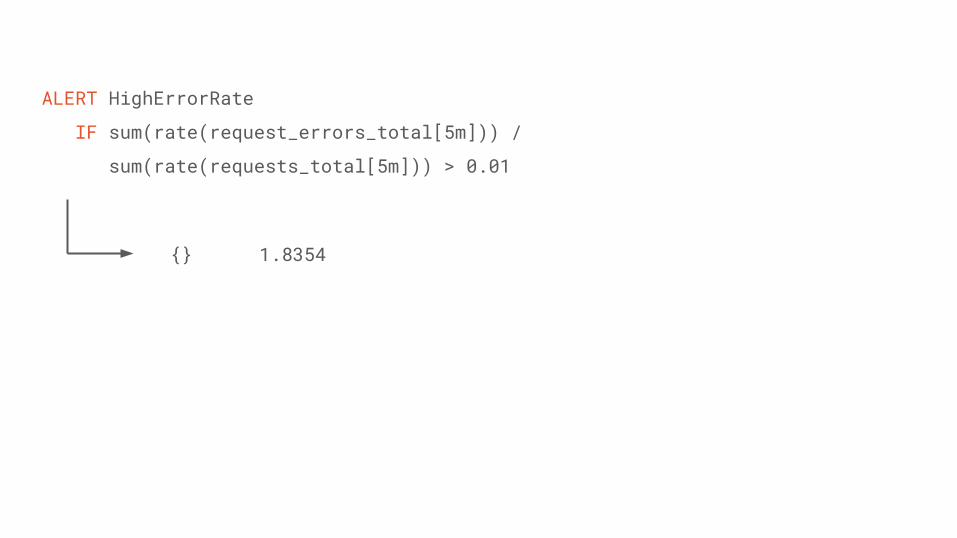
ALERT HighErrorRate
IF sum(rate(request_errors_total[5m])) /
sum(rate(requests_total[5m])) > 0.01
{} 1.8354
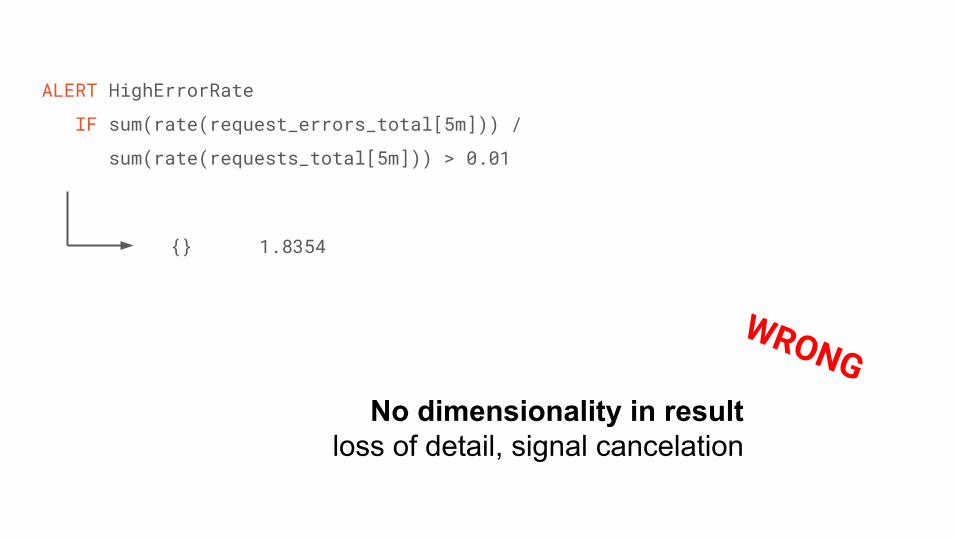
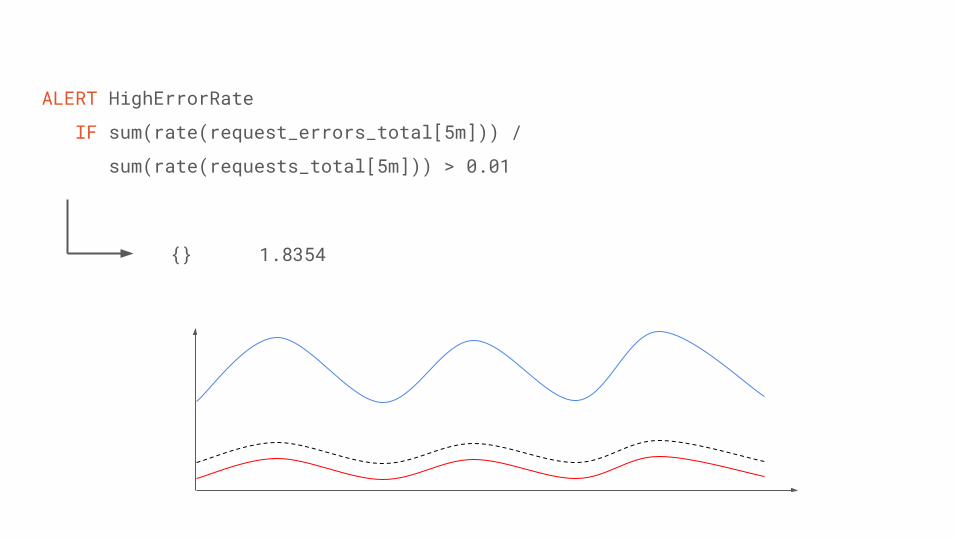
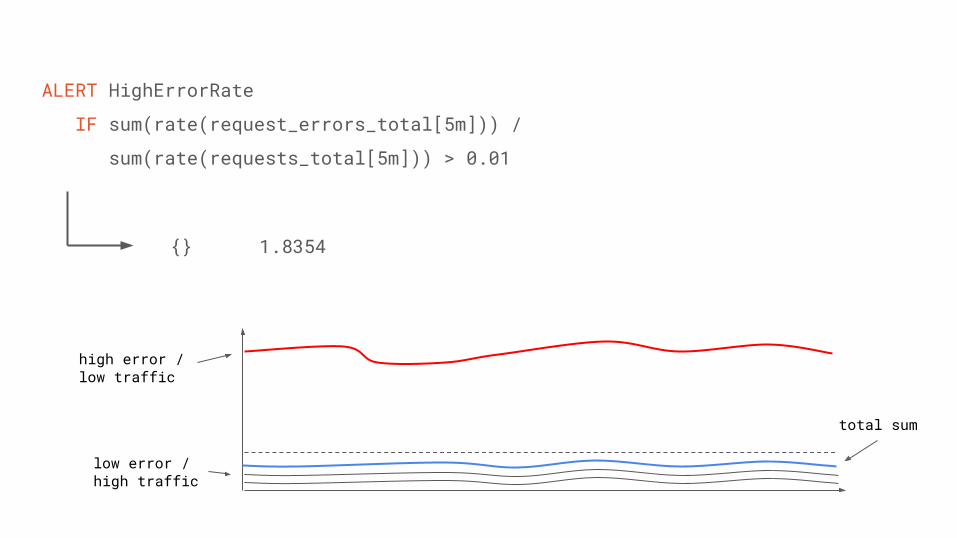
ALERT HighErrorRate
IF sum(rate(request_errors_total[5m])) /
sum(rate(requests_total[5m])) > 0.01
{} 1.8354
WRONGNo dimensionality in result
loss of detail, signal cancelation
ALERT HighErrorRate
IF sum(rate(request_errors_total[5m])) /
sum(rate(requests_total[5m])) > 0.01
{} 1.8354
high error /low traffic
low error /high traffic
total sum
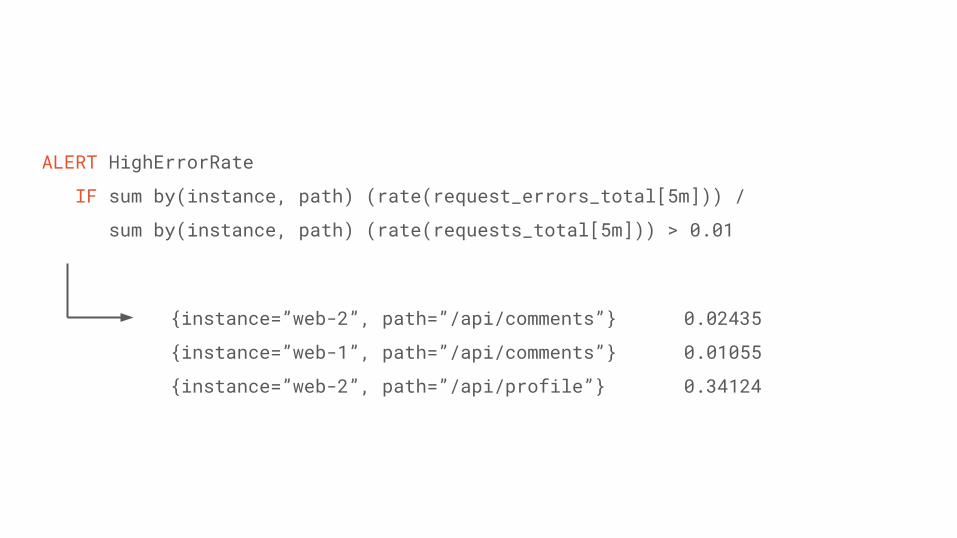
ALERT HighErrorRate
IF sum by(instance, path) (rate(request_errors_total[5m])) /
sum by(instance, path) (rate(requests_total[5m])) > 0.01
{instance=”web-2”, path=”/api/comments”} 0.02435
{instance=”web-1”, path=”/api/comments”} 0.01055
{instance=”web-2”, path=”/api/profile”} 0.34124
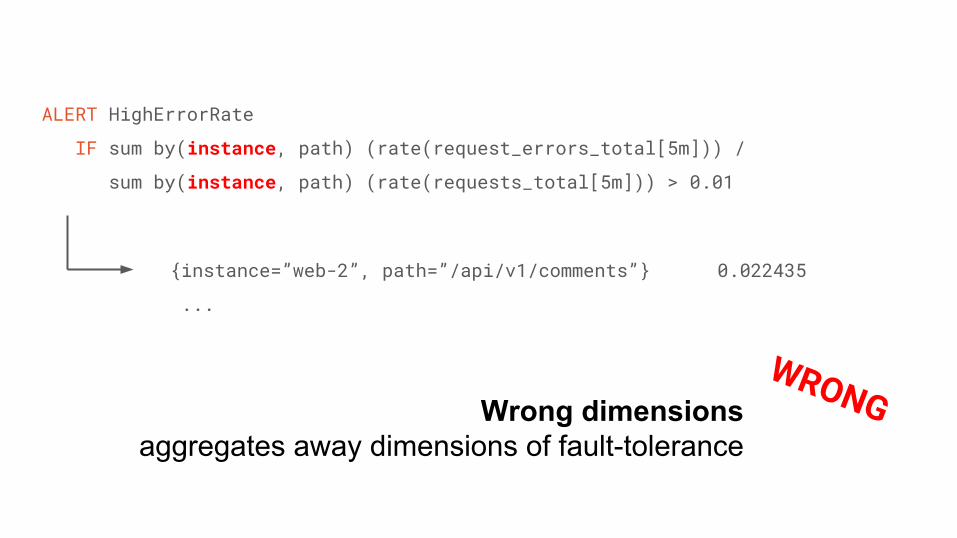
ALERT HighErrorRate
IF sum by(instance, path) (rate(request_errors_total[5m])) /
sum by(instance, path) (rate(requests_total[5m])) > 0.01
{instance=”web-2”, path=”/api/v1/comments”} 0.022435
...
WRONGWrong dimensionsaggregates away dimensions of fault-tolerance
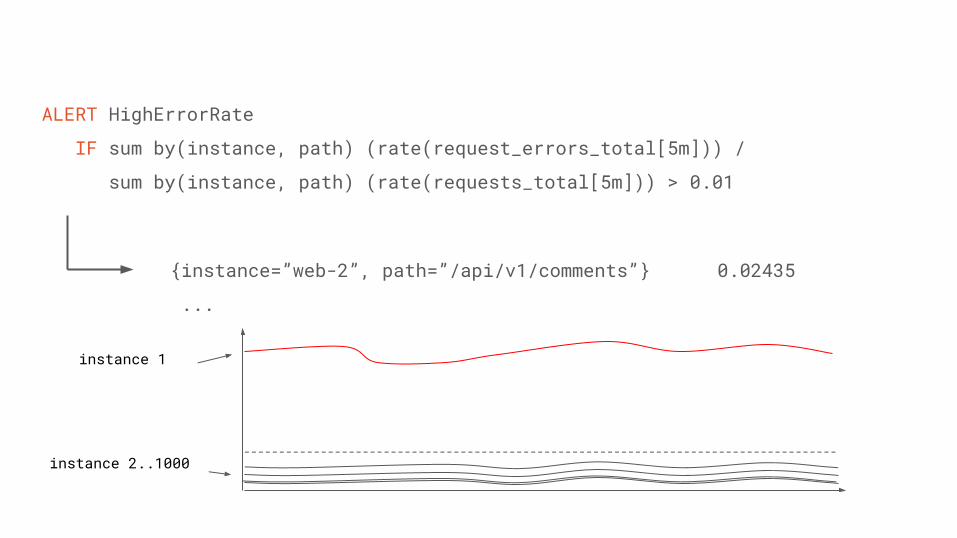
ALERT HighErrorRate
IF sum by(instance, path) (rate(request_errors_total[5m])) /
sum by(instance, path) (rate(requests_total[5m])) > 0.01
{instance=”web-2”, path=”/api/v1/comments”} 0.02435
...
instance 1
instance 2..1000
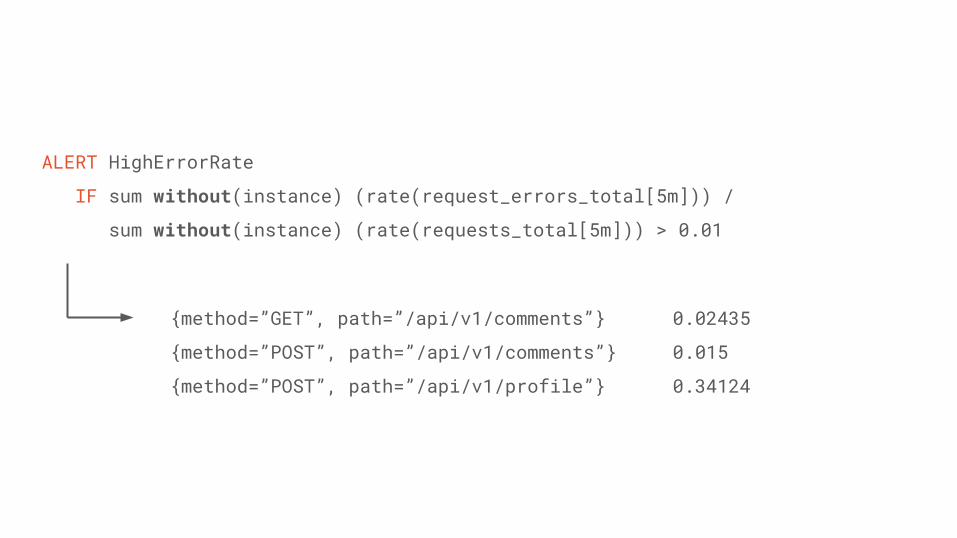
ALERT HighErrorRate
IF sum without(instance) (rate(request_errors_total[5m])) /
sum without(instance) (rate(requests_total[5m])) > 0.01
{method=”GET”, path=”/api/v1/comments”} 0.02435
{method=”POST”, path=”/api/v1/comments”} 0.015
{method=”POST”, path=”/api/v1/profile”} 0.34124
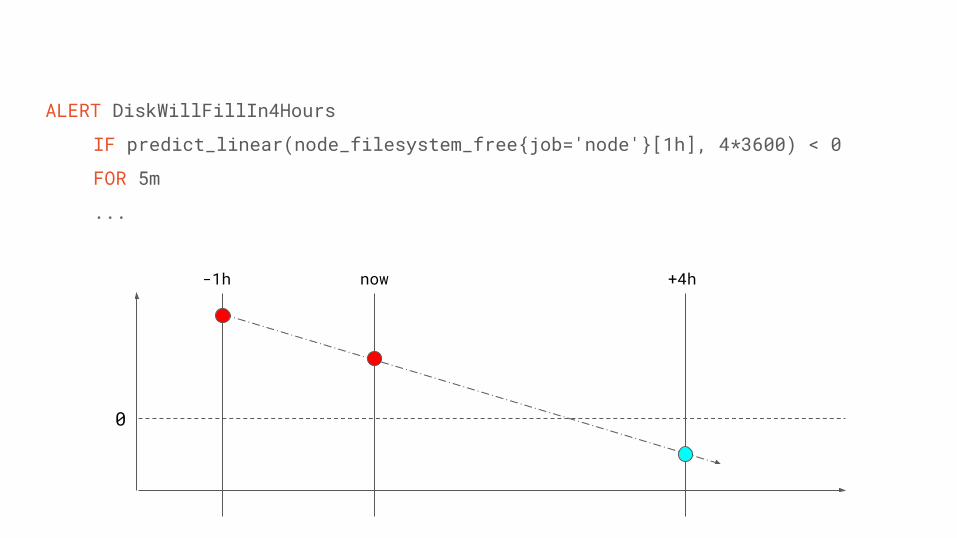
ALERT DiskWillFillIn4Hours
IF predict_linear(node_filesystem_free{job='node'}[1h], 4*3600) < 0
FOR 5m
...
0
now -1h +4h
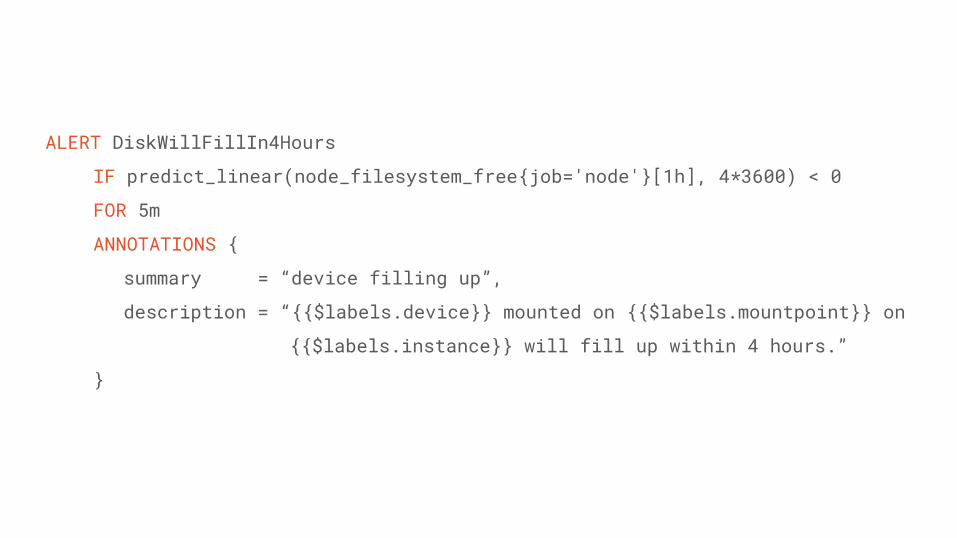
ALERT DiskWillFillIn4Hours
IF predict_linear(node_filesystem_free{job='node'}[1h], 4*3600) < 0
FOR 5m
ANNOTATIONS {
summary = “device filling up”,
description = “{{$labels.device}} mounted on {{$labels.mountpoint}} on
{{$labels.instance}} will fill up within 4 hours.”
}
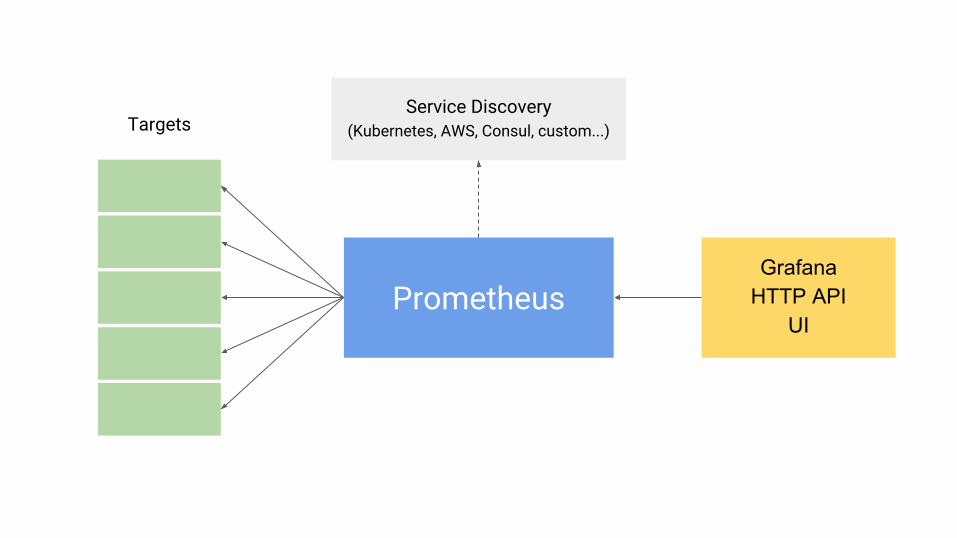
AlertmanagerAggregate, deduplicate, and route alerts
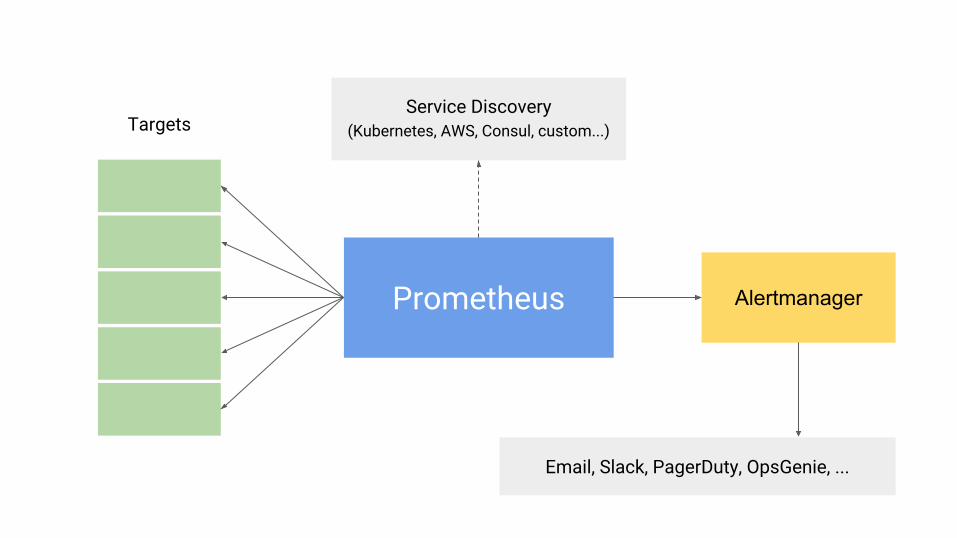
Prometheus
TargetsService Discovery
(Kubernetes, AWS, Consul, custom...)
Alertmanager
Email, Slack, PagerDuty, OpsGenie, ...
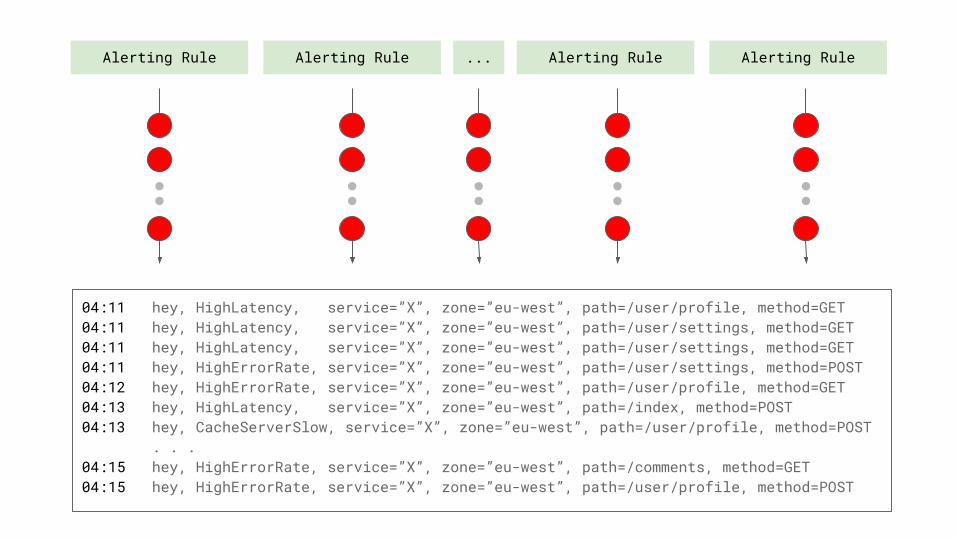
Alerting Rule Alerting Rule Alerting Rule Alerting Rule...
04:11 hey, HighLatency, service=”X”, zone=”eu-west”, path=/user/profile, method=GET04:11 hey, HighLatency, service=”X”, zone=”eu-west”, path=/user/settings, method=GET04:11 hey, HighLatency, service=”X”, zone=”eu-west”, path=/user/settings, method=GET04:11 hey, HighErrorRate, service=”X”, zone=”eu-west”, path=/user/settings, method=POST04:12 hey, HighErrorRate, service=”X”, zone=”eu-west”, path=/user/profile, method=GET04:13 hey, HighLatency, service=”X”, zone=”eu-west”, path=/index, method=POST04:13 hey, CacheServerSlow, service=”X”, zone=”eu-west”, path=/user/profile, method=POST . . .04:15 hey, HighErrorRate, service=”X”, zone=”eu-west”, path=/comments, method=GET04:15 hey, HighErrorRate, service=”X”, zone=”eu-west”, path=/user/profile, method=POST
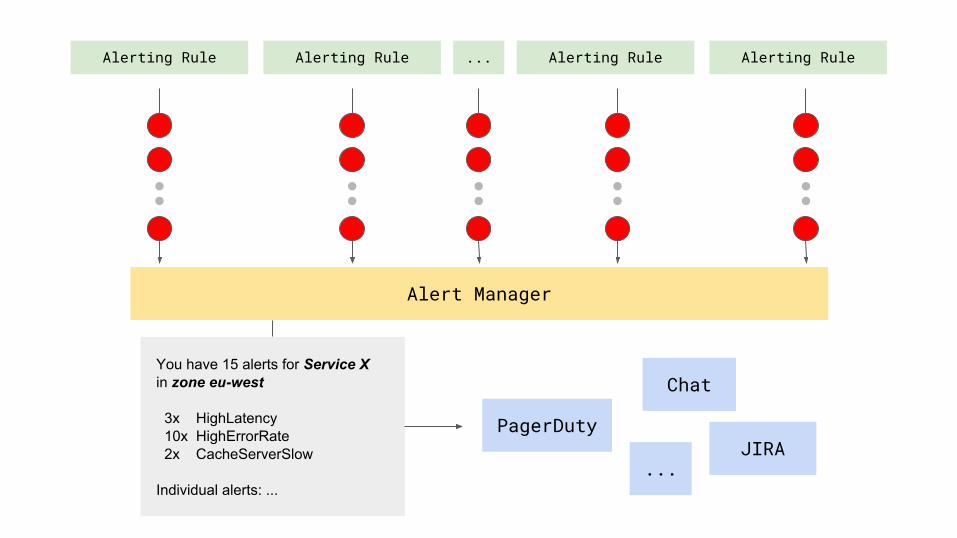
Alerting Rule Alerting Rule Alerting Rule Alerting Rule...
Alert Manager
Chat
JIRAPagerDuty
...
You have 15 alerts for Service Xin zone eu-west
3x HighLatency 10x HighErrorRate 2x CacheServerSlow
Individual alerts: ...
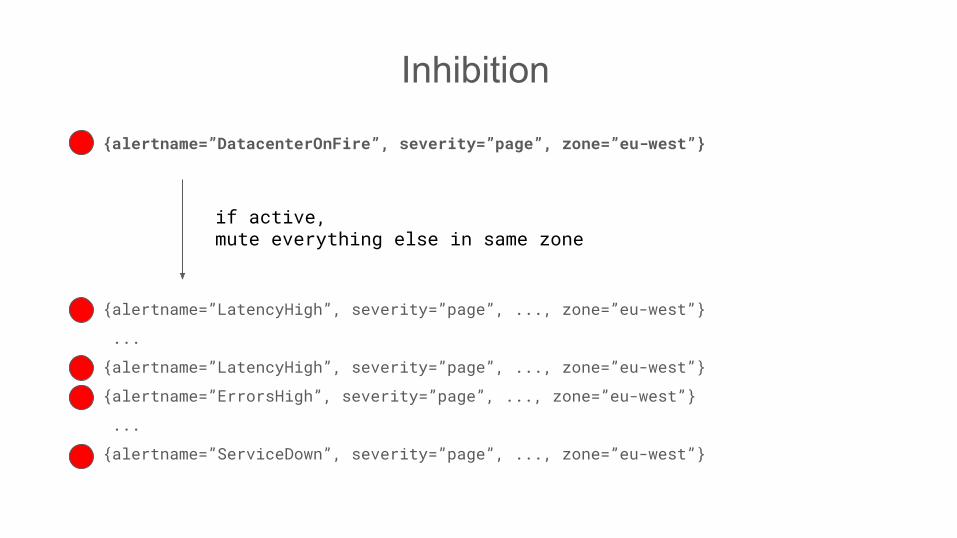
Inhibition
{alertname=”LatencyHigh”, severity=”page”, ..., zone=”eu-west”}
...
{alertname=”LatencyHigh”, severity=”page”, ..., zone=”eu-west”}
{alertname=”ErrorsHigh”, severity=”page”, ..., zone=”eu-west”}
...
{alertname=”ServiceDown”, severity=”page”, ..., zone=”eu-west”}
{alertname=”DatacenterOnFire”, severity=”page”, zone=”eu-west”}
if active,mute everything else in same zone

Anomaly Detection
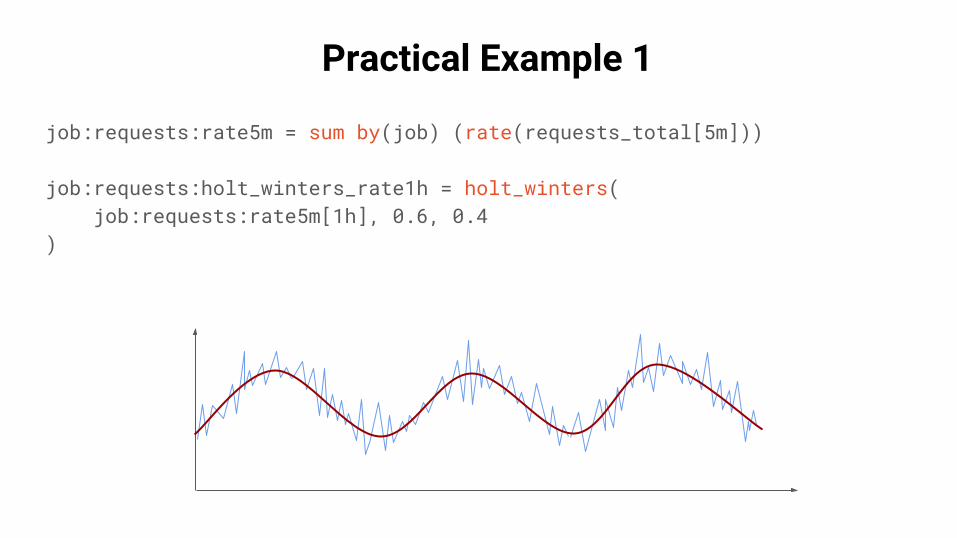
Practical Example 1
job:requests:rate5m = sum by(job) (rate(requests_total[5m]))
job:requests:holt_winters_rate1h = holt_winters( job:requests:rate5m[1h], 0.6, 0.4)
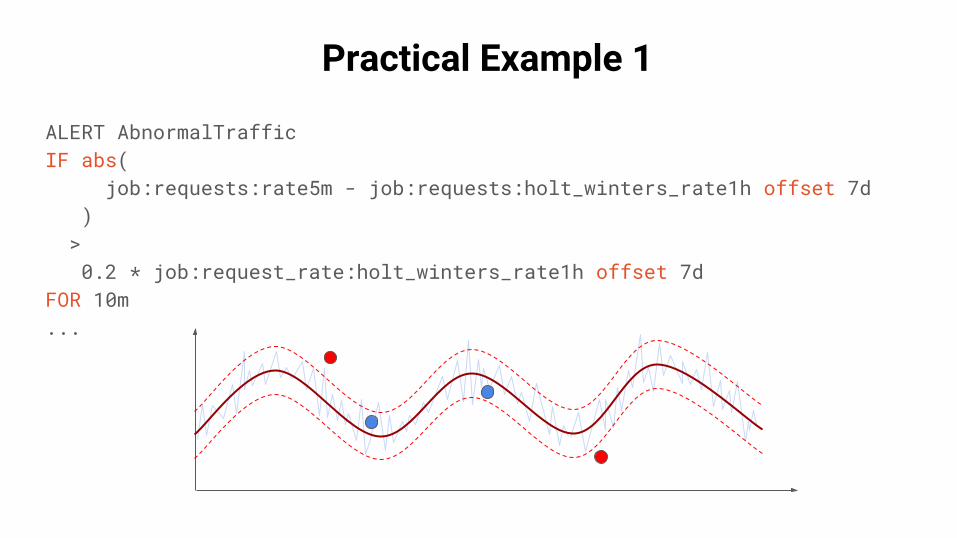
Practical Example 1
ALERT AbnormalTrafficIF abs( job:requests:rate5m - job:requests:holt_winters_rate1h offset 7d ) > 0.2 * job:request_rate:holt_winters_rate1h offset 7dFOR 10m...
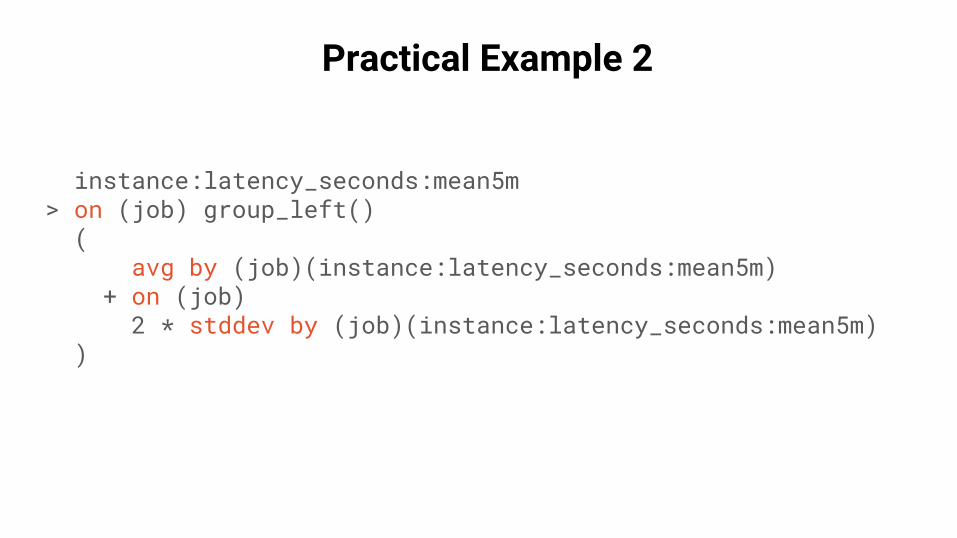
Practical Example 2
instance:latency_seconds:mean5m> on (job) group_left() ( avg by (job)(instance:latency_seconds:mean5m) + on (job) 2 * stddev by (job)(instance:latency_seconds:mean5m) )
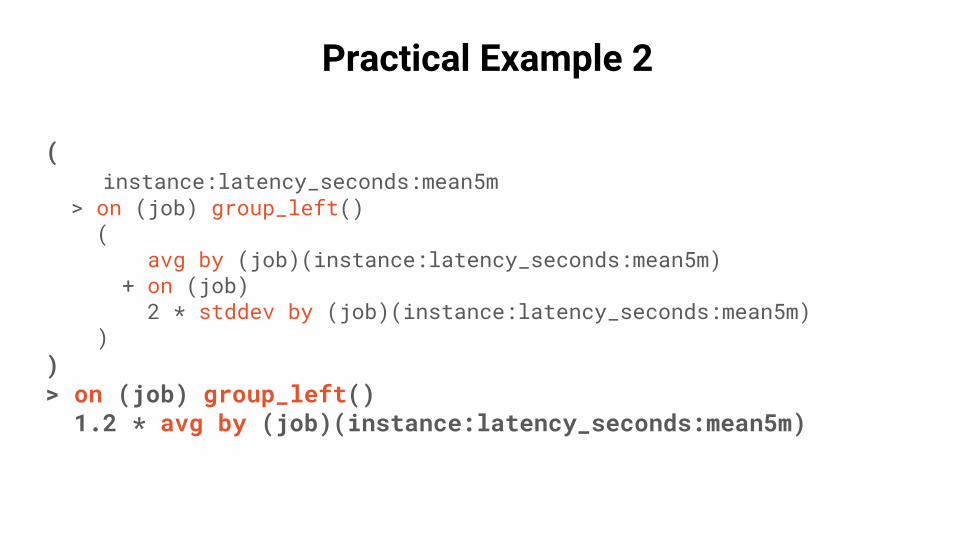
Practical Example 2
( instance:latency_seconds:mean5m > on (job) group_left() ( avg by (job)(instance:latency_seconds:mean5m) + on (job) 2 * stddev by (job)(instance:latency_seconds:mean5m) ))> on (job) group_left() 1.2 * avg by (job)(instance:latency_seconds:mean5m)
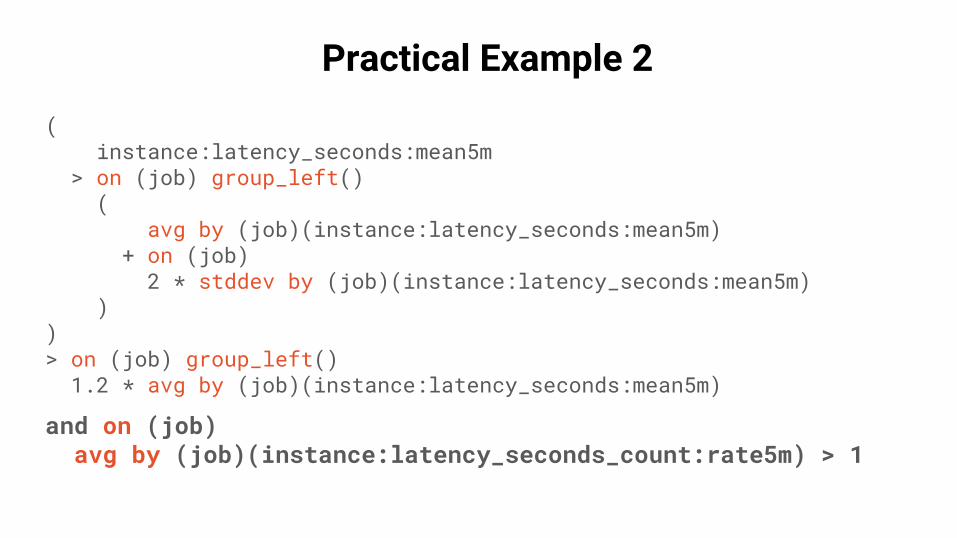
Practical Example 2
( instance:latency_seconds:mean5m > on (job) group_left() ( avg by (job)(instance:latency_seconds:mean5m) + on (job) 2 * stddev by (job)(instance:latency_seconds:mean5m) ))> on (job) group_left() 1.2 * avg by (job)(instance:latency_seconds:mean5m)
and on (job) avg by (job)(instance:latency_seconds_count:rate5m) > 1

Self Healing
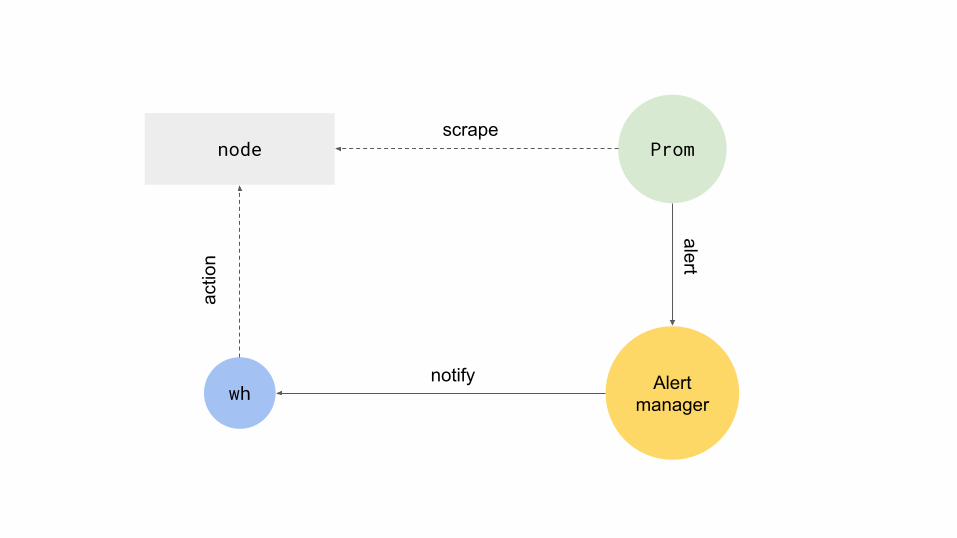
Prom
Alertmanagerwh
nodescrape
notify
alert
actio
n
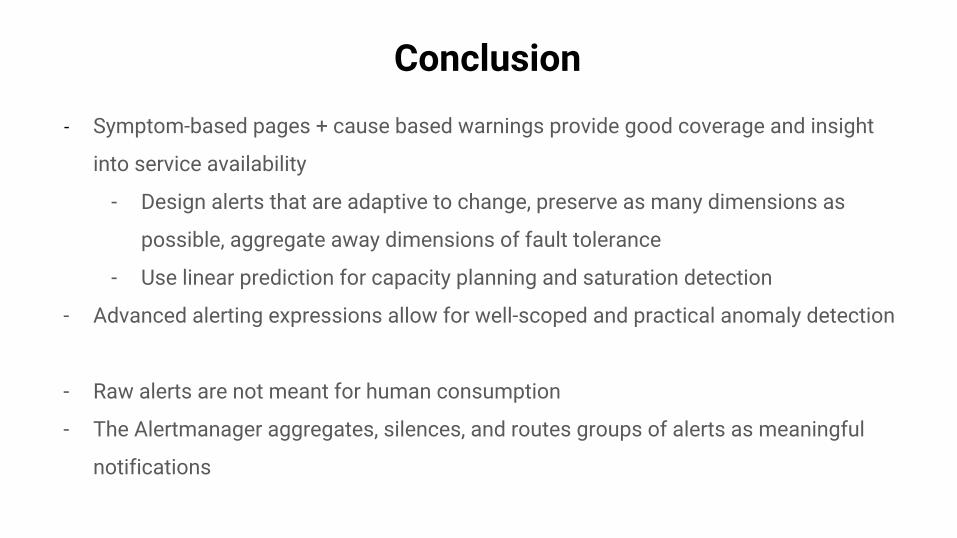
Conclusion
- Symptom-based pages + cause based warnings provide good coverage and insight
into service availability
- Design alerts that are adaptive to change, preserve as many dimensions as
possible, aggregate away dimensions of fault tolerance
- Use linear prediction for capacity planning and saturation detection
- Advanced alerting expressions allow for well-scoped and practical anomaly detection
- Raw alerts are not meant for human consumption
- The Alertmanager aggregates, silences, and routes groups of alerts as meaningful
notifications

coreos.com/fest@coreosfest
May 31 - June 1, 2017San Francisco