Embed Size (px)
Citation preview
CORPORATE PRESENTATION MARCH 2015
CORPORATE PRESENTATION
CORPORATE PRESENTATION MARCH 2015
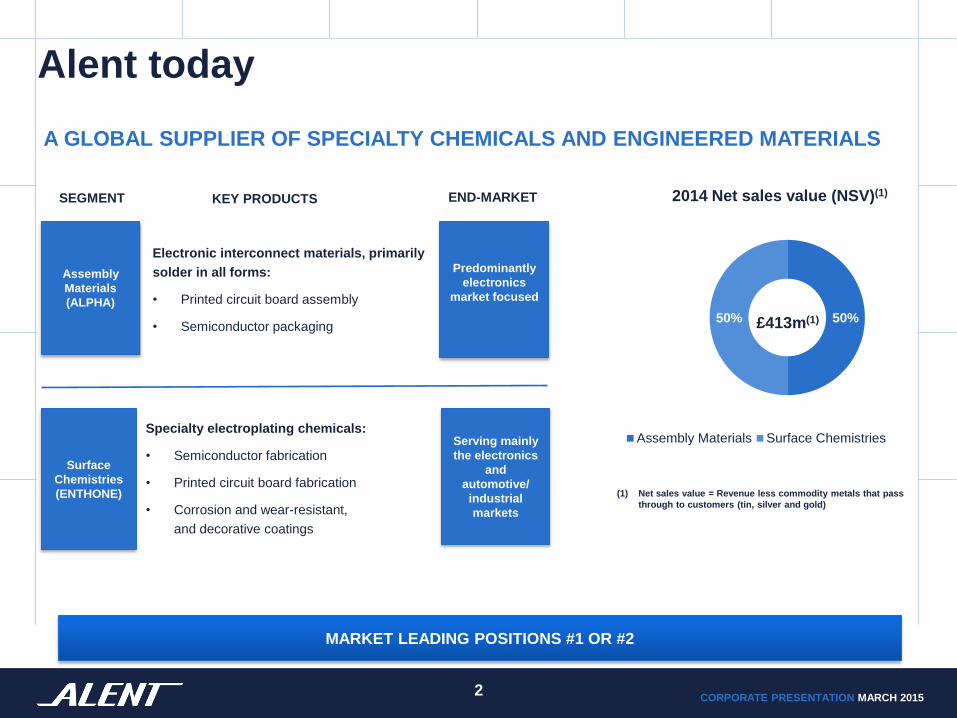
Alent today
Assembly
Materials
(ALPHA)
SEGMENT KEY PRODUCTS
Electronic interconnect materials, primarily
solder in all forms:
• Printed circuit board assembly
• Semiconductor packaging
Surface
Chemistries
(ENTHONE)
Specialty electroplating chemicals:
• Semiconductor fabrication
• Printed circuit board fabrication
• Corrosion and wear-resistant,
and decorative coatings
Serving mainly
the electronics
and
automotive/
industrial
markets
£413m(1)
2014 Net sales value (NSV)(1)
50% 50%
Assembly Materials Surface Chemistries
Predominantly
electronics
market focused
(1) Net sales value = Revenue less commodity metals that pass
through to customers (tin, silver and gold)
MARKET LEADING POSITIONS #1 OR #2
END-MARKET
2
A GLOBAL SUPPLIER OF SPECIALTY CHEMICALS AND ENGINEERED MATERIALS
CORPORATE PRESENTATION MARCH 2015
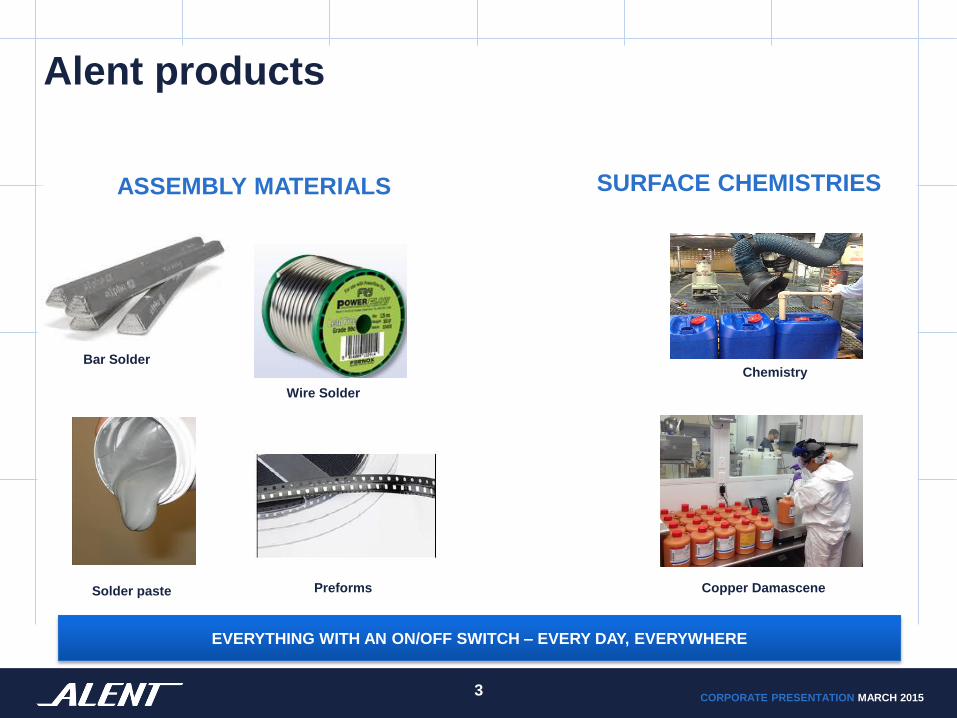
Alent products
Solder paste
Bar Solder
EVERYTHING WITH AN ON/OFF SWITCH – EVERY DAY, EVERYWHERE
3
Chemistry
Wire Solder
Copper Damascene Preforms
ASSEMBLY MATERIALS SURFACE CHEMISTRIES
CORPORATE PRESENTATION MARCH 2015
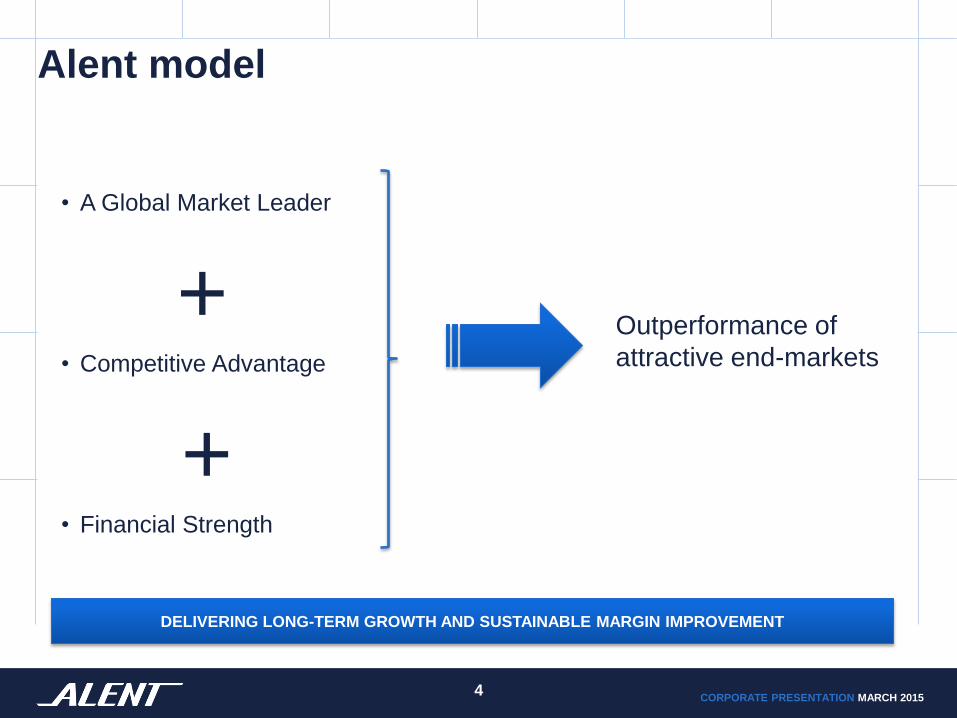
Alent model
• A Global Market Leader
+ • Competitive Advantage
+ • Financial Strength
Outperformance of
attractive end-markets
DELIVERING LONG-TERM GROWTH AND SUSTAINABLE MARGIN IMPROVEMENT
4
CORPORATE PRESENTATION MARCH 2015
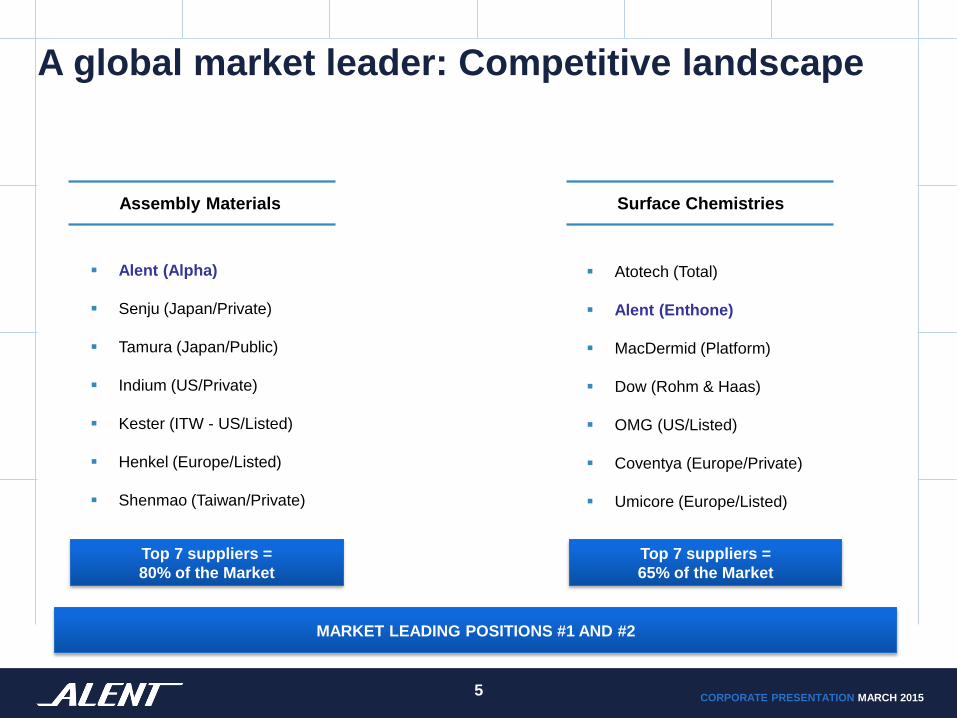
A global market leader: Competitive landscape
Alent (Alpha)
Senju (Japan/Private)
Tamura (Japan/Public)
Indium (US/Private)
Kester (ITW - US/Listed)
Henkel (Europe/Listed)
Shenmao (Taiwan/Private)
Surface Chemistries Assembly Materials
Atotech (Total)
Alent (Enthone)
MacDermid (Platform)
Dow (Rohm & Haas)
OMG (US/Listed)
Coventya (Europe/Private)
Umicore (Europe/Listed)
MARKET LEADING POSITIONS #1 AND #2
5
Top 7 suppliers =
80% of the Market
Top 7 suppliers =
65% of the Market
CORPORATE PRESENTATION MARCH 2015
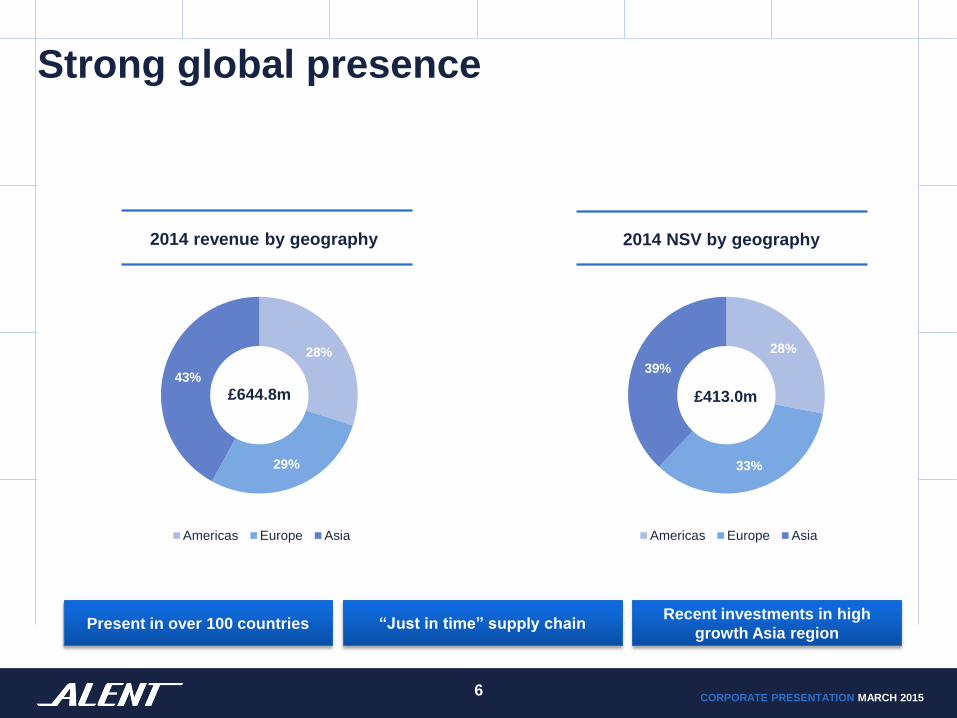
Strong global presence
2014 NSV by geography 2014 revenue by geography
28%
33%
39%
Americas Europe Asia
28%
29%
43%
Americas Europe Asia
£413.0m £644.8m
6
“Just in time” supply chain Present in over 100 countries Recent investments in high
growth Asia region
CORPORATE PRESENTATION MARCH 2015
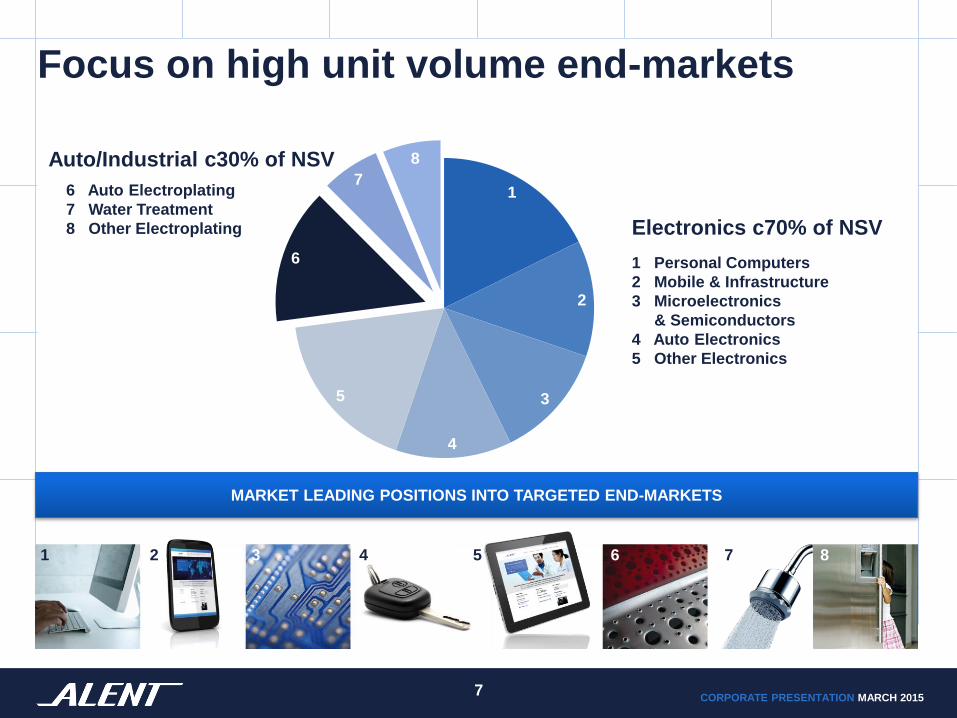
Focus on high unit volume end-markets
MARKET LEADING POSITIONS INTO TARGETED END-MARKETS
1 Personal Computers
2 Mobile & Infrastructure
3 Microelectronics
& Semiconductors
4 Auto Electronics
5 Other Electronics
6 Auto Electroplating
7 Water Treatment
8 Other Electroplating
7
1
2
3
4
5
6
7
8
Electronics c70% of NSV
Auto/Industrial c30% of NSV
1 2 3 4 5 6 7 8
CORPORATE PRESENTATION MARCH 2015
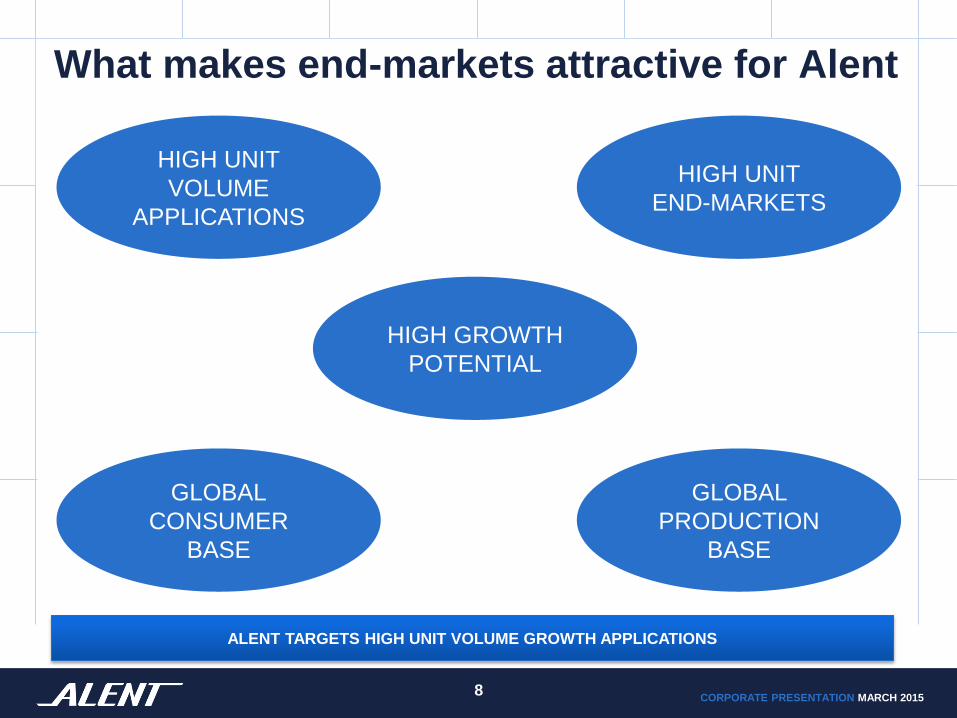
What makes end-markets attractive for Alent
ALENT TARGETS HIGH UNIT VOLUME GROWTH APPLICATIONS
8
HIGH UNIT
VOLUME
APPLICATIONS
GLOBAL
PRODUCTION
BASE
HIGH GROWTH
POTENTIAL
HIGH UNIT
END-MARKETS
GLOBAL
CONSUMER
BASE
CORPORATE PRESENTATION MARCH 2015
Alent’s competitive advantage
9
• Differentiated OEM customer model
• Customer-driven, “fast cycle” R&D
• Technical services
• Global footprint
DELIVERING LONG-TERM GROWTH AND SUSTAINABLE MARGIN IMPROVEMENT
CORPORATE PRESENTATION MARCH 2015
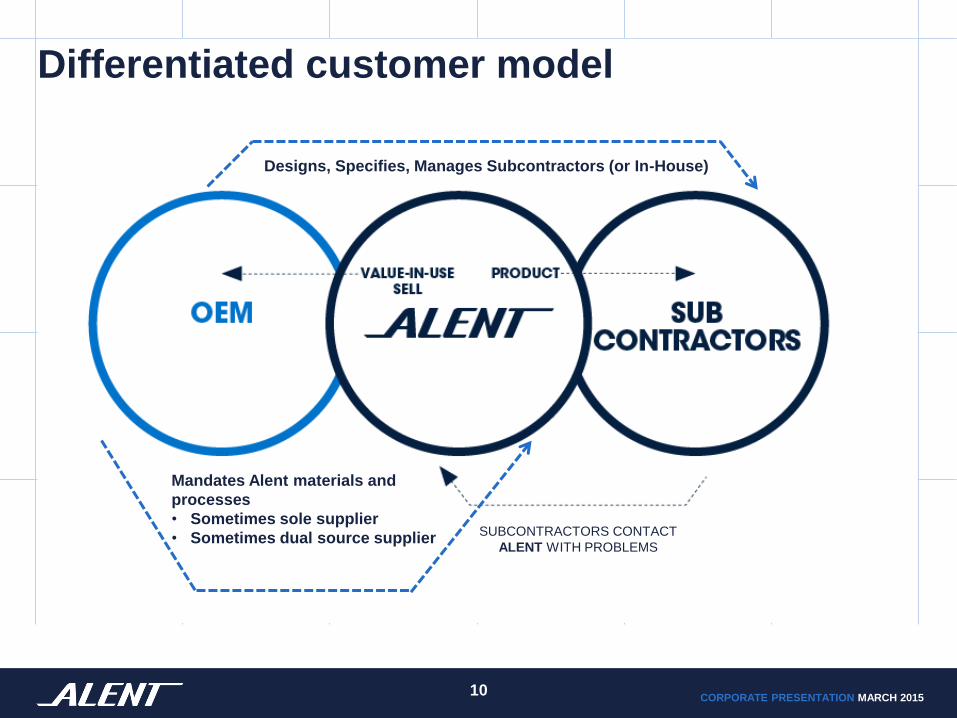
Differentiated customer model
10
Mandates Alent materials and
processes
• Sometimes sole supplier
• Sometimes dual source supplier
Designs, Specifies, Manages Subcontractors (or In-House)
SUBCONTRACTORS CONTACT
ALENT WITH PROBLEMS
CORPORATE PRESENTATION MARCH 2015
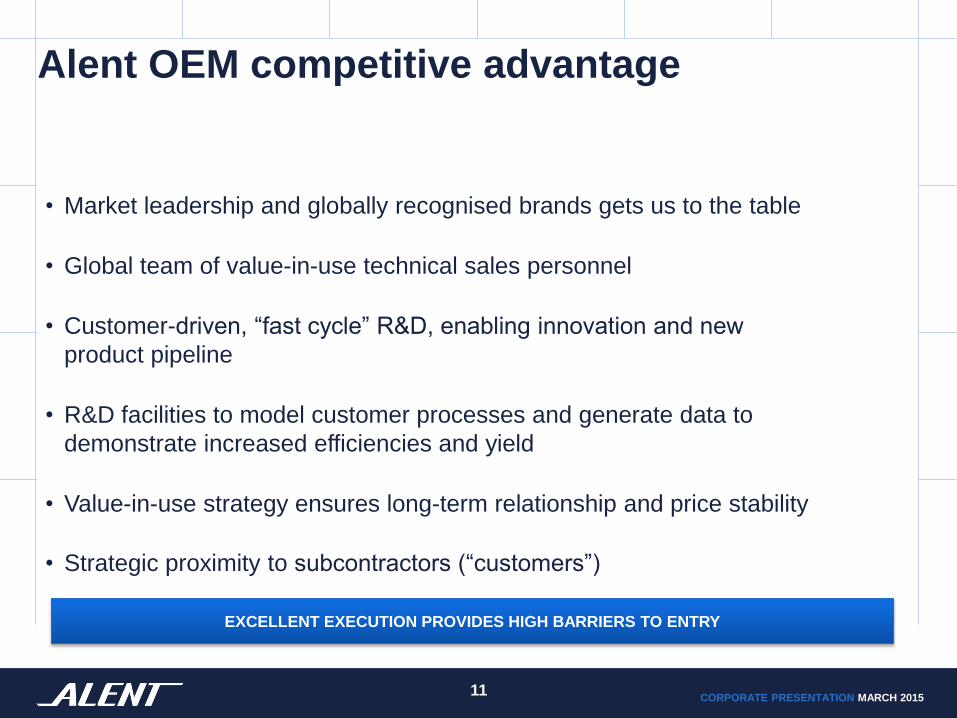
Alent OEM competitive advantage
• Market leadership and globally recognised brands gets us to the table
• Global team of value-in-use technical sales personnel
• Customer-driven, “fast cycle” R&D, enabling innovation and new
product pipeline
• R&D facilities to model customer processes and generate data to
demonstrate increased efficiencies and yield
• Value-in-use strategy ensures long-term relationship and price stability
• Strategic proximity to subcontractors (“customers”)
EXCELLENT EXECUTION PROVIDES HIGH BARRIERS TO ENTRY
11
CORPORATE PRESENTATION MARCH 2015
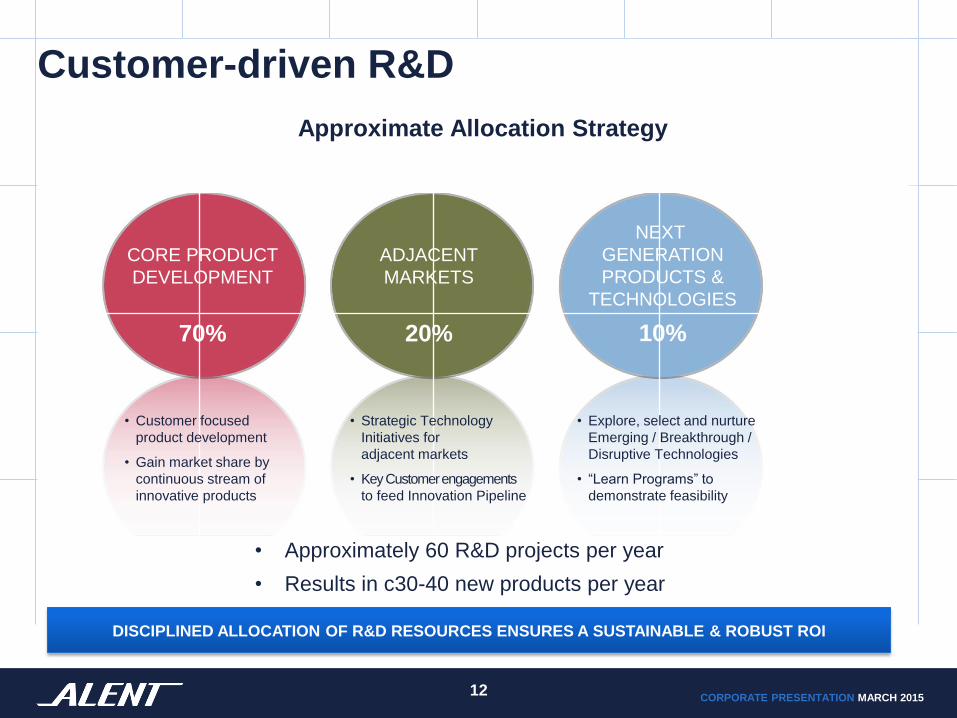
Customer-driven R&D
Approximate Allocation Strategy
DISCIPLINED ALLOCATION OF R&D RESOURCES ENSURES A SUSTAINABLE & ROBUST ROI
12
• Approximately 60 R&D projects per year
• Results in c30-40 new products per year
CORE PRODUCT
DEVELOPMENT
70%
ADJACENT
MARKETS
20%
NEXT
GENERATION
PRODUCTS &
TECHNOLOGIES
10%
• Customer focused
product development
• Gain market share by
continuous stream of
innovative products
• Strategic Technology
Initiatives for
adjacent markets
• Key Customer engagements
to feed Innovation Pipeline
• Explore, select and nurture
Emerging / Breakthrough /
Disruptive Technologies
• “Learn Programs” to
demonstrate feasibility
CORPORATE PRESENTATION MARCH 2015
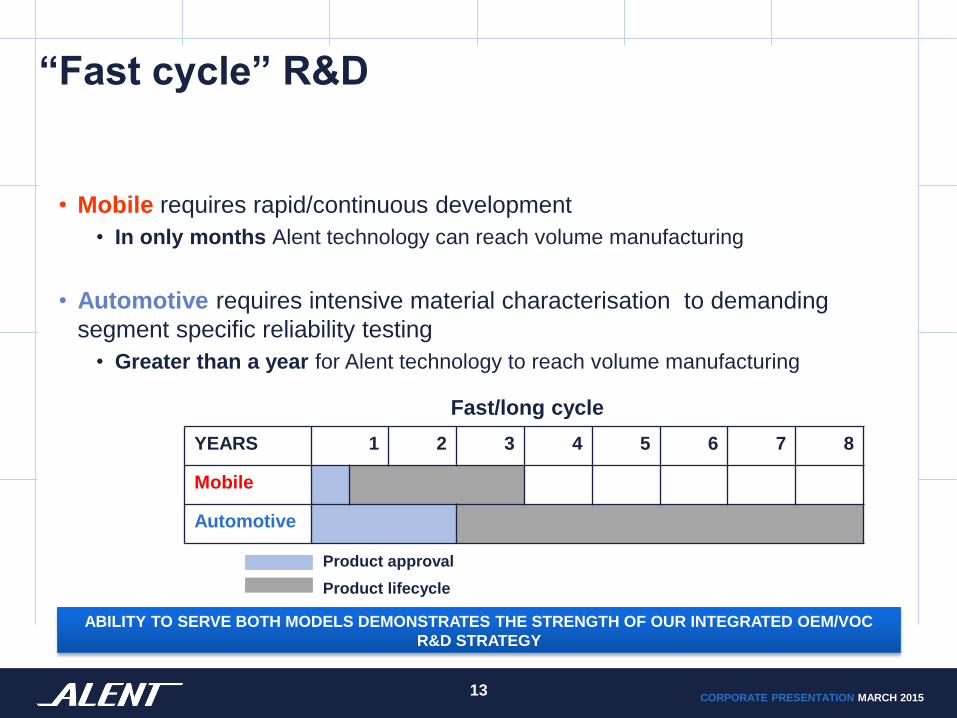
“Fast cycle” R&D
• Mobile requires rapid/continuous development
• In only months Alent technology can reach volume manufacturing
• Automotive requires intensive material characterisation to demanding
segment specific reliability testing
• Greater than a year for Alent technology to reach volume manufacturing
Fast/long cycle
ABILITY TO SERVE BOTH MODELS DEMONSTRATES THE STRENGTH OF OUR INTEGRATED OEM/VOC
R&D STRATEGY
13
YEARS 1 2 3 4 5 6 7 8
Mobile
Automotive
Product approval
Product lifecycle
CORPORATE PRESENTATION MARCH 2015
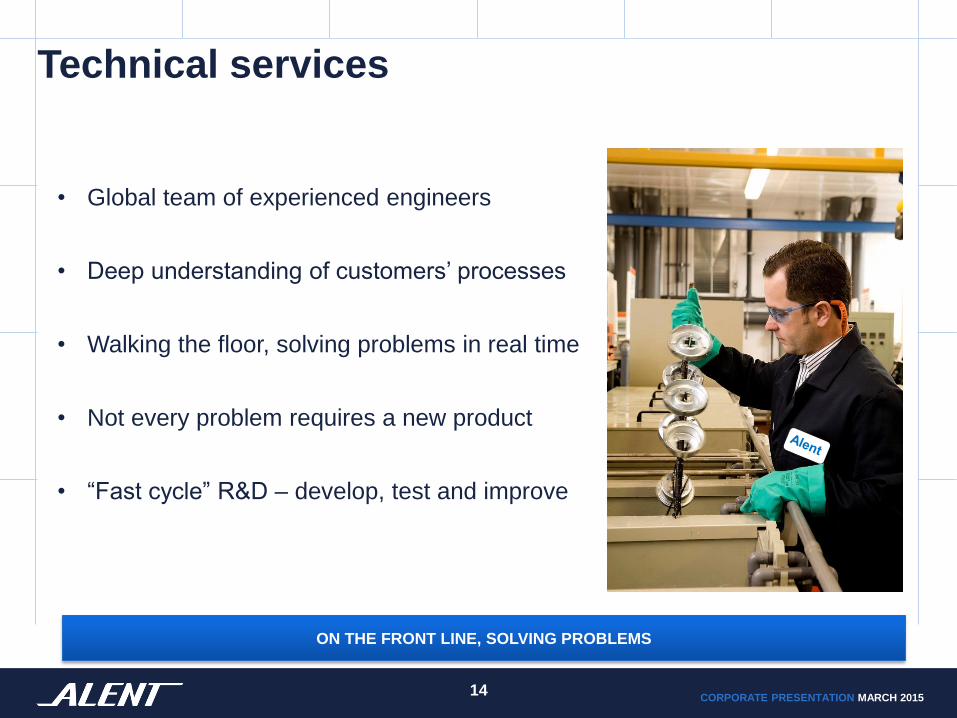
Technical services
14
ON THE FRONT LINE, SOLVING PROBLEMS
• Global team of experienced engineers
• Deep understanding of customers’ processes
• Walking the floor, solving problems in real time
• Not every problem requires a new product
• “Fast cycle” R&D – develop, test and improve
CORPORATE PRESENTATION MARCH 2015
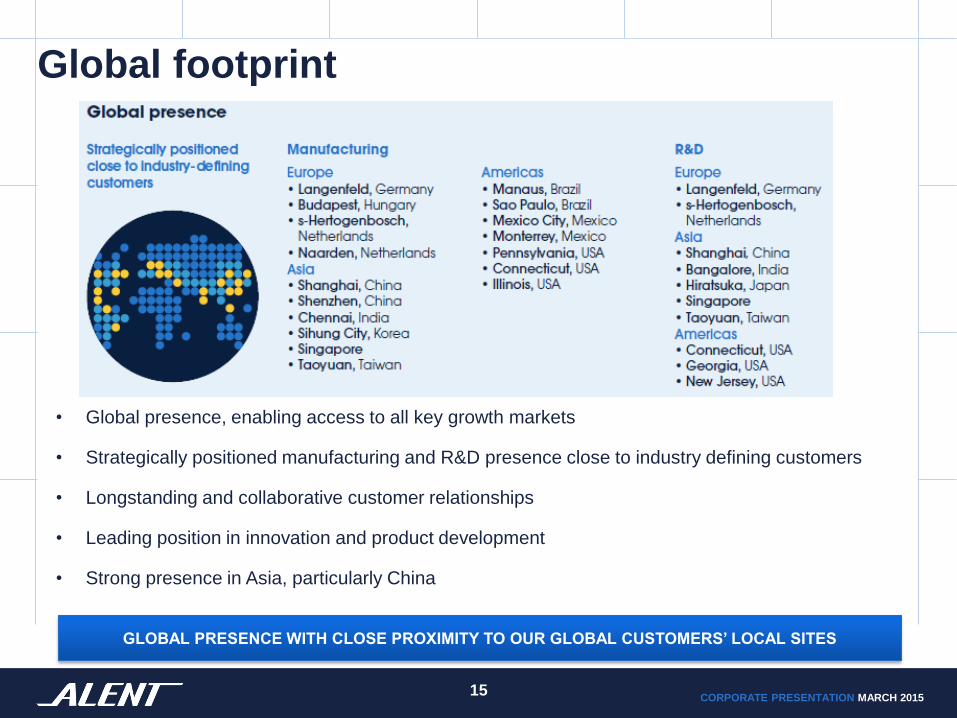
Global footprint
15 15
GLOBAL PRESENCE WITH CLOSE PROXIMITY TO OUR GLOBAL CUSTOMERS’ LOCAL SITES
• Global presence, enabling access to all key growth markets
• Strategically positioned manufacturing and R&D presence close to industry defining customers
• Longstanding and collaborative customer relationships
• Leading position in innovation and product development
• Strong presence in Asia, particularly China
CORPORATE PRESENTATION MARCH 2015
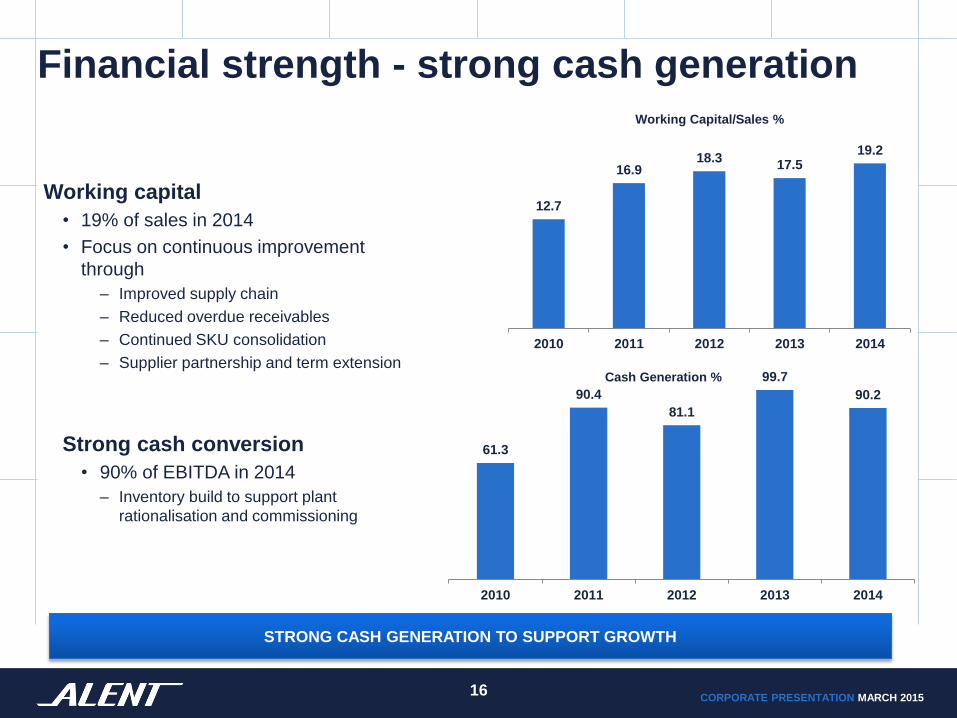
Financial strength - strong cash generation
12.7
16.9 18.3
17.5 19.2
2010 2011 2012 2013 2014
Working Capital/Sales %
Working capital
• 19% of sales in 2014
• Focus on continuous improvement
through
– Improved supply chain
– Reduced overdue receivables
– Continued SKU consolidation
– Supplier partnership and term extension
Strong cash conversion
• 90% of EBITDA in 2014
– Inventory build to support plant
rationalisation and commissioning
61.3
90.4
81.1
99.7
90.2
2010 2011 2012 2013 2014
Cash Generation %
STRONG CASH GENERATION TO SUPPORT GROWTH
16
CORPORATE PRESENTATION MARCH 2015
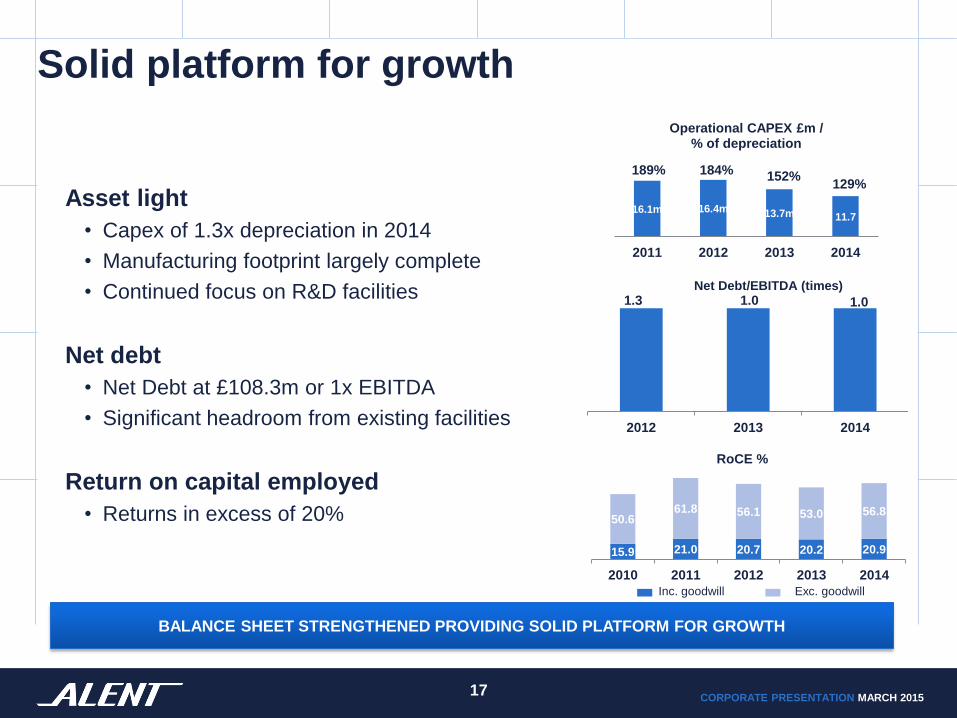
Solid platform for growth
15.9 21.0 20.7 20.2 20.9
50.6 61.8 56.1 53.0 56.8
2010 2011 2012 2013 2014
RoCE %
1.3 1.0 1.0
2012 2013 2014
Net Debt/EBITDA (times)
Asset light
• Capex of 1.3x depreciation in 2014
• Manufacturing footprint largely complete
• Continued focus on R&D facilities
Net debt
• Net Debt at £108.3m or 1x EBITDA
• Significant headroom from existing facilities
Return on capital employed
• Returns in excess of 20%
BALANCE SHEET STRENGTHENED PROVIDING SOLID PLATFORM FOR GROWTH
17
16.1m 16.4m 13.7m 11.7
2011 2012 2013 2014
Operational CAPEX £m / % of depreciation
189% 184% 152%
Inc. goodwill Exc. goodwill
129%
CORPORATE PRESENTATION MARCH 2015
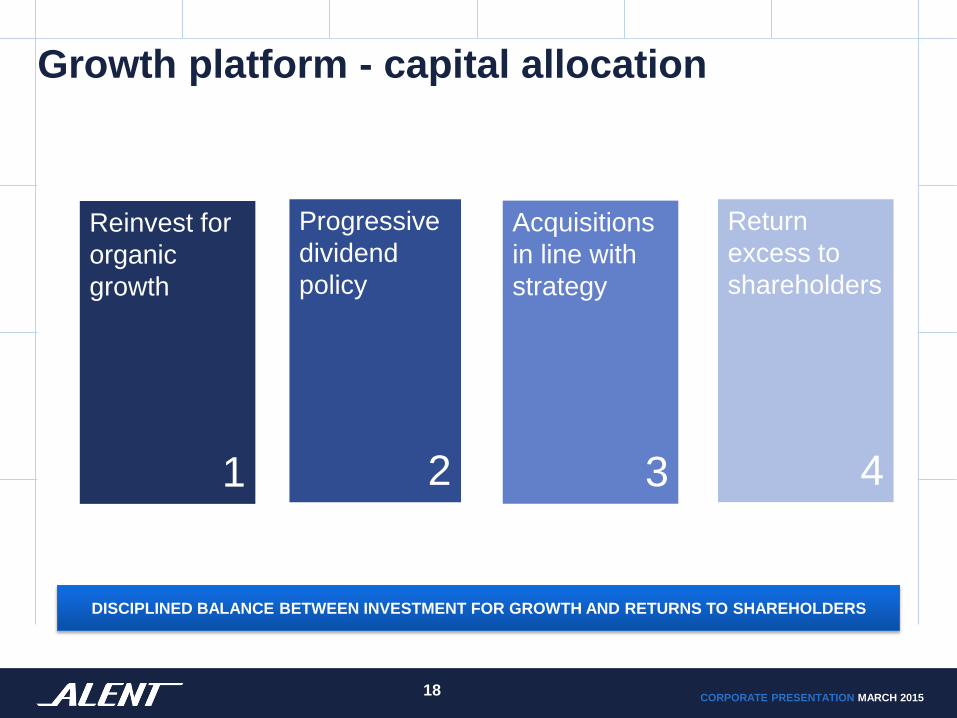
Growth platform - capital allocation
18 18
DISCIPLINED BALANCE BETWEEN INVESTMENT FOR GROWTH AND RETURNS TO SHAREHOLDERS
Progressive
dividend
policy
2
Reinvest for
organic
growth
1
Acquisitions
in line with
strategy
3
Return
excess to
shareholders
4
CORPORATE PRESENTATION MARCH 2015
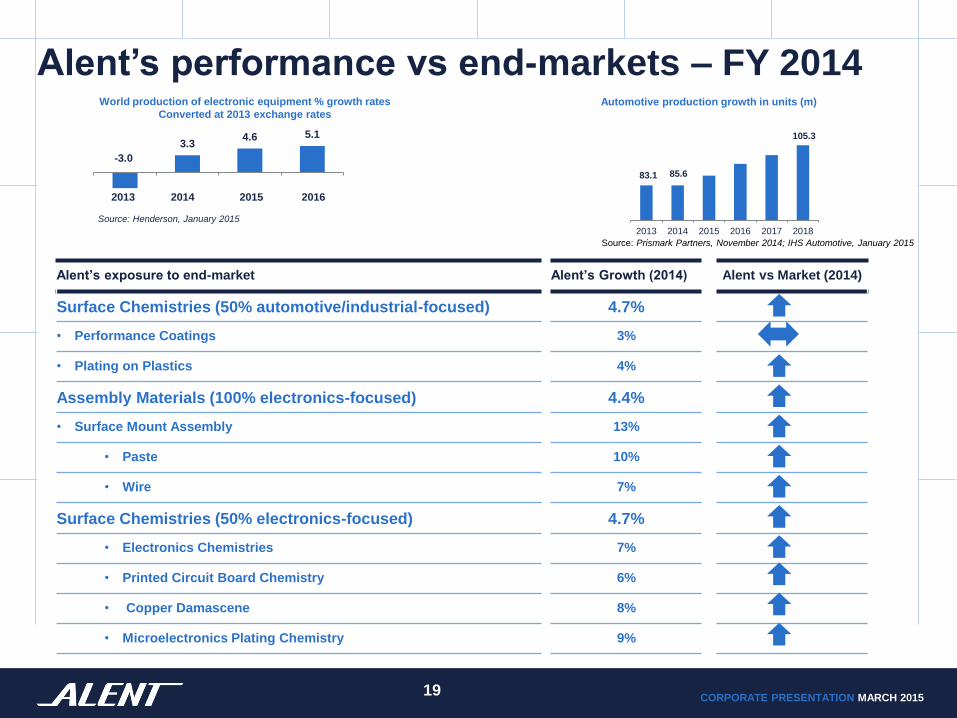
Alent’s performance vs end-markets – FY 2014
19
Alent’s exposure to end-market Alent’s Growth (2014) Alent vs Market (2014)
Surface Chemistries (50% automotive/industrial-focused) 4.7%
• Performance Coatings 3%
• Plating on Plastics 4%
Assembly Materials (100% electronics-focused) 4.4%
• Surface Mount Assembly 13%
• Paste 10%
• Wire 7%
Surface Chemistries (50% electronics-focused) 4.7%
• Electronics Chemistries 7%
• Printed Circuit Board Chemistry 6%
• Copper Damascene 8%
• Microelectronics Plating Chemistry 9%
-3.0
3.3 4.6 5.1
Source: Henderson, January 2015
World production of electronic equipment % growth rates
Converted at 2013 exchange rates Automotive production growth in units (m)
Source: Prismark Partners, November 2014; IHS Automotive, January 2015
2013 2014 2015 2016 2017 2018
105.3
83.1
2013 2014 2015 2016
85.6

CORPORATE PRESENTATION MARCH 2015
INVESTING FOR GROWTH
20
CORPORATE PRESENTATION MARCH 2015
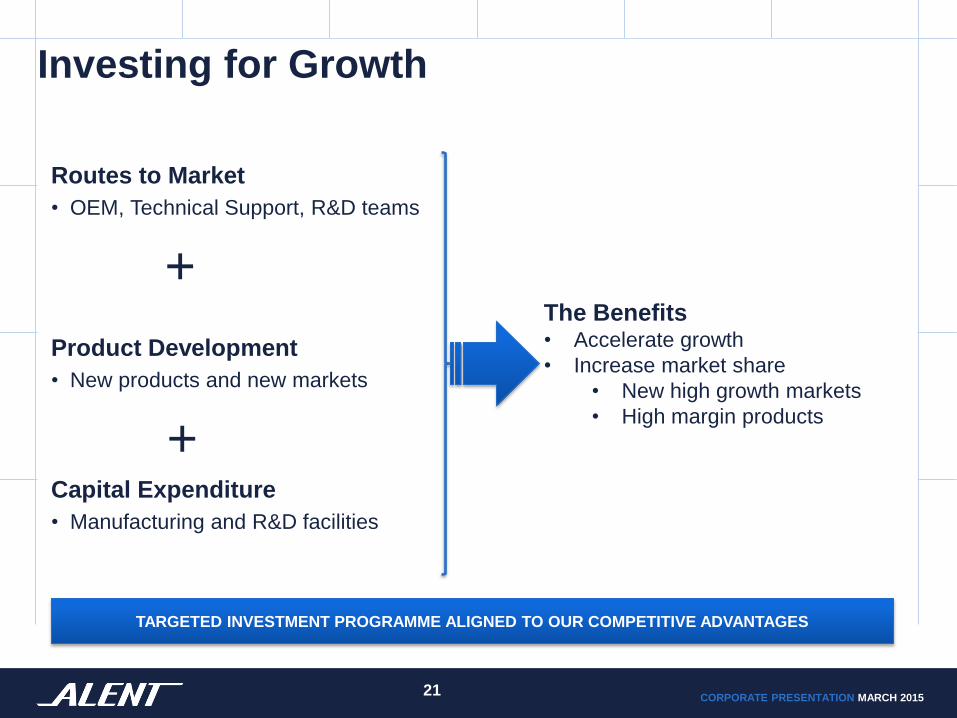
Investing for Growth
Routes to Market
• OEM, Technical Support, R&D teams
+
Product Development
• New products and new markets
+ Capital Expenditure
• Manufacturing and R&D facilities
The Benefits • Accelerate growth
• Increase market share
• New high growth markets
• High margin products
TARGETED INVESTMENT PROGRAMME ALIGNED TO OUR COMPETITIVE ADVANTAGES
21 21
CORPORATE PRESENTATION MARCH 2015
APPENDICES
22
CORPORATE PRESENTATION MARCH 2015
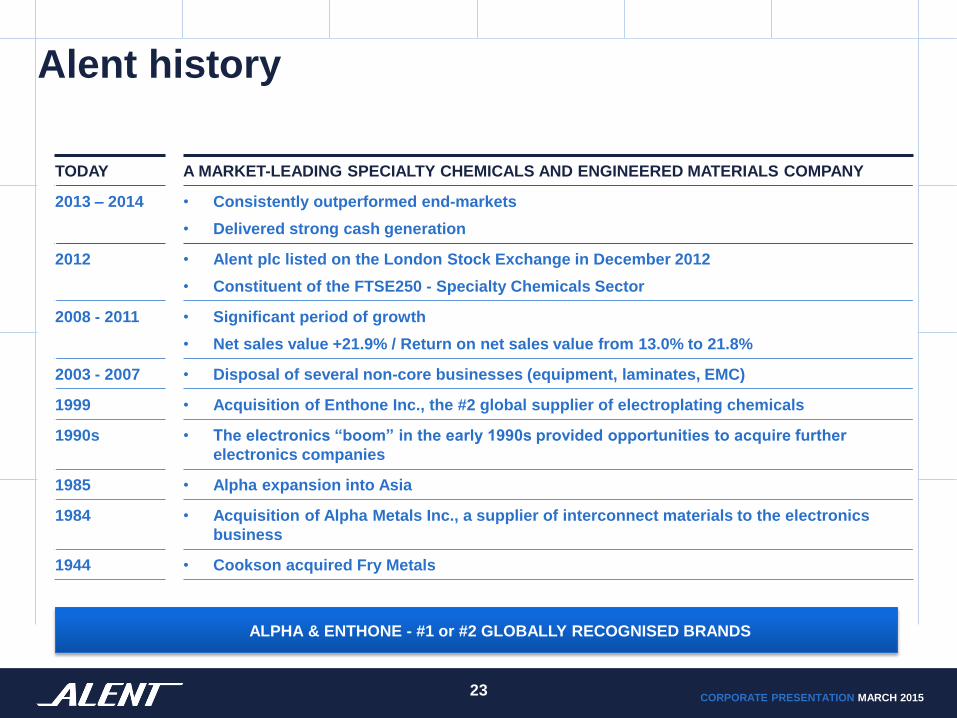
Alent history
TODAY A MARKET-LEADING SPECIALTY CHEMICALS AND ENGINEERED MATERIALS COMPANY
2013 – 2014 • Consistently outperformed end-markets
• Delivered strong cash generation
2012 • Alent plc listed on the London Stock Exchange in December 2012
• Constituent of the FTSE250 - Specialty Chemicals Sector
2008 - 2011 • Significant period of growth
• Net sales value +21.9% / Return on net sales value from 13.0% to 21.8%
2003 - 2007 • Disposal of several non-core businesses (equipment, laminates, EMC)
1999 • Acquisition of Enthone Inc., the #2 global supplier of electroplating chemicals
1990s • The electronics “boom” in the early 1990s provided opportunities to acquire further
electronics companies
1985 • Alpha expansion into Asia
1984 • Acquisition of Alpha Metals Inc., a supplier of interconnect materials to the electronics
business
1944 • Cookson acquired Fry Metals
ALPHA & ENTHONE - #1 or #2 GLOBALLY RECOGNISED BRANDS
23
CORPORATE PRESENTATION MARCH 2015
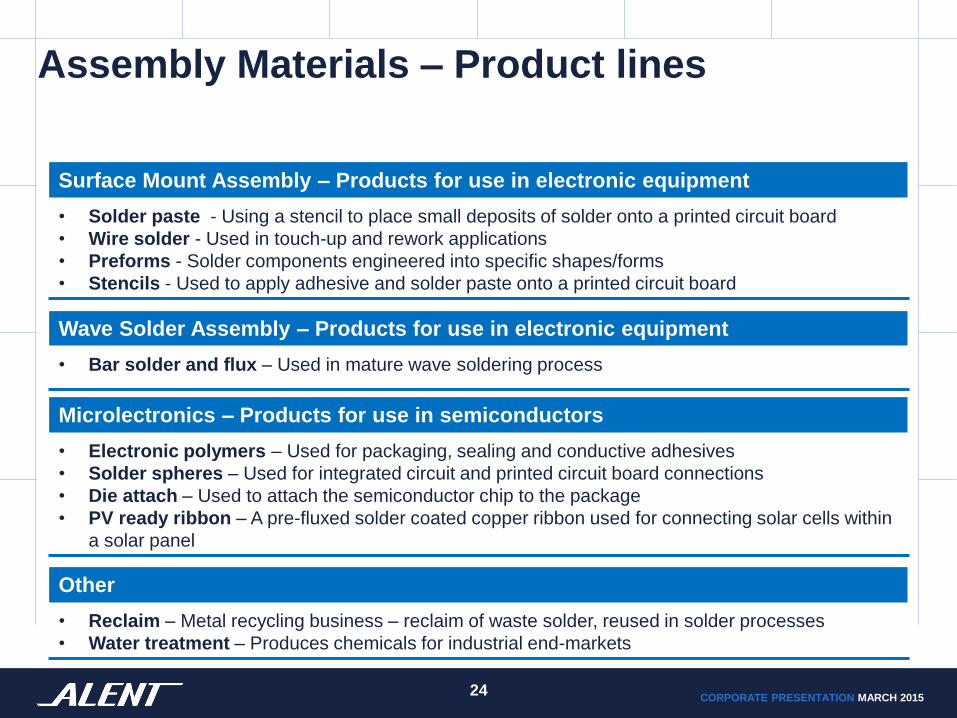
Assembly Materials – Product lines
Surface Mount Assembly – Products for use in electronic equipment
• Solder paste - Using a stencil to place small deposits of solder onto a printed circuit board
• Wire solder - Used in touch-up and rework applications
• Preforms - Solder components engineered into specific shapes/forms
• Stencils - Used to apply adhesive and solder paste onto a printed circuit board
Wave Solder Assembly – Products for use in electronic equipment
• Bar solder and flux – Used in mature wave soldering process
Microlectronics – Products for use in semiconductors
• Electronic polymers – Used for packaging, sealing and conductive adhesives
• Solder spheres – Used for integrated circuit and printed circuit board connections
• Die attach – Used to attach the semiconductor chip to the package
• PV ready ribbon – A pre-fluxed solder coated copper ribbon used for connecting solar cells within
a solar panel
Other
• Reclaim – Metal recycling business – reclaim of waste solder, reused in solder processes
• Water treatment – Produces chemicals for industrial end-markets
24
CORPORATE PRESENTATION MARCH 2015
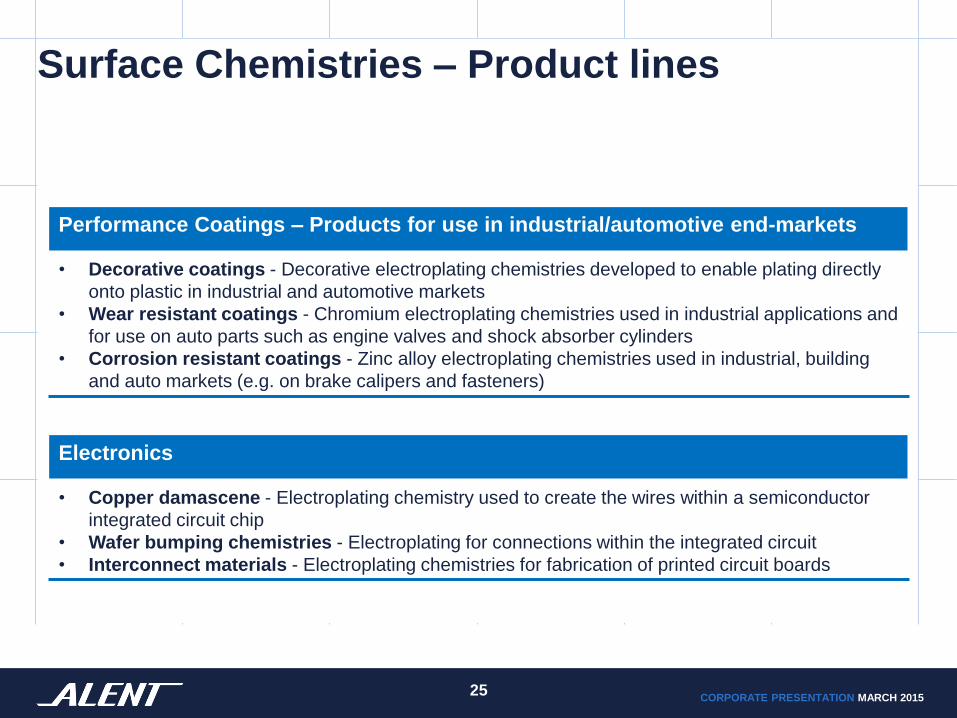
Surface Chemistries – Product lines
Performance Coatings – Products for use in industrial/automotive end-markets
• Decorative coatings - Decorative electroplating chemistries developed to enable plating directly
onto plastic in industrial and automotive markets
• Wear resistant coatings - Chromium electroplating chemistries used in industrial applications and
for use on auto parts such as engine valves and shock absorber cylinders
• Corrosion resistant coatings - Zinc alloy electroplating chemistries used in industrial, building
and auto markets (e.g. on brake calipers and fasteners)
Electronics
• Copper damascene - Electroplating chemistry used to create the wires within a semiconductor
integrated circuit chip
• Wafer bumping chemistries - Electroplating for connections within the integrated circuit
• Interconnect materials - Electroplating chemistries for fabrication of printed circuit boards
25
CORPORATE PRESENTATION MARCH 2015
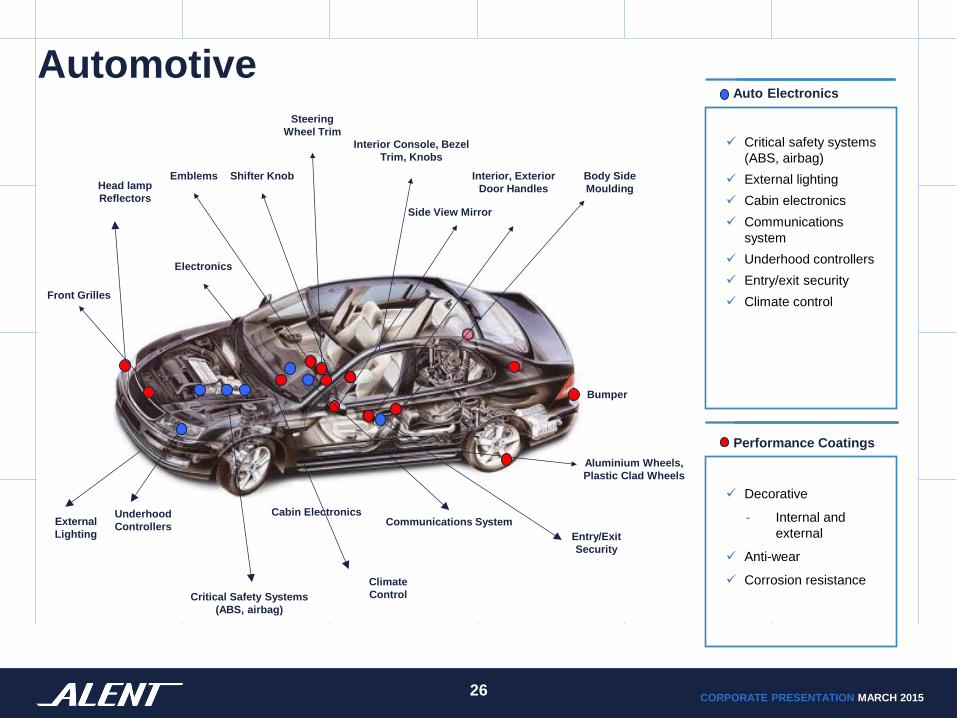
Automotive
Critical safety systems
(ABS, airbag)
External lighting
Cabin electronics
Communications
system
Underhood controllers
Entry/exit security
Climate control
Decorative
- Internal and
external
Anti-wear
Corrosion resistance
Performance Coatings
Auto Electronics
26
Head lamp
Reflectors
Front Grilles
Electronics
Emblems
Steering
Wheel Trim
Interior Console, Bezel
Trim, Knobs
Body Side
Moulding
Bumper
Aluminium Wheels,
Plastic Clad Wheels
Interior, Exterior
Door Handles
Side View Mirror
Shifter Knob
Critical Safety Systems
(ABS, airbag)
External
Lighting
Cabin Electronics Communications System
Underhood
Controllers Entry/Exit
Security
Climate
Control
CORPORATE PRESENTATION MARCH 2015
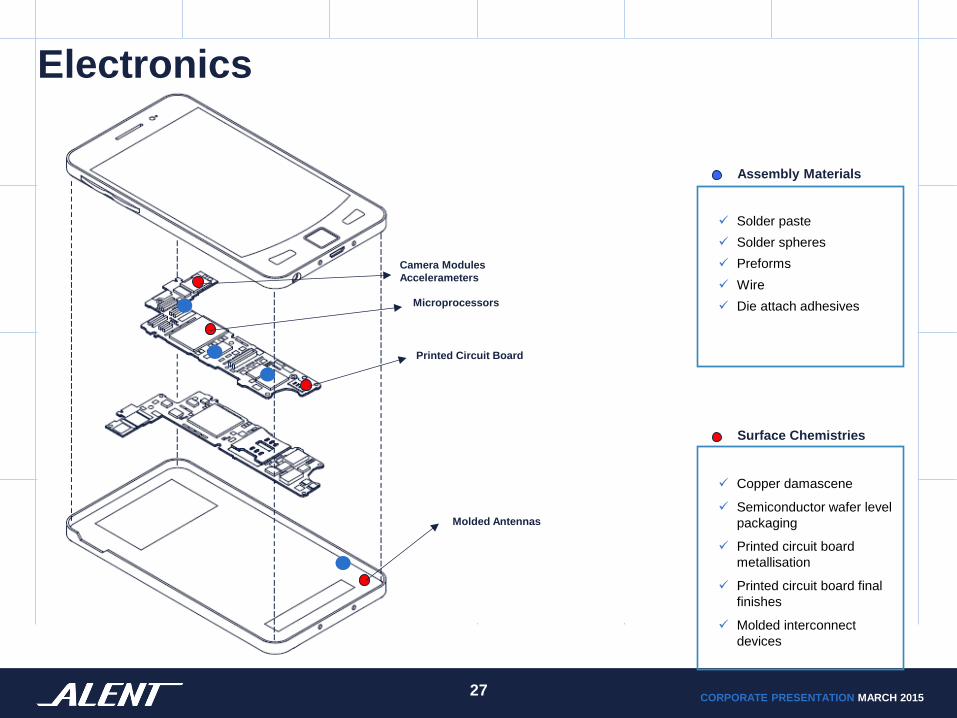
Electronics
27
Solder paste
Solder spheres
Preforms
Wire
Die attach adhesives
Copper damascene
Semiconductor wafer level
packaging
Printed circuit board
metallisation
Printed circuit board final
finishes
Molded interconnect
devices
Molded Antennas
Printed Circuit Board
Microprocessors
Camera Modules
Accelerameters
Surface Chemistries
Assembly Materials
CORPORATE PRESENTATION MARCH 2015
Growth markets - Automotive
28
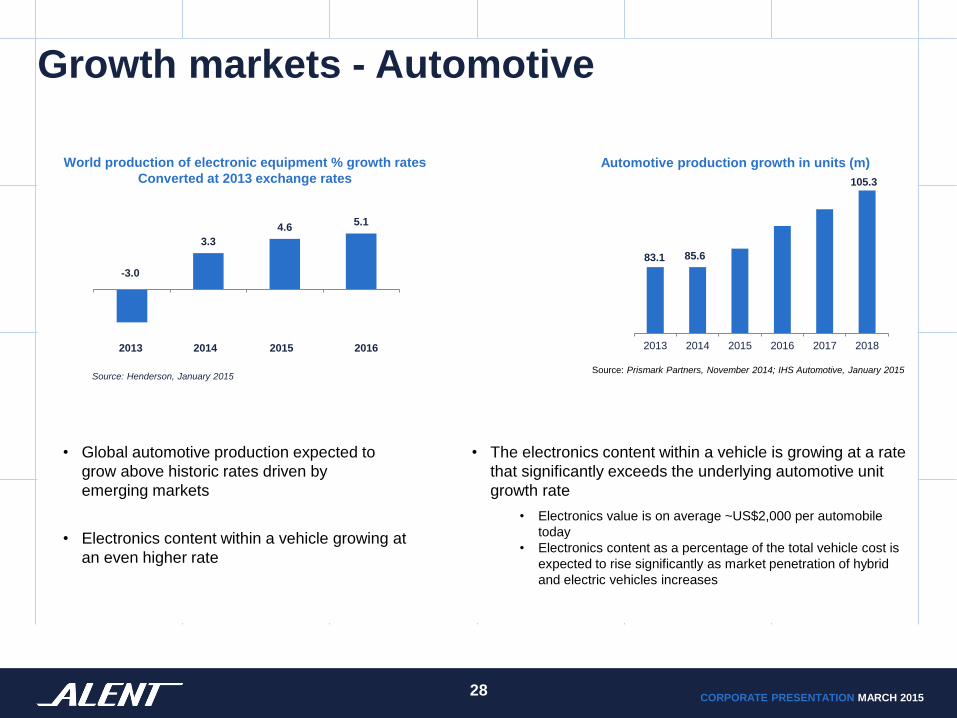
• Global automotive production expected to
grow above historic rates driven by
emerging markets
• Electronics content within a vehicle growing at
an even higher rate
• The electronics content within a vehicle is growing at a rate
that significantly exceeds the underlying automotive unit
growth rate
• Electronics value is on average ~US$2,000 per automobile
today
• Electronics content as a percentage of the total vehicle cost is
expected to rise significantly as market penetration of hybrid
and electric vehicles increases
-3.0
3.3
4.6 5.1
Source: Henderson, January 2015
World production of electronic equipment % growth rates
Converted at 2013 exchange rates
Automotive production growth in units (m)
Source: Prismark Partners, November 2014; IHS Automotive, January 2015
2013 2014 2015 2016 2017 2018
105.3
83.1
2013 2014 2015 2016
85.6
CORPORATE PRESENTATION MARCH 2015
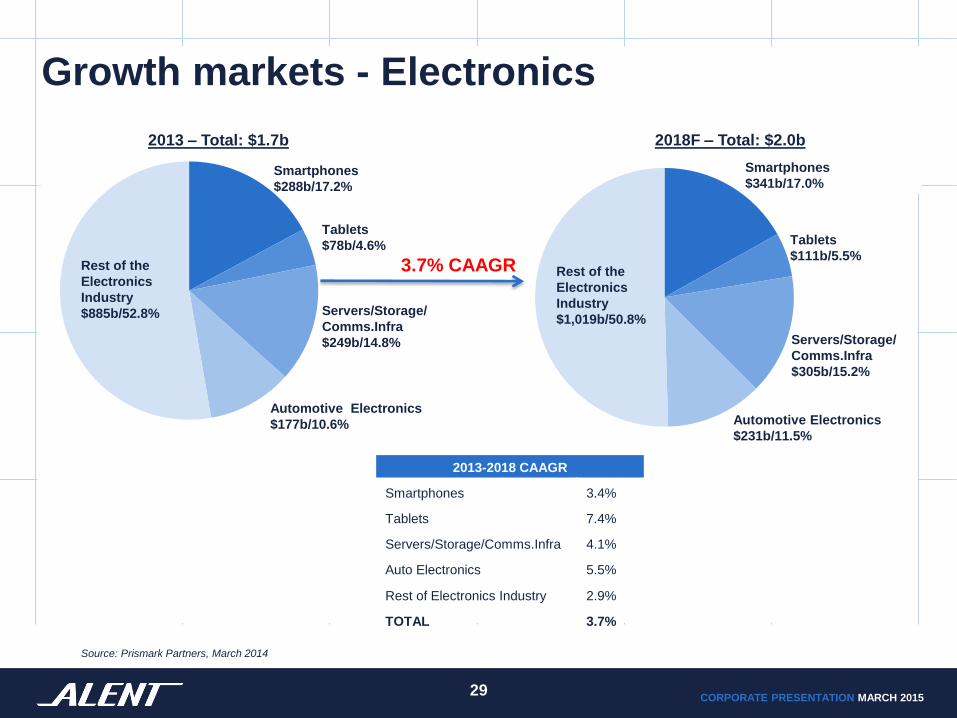
Growth markets - Electronics
2013-2018 CAAGR
Smartphones 3.4%
Tablets 7.4%
Servers/Storage/Comms.Infra 4.1%
Auto Electronics 5.5%
Rest of Electronics Industry 2.9%
TOTAL 3.7%
3.7% CAAGR
Smartphones
$288b/17.2%
Tablets
$78b/4.6%
Servers/Storage/
Comms.Infra
$249b/14.8%
Rest of the
Electronics
Industry
$885b/52.8%
Automotive Electronics
$177b/10.6%
Rest of the
Electronics
Industry
$1,019b/50.8%
Smartphones
$341b/17.0%
Tablets
$111b/5.5%
Automotive Electronics
$231b/11.5%
Servers/Storage/
Comms.Infra
$305b/15.2%
Source: Prismark Partners, March 2014
2013 – Total: $1.7b 2018F – Total: $2.0b
29

CORPORATE PRESENTATION MARCH 2015
Investing for Growth
Routes to Market
• OEM, Technical Support, R&D teams
+
Product Development
• New products and new markets
+ Capital Expenditure
• Manufacturing and R&D facilities
The Benefits • Accelerate growth
• Increase market share
• New high growth markets
• High margin products
TARGETED INVESTMENT PROGRAMME ALIGNED TO OUR COMPETITIVE ADVANTAGES
30 30
CORPORATE PRESENTATION MARCH 2015
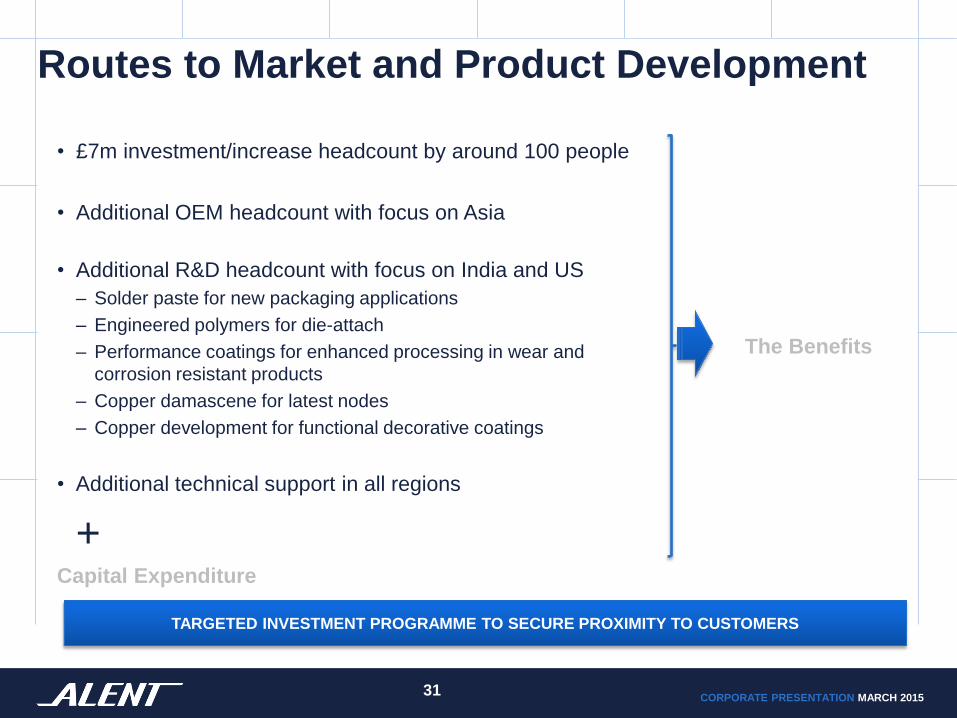
Routes to Market and Product Development
• £7m investment/increase headcount by around 100 people
• Additional OEM headcount with focus on Asia
• Additional R&D headcount with focus on India and US
– Solder paste for new packaging applications
– Engineered polymers for die-attach
– Performance coatings for enhanced processing in wear and
corrosion resistant products
– Copper damascene for latest nodes
– Copper development for functional decorative coatings
• Additional technical support in all regions
+ Capital Expenditure
31 31
TARGETED INVESTMENT PROGRAMME TO SECURE PROXIMITY TO CUSTOMERS
The Benefits
CORPORATE PRESENTATION MARCH 2015
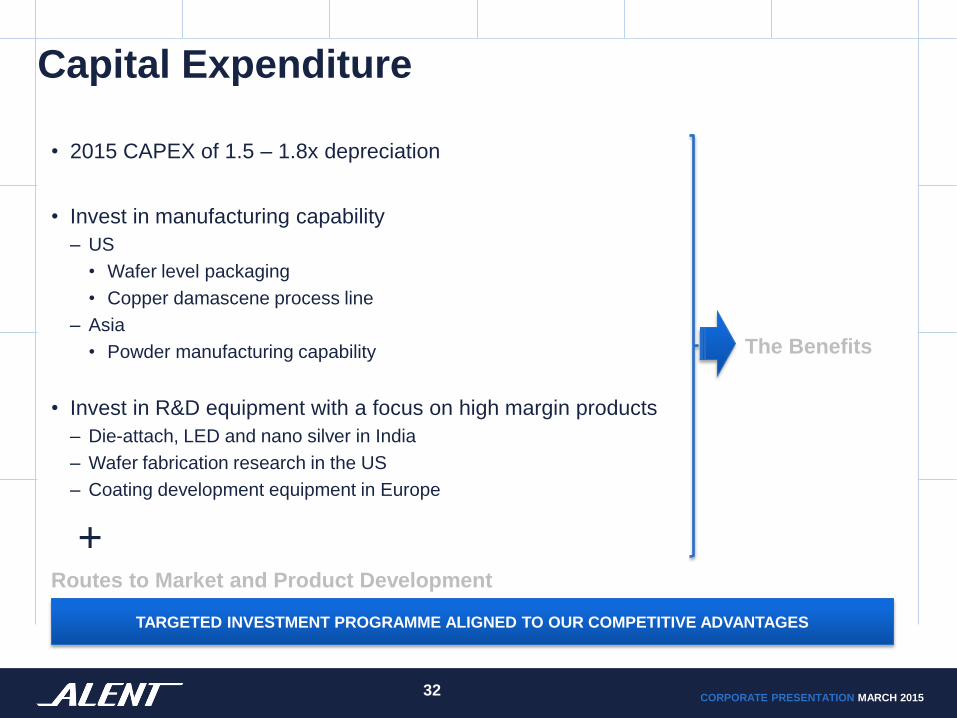
Capital Expenditure
• 2015 CAPEX of 1.5 – 1.8x depreciation
• Invest in manufacturing capability
– US
• Wafer level packaging
• Copper damascene process line
– Asia
• Powder manufacturing capability
• Invest in R&D equipment with a focus on high margin products
– Die-attach, LED and nano silver in India
– Wafer fabrication research in the US
– Coating development equipment in Europe
+ Routes to Market and Product Development
The Benefits
TARGETED INVESTMENT PROGRAMME ALIGNED TO OUR COMPETITIVE ADVANTAGES
32 32
CORPORATE PRESENTATION MARCH 2015
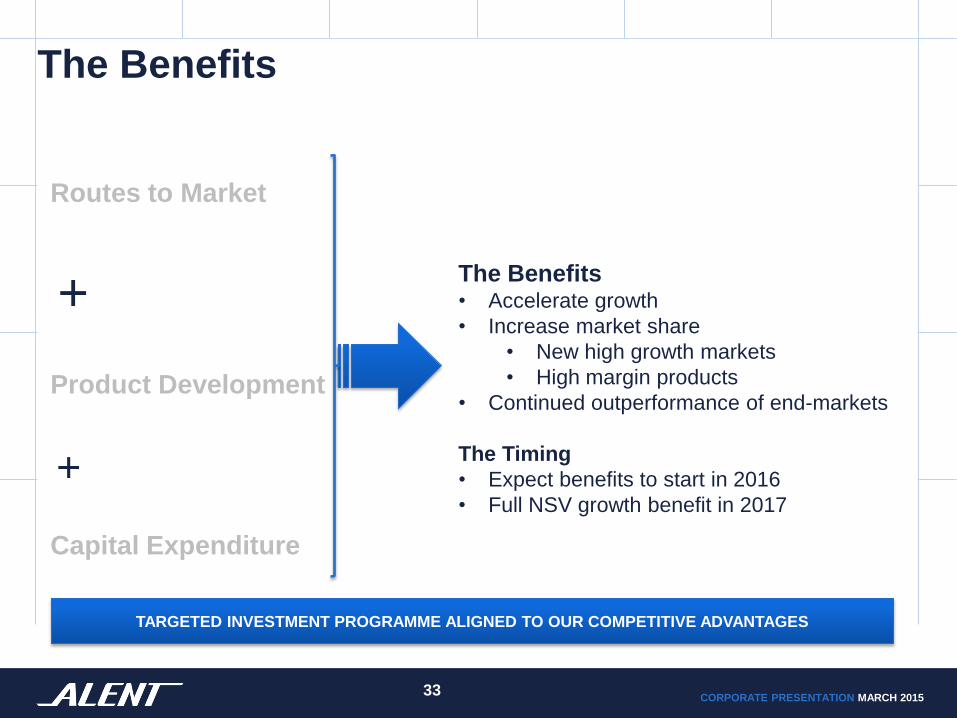
The Benefits
Routes to Market
+
Product Development
+
Capital Expenditure
TARGETED INVESTMENT PROGRAMME ALIGNED TO OUR COMPETITIVE ADVANTAGES
33 33
The Benefits • Accelerate growth
• Increase market share
• New high growth markets
• High margin products
• Continued outperformance of end-markets
The Timing
• Expect benefits to start in 2016
• Full NSV growth benefit in 2017
CORPORATE PRESENTATION MARCH 2015
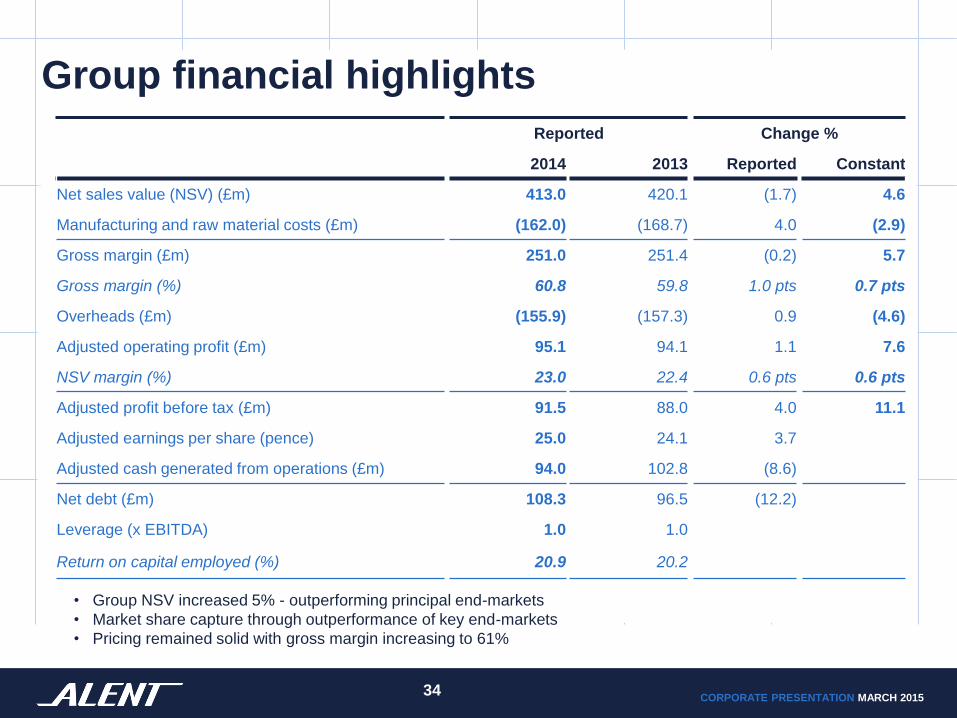
Group financial highlights
34 34
Reported Change %
2014 2013 Reported Constant
Net sales value (NSV) (£m) 413.0 420.1 (1.7) 4.6
Manufacturing and raw material costs (£m) (162.0) (168.7) 4.0 (2.9)
Gross margin (£m) 251.0 251.4 (0.2) 5.7
Gross margin (%) 60.8 59.8 1.0 pts 0.7 pts
Overheads (£m) (155.9) (157.3) 0.9 (4.6)
Adjusted operating profit (£m) 95.1 94.1 1.1 7.6
NSV margin (%) 23.0 22.4 0.6 pts 0.6 pts
Adjusted profit before tax (£m) 91.5 88.0 4.0 11.1
Adjusted earnings per share (pence) 25.0 24.1 3.7
Adjusted cash generated from operations (£m) 94.0 102.8 (8.6)
Net debt (£m) 108.3 96.5 (12.2)
Leverage (x EBITDA) 1.0 1.0
Return on capital employed (%) 20.9 20.2
• Group NSV increased 5% - outperforming principal end-markets
• Market share capture through outperformance of key end-markets
• Pricing remained solid with gross margin increasing to 61%
CORPORATE PRESENTATION MARCH 2015
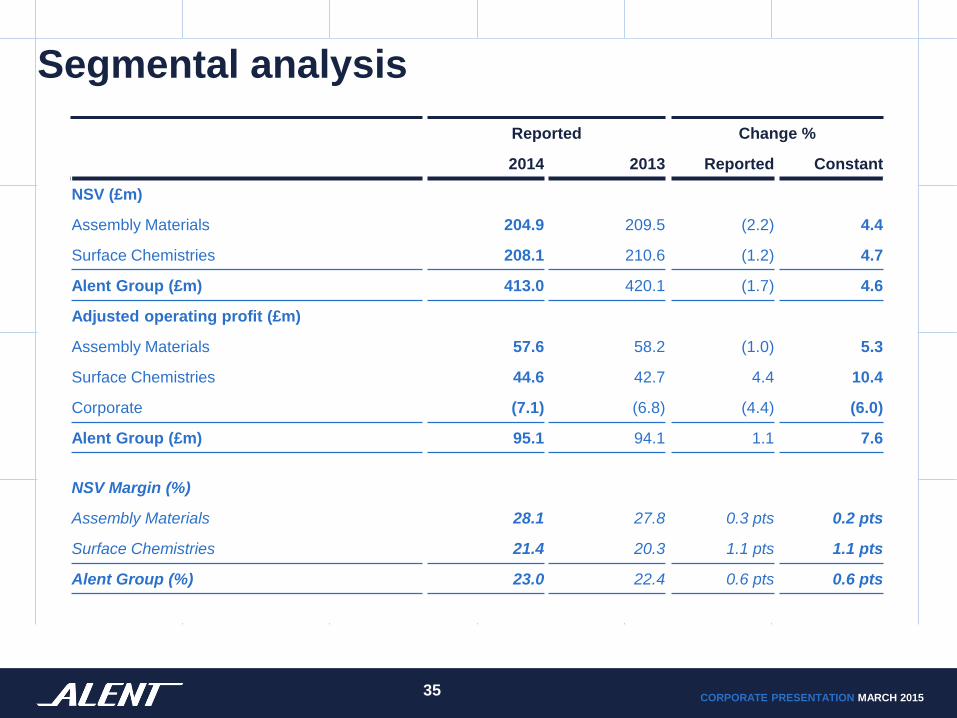
Segmental analysis
35 35
Reported Change %
2014 2013 Reported Constant
NSV (£m)
Assembly Materials 204.9 209.5 (2.2) 4.4
Surface Chemistries 208.1 210.6 (1.2) 4.7
Alent Group (£m) 413.0 420.1 (1.7) 4.6
Adjusted operating profit (£m)
Assembly Materials 57.6 58.2 (1.0) 5.3
Surface Chemistries 44.6 42.7 4.4 10.4
Corporate (7.1) (6.8) (4.4) (6.0)
Alent Group (£m) 95.1 94.1 1.1 7.6
NSV Margin (%)
Assembly Materials 28.1 27.8 0.3 pts 0.2 pts
Surface Chemistries 21.4 20.3 1.1 pts 1.1 pts
Alent Group (%) 23.0 22.4 0.6 pts 0.6 pts
CORPORATE PRESENTATION MARCH 2015
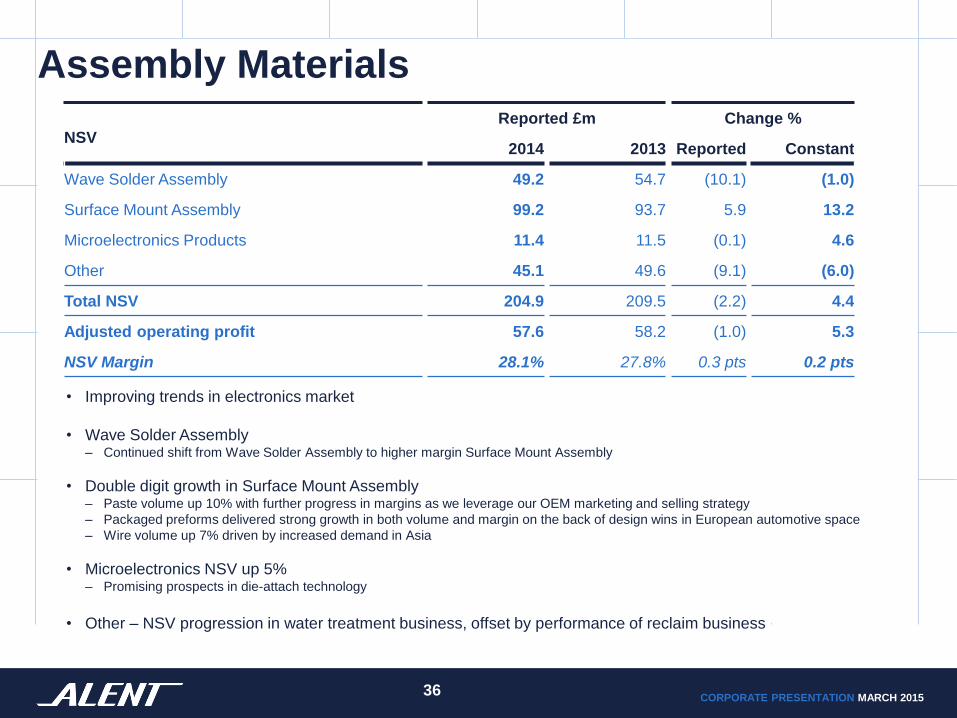
Assembly Materials
36 36
NSV
Reported £m Change %
2014 2013 Reported Constant
Wave Solder Assembly 49.2 54.7 (10.1) (1.0)
Surface Mount Assembly 99.2 93.7 5.9 13.2
Microelectronics Products 11.4 11.5 (0.1) 4.6
Other 45.1 49.6 (9.1) (6.0)
Total NSV 204.9 209.5 (2.2) 4.4
Adjusted operating profit 57.6 58.2 (1.0) 5.3
NSV Margin 28.1% 27.8% 0.3 pts 0.2 pts
• Improving trends in electronics market
• Wave Solder Assembly – Continued shift from Wave Solder Assembly to higher margin Surface Mount Assembly
• Double digit growth in Surface Mount Assembly – Paste volume up 10% with further progress in margins as we leverage our OEM marketing and selling strategy
– Packaged preforms delivered strong growth in both volume and margin on the back of design wins in European automotive space
– Wire volume up 7% driven by increased demand in Asia
• Microelectronics NSV up 5% – Promising prospects in die-attach technology
• Other – NSV progression in water treatment business, offset by performance of reclaim business
CORPORATE PRESENTATION MARCH 2015
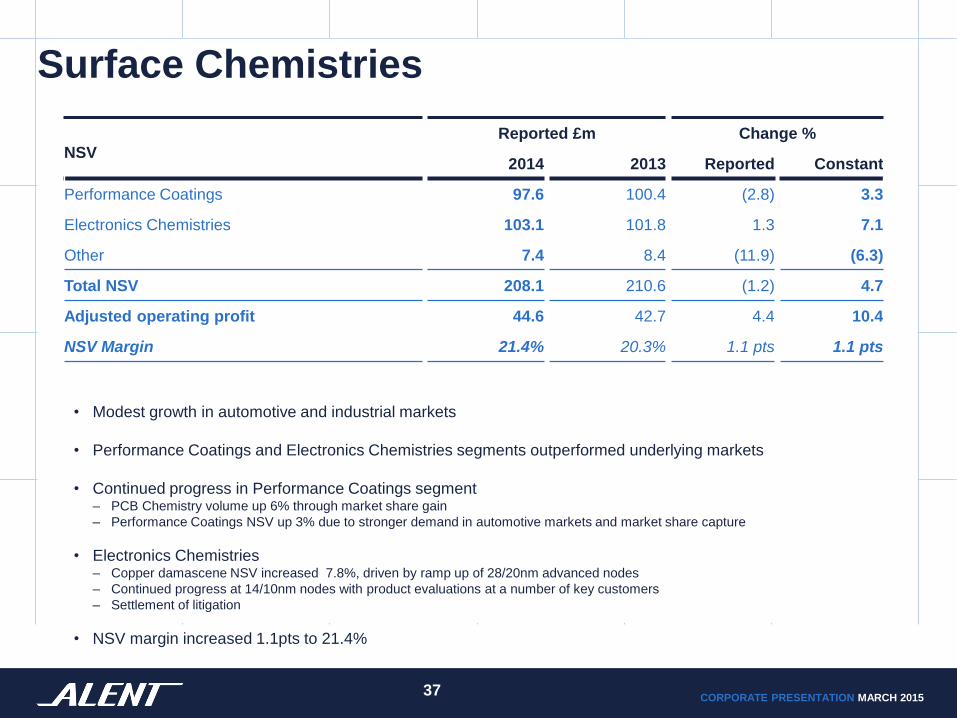
Surface Chemistries
37 37
NSV
Reported £m Change %
2014 2013 Reported Constant
Performance Coatings 97.6 100.4 (2.8) 3.3
Electronics Chemistries 103.1 101.8 1.3 7.1
Other 7.4 8.4 (11.9) (6.3)
Total NSV 208.1 210.6 (1.2) 4.7
Adjusted operating profit 44.6 42.7 4.4 10.4
NSV Margin 21.4% 20.3% 1.1 pts 1.1 pts
• Modest growth in automotive and industrial markets
• Performance Coatings and Electronics Chemistries segments outperformed underlying markets
• Continued progress in Performance Coatings segment – PCB Chemistry volume up 6% through market share gain
– Performance Coatings NSV up 3% due to stronger demand in automotive markets and market share capture
• Electronics Chemistries – Copper damascene NSV increased 7.8%, driven by ramp up of 28/20nm advanced nodes
– Continued progress at 14/10nm nodes with product evaluations at a number of key customers
– Settlement of litigation
• NSV margin increased 1.1pts to 21.4%
CORPORATE PRESENTATION MARCH 2015
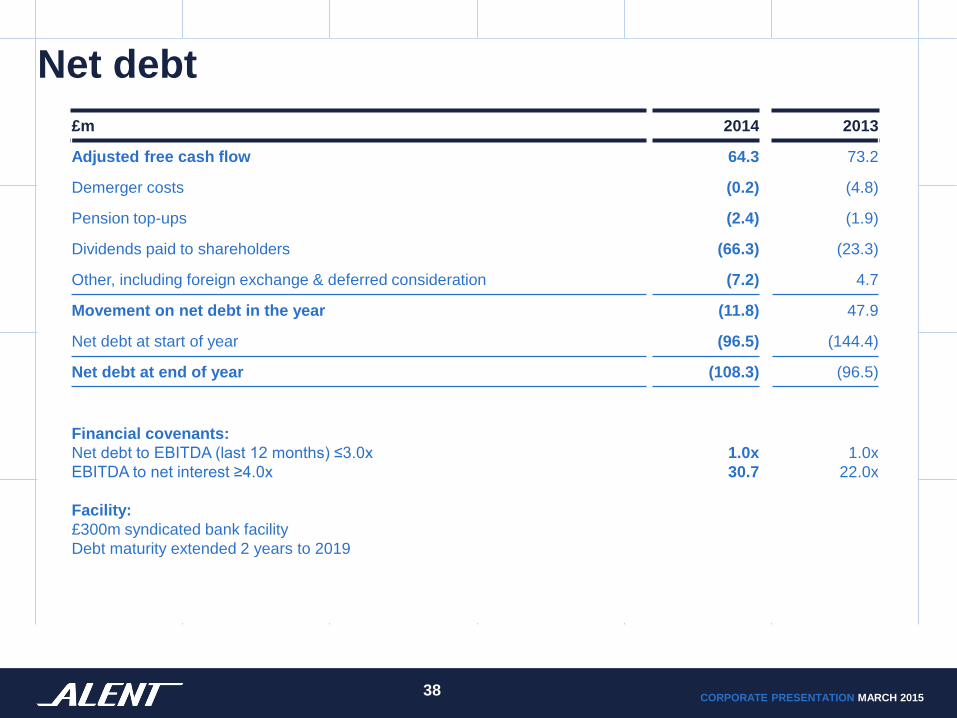
Net debt
38 38
£m 2014 2013
Adjusted free cash flow 64.3 73.2
Demerger costs (0.2) (4.8)
Pension top-ups (2.4) (1.9)
Dividends paid to shareholders (66.3) (23.3)
Other, including foreign exchange & deferred consideration (7.2) 4.7
Movement on net debt in the year (11.8) 47.9
Net debt at start of year (96.5) (144.4)
Net debt at end of year (108.3) (96.5)
Financial covenants:
Net debt to EBITDA (last 12 months) ≤3.0x
EBITDA to net interest ≥4.0x
Facility:
£300m syndicated bank facility
Debt maturity extended 2 years to 2019
1.0x
30.7
1.0x
22.0x
CORPORATE PRESENTATION MARCH 2015
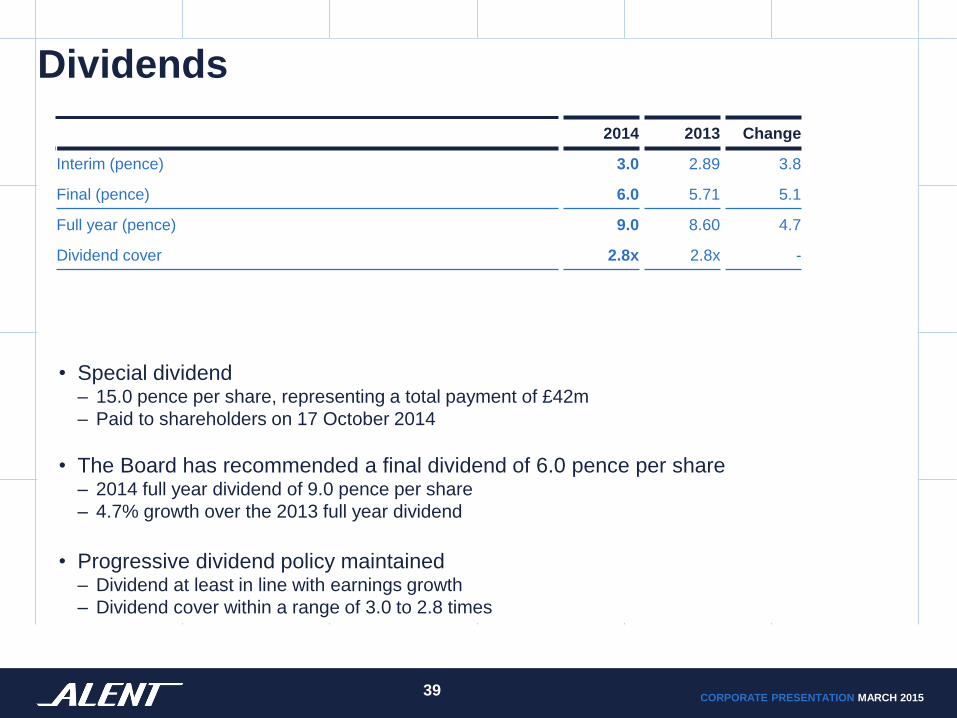
Dividends
39 39
2014 2013 Change
Interim (pence) 3.0 2.89 3.8
Final (pence) 6.0 5.71 5.1
Full year (pence) 9.0 8.60 4.7
Dividend cover 2.8x 2.8x -
• Special dividend – 15.0 pence per share, representing a total payment of £42m
– Paid to shareholders on 17 October 2014
• The Board has recommended a final dividend of 6.0 pence per share – 2014 full year dividend of 9.0 pence per share
– 4.7% growth over the 2013 full year dividend
• Progressive dividend policy maintained – Dividend at least in line with earnings growth
– Dividend cover within a range of 3.0 to 2.8 times
CORPORATE PRESENTATION MARCH 2015
Definitions
40 40
The following are referred to throughout this presentation:-
• NSV is revenue less commodity metals (tin, silver, gold).
• Adjusted operating profit, adjusted profit before tax, adjusted profit for the year and adjusted earnings per share are,
where appropriate, each stated before: exceptional items; amortisation of acquired intangible assets; deferred tax on
acquired intangible assets and goodwill; utilisation of deferred tax assets (where initial recognition was as an
exceptional item); acquisition costs; the impact arising from the fair valuing of financial instruments; and profits or
losses arising on business disposals.
• Adjusted cash generated from operations is cash generated from operations after adding back £0.2m (2013: £4.8m)
for demerger cash costs.
• Free cash flow is defined as net cash from operating activities after net outlays for the purchase and sale of property,
plant and equipment and dividends from joint ventures but before additional funding contributions to Group pension
plans.


![pcw 2011 Cut off - 58 - talentacademy.co.in · PSC- L.D ¢m¿°v ap≥h¿j tNmZy-t]-∏-dp-Iƒ Talent Academy hnP-b-tcJ {]kn-≤o-I-cWw TT T ALENT ALENT ALENT 57. Im°-\m-S≥ F∂](https://img.pdfslide.us/doc/110x75/5c9c7e1f09d3f23b2a8c0f6b/pcw-2011-cut-off-58-psc-ld-mv-aphj-tnmzy-t-dp-if-talent.jpg)