Embed Size (px)
Citation preview
ELSEVIER
Forest Ecologyand
Management
Forest Ecology and Management 93 (1997) 195-203
Factors influencing the availability of nitrogen in thinned andunthinned Douglas-fIT stands in .the central Oregon Cascades
AlejandroVelazquezMartinez a.. . DavidA. Perry b
·Programa Forestal. Colegio de PostgraduaJos. Montecillo 56230. Mexico
b Department of Forest Science. Oregon State University. Corvallis. OR 97331. USA
Accepted 22 October 1996
Abstract
Soil N mineralized during 7-day anaerobic incubation at 4O"C ('available' N) was compared at two soil depths andcorrelated to soil and site factors in Douglas-fir stands with different combinations of thinning and multinutrient fenilization.Available N expressed either on an area basis (kg ha - I) or on a concentration basis (mg kg - I) at the two depths did notvary significantly by stocking density, treatment. or density-treatment interaction. There was a significant differencebetween the soil depths. averaging 39 mg kg-I at 0-20 cm depth, and 20 mg kg-I at 20-40 cm depth. Available N waspositively correlated with total soil N. exchangeable Ca. and adjusted aspect (the former two factors accounting for 46% ofthe total variation). and negatively with rock content and slope steepness. Stand density had no effect. @ 1997 ElsevierScience B.V.
Keywords: Nutrient cycling; Topoedaphic controls
1. Introduction
Nutrient availability in forest ecosystems dependson the interaction of soil. vegetation, and environ-mental processes (Jenny, 1940. Forest productivity,like that of most terrestrial ecosystems, is generallynitrogen limited (Myrold. 1987), and N is recognizedas the most limiting element for forest growth in thePacific Northwest (Johnson et al., 1982). Because ofits degree of limitation, there has been search for anadequate index of N availability (Keeney, 1980;Powers, 1980, 1984).
An index !hat has.proved to be a reliable indicator
. Corresponding author. Tel./fax: (595 1-0275).
0378-1127/91/$11.00 \t'J 1997 Elsevier Science B.V. All rights reserved.Plr S0318-1121(96)03953-9
of N availability, at least for some tree species. is therate at which nitrogen in mineralized. MineralizableN, determined either aerobically or anaerobically,has been found to correlate reasonably well withgrowth response to fertilization (Shumway andAtkinson, 1978; Powers, 1980; Radwan andShumway, 1984), aboveground primary production(Nadelhoffer et al., 1983; Pastor et al.. 1984;Binkleyet al.. 1986), growth efficiency (Velazquez Martinezet al., 1992), and site index (Powers, 1980; Kabzemsand Klinka. 1987). Anaerobically-determined miner---alizable N is considered to index the pool of readilyavailable N in soils (Waring 3;DdBremner. 1964;Powers. 1980), and correlates closely with nitrogencontained in microbial biomass (Myrold. 1987; Bink-ley and Hart. 1989). .
196
. # ~ ".
A. Velazquez Manintz. D.A. Perry / Forest Ecology and MlWlgtmnlt 93 (I997J 195-203
Understanding the factors that influence nitrogenavailability yields insights into controls over primaryproductivity. Researchers have examined relation-ships between N mineralization and soil character-istics such as pH, temperature, water content, andsoil organic maner (SOM) (Stanford and Epstein,1974; Nadelhoffer et al., 1983; Hart and Binkley,1985; Warren and Whitehead, 1988). The objectivesof the present study were: (I) to compare availableN, as indexed by anaerobic mineralization, amongDouglas-fir plantations with different combinationsof thinning and multinutrient fertilization; (2) toexamine the influence of soil nutrients and topogra-phy on available N across a range of sites on the HJ.Andrews Experimental Forest, Oregon.
2. Methods
The study was conducted in the HJ. AndrewsExperimental Forest, located in the west-central Cas-cade Mountains, 80. kIn east of Eugene. Oregon(44°15'N. 122°1O'W)."The Experimental Forest iswet and fairly mild in winter and warm and dry insummer (Bierlmaier and McKee. 1989). Averageyearly temperature (recorded at 426 m elevation) is8.5°C. At lower elevations of the forest, the. meantemperature of the coldest month is 2.3°C. and 26.6°Cin the honest (Rothacher et al.. 1967). Extremetemperatures range from - 18 to 38°C. Averageannual precipitation is about 2300 mm at lowerelevations and may reach more than 2500 mm onsome higherridges (Dymess et al.. 1974).
The most prevalentsoils are Inceptisols.althoughthere are some Alfisols (Brown and Parson. 1973).Soils are formed primarily from igneous bedrock.particularlyandesites.Becauseof their highporosity.these soils permit rapid absorption of water and
TableIMeanand rangeof topoedaphicvariablesfor the study sites
Site E1eva1ion(m) SoilrocItCODteDt(%)
Mean Mean Range
Ll07 705 11.2 5.2-18.3LIII 732 8.4 2.7-2005lAOS 854 6.6 1.9-15.7L701 854 14.6 7.6-27.0
provide storage for 30-40 cm of water (Bierlmaierand McKee. 1989).
The study was located in four Douglas-fir planta-tions in the western hemlock zone (Franklin. andDymess. .1973). Established by planting followingclearcuning and slash burning. plantations rangedfrom 21 to 27 years of age in 1987 (the time ofsampling). Elevations. slopes. aspects. and soil rockcontents are shown for each site in Table 1. No soilsurvey has been done on the HJ. Andrews; however.in nearby locales that have been surveyed. sites withtemperatures. precipitation. and topography similarto our study sites have soils classified as Klickitat orBohannon (SCS. 1989). These are deep and welldrained. with a dark brown stony .or gravely loamsurface layer and a brown to dark brown cobblyloam subsoil. Depth to bedrock ranges from 50 to150 cm.
Plantations were manually thinned in 1981 tothree levels: heavily thinned (average spacing 5.5m). moderately thinned (average spacing 3.6 m), andunthinned. Felled trees were left on site. In 1987.leaf aIea index (LAO averaged 2.8 m2 m -2. 4.4 m2
m-2, and 10.7 m2 m-2 in heavily thinned. moder-ately thinned. and unthinned. respectively. Each levelof thinning was represented by one randomly se-lected block within each plantation. Each thinningblock was subdivided into four subplots which wereeither pruned. fertilized with multinutrient tabs.pruned and fertilized. or left untreated (controls).giving a total of 48 subplots in the entire study.Subplots contained a similar number of trees (45-50),and varied in size depending on stocking density.Subp~ots were separated from one another and fromstand edges by 10 m buffers. Average .and ranges ofslope and aspect were calculated from five randompoints per subplot (aspect by compass and slope byclinometer). Density was determined from plots of
SIope(%) Aspect (deg.) '1
Mean Range Mean . Range41 12-75 168 0-36043 2S-65 277 200-36023 12-50 182 155-21542 12-63 166 100-152
A. Velazquez Maninn. D.A. Perry / Forest Ecology and Ml11Ulgement93 (1997} 195-203
known area within each subploL Procedures forpruning and fertilizing are given in Velazquez Mar-tinez et al. (1992). Fertilizer tabs contained 4.2 g N,2.1 g P, 1.0 g K. 0.55 g Ca. 0.34 g S. and 0.07 g Fein the following compounds: urea formaldehyde. cal-cium phosphate. and potassium. calcium, and ferroussulfates. Each tree was given one tab per 1.2 cmdiameter at breast height (DBH), buried at 15-20 cmdepth evenly around the tree at the crown drip line.
Available N was determined in 1987 (6 yearsafter thinning) for two soil depths. Three randomlyselected soil samples were extracted from the top0-20 cm of mineral soil and one from 20-40 cmdepth in each subplot during mid summer 1988. Allsamples were collected within 10 days. Sampleswere placed in plastic bags and stored in walk-incoolers no longer than 3 days before analysis. Aftersieving to 4 rom and homogenizing in a splitter. a 50g subsample was taken from each sample and incu-bated anaerobically for 7 days at 4O"C(Waring andBremner. 1964). Prior to and following incubation,NH; was extracted with 2 N KCl and analyzedusing an Alpken Rapid Aow Analyzer. Available Nwas calculated as the difference in NH; betweeninitial and final samples.
Available N in the 0-20 cm depth was expressed.both on a concentration basis (mg kg - I) and on an
area basis (kg ha - t), the latter calculated using soilrock content (Velazquez Maninez et al., 1992). Soilswere analyzed to determine exchangeable K, Ca. and
197
Mg, using the ammonium acetate method (Knudsenet al., 1982; Lanyon and Heald, 1982>.Total soilnitrogen and phosphorus concentrations were deter-mined using the standard microKjeldahl technique(Bremner and Mulvaney, 1982) and pH was deter-mined using both distilled water and 1 N KCl solu-tion. Leaf area index was estimated from sapwoodarea using the equation presented by Waring et al.(1982). For regression, aspect was adjusted as 180-1180- aspectl = adjusted aspect.
2.1. Statistical analysis
ANOV As and the Tukey test were used to investi-gate treatment effects on available N (Steel andTorrie, 1980). A t-test was used to compare avail-able N expressed on a concentration basis in the twosampled soil depths. Stepwise regression (StatisticalAnalysis Systems Institute Inc., 1985) was used toexamine the relationship between available N fromthe top 0-20 cm of mineral soil, topoedaphic charac-teristics, and 1987 leaf area index. Prior to ANOVAand regression, nutrient data were log transformed toimprove the normality of. distributions. The modelselected by backwards stepwise regression waschecked for collinearity using variance inflation andcondition index, and was additionally verified usingforwards stepwise regression (Statistical AnalysisSystems Institute Inc., 1985). All three proceduresshowed the model free of significant colline8rlty.
Table2Averagedsoil andphysiographiccharacteristicsof Douglas-firphmtationsat differentstanddensities
Variable Standdensity
Standard errors are given in parentheses. Within a row, means followed by the same letter are not significantly different at a - 0.05.
High Medium Low
Total soil N (mg kg-I) 2000 (l20)a 2100 (l30)a 2200 (lIO)aTotal soil P (mg kg -I ) 1400 (l4O)a 2000 (210)a 1700 (200)aExch. soil Ca (mcq per 100 g) 16.7 (I.46)a 10.5 (I.06)b 10.6 (I.16)bExch. soil Mg (mcq per 100 g) 4.6 (0.56)a 2.5 (0.38)b 2.8 (0.39)bExch. soil K (mcq per 100 g) 506.0 (43.6)a 397.0 (26.0)b 387.0 (36.8)bSoil Ca/Mg ratio 3.9 (0.28)a 4.8 (0.43)a 4.2 (0.26)apH 5.9 (.034)a 6.Q(.049)a 5.9 (0.52)aRock content (%) 7.1 (0.72)b 11.7 (1.64)a 11.8 (I.53)aSlope (%) 44.0 (4.9)a 34.7 (4.3)a 33.2 (4.2)aAspect (deg.) 195.0 (I9.7)a 197.0 (27.3)a 202.0 (23.4)a
198 A. Velazquez Martiner. D.A. Perry I Forest Ecology and Management 93 (1997J 195-203
3. Results
Soil nutrient and physiographic characteristics aresummarized in Table 2. In most cases there were nosignificant differences among stand densities andtreatments for the measured variables. However. ex-changeable Ca. Mg. and K were highest in soils ofhigh density plots. and rock content was higher inboth medium and low than in 'high density plots.
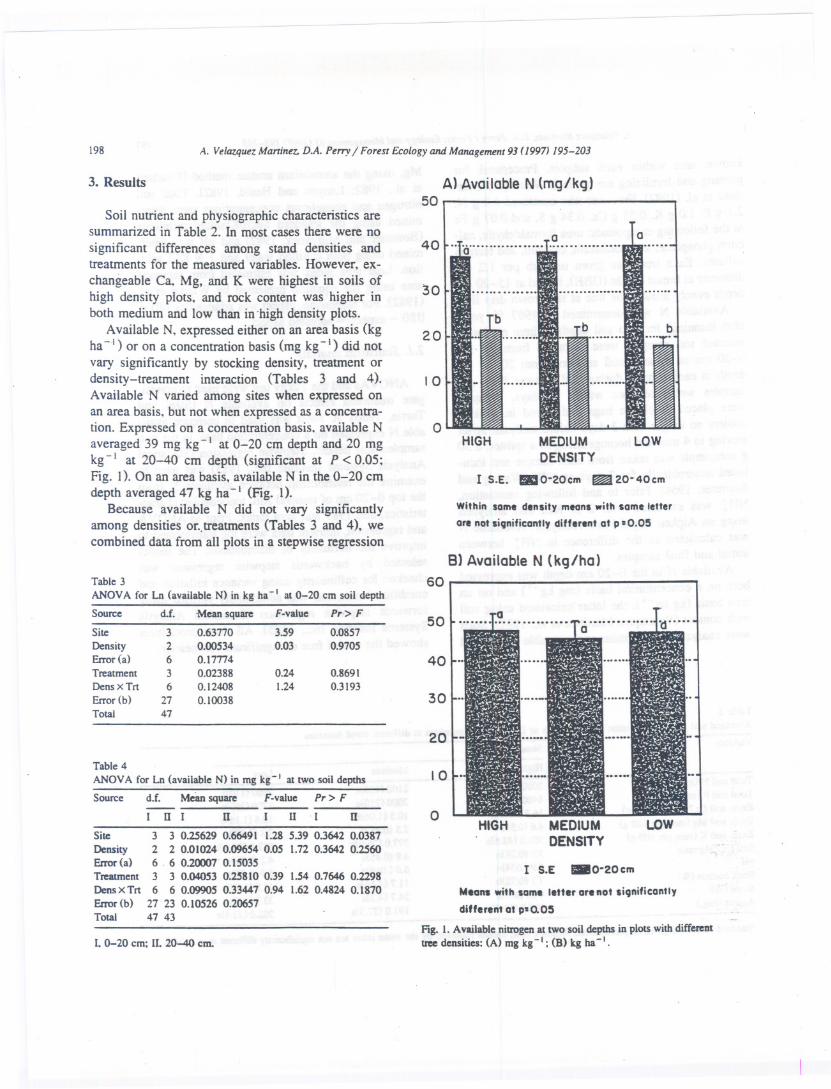
Available N. expressed either on an area basis (kgha - I ) or on a concentration basis (mg kg- I) did notvary significantly by stocking density. treatment ordensity-treatment interaction (Tables 3 and 4).Available N varied among sites when expressed onan area basis. but not when expressed as a concentra-tion. Expressed on a concentration basis. available Naveraged 39 mg kg-I at 0-20 cm depth and 20 mgkg-I at 20-40 cm depth (significant at P < 0.05:Fig. I). On an area basis. available N in the 0-20 cmdepth averaged 47 kg ha-I (Fig. I).
Because available N did not vary significantlyamong densities or..treatments (Tables 3 and 4). wecombined data from all plots in a stepwise regression
Table3ANOVAfor Ln (availableN) in kg ha-I at 0-20 em soil depth
Source d.f. Meansquare F-vaJue Pr-> F
Site 3 0.63770 3.59 0.0857Density 2 0.00534 0.03 0.9705Enor(a) 6 0.17774Treatment 3 0.02388 0.24 0.8691DensXTrt 6 0.12408 1.24 0.3193Enor (b) 27 0.10038Total 47
Table4ANOVAfor Ln (availableN) in mg kg-I at two soil depths
Source d.f. Meansquare F-vaJue Pr> F
I n I n I U -I n
Site 3 3 0.25629 0.66491 1.28 5.39 0.3642 0.0387Densit}' 2 2 0.01024 0.09654 0.05 1.72 0.3642 0.2560Enor(a) 6 - 6 0.20007 0.15035 _Treatment 3 3 0.04053 0.25810 0.39 1.54 0.7646 0.2298DensxTrt 6 6 0.0990S 0.33447 0.94 1.62 0.4824 0.1870Enor(b) 27 23 0.10526 0.20657Total 47 43
L 0-20 em; IL 20-40 em.
A) Available N (mg/kg)50
HIGH LOWMEDIUMDENSITY
I S.E. IfIIO-20em m!D20-40em
Within same density means with same letterare not siCJnificantlydifferent at p: O.OS
B) Available N (kg/ha)60
50
40
30
20
oMEDIUMDENSITY
LOWHIGH
Means with same litter are not siCJnificantly
different at p.o.OS
Fig. 1. Available nitrogen at tWOsoil depths in plots with differenttree densities: (A) mg kg-I; (B) kg ha-I.
A. Velazquez Martinez. D.A. Perry j Forest Ecology and Management 93 (1997} 195-203 199
Table 5
Model of Ln (available N) in kg ha -I
Variable entered Model R2 F
Step I: Total soil N (N) 0.23 13.6Step 2: Exchangeable Ca (Ca) 0.46 19.7
Step 3: Adjusted aspect" (Asp) 0.60 15.7Step 4: Rockcontent(Rock) 0.67 8.6Step 5: Slope (Sip) 0.71 5.s
Model: Ln (Min. N).. 4.88 + 1.087 Ln (N) + 0.29 Ln (Ca) + 0.0021 (Asp) - 0.017 (Rock) - 0.0044 (Sip)SE = (0.317) (0.155) (0.078) (0.155) (0.0065)(0.0018)
Pr>F
0.00060.000 10.00030.00530.0240
" Adjusted aspect - 180-1180 - aspectL This variable. rather than an absolute value for aspect, was used in regression.
procedure. Available N (kg ha-I) in the top 0-20cm of mineral soil was regressed against topoedaphicvariables and 1987 LAI. The resulting model (Table5) explained 71% of the variation, available N corre-lating positively with total soil N, exchangeable Ca,and adjusted aspect (i.e. it was higher on south thanon north aspects), and negatively with rock contentand slope steepness. Total soil N and exchangeableCa accounted for 46% of the total variation.
To explore the' relationships among the indepen-dent variables used"in ~gression, we performed prin-cipal component analysis (Table 6). The first twoprincipal components (PCs) accounted for 55% ofthe total variation among the measured variables..Exchangeable Ca and Mg and total P loaded stronglyon the first PC (Ca and Mg correlating negativelywith the first component, and P correlating posi-tively), while total N and adjusted aspect loaded
Table6
Results of principal componenlS analysis on soil and site variablesin all plots
Loadings"
PCl PC2 PC3 PC4
TotalsoilP 0.80272 0.23029 -0.23287 0.05759SoilCajMg ratio 0.79089 0.14827 0.04798 0.34643Rockcontent 0.62624 -0.19568 0.39330 -0.04483ExchangeableCa -0.82414 0.19641 0.05579 0.30176ExchangeableMg -0.92944 0.08667 0.13214 0.10898TotalsoilN 0.24421 0.84123 -0.12579 -0.01866Adjustedaspect -0.18814 -0.74394 -:-0.43503 -0.10353Perccntslope -0.45170 0.07814 0.73605 0.01237pH 0.46922 -0.41014 0.28967 0.66167ExchangeableK -0.46309 0.11840 -0.46839 o.s6569
" Loadings listed an: simple conelations of the original variableswith the new principal COmponcnlS.
strongly on the second PC (the former correlatingpositively and the latter negatively).
4. Discussion
Anaerobically determined mineralizable N is be-lieved to measure three components of the soil Npool: ammonium, microbial-N, and N contained innoomicrobial but labile SOM (Binkley and Hart,1989). Estimates of the proportion of variabilityexplained by microbial biomass range from 25 to78% (Paul et aI., 1986; Myrold, 1987). In an old-growth Douglas-fir forest on the HJ. Andrews Ex-perimental Forest, 60% of variation in available N.was explained by microbial biomass (T.E. Bell, D.D.Myrold, and D.A. Perry, unpublished data, 1990).Smith et aI. (1985) found that estimates of microbialbiomass in several forest soils correlated strongly(r2 > 0.9) with C02 evolved during anaerobic incu-bations, supporting the hypothesis that nitrogen re-leased during anaerobic incubations primarily re-flects microbial biomass (Binkley and Hart, 1989).
Since soil microbes live 00 the carbon supplied byplants, their biomass reflects both total amounts ofsoil organic matter and the rate. at which it is decom-posed and converted to microbial cells. A number offactors influence decomposition rates, including sub-
" strate quality, moisture, temperature, and the .degree-. of processing by soil animals (Witkamp and Van der
Drift, 1961; Fogel and Cromack,.1977; Melillo et 81..-1982; Paul, 1984; Meeotemeyer and Berg.. 1986;Pastor and Post, 1986). In our study, 46% of the--variation in available N was explained by total N andexchangeable Ca. We believe this pattern accurately
200 A. Velauluez Maninez. D.A Perry / Forest Ecology and Managemvu 93 (1997} 195-203
reflects soil processes on our sites, i.e. results werenot biased by inadvertent sampling of fertilizer tabs.If enough of our soil samples had contained fertilizertabs to affect the results, we should have seen signif-icant positive correlations among all nutrients con-tained within the tabs. However, we did not. Total Nand exchangeable Ca. for example, had no correla-tion with one another (r = - 0.07).ExchangeableCaand soil P correlated negatively (r= -0.59). More-over, exchangeable Ca correlated strongly with ex-changeable Mg, even though the latter was not con-tained in the tabs.
The relation between total and available N is notsurprising and has been shown by others (Powers,1980; Lea and Ballard, 1982; Radwan and Shumway,1983, 1984; McNabb et al., 1986; Miller et al.,1989). To our knowledge, a relationship betweenexchangeable Ca and available N has not been previ-ously reported; however, lime added to conifer soilsspeeds decomposition and stimulates biological ac-tivity, including the activity free-living N-flxers (Lutzand Chandler, .~947; Williams, 1972; Jones andRichards, 1977; Lohm et al., 1984; Weier andGilliam, 1986). The effect of Ca on microbialbiomass, especially when added as lime, is oftenattributed to increased pH. However, this did notappear to be the case on our study sites as pH had aweak negative correlation with both exchangeableCa (r = - 0.27,a = 0.07) and available N (r =-0.26, a = 0.08).
Ca is required in rather high amounts by somemicrobes and soil animals. For example. Ca contentin decomposer organisms ranges from 0.07 to 14%of dry weight (Swift et at., 1979), hence limitation inCa supply may in turn limit decomposer activity.Through factors such as comminution of litter andmutualistic associations with microbes, macro- andmesofauna (including Ca-demanding taxa such asearthworms and oribatid mites) enhance decomposi-tion, thereby increasing microbial biomass and otherformsof availableN (Edwardset al., 1970;Hole,.1981; Anderson et al.. 1983; Spiers et al., 1986;Lavelle et al., 1993).It is plausibleto hypothesizethat N availabilityin our stands is indirectlylimitedby exchangeableCa via the latter's effects on soilanimals. Additionally,Ca promotes granulation insoils (Lutz and Chandler, 1947).Soils rich in limeusually have better physical conditionthan soils of
the same texture but which are poor in lime, perhapsbecause of increased activity on the part of soil fauna(Lutz and Chandler, 1947). Ca also has been foundto enhance conifer root growth (Lyle and Adams,1971; Matzner et al., 1986), which should in turnincrease the biomass of rhizosphere microbes withinsoil.
The relationship ~th adjusted aspect indicateSthat available N is greater on southerly than onnortherly aspects, even though total soil N tended tobe higher on the latter. This may be related to highersoil temperatures on southerly slopes. Powers (1980)and Addiscott (1983) have reported a linear depen-dence of N mineralization on soil temperature. Mi-crobial activity increases direcdy with temperature inthe range common to forest soils (Brock. 1970).Although our incubations were all conducted at the
. same temperature, the fact that they were initiated(by flooding soils and killing all aerobes) within 3days of soil collection suggests that the results largelyreflect the biomass of aerobic organisms at the timeof collection.
The negative correlation of available N with slopesteepness may indicate water shortage. Several stud-ies have shown that N mineralization is related tosite moisture status (Stanford and Epstein, 1974;Nadelho(fer et al., 1983; Pastor et al., 1982, 1984;Plymale et al., 1987; Zak et al., 1989; Powers,1990). .
Available N on our sites is within the range ofvalues reported for coniferous forest soils (Shumwayand Atkinson, 1978; Powers, 1980; Smith et al.,1981; Boyle, 1982; Radwan and Shumway, 1983;Binkley and Reid. 1985; McNabb et al., 1986; My-rold. 1987). The differences that we found betweensoil depths are similar to those reported by Powers(1980) in forest soils of northern California. wherethe difference in avail~le N between 5-15 cm and25-35 cm depth was 46%. In our stands, the averagedifference between 0-20 cm and 20-40 cm was51%. Powers (1980),. Powers (1984) recommendedthat soil sampling for available N be confined to thetop 0-15 em.
In conttast to our results, there are various reasonsto expect that thinning would increase available N:Trees in thinned plots had significandy higher Nconcentrations in new and l-year-old foliage thantrees in unthinned plots (Velazquez Martinez et al~,
A. Velazquez Martinez. D.A. Perry / Forest Ecology and Management 93 (1997) 195-203
1992), suggesting a more readily decomposable sub-strate in the former. However. the highest foliar N .concentration in low density plots was 1.15%. andbecause of translocation, the older needles that com-pose litterfall were likely to contain 40-60% less Nthan new needles (Sollins et al.. 1980; Fife andNambiar, 1982; Powers, 1984). Therefore. needle
'litter even in low density plots would have had C:Nratios greater than 60: I, a marginal level for produc-ing mineralization. Staaf and Berg (1977) found thatN was mineralized from Scots pine needles at a C:Nratio of 67:1. The large pulse of organic matter,fromthinned trees, which occurred 6 years before ourmeasurements. added substrate with a range of C:Nratios (e.g. needles, fine roots. coarse roots. branchesand stems), some of which would have been rela-
tively labile (new needles. fine roots and mycorrhizalhyphae) and would have produced a pulse of in-creased N mineralization (Bosatta and Berendese.1984). In the 6 years since thinning, however, de-composition of higher C:N branches and coarse rootsis likely to have. proceeded sufficiently to create asink for N released from the more labile tissues.Might potential differences in available N amongdensity levels of our study have been masked bydiffering site conditions among replications? Meanvalues for available N differed little among densitytreatments. and standard errors were relatively small(Fig. I), i.e. replicates responded consistently. How-ever, high density plots had significantly lower rockcontent and higher exchangeable cations than theother density levels (Table 2). According to regres-sion, higher exchangeable Ca and lower rock content .
would increase available N, hence could have biased
our estimates of available N in high density plotsupwards. The direct effect of soil rock content can bedetermined by looking at available N on a concentra-tion basis (Fig. 1(A»; expressed in that way. highdensity plots do average slightly lower levels ofavailable N than medium and low density plots. butdifferences are not statistically significanL We con-clude that the lower average rock content in highdensity plots did not significantly bias our results. Totest the effect of exchangeable calcium, we analyzedthe data after deleting the high range of calciumvalues, which involved dropping eight high densitysubplots, two medium density, and one low density.producing a data set in which exchangeable Ca did
201
not differ among density levels. Available N did notdiffer among density levels in the reduced data set,which is consistent with what we saw in the full dataseL Therefore. we conclude that our. inability toshow a difference in available N among densitylevels was not an artifact of differing levels ofexchangeable Ca. (Note: we cannot rule out thepossibility that lower. rock content and higher ex-changeable Ca in high density plots were an effect ofdensity, rather than an underlying site effect indepen-dent of density.) .
Collinearity analysis. as well as simple pairwisecorrelation coefficients. showed the independentvariables in our regression equation-total soil N.exchangeable Ca, aspect, slope. and rock content-were not correlated among themselves. hence theycomprise an orthogonal set defining a complex mo-saic of available N across the low and mid-elevation
landscape of the HJ. Andrews Experi~ental ForeSLLeaf area and aboveground biomass growth on theplots of this study correlate positively with availableN, especially in moderate and high density plots(Velazquez Martinez. 1990; Velazquez Martinez andPerry, 1997). which also varies in a mosaic acrossthe landscape. For these forest types, and probablymost others as well, improved knowledge of land-scape patterns in nitrogen availability will contributeto a better understanding of spatial variation in pri-mary productivity.
References
Addiscott, T.M.. 1983. Kinetics and temperatute relationships ofmineralization and nitrification in Rothamsted soils with dif-ferent stories. J. Soil Scl. 34: 343-353.
Anderson. J.M.. lneson. P. and Huish. S.A.. 1983. Nitrogen andcation mobi1izalionby soil fauna feeding on leaf litter and soilorganic matter from deciduous woodlands. Soil BioI. Biochem..15: 463-467.
Bierlmaier, F.A.and McKee. A~ 1989. Climatic summaries anddocumentation for the primary meteorological station. HJ.ADcRws Experimental Forest, 1972 to 1984. Gen. Tec:h.Rep.;PNW-GTR-242, Pacific NW Resean:h Station, USDA Forest'
Service. 56 pp.BiDkley, D. and Hart. S.C~ 1989. The components of nitrogeD
availability 8SlCSSmettts.L Forest soils. Adv. Soil Sel. 10:'.$7-112.
Binkley, D. and Reid. P.. 1985. Long-tenn increase of nitrogenavailability, from fertilization of Douglas-fll'. Can. J. For. Res..15: 723-724.
.'
202
--
A. Velazquez Maninez. D.A. Perry / Forest Ecology and Managemem 93 (1997J 195-203
Binkley. D.. Aber. J.. Pastor. J. and Nadelhoffer.K.. 1986.Nitrogen availability in some Wisconsin forests: comparisonsof resin bags and on-site incubations. BioI. Fertil. Soils. 2:77-82.
Bosaua. E. and Berendese. F.. 1984. Energy or nutrient regulationof decomposition: implications for the mineralization immobi-lization response to perturbations. Soil BioI. Biochem.. 16:63-67.
Boyle. J.R.. 1982. Mineralizable nitrogen: variability in the Ore-gon Coast Range soils. Agron. Abstr. 1982. p. 261.
Bremner. J.M. and Mulvaney. C.S.. 1982. Nitrogen-Total. In:A.L. Page (Ed.). Methods of Soil Analysis. Part 2. Chemicaland Microbiological Propenies. Agronomy Series Number 9(Part 2). American Society of Agronomy. Inc.. Soil ScienceSociety of America. Inc. Madison. Wisconsin. USA. pp. 595-624.
Brock. T.D.. 1970. Biology of Microorganisms. Prentice Hall.Englewood aiffs. NJ.
Brown. R.B. and Parson. R.B.. 1973. Soils of the reference stands.
Oregon IBP. Coniferous Biome Intern. Rep. 128. University ofWashington. Seattle. WA. 76 pp.
Dyrness. C.T.. Franldin. J.F. and Moir. W.H.. 1974. A preliminaryclassification of forest communities in the central ponion ofthe western cascades in Oregon. Bull. No.4. ConiferousForest Biome Ecosystem' Analysis Studies. US/lot. BioI. Pr0-gram. University of Washington. Seattle. WA. 123 pp.
Edwards. C.A.. Reichle. D.E. and Crossley. Jr.. D.A., 1970. Therole of soil invenebrates in turnover of organic matter andnutrients. In: D.E. Reichle (Editor). Temperate Forest Ecosys-tems. Springer. New York. pp. 147-172.
Fife. D.N. and Nambiar. E.K.S.. 1982. Accumulation and re-
translocation of mineral nutrients in developing needles inrelation to seasonal growth of young radiata pine trees. Ann.BOL.50: 817-829.
Fogel. R. and Cromack. Jr.. K.. 1977. Effect of habitat andsubstrate quality on Douglas-fir litter decomposition in west-ern Oregon. Can. J. Bot.. 55: 1632-1640.
Franklin. J.F. and Dyrness. C.T.. 1973. Natural vegetation ofOregon and Washington. Gen. Tech. Rep. PNW-8. PacificNW Forestry and Range Experiment Station. Ponland. OR.USDA Forest Service. 417 pp.
Han. S.C. and Binkley. D.. 1985. Correlation among indices offorest soil nutrient availability in fertilized and unfenilizedloblolly pine plantations. Plant Soil. 85: 11-21.
Hole. F.D.. 1981. Effects of animals on soil. Geodenna. 25:75-112.
Jenny. H.. 1941. Factors of Soil Formation. McGraw-HilL NewYork.
Johnson. D.W.. Cole. D.W.. Bledsoe. C.S.. Cromack. Jr.. K..Edmomds. R.L.. Gessel. S.P.. Grier. c.c.. Ri~ B.N. andVOgl. K.A.. 1982. Nutrient cycling of forest of the PacificNonhwesL In: R.L. Edmonds (Editor). Analysis of ConiferousForest Ecosystems in the Western United States. US/IBPSynthesis Series 14. pp. 186-232. .
Jones. J.M. and Richards. B.N.. 1977. Effect of reforestation onturnover of 15N_labcllednitrate and ammonium in relation to
changes in soil microflora. Soil Bioi. Biochem., 9: 383-392.
Kabzcms. R.D. and Klinka. K.. 1987. Initial quantitative charac-terization of soil nutrient regimes. n. Relationships amongsoils. vegetation. and site index. Can. J. For. Res.. 17: 1565-1571.
Keeney. D.R.. 1980. Prediction of soil nitrogen availability inforest ecosystems: a literatUrereview. For. ScL 26: 159-171.
Knudsen. D.; Peterson. G.A. and Pratt. P.F.. 1982. Lithium.
sodium. and potassium. In: A.J- Page (Ed.). Methods of SoilAnalysis. Part 2. Chemical imd Microbiological. Propenies.Agronomy Series Number 9 (Part 2). American Society ofAgronomy. Inc.. Soil Science Society of America. Inc. Madi-son. Wisconsin. USA. pp. 225-246.
Lanyon. L.E. and Heald. W.R.. 1982. Magnesium. calcium. stron-tium and barium. In: A.L. Page. R.H. Miller and D.R. Keeney(Editors). Methods of Soil Analysis. Part 2. American Societyof Agronomy. Madison. WI. pp. 247-274.
Lavelle. P.. Blanchan. E.. Martin. A., Martin. S.. Spain. A..Totain. F.. Barois. I. and Schaefer. R.. 1993. A hierarchial
model for decomposition in terrestrial ecosystems: applicationto soils of the humid tropics. Biotropica. 25: 130-150.
Lea. R. and Ballard. R.. 1982. Predicting loblolly pine growthfrom N fertilizer. using soil N availability indices. Soil Sci.Soc. Am. J.. 46: 1096-1099.
Lohm. U.. Larsson. K. and Nommik. H.. 1984. Acidification andliming of coniferous forest soil: long-term effects on turnoverrates of carbon and nitrogen during an incubation experimenLSoil BioI. Biochem.; 16: 343-346.
Lutz. H.J. and Chandler. Jr.. R.F.. 1947. Forest Soils. John Wiley.
New York. 514 pp.Lyle. Jr.. E.S. and Adams. F.. 1971. Effect of available soil
calcium on taproot elongation of Loblolly pine (Pinus taeda)seedlings. Soil Sel Soc. Am. Proc.. 35: 800-805.
Matzner. E.. Murach. D. and Fonmann. H.. 1986. Soil acidity andits relationship to root growth in declining forest stands inGermany. Water. Air. Soil PolluL. 31: 273-282.
McNabb. D.H.. Cromack. Jr.. K. and Fredricksen. R.L.. 1986.Variability of nitrogen and carbon in surface soils of six foresttypes in the Oregon Cascades. Soil Sci. Soc. Am. J.. 50:1037-1041.
Meentemeyer. V. and Berg. B.. 1986. Regional variation in nite ofmass loss of Pinis syllJestris needle litter in Swedish pineforests as influenced by climate and litter quality. Scand. J.For. Res.. 1: 167-180.
Melillo. J.M.. Aber. J.D. and Muratore. J.F:. 1982. Nitrogen and
lignin control of hardwood leaf litter decomposition dynamics.Ecology. 63: 621-626.
Miller. R.E.. McNabb. DR and Hazard. J.. 1989. Predicting
Douglas-fJl' growth and response to nitrogen fertilization inWestern Oregon. Soil ScL Soc. Am. J.. 53: 1552-1560.
Myrold. D.D.. 1987. Relationship between microbial biomassnitrogen and a nitrogen availability index. Soil Sci. SOc. Am.J.. 1047-1049.
Nadclhoffer. KJ.. AbCI'.J.D. and Melillo. J.M.. 1983. Leaf-litter
production and soil organic matter dynamics along a nitrogen-availability gradient in Southern Wisconsin (U.S.A'>. Can. J.For. Res.. 13: 12-21.
Pastor. J. and Post. W.M.. 1986. Influence of climate. soil mois-
A. VelazquezMartinez. D.A. Perry/Forest Ecology and Management 93 (1997J 195-203
ture. and succession on forest carbon and nitrogen cycles.Biogeochemistry. 2: 3-27.
Pastor. J.. Aber. J.D.. McOaugherty. C.A. and Melillo. J.M..1982. Geology. soils and vegetation of Blackhawk Island.Wisconsin. Am. Midi. Nat.. 108: 266-277.
Pastor. J.. Aber. J.D.. McOaugbeny. C.A. and Melillo. J.M..1984. Aboveground production and N and P cycling along a Nmineralization gradient on Blackhawk Island. Wisconsin.Ecology. 65: 265-268.
Paul. E.A.. 1984. Dynamics of organic matter in soils. Plant Soil.76: 275-285.
Paul. E.A.. Smith. J.L and NortoD.J.M.. 1986. The decomposi-tion of I.N_ and I~N-Iabelled cells in soil under anaerobic
conditions. Agron. Abstr. 1986. p. 186.Plymale. A.E.. Boerner. R.E.J. and Logan. TJ.. 1987. Relative
nitrogen mineralization and nittification in soils of two con-trasting hardwood forests: effects of site microciimate andinitial soil chemistry. For. Ecol Manage.. 21: 21-36.
Powers. R.F.. 1980. Mineralizable nitrogen as an index of nitro-gen availability to forest trees. Soil Sci. Soc. Am. 1.. 44:1314-1320.
Powers. R.F.. 1984. Estimating soil nitrogen availability throughsoil and foliar analysis. In: E.L Stone (Editor). Forest Soilsand Treatment Impacts. Proc. 6th Nonh American Forest SoilsConference. The University of Tennesse. Knoxville. pp. 353-379.
Powers. R.F.. 1990. Nitrogen mineralization along an altitudinalgradient: interactions of soil temperature. moisture. and sub-strate quality. For. Ecol. Manage.. 30: 19-29.
Radwan. M.A. and Shumway. J.s.. 1983. Soil nitrogen. sulfur.and phosphorus in relation to groWth response of westernhemlock to nitrogen fertilization. For. Sci.. 29: 469-477.
Radwan. M.A. and Shumway. J.s.. 1984. Site Index and selectedsoil propenies in relation to response of Douglas-fir andwestern hemlock to nitrogen fertilizer. In: E.L Stone (Editor).Forest Soils and Treatment Impacts. Proc. 6th Nonh AmericanForest Soils Conference. The University of Tennesse.Knoxville. pp. 89-104.
Rothacher. J.. Dymess. C.T. and Fredfiksen. R.L. 1967. Hydro-logic and related characteristics of three small watersheds inthe Oregon Cascades. Mise. Pap. Pacific NW Forest andRange Experiment Station. USDA Forest Service. 54 pp.
Shumway. 1.S. and Atkinson. W.A.. 1978. Predicting nitrogenfertilizer response in unthinJled stands of Douglas-fir. Com-mun. Soil Sci. Plant Anal.. 9: 529-539.
Smith. J.L. McNeal.. B.L. 0weDs. E.J. and Klock. G.O.. 1981.Comparison of nitrogen mineralized under anaerobic and ~bic conditiQns for some agricultural and forest soils of Wash-ington. Commun. Soil Sei. Plant Anal. 12: 997-1009.
Smith. J.L. NOrton. J. and PauL E.A.. 1985. Microbial biomassestimation. In: J.L Smith aud E.A. Paul (Editors). ProcessControls and Nitrogen Transformations in Terrestrial Ecosys-tems. Depanment of Plant and Soil Biology. University ofCalifornia. Berkeley. CA. pp.94-108.
S011i!ls.P.. Grier. C.C.. McCorison. F.M.. 1980. The internal
-- -- -
203
element cycles of an old-groWth Douglas-fir ecosystem inwestern Oregon. EcoL Monogr.. 50: 261-285.
Spiers. G.A.. GagttOn.D.. Nason. G.E.. et aI.. 1986. Effects andimponancc of indigenous eanhwonns on decomposition andnuttient cycling in coastal forest ecosystems. Can. J. For. Res..16: 983-989.
Staal.. 0. aud Berg. B.. 1977. Mobilization of plant nuttients in aScots pine forest moor in central Sweden. Silva. Fenn. 11:210-217.
Stanford. G. and Epstein. E.. 1974. Nitrogen mineralization-waterrelations in soils. Soil Sci. Soc. Am. Proc.. 38: 103-107.
Statistical Analysis Systems Institute Inc.. 1985. SAS/STATGuide for Personal Computers. Version 6. Vol. 2. SAS Insti-tute Ioc., Cary. NC. 378 pp.
Steel. R.GD. and Tonie. JlL. 1980. Principles and Procedures ofStatistics. A Biometrical Approach. 2nd edo. McGraw-Hili.New Yart. 633 pp.
Swift. MJ.S.. Heal. O.W. and Anderson. J.M.. 1979. Decomposi-tion in Terresttial Ecosystems Studies in Ecology. Vol. 5.University of California Press. Berkeley/Los Angeles. CA.372 pp.
Velazquez Martinez. A.. 1990. Interacting effects of stand density.site factors. and nuttients on productivity and productive effi-ciency of Douglas-fir plantations in the Oregon Cascades.Ph.D. Thesis. Oregon State University. 142 pp.
Velazquez Martinez. A. and Perry. D.A.. 1997. Nuttient andtopoedaphic factors influence in groWth efficiency and leafarea in Douglas-fir plantations in the central Oregon cascades.U.s.A. Terr;I. in press.
Velazquez Martinez. A.. Perry. D.A. and Bell. T.E.. 1992. Re-sponse of aboveground biomass increment. groWthefficiency.and foliar nutrients to thinning. fertilization. and pruning inyoung Douglas-fir plantations in the central Oregon Cascades.Can. For. Res.. 22: 1278-1289.
Waring. R.o.. Schroeder. P.E. and Oren. R.. 1982. Application ofthe pipe model theory to predict canopy leaf area..Can. 1. For.Res.. 12: 556-560.
Waring. S.A. and Bremner. J.M.. 1964. Ammonium production insoil under waterlogged conditions as an index of nitrogenavailability. Nature. 201: 951-952.
Warren. G.P. and Whitehead. D.C.. 1988. Available soil nitrogenin relation to fractions of soil nitrogen and other soil proper-ties. Plant Soil. 112: ISS-16S.
Weier. K.L and Gilliam. J.W.. 1986. Effect of acidity on nitrogenmineralization and nitrification in Atlantic coastal sandy soils.Soil Sci. Soc. Am. J.. 50: 1210-1214.
Williams. BL. 1972. Nitrogen mineraiization and organic tttancrdecomposition in Scots pine humus. Forestry. 45: 177-188.
Witkamp. M. and van der Drift. J.. 1961. Breakdown of forestlitlei' in relation to environmental factors. Plant Soil. IS:29S-311.
Zak. D.R.. Host. G.E. and Pregitzer. K.S.. 1989. Regional vari-ability in nitrogen mineralization. nittification. and overstorybiomass in northern lower Michigan. Can. J. For. Res.. 19:IS21-1526.