Embed Size (px)
Citation preview

Alcohol Use Data by NM County
1
Table of Contents
Content Page(s)
All Alcohol-Related Deaths
Table 1 Alcohol-related deaths by age and gender 2
Table 2 All Alcohol-related deaths by county, race, ethnicity 3-4
Chart 2 All Alcohol-related deaths county comparisons 5
Alcohol-Related Chronic Disease Deaths
Table 1 Alcohol-related chronic disease deaths by age, gender 6
Table 2 Alcohol-related chronic disease deaths by county, race, ethnicity 7-8
Chart 2 Alcohol-related chronic disease deaths county comparisons 8
Chronic Liver Disease Deaths
Table 1 Alcohol-related chronic liver disease deaths by age, gender 9
Table 2 Alcohol-related chronic liver disease deaths by county, race, ethnicity 10-11
Chart 2 Alcohol-related chronic liver disease deaths county comparisons 11
Alcohol-related Injury Deaths Table 1 Alcohol-related injury deaths by age, gender 12
Table 2 Alcohol-related injury deaths by county, race, ethnicity 13-14
Binge Drinking Table 1 Adult Binge Drinking by age, gender 15
Table 2 Adult Binge Drinking by county, race, ethnicity 16-17
Chart 2 Adult Binge Drinking county comparison 17
Table 1 Risky Teen Alcoho-Use Behaviors 18
Mental Health Table 1 Adults with 14+ days of Poor Mental Health 19
Table 1 Youth with Feelings of Sadness or Hopelessness 20

Alcohol Use Data by NM County
2
.Substance Abuse Epidemiology Profile for Alcohol: All Alcohol-Related Death
Problem Statement
The consequences of excessive alcohol use are severe in New Mexico. New Mexico's total alcohol-related
death rate has ranked 1st, 2nd, or 3rd in the U.S. since 1981; and 1st for the period 1997 through 2007 (the
most recent year for which state comparison data are available). The negative consequences of excessive
alcohol use in New Mexico are not limited to death, but also include domestic violence, crime, poverty, and
unemployment, as well as chronic liver disease, motor vehicle crash and other injuries, mental illness, and a
variety of other medical problems.
New Mexico's total alcohol-related death rate has consistently been nearly twice the national rate for the past
two decades. The alcohol-related death rate in New Mexico has increased from 1990 through 2012. By
contrast, the U.S. alcohol-related death rate has decreased.
Table 1. Alcohol-related Deaths by Age, Sex, and Race/Ethnicity, New Mexico 2008-2012
Deaths Rates*
Sex and Race/Ethnicity Ages 0-24 Ages 25-64 Ages 65+ All Ages Ages 0-24 Ages 25-64 Ages 65+ All Ages
Male, American Indian 64 512 72 649 32.1 247.4 243.4 172
Male, Asian/Pacific Islander 1 10 2 14 5.6 27 47.2 22.8
Male, Black 7 43 6 56 14.8 71.4 71 50
Male, Hispanic 169 1,229 294 1,691 16.9 105.4 152.4 80.5
Male, White 77 892 426 1,395 13.5 77.7 109.8 57.1
Male, All Races 318 2,715 805 3,838 17.3 103.6 129 75.6
Female, American Indian 24 239 48 311 12.1 104.8 112.7 74.3
Female, Asian/Pacific Islander 1 4 1 7 5.8 8.3 18.7 8.9
Female, Black 1 12 4 16 1.4 25.2 41.9 19.1
Female, Hispanic 41 385 162 587 4.2 32.4 66.9 27.2
Female, White 22 396 300 718 4.2 33.8 65 26.1
Female, All Races 89 1,040 516 1,645 5.1 38.8 67.7 30.2
Both Sexes, American Indian 88 751 120 959 22.1 172.7 166.3 120.1
Both Sexes, Asian/Pacific Islander 3 14 4 21 5.7 16.5 29.9 14.6
Both Sexes, Black 7 54 11 72 8.8 51.4 55.7 36.3
Both Sexes, Hispanic 209 1,614 455 2,279 10.6 68.6 104.9 53
Both Sexes, White 99 1,288 725 2,112 9 55.5 85.5 41.1
Both Sexes, All Races 407 3,755 1,321 5,483 11.3 70.9 95.3 52.3

Alcohol Use Data by NM County
3
Table 2. Alcohol-related Deaths by County and Race/Ethnicity, New Mexico, 2008-2012
Deaths Rates
County American Indian Asian PI Black Hispanic White All
Races
American
Indian
Asian
PI
Black Hispanic White All
Races
Bernalillo 130 11 34 749 716 1,669 109.1 14.4 36.3 53.3 42 49
Catron 1 0 0 3 6 10 305.1 0 0 103.4 38.3 55.4
Chaves 2 0 2 73 94 171 60.1 0 39 49.8 51.1 51
Cibola 57 0 0 28 19 104 114.1 0 0 61.4 46.9 76.9
Colfax 0 0 0 20 17 38 0 0 0 59.3 35.2 46.5
Curry 1 1 6 36 37 81 58.6 18.3 46.2 50 27.3 35.4
De Baca 0 0 0 1 3 4 0 0 0 19.1 56.5 40.1
Dona Ana 3 0 0 195 165 369 31.7 0 0 33.7 41.6 36.4
Eddy 1 0 1 48 73 122 28.7 0 28.7 45.1 47.1 44.9
Grant 2 1 0 45 47 95 210 206.8 0 61.9 47.5 56
Guadalupe 0 0 0 12 2 15 0 0 0 58.6 43.4 53.7
Harding 0 0 0 0 0 1 0 0 0 0 0 8.9
Hidalgo 0 0 0 10 7 17 0 0 0 72.2 54.4 63.4
Lea 0 1 7 47 65 120 0 37.6 55.4 40.6 42.3 39.7
Lincoln 2 0 0 11 31 44 47.6 0 0 39.4 34.6 34.3
Los
Alamos
0 0 0 4 23 27 0 0 0 30.8 26.7 25.8
Luna 0 0 1 28 30 59 0 0 122.2 42.5 49.7 42.8
McKinley 318 0 2 17 22 359 137 0 98.2 39.7 46.7 110.3
Mora 0 0 0 12 2 14 0 0 0 61.4 14.8 55.6
Otero 26 1 5 37 81 151 152.7 18.5 42.6 38.7 39.4 45.4
Quay 0 0 1 18 21 40 0 0 124.3 90.7 78.5 80.5
Rio Arriba 45 0 0 169 19 234 169.2 0 0 118.5 63.4 116
Roosevelt 0 0 0 9 18 27 0 0 0 31.6 29 30
Sandoval 74 2 1 81 125 286 99.6 13.8 11.8 41 33.9 43.4
San Juan 248 0 3 51 116 419 119.9 0 54.2 52.2 37.4 68.8
San Miguel 0 0 0 90 20 112 0 0 0 76.2 59.5 70.9
Santa Fe 15 1 1 238 152 410 94.7 10.9 19.1 67.5 39.7 52.8
Sierra 0 0 0 6 39 46 0 0 0 34.7 68.6 57.1
Socorro 18 0 0 28 20 67 226 0 0 65.4 50.2 76.2
Taos 5 0 0 73 35 114 51.8 0 0 75.2 43.2 61.7

Alcohol Use Data by NM County
4
Death rates from alcohol-related causes increase with age. However, there are substantial numbers of alcohol-
related deaths in the 0-24 year age category (these are mostly injury-related); and large numbers and high rates
of alcohol-related death in the 25-64 year age category (due to both chronic disease and injury).
Problem Statement (continued))
There are extremely high alcohol-related death rates among American Indians (almost twice the state rate for
both males and females); and relatively high rates among Hispanic males relative to White non-Hispanic males.
The rate disparities for American Indian males are driven by this group's relatively high rates of both alcohol-
related injury and alcohol-related chronic disease death; whereas the rate disparities for Hispanic males and
American Indian females are driven largely by their relatively high alcohol-related chronic disease death rates.
High rates among American Indian males and females drive the rates in McKinley, Cibola, and San Juan
counties; Rio Arriba has high rates among both Hispanic and American Indian males and females; deaths
among Hispanic males drive the high rates in San Miguel and Taos counties (data by gender not shown).
Table 2. Alcohol-related Deaths by County and Race/Ethnicity, New Mexico, 2008-2012
Table 2. Alcohol-related Deaths by County and Race/Ethnicity, New Mexico, 2008-2012
Deaths Rates
A American Indian Asian PI Black Hispanic White All
Races
American
Indian
Asian
PI
Black Hispanic White All
Races
Torrance 2 0 0 22 28 52 130.4 0 0 73.9 48.4 57.5
Union 1 0 0 3 4 8 568.1 0 0 30.4 25.2 32.6
Valencia 8 1 1 112 74 195 76.3 29.9 17.9 53.5 45.4 50.4
NM 959 21 72 2,279 2,112 5,483 120.1 14.6 36.3 53 41.1 52.3

Alcohol Use Data by NM County
5
Chart 2. Alcohol-related Deaths by County, New Mexico 2008-2012
Data Notes: Rates are age-adjusted to the 2000 US standard population.
Substance Abuse Epidemiology Profile for Alcohol: Alcohol-related Chronic Disease Deaths
Problem Statement
Chronic heavy drinking (defined as drinking, on average, more than two drinks per day for men, and more than
one drink per day for women) often is associated with alcoholism or alcohol dependence, and can cause or
contribute to a number of diseases, including alcoholic liver cirrhosis. For the past 15 years, New Mexico's
death rate from alcohol-related chronic disease has consistently been first or second in the nation, and 1.5 to 2
times the national rate. Furthermore, while the national death rate from alcohol-related chronic disease has
decreased, New Mexico's rate has increased.
The five leading causes of alcohol-related chronic disease death in New Mexico are: alcohol-related chronic
liver disease, alcohol dependence, hypertension, alcohol abuse, and hemorrhagic stroke. Alcohol-related chronic
liver disease is the leading cause of alcohol-related death in New Mexico, with a rate almost twice the second
leading cause (fall injuries).

Alcohol Use Data by NM County
6
Table 1. Alcohol-related Chronic Disease Deaths by Age, Sex, and Race/Ethnicity, New
Mexico 2008-2012
Deaths Rates*
Sex and Race/Ethnicity Ages 0-24 Ages 25-64 Ages 65+ All Ages Ages 0-24 Ages 25-64 Ages 65+ All Ages
Male, American Indian 4 268 46 319 2.1 129.6 156 87.8
Male, Asian/Pacific Islander 0 1 1 2 0 3.8 14.8 4.3
Male, Black 0 17 4 20 0 27.7 39.4 18.9
Male, Hispanic 3 654 210 867 0.3 56.1 109.2 42.2
Male, White 2 438 222 661 0.3 38.1 57.2 24.4
Male, All Races 10 1,392 486 1,888 0.5 53.1 77.9 35.6
Female, American Indian 1 170 33 205 0.7 74.6 78.4 49.6
Female, Asian/Pacific Islander 0 2 1 3 0 3.2 14.6 3.9
Female, Black 0 6 2 8 0 12.6 17.4 8.4
Female, Hispanic 2 208 87 298 0.2 17.5 36 13.7
Female, White 1 190 101 292 0.1 16.2 22 10.2
Female, All Races 5 577 225 806 0.3 21.5 29.5 14.5
Both Sexes, American Indian 6 438 79 523 1.4 100.8 110.3 67.3
Both Sexes, Asian/Pacific Islander 0 3 2 5 0 3.5 14.7 4.1
Both Sexes, Black 0 22 5 28 0 21.2 27.9 13.8
Both Sexes, Hispanic 6 862 297 1,165 0.3 36.6 68.5 27.3
Both Sexes, White 2 628 323 953 0.2 27.1 38.1 17
Both Sexes, All Races 14 1,968 711 2,693 0.4 37.1 51.3 24.6
Data Notes: Rates are age-adjusted to the US 2000 standard population.
Problem Statement (continued)
In general, males are more at risk than females for alcohol-related chronic disease death. Male rates are 2-3
times higher than female rates, across all racial/ethnic groups except Asian/Pacific Islanders. American Indians
are most at risk among the race/ethnic groups, with both total rates and male and female rates more than twice
the corresponding state rates. As mentioned earlier, Hispanic males are also at elevated risk.
The high rates in McKinley county are driven by unusually high rates in the American Indian population. In Rio
Arriba County the rate is driven by high rates in both the Hispanic and American Indian populations. It is worth

Alcohol Use Data by NM County
7
noting the considerable variation across counties in American Indian alcohol-related chronic disease death rates,
with substantially lower rates seen in San Juan County than in Cibola, McKinley, and Rio Arriba counties.
Table 2. Alcohol-related Chronic Disease Deaths by County and Race/Ethnicity, New Mexico, 2008-2012
Deaths Rates
County American
Indian
Asian
PI
Black Hispani
c
Whit
e
All
Races
America
n Indian
Asian PI Black Hispanic White All
Races
Bernalillo 80 2 17 379 331 821 69.5 3.2 17.4 27.6 18.6 23.6
Catron 0 0 0 2 2 3 0 ** ** 41.1 6.4 12.3
Chaves 0 0 1 33 43 77 0 0 16.8 22.8 21.6 21.8
Cibola 34 0 0 14 10 59 69.5 0 0 33.3 22.3 42.7
Colfax 0 0 0 11 8 19 0 0 0 28.4 12.9 20.2
Curry 1 0 2 20 17 40 47.6 0 14.6 28.7 12.7 17.3
De Baca 0 0 0 0 1 2 ** ** ** 0 17.5 14.1
Dona Ana 2 0 2 107 73 185 27.3 0 15 18.9 16.1 17.7
Eddy 0 0 0 21 23 45 0 0 0 19.9 14 15.3
Grant 1 1 0 25 23 50 129.1 206.8 0 32 16.7 24.6
Guadalupe 0 0 0 8 1 9 ** ** 0 33.3 23.5 30.6
Harding 0 0 0 0 0 0 ** ** ** 0 0 0
Hidalgo 0 0 0 8 4 11 ** ** 0 51.2 23.8 37.6
Lea 0 0 1 17 26 44 0 0 4.7 17.4 14.9 14.3
Lincoln 0 0 0 5 16 22 0 0 ** 19.3 13.8 13
Los Alamos 0 0 0 3 10 12 0 0 ** 17.3 10.6 11
Luna 0 0 1 17 16 35 0 ** 122.2 25.7 23.1 22.9
McKinley 169 0 0 8 8 186 75.3 ** 0 18.6 15.1 58
Mora 0 0 0 2 1 3 0 ** ** 11.7 8.1 12.1
Otero 12 0 2 21 39 75 72.7 ** 20.7 21.9 17.5 21.1
Quay 0 0 0 11 9 20 ** ** 0 49.4 29.7 36.3
Rio Arriba 32 0 0 89 8 128 120.9 0 ** 58.4 26 60.5
Roosevelt 0 0 0 3 7 10 ** ** 0 13.4 9.5 10.9
Sandoval 39 0 0 43 53 137 52.9 0 0 23 12.6 19.6
San Juan 120 0 0 27 49 198 59.9 0 0 29.3 14.7 32.1
San Miguel 0 0 0 47 13 59 0 0 0 36.9 35.3 34.7
Santa Fe 10 0 0 127 66 206 66.1 0 0 35.7 14.3 24.1
Sierra 0 0 0 2 22 24 0 ** 0 9.4 28.3 22.8
Socorro 11 0 0 15 13 39 144.1 0 0 35.2 28.7 43.5
Taos 2 0 0 39 17 57 15.9 0 0 35.5 15.6 25.9
Alcohol Use Data by NM County
8
Table 2. Alcohol-related Chronic Disease Deaths by County and Race/Ethnicity, New Mexico, 2008-2012
Deaths Rates
County American
Indian
Asian
PI
Black Hispanic White All
Races
American
Indian
Asian PI Black Hispanic White All
Races
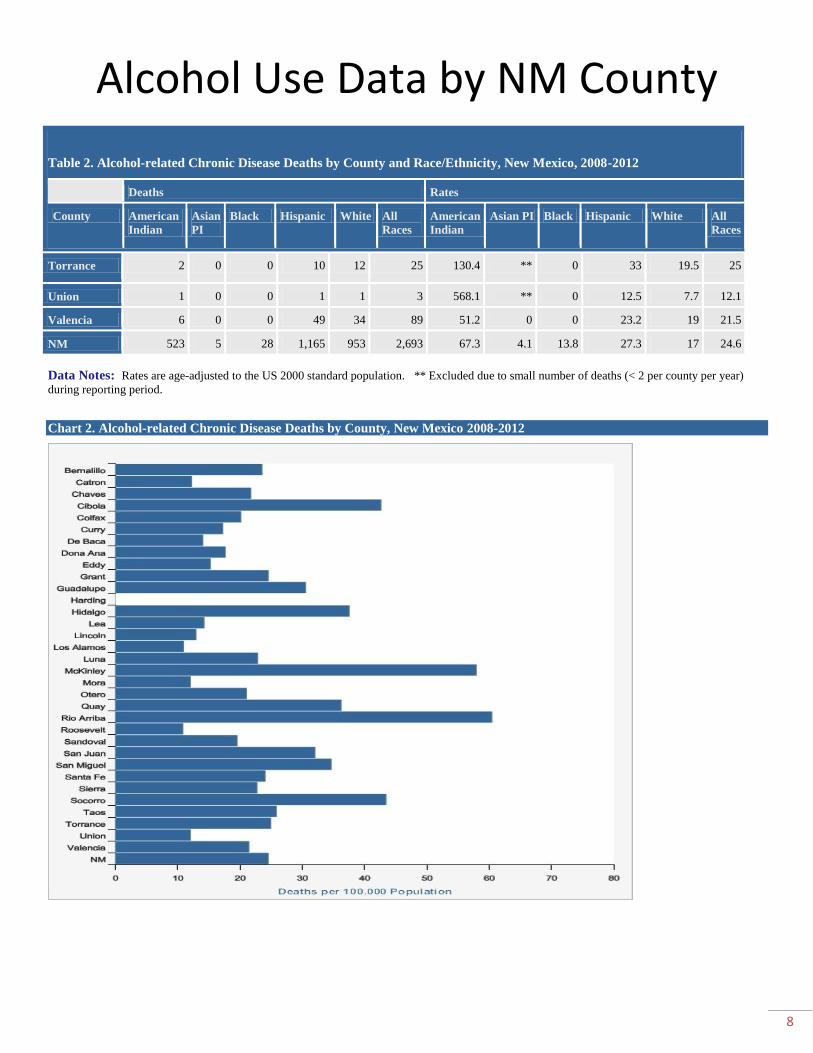
Torrance 2 0 0 10 12 25 130.4 ** 0 33 19.5 25
Union 1 0 0 1 1 3 568.1 ** 0 12.5 7.7 12.1
Valencia 6 0 0 49 34 89 51.2 0 0 23.2 19 21.5
NM 523 5 28 1,165 953 2,693 67.3 4.1 13.8 27.3 17 24.6
Data Notes: Rates are age-adjusted to the US 2000 standard population. ** Excluded due to small number of deaths (< 2 per county per year)
during reporting period.
Chart 2. Alcohol-related Chronic Disease Deaths by County, New Mexico 2008-2012

Alcohol Use Data by NM County
9
Substance Abuse Epidemiology Profile for Alcohol: Alcohol-Related Chronic Liver Disease Deaths
Problem Statement
Alcohol-related chronic liver disease (AR-CLD) imposes a heavy burden of morbidity and mortality in New
Mexico, and is the principal driver of New Mexico's consistently high alcohol-related chronic disease death
rate. Over the past 30 years, New Mexico's AR-CLD rate has trended upward, while the national rate has
decreased 20%. New Mexico has had the highest AR-CLD death rate in the U.S. for most of this period,
including every year from 1999 through 2007 (the most recent year for which state comparison data is
available). In 1993, AR-CLD surpassed alcohol-related motor vehicle crash death as the leading cause of
alcohol-related death in New Mexico. Since 1997, New Mexico's death rate from AR-CLD has consistently
been substantially higher than the death rate from alcohol-related motor vehicle crashes.
Table 1. Alcohol-related CLD Deaths by Age, Sex, and Race/Ethnicity, New Mexico 2008-2012
Deaths Rates*
Sex and Race/Ethnicity Ages 0-24 Ages 25-64 Ages 65+ All Ages Ages 0-24 Ages 25-64 Ages 65+ All Ages
Male, American Indian 2 166 27 195 1 80.3 89.9 53
Male, Asian/Pacific Islander 0 0 0 0 0 0 0 0
Male, Black 0 5 2 7 0 8.3 22.2 7.1
Male, Hispanic 0 454 124 578 0 38.9 64.2 27.4
Male, White 1 243 94 337 0.2 21.1 24.2 12.3
Male, All Races 3 875 246 1,124 0.2 33.4 39.5 20.9
Female, American Indian 1 128 27 156 0.7 56.3 63.1 38.2
Female, Asian/Pacific Islander 0 0 1 1 0 0 10.2 1.6
Female, Black 0 4 0 4 0 9.2 0 4.6
Female, Hispanic 0 167 62 230 0 14.1 25.7 10.6
Female, White 0 120 50 170 0 10.3 10.8 6
Female, All Races 2 422 140 563 0.1 15.7 18.3 10.2
Both Sexes, American Indian 3 294 53 351 0.9 67.7 74.1 45.2
Both Sexes, Asian/Pacific Islander 0 1 1 2 0 0.9 6.2 1.3
Both Sexes, Black 0 9 2 11 0 8.7 10.6 5.7
Both Sexes, Hispanic 0 621 186 808 0 26.4 42.8 18.6
Both Sexes, White 1 363 143 507 0.1 15.7 16.9 9
Both Sexes, All Races 5 1,296 386 1,687 0.1 24.5 27.8 15.4

Alcohol Use Data by NM County
10
Problem Statement (continued)
More than 75% of AR-CLD deaths occur before age 65.
AI/AN in Socorro and Rio Arriba, Hispanics in Rio Arriba and Quay, and Whites in Luna and Cibola present
the highest rates.
Table 2. Alcohol-related CLD Deaths by County and Race/Ethnicity, New Mexico 2008-2012
Deaths Rates
County America
n Indian
Asia
n PI
Black Hispanic White All
Races
America
n Indian
Asian
PI
Black Hispanic White All Races
Bernalillo 47 0 5 269 188 515 41.5 0 5.6 19.3 10.6 14.8
Catron 0 0 0 1 0 1 0 0 0 39 0 7.1
Chaves 0 0 1 26 22 50 0 0 15.4 17.8 12.2 14.3
Cibola 24 0 0 10 6 40 48.4 0 0 23.5 13.1 29.2
Colfax 0 0 0 9 4 13 0 0 0 22 8.2 13.9
Curry 1 0 1 12 10 23 47.6 0 5.4 17.2 7 10
De Baca 0 0 0 0 0 0 0 0 0 0 0 0
Dona Ana 1 0 1 79 33 114 13.2 0 5.9 13.8 8.1 11.1
Eddy 0 0 0 18 11 29 0 0 0 17 6.8 9.8
Grant 0 0 0 15 16 31 0 0 0 19.4 11.7 15.2
Guadalupe 0 0 0 5 0 6 0 0 0 22.7 0 19.4
Harding 0 0 0 0 0 0 0 0 0 0 0 0
Hidalgo 0 0 0 6 2 9 0 0 0 42.1 17.3 29
Lea 0 0 0 11 16 27 0 0 0 10.1 9.3 8.9
Lincoln 0 0 0 2 11 14 0 0 0 5.5 9.4 8.1
Los Alamos 0 0 0 1 5 7 0 0 0 9.3 6 6.2
Luna 0 0 1 10 8 20 0 0 120.7 14.1 13.4 13.5
McKinley 119 0 0 6 4 129 53.1 0 0 13 8.6 40.4
Mora 0 0 0 2 1 3 0 0 0 9.6 6.3 9.9
Otero 9 0 1 17 18 45 54.4 0 10.8 16.7 7.4 12.2
Quay 0 0 0 7 4 11 0 0 0 34.5 7.9 18.5
Rio Arriba 21 0 0 61 6 89 83.1 0 0 39.8 20 41.5
Roosevelt 0 0 0 3 4 7 0 0 0 11.7 5.6 7.4
Sandoval 29 0 0 31 25 85 39.2 0 0 16.2 5.5 12.1

Alcohol Use Data by NM County
11
Table 2. Alcohol-related CLD Deaths by County and Race/Ethnicity, New Mexico 2008-2012
Deaths Rates
County American
Indian
Asian
PI
Black Hispanic White All
Races
American
Indian
Asian
PI
Black Hispanic White All Races
San Juan 74 0 0 20 25 120 36.2 0 0 21.3 7.4 19.2
San Miguel 0 0 0 32 4 36 0 0 0 24.7 11 20.6
Santa Fe 9 0 0 79 34 124 55.5 0 0 21.8 6.7 14.2
Sierra 0 0 0 1 9 10 0 0 0 3.7 10.7 8.5
Socorro 10 0 0 11 6 27 126.9 0 0 25.1 15 31
Taos 2 0 0 25 11 39 15.6 0 0 23.5 10.7 17.8
Torrance 0 0 0 4 5 9 0 0 0 12 6 7.5
Union 1 0 0 0 1 2 568.1 0 0 0 6.8 7.8
Valencia 4 0 0 33 17 55 37.8 0 0 15.8 9.6 13.2
NM 351 2 11 808 507 1,687 45.2 1.3 5.7 18.6 9 15.4
Data Notes: Rates are age-adjusted to the US 2000 standard population. All rates are per 100,000, age-adjusted to the 2000 US standard
population
Chart 2. Alcohol-related CLD Deaths by County, New Mexico 2008-2012
Alcohol Use Data by NM County
12
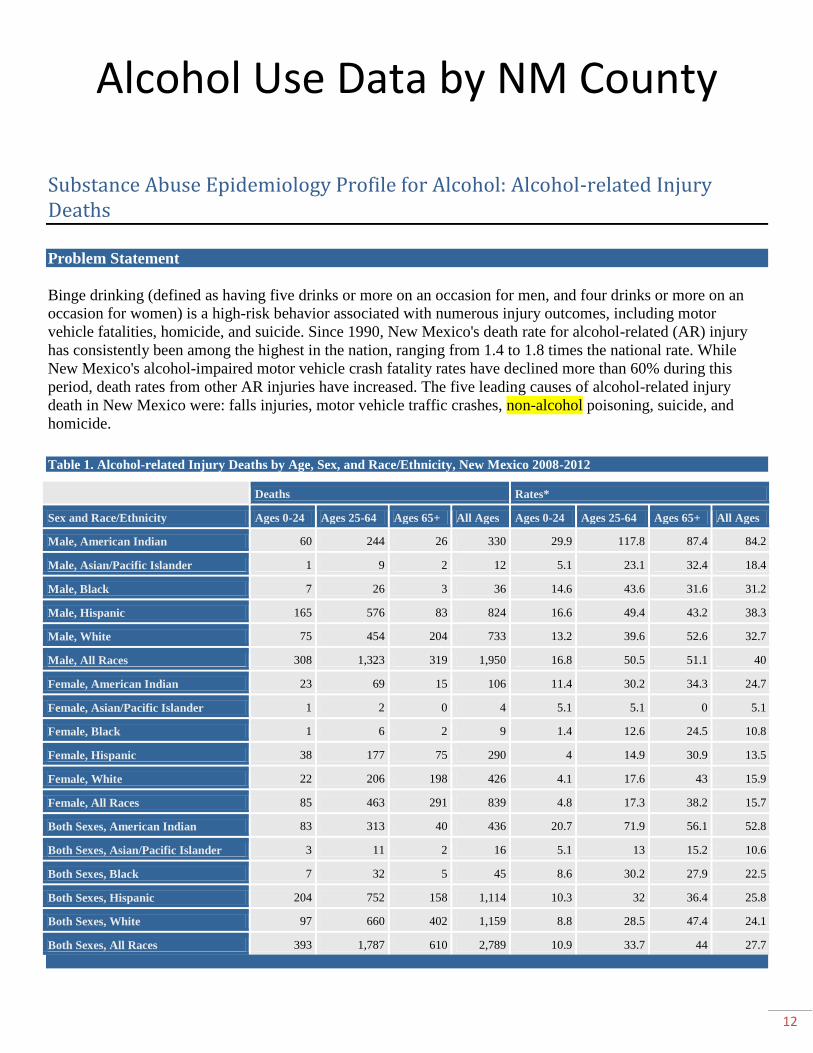
Substance Abuse Epidemiology Profile for Alcohol: Alcohol-related Injury Deaths
Problem Statement
Binge drinking (defined as having five drinks or more on an occasion for men, and four drinks or more on an
occasion for women) is a high-risk behavior associated with numerous injury outcomes, including motor
vehicle fatalities, homicide, and suicide. Since 1990, New Mexico's death rate for alcohol-related (AR) injury
has consistently been among the highest in the nation, ranging from 1.4 to 1.8 times the national rate. While
New Mexico's alcohol-impaired motor vehicle crash fatality rates have declined more than 60% during this
period, death rates from other AR injuries have increased. The five leading causes of alcohol-related injury
death in New Mexico were: falls injuries, motor vehicle traffic crashes, non-alcohol poisoning, suicide, and
homicide.
Table 1. Alcohol-related Injury Deaths by Age, Sex, and Race/Ethnicity, New Mexico 2008-2012
Deaths Rates*
Sex and Race/Ethnicity Ages 0-24 Ages 25-64 Ages 65+ All Ages Ages 0-24 Ages 25-64 Ages 65+ All Ages
Male, American Indian 60 244 26 330 29.9 117.8 87.4 84.2
Male, Asian/Pacific Islander 1 9 2 12 5.1 23.1 32.4 18.4
Male, Black 7 26 3 36 14.6 43.6 31.6 31.2
Male, Hispanic 165 576 83 824 16.6 49.4 43.2 38.3
Male, White 75 454 204 733 13.2 39.6 52.6 32.7
Male, All Races 308 1,323 319 1,950 16.8 50.5 51.1 40
Female, American Indian 23 69 15 106 11.4 30.2 34.3 24.7
Female, Asian/Pacific Islander 1 2 0 4 5.1 5.1 0 5.1
Female, Black 1 6 2 9 1.4 12.6 24.5 10.8
Female, Hispanic 38 177 75 290 4 14.9 30.9 13.5
Female, White 22 206 198 426 4.1 17.6 43 15.9
Female, All Races 85 463 291 839 4.8 17.3 38.2 15.7
Both Sexes, American Indian 83 313 40 436 20.7 71.9 56.1 52.8
Both Sexes, Asian/Pacific Islander 3 11 2 16 5.1 13 15.2 10.6
Both Sexes, Black 7 32 5 45 8.6 30.2 27.9 22.5
Both Sexes, Hispanic 204 752 158 1,114 10.3 32 36.4 25.8
Both Sexes, White 97 660 402 1,159 8.8 28.5 47.4 24.1
Both Sexes, All Races 393 1,787 610 2,789 10.9 33.7 44 27.7
Alcohol Use Data by NM County
13
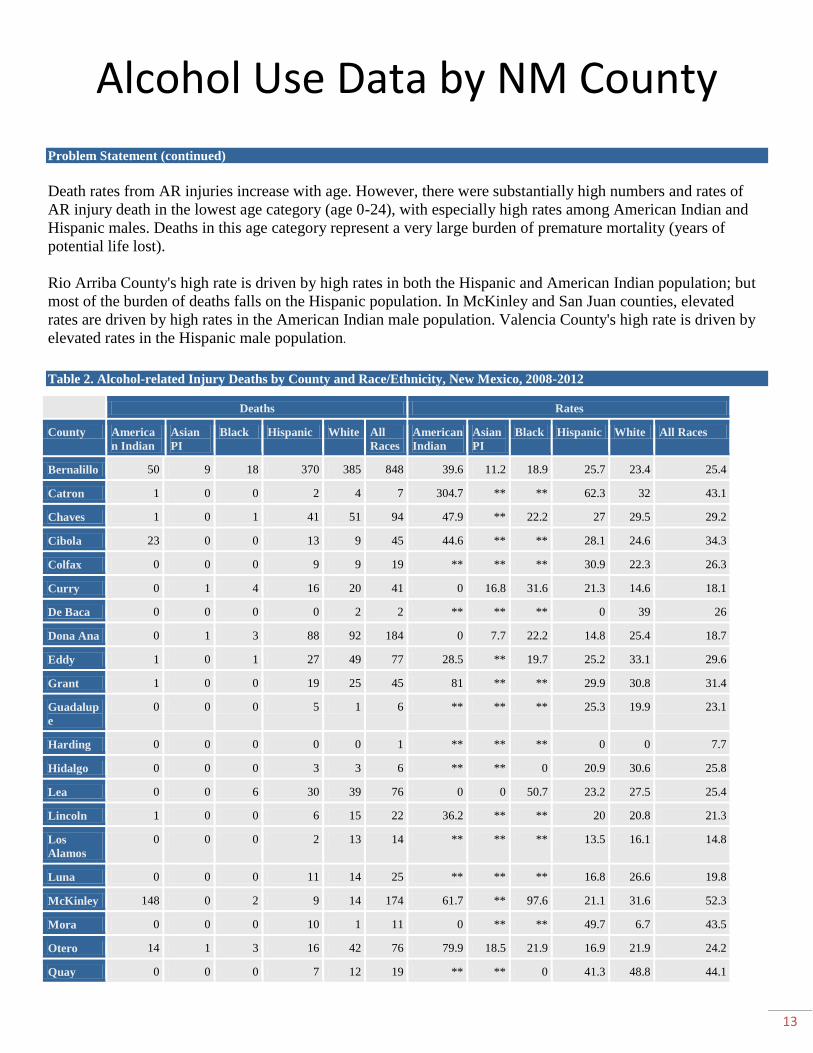
Problem Statement (continued)
Death rates from AR injuries increase with age. However, there were substantially high numbers and rates of
AR injury death in the lowest age category (age 0-24), with especially high rates among American Indian and
Hispanic males. Deaths in this age category represent a very large burden of premature mortality (years of
potential life lost).
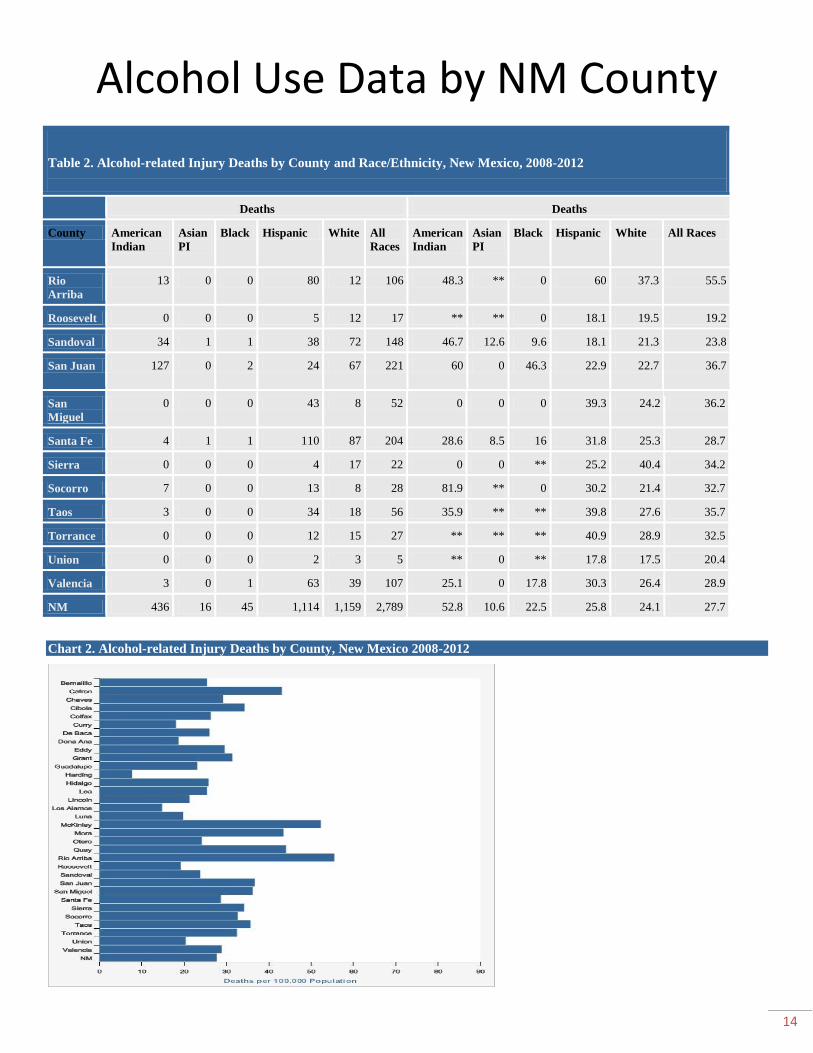
Rio Arriba County's high rate is driven by high rates in both the Hispanic and American Indian population; but
most of the burden of deaths falls on the Hispanic population. In McKinley and San Juan counties, elevated
rates are driven by high rates in the American Indian male population. Valencia County's high rate is driven by
elevated rates in the Hispanic male population.
Table 2. Alcohol-related Injury Deaths by County and Race/Ethnicity, New Mexico, 2008-2012
Deaths Rates
County America
n Indian
Asian
PI
Black Hispanic White All
Races
American
Indian
Asian
PI
Black Hispanic White All Races
Bernalillo 50 9 18 370 385 848 39.6 11.2 18.9 25.7 23.4 25.4
Catron 1 0 0 2 4 7 304.7 ** ** 62.3 32 43.1
Chaves 1 0 1 41 51 94 47.9 ** 22.2 27 29.5 29.2
Cibola 23 0 0 13 9 45 44.6 ** ** 28.1 24.6 34.3
Colfax 0 0 0 9 9 19 ** ** ** 30.9 22.3 26.3
Curry 0 1 4 16 20 41 0 16.8 31.6 21.3 14.6 18.1
De Baca 0 0 0 0 2 2 ** ** ** 0 39 26
Dona Ana 0 1 3 88 92 184 0 7.7 22.2 14.8 25.4 18.7
Eddy 1 0 1 27 49 77 28.5 ** 19.7 25.2 33.1 29.6
Grant 1 0 0 19 25 45 81 ** ** 29.9 30.8 31.4
Guadalup
e
0 0 0 5 1 6 ** ** ** 25.3 19.9 23.1
Harding 0 0 0 0 0 1 ** ** ** 0 0 7.7
Hidalgo 0 0 0 3 3 6 ** ** 0 20.9 30.6 25.8
Lea 0 0 6 30 39 76 0 0 50.7 23.2 27.5 25.4
Lincoln 1 0 0 6 15 22 36.2 ** ** 20 20.8 21.3
Los
Alamos
0 0 0 2 13 14 ** ** ** 13.5 16.1 14.8
Luna 0 0 0 11 14 25 ** ** ** 16.8 26.6 19.8
McKinley 148 0 2 9 14 174 61.7 ** 97.6 21.1 31.6 52.3
Mora 0 0 0 10 1 11 0 ** ** 49.7 6.7 43.5
Otero 14 1 3 16 42 76 79.9 18.5 21.9 16.9 21.9 24.2
Quay 0 0 0 7 12 19 ** ** 0 41.3 48.8 44.1
Alcohol Use Data by NM County
14
Table 2. Alcohol-related Injury Deaths by County and Race/Ethnicity, New Mexico, 2008-2012
Deaths Deaths
County American
Indian
Asian
PI
Black Hispanic White All
Races
American
Indian
Asian
PI
Black Hispanic White All Races
Rio
Arriba
13 0 0 80 12 106 48.3 ** 0 60 37.3 55.5
Roosevelt 0 0 0 5 12 17 ** ** 0 18.1 19.5 19.2
Sandoval 34 1 1 38 72 148 46.7 12.6 9.6 18.1 21.3 23.8
San Juan 127 0 2 24 67 221 60 0 46.3 22.9 22.7 36.7
San
Miguel
0 0 0 43 8 52 0 0 0 39.3 24.2 36.2
Santa Fe 4 1 1 110 87 204 28.6 8.5 16 31.8 25.3 28.7
Sierra 0 0 0 4 17 22 0 0 ** 25.2 40.4 34.2
Socorro 7 0 0 13 8 28 81.9 ** 0 30.2 21.4 32.7
Taos 3 0 0 34 18 56 35.9 ** ** 39.8 27.6 35.7
Torrance 0 0 0 12 15 27 ** ** ** 40.9 28.9 32.5
Union 0 0 0 2 3 5 ** 0 ** 17.8 17.5 20.4
Valencia 3 0 1 63 39 107 25.1 0 17.8 30.3 26.4 28.9
NM 436 16 45 1,114 1,159 2,789 52.8 10.6 22.5 25.8 24.1 27.7
Chart 2. Alcohol-related Injury Deaths by County, New Mexico 2008-2012

Alcohol Use Data by NM County
15
Substance Abuse Epidemiology Profile for Alcohol: Adult Binge Drinking
Problem Statement
According to the latest estimates from the Centers for Disease Control and Prevention, about 47% of homicides,
32% of falls injury deaths, 29% of drug overdose deaths, and 23% of suicide deaths are alcohol attributable.
Likewise, alcohol consumption is the primary causal factor in roughly 45% of motor vehicle crash deaths
among males aged 20-44, and in more than a third of motor vehicle crash deaths among females aged 20-44.
Binge drinking is also associated with a wide range of other social problems, including domestic and sexual
violence, crime, and risky sexual behavior.
Table 1. Binge Drinking (past 30 days), Adults Aged 18+ by Age, Sex, and Race/Ethnicity, New Mexico 2012
Unweighted Survey Counts Percentages*
Sex and Race/Ethnicity Ages 0-24 Ages 25-64 Ages 65+ All Ages Ages 0-24 Ages 25-64 Ages 65+ All Ages
Male, American Indian 0 8,465 0 11,001 ** 19.5 ** 19.5
Male, Asian/Pacific Islander 0 0 0 0 ** ** ** **
Male, Black 0 0 0 0 ** ** ** **
Male, Hispanic 20,523 57,964 3,846 82,333 40.1 26.9 10.3 27
Male, White 7,852 37,589 3,207 48,649 22.5 17.4 3.9 14.7
Male, All Races 32,143 107,963 7,304 147,410 31.4 21.9 5.8 20.4
Female, American Indian 0 2,338 0 4,654 ** 5.1 0 7.3
Female, Asian/Pacific Islander 0 0 0 0 ** ** ** **
Female, Black 0 0 0 1,309 ** ** ** 11.8
Female, Hispanic 7,717 23,225 369 31,311 13.9 10.1 0.8 9.4
Female, White 6,477 24,500 1,908 32,885 22.8 11.1 2 9.5
Female, All Races 16,928 52,330 2,277 71,535 17.3 10.2 1.4 9.3
Both Sexes, American Indian 4,645 10,803 208 15,656 20.9 12.2 2.2 13
Both Sexes, Asian/Pacific Islander 0 1,652 0 2,958 ** 15.5 ** 18.4
Both Sexes, Black 0 2,153 0 2,704 ** 15.4 ** 12.9
Both Sexes, Hispanic 28,241 81,189 4,214 113,644 26.5 18.2 4.9 17.8
Both Sexes, White 14,329 62,089 5,116 81,534 22.6 14.2 2.9 12
Both Sexes, All Races 49,072 160,294 9,581 218,946 24.5 15.9 3.4 14.7
Data Notes: **Excluded due to small number of respondents (< 50) in population
Problem Statement (continued)
Binge drinking rates decrease with age and are higher among males.

Alcohol Use Data by NM County
16
Table 2. Binge Drinking (past 30 days), Adults Aged 18+ by County and Race/Ethnicity, New Mexico, 2012
Un-weighted Survey Counts Percentages
County American
Indian
Asian
PI
Black Hispanic White All
Races
American
Indian
Asian
PI
Black Hispanic White All
Races
Bernalillo 2,996 0 1,400 35,389 26,061 68,662 15.6 ** 10.3 16.7 11.7 14.2
Catron 0 0 0 0 0 0 ** ** ** ** ** **
Chaves 0 0 0 4,211 2,676 7,804 ** ** ** 19.5 13.6 17.6
Cibola 0 0 0 656 264 1,836 ** ** ** 9 4.4 9
Colfax 0 0 0 0 0 454 ** ** ** ** ** 5.1
Curry 0 0 0 2,373 2,201 4,649 ** ** ** 18.9 14.3 16
De Baca 0 0 0 0 0 0 ** ** ** ** ** **
Dona Ana 0 0 0 23,204 5,824 29,927 ** ** ** 25.1 12.7 20.8
Eddy 0 0 0 3,651 2,559 6,211 ** ** ** 24 10.6 15.2
Grant 0 0 0 1,491 3,527 5,770 ** ** ** 12.9 25.7 21.8
Guadalupe 0 0 0 0 0 0 ** ** ** ** ** **
Harding 0 0 0 0 0 0 ** ** ** ** ** **
Hidalgo 0 0 0 0 0 0 ** ** ** ** ** **
Lea 0 0 0 4,147 3,364 7,512 ** ** ** 19.5 14.6 16.4
Lincoln 0 0 0 0 1,270 3,298 ** ** ** ** 11.9 19.9
Los
Alamos
0 0 0 0 1,459 2,530 ** ** ** ** 10.1 13.3
Luna 0 0 0 0 0 1,529 ** ** ** ** ** 10
McKinley 6,463 0 0 1,032 553 8,048 17.4 ** ** 19.2 10.8 16.8
Mora 0 0 0 0 0 0 ** ** ** ** ** **
Otero 0 0 0 0 2,657 5,973 ** ** ** ** 10.3 14
Quay 0 0 0 0 512 512 ** ** ** ** 7.6 6.1
Rio Arriba 0 0 0 2,248 0 2,687 ** ** ** 9.8 ** 8.3
Roosevelt 0 0 0 0 925 1,737 ** ** ** ** 12.6 14.4
Sandoval 0 0 0 5,650 4,268 11,474 ** ** ** 22.7 9.3 13.4
San Juan 2,343 0 0 3,114 4,649 10,219 8.4 ** ** 17 11.5 11.5
San Miguel 0 0 0 2,290 0 3,836 ** ** ** 16.8 ** 19.1
Santa Fe 0 0 0 7,651 5,671 13,714 ** ** ** 14.8 11.9 13.1
Sierra 0 0 0 0 1,012 1,012 ** ** ** ** 10.5 8.4
Socorro 0 0 0 0 0 1,298 ** ** ** ** ** 10.4
Taos 0 0 0 534 905 1,664 ** ** ** 7 9.9 8.8
Torrance 0 0 0 0 1,781 3,017 ** ** ** ** 14.7 16
Union 0 0 0 0 0 0 ** ** ** ** ** **

Alcohol Use Data by NM County
17
Valencia 0 0 0 4,442 1,895 6,465 ** ** ** 13 8.7 11
NM 15,656 2,958 2,704 113,644 81,534 218,946 13 18.4 12.9 17.8 12 14.7
Chart 2. Binge Drinking (past 30 days), Adults Aged 18+ by County, New Mexico 2012
Alcohol Use Data by NM County
18
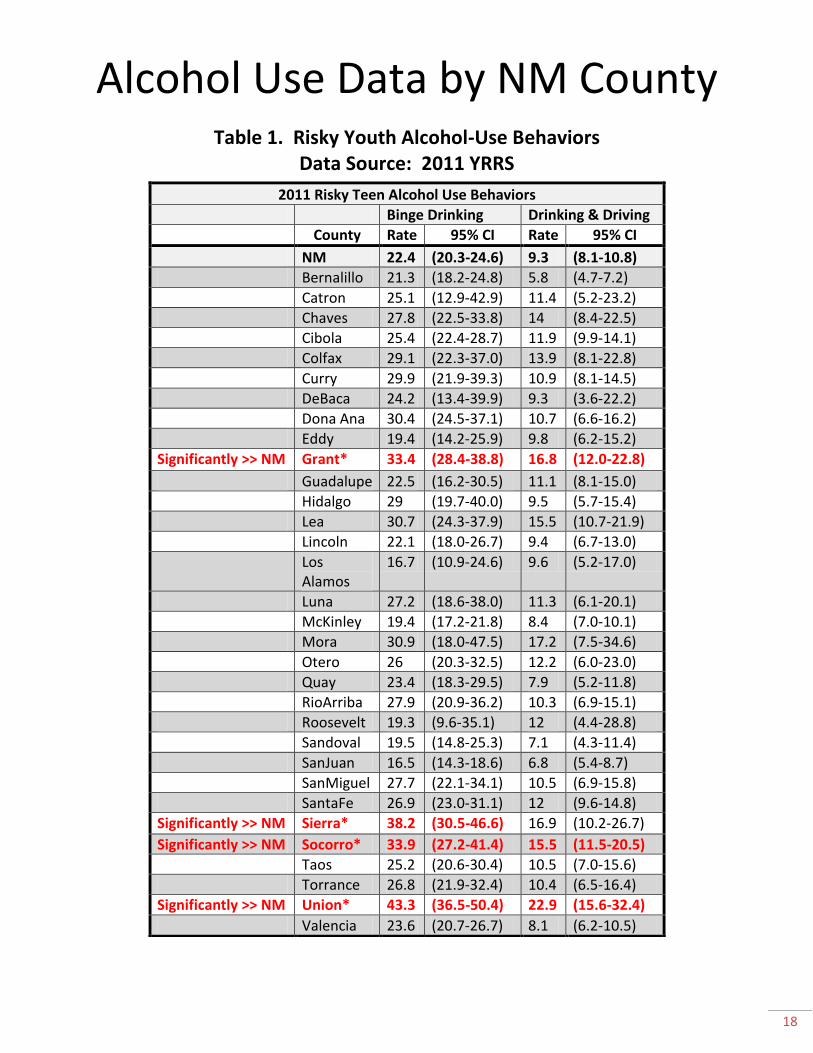
Table 1. Risky Youth Alcohol-Use Behaviors Data Source: 2011 YRRS
2011 Risky Teen Alcohol Use Behaviors
Binge Drinking Drinking & Driving
County Rate 95% CI Rate 95% CI
NM 22.4 (20.3-24.6) 9.3 (8.1-10.8)
Bernalillo 21.3 (18.2-24.8) 5.8 (4.7-7.2)
Catron 25.1 (12.9-42.9) 11.4 (5.2-23.2)
Chaves 27.8 (22.5-33.8) 14 (8.4-22.5)
Cibola 25.4 (22.4-28.7) 11.9 (9.9-14.1)
Colfax 29.1 (22.3-37.0) 13.9 (8.1-22.8)
Curry 29.9 (21.9-39.3) 10.9 (8.1-14.5)
DeBaca 24.2 (13.4-39.9) 9.3 (3.6-22.2)
Dona Ana 30.4 (24.5-37.1) 10.7 (6.6-16.2)
Eddy 19.4 (14.2-25.9) 9.8 (6.2-15.2)
Significantly >> NM Grant* 33.4 (28.4-38.8) 16.8 (12.0-22.8)
Guadalupe 22.5 (16.2-30.5) 11.1 (8.1-15.0)
Hidalgo 29 (19.7-40.0) 9.5 (5.7-15.4)
Lea 30.7 (24.3-37.9) 15.5 (10.7-21.9)
Lincoln 22.1 (18.0-26.7) 9.4 (6.7-13.0)
Los Alamos
16.7 (10.9-24.6) 9.6 (5.2-17.0)
Luna 27.2 (18.6-38.0) 11.3 (6.1-20.1)
McKinley 19.4 (17.2-21.8) 8.4 (7.0-10.1)
Mora 30.9 (18.0-47.5) 17.2 (7.5-34.6)
Otero 26 (20.3-32.5) 12.2 (6.0-23.0)
Quay 23.4 (18.3-29.5) 7.9 (5.2-11.8)
RioArriba 27.9 (20.9-36.2) 10.3 (6.9-15.1)
Roosevelt 19.3 (9.6-35.1) 12 (4.4-28.8)
Sandoval 19.5 (14.8-25.3) 7.1 (4.3-11.4)
SanJuan 16.5 (14.3-18.6) 6.8 (5.4-8.7)
SanMiguel 27.7 (22.1-34.1) 10.5 (6.9-15.8)
SantaFe 26.9 (23.0-31.1) 12 (9.6-14.8)
Significantly >> NM Sierra* 38.2 (30.5-46.6) 16.9 (10.2-26.7)
Significantly >> NM Socorro* 33.9 (27.2-41.4) 15.5 (11.5-20.5)
Taos 25.2 (20.6-30.4) 10.5 (7.0-15.6)
Torrance 26.8 (21.9-32.4) 10.4 (6.5-16.4)
Significantly >> NM Union* 43.3 (36.5-50.4) 22.9 (15.6-32.4)
Valencia 23.6 (20.7-26.7) 8.1 (6.2-10.5)

Alcohol Use Data by NM County
19
Table 1. Adults with 14 or More Days of Poor Mental Health in the Last 30 Days Data Sources: New Mexico Indicator-Based Information System (NM-IBIS)/ Explore Datasets/Health Surveys/ BRFSS/Age Adjusted Rates (Percentages), Tables, Graphs and Maps/Mental Health past 30 Days https://ibis.health.state.nm.us/query/result/brfss/BRFSSAgeAdj11_/MentHlthPast30DayAgeAdj.html; Behavior Risk Factor Surveillance System (BRFSS), Web Enabled Analysis Tool http://nccd.cdc.gov/s_broker/WEATSQL.exe/weat/freq_Year.hsql
% of Adults Reporting 14+ Days of Poor Mental
Health in the last 30 days
2008 2009 2010 2011 2012
NM 11.5 10.5 13.2 12.8
Bernalillo 12.8 8.5 12.2 12.9 12.6
Catron 11.5 2.9 11.0 7.4 1.3
Chaves 8.3 13.6 17.4 16.8 7.3
Cibola 10.7 11.9 20.4 10.7 7.3
Colfax 20.3 10.4 23.2 17.7 23.6
Curry 12.3 8.2 20.2 10.1 13.8
DeBaca 39.0 3.0 14.0
Dona Ana 10.3 10.5 13.7 8.7 9.3
Eddy 8.3 17.3 16.5 14.1 16.7
Grant 15.0 19.6 18.6 14.7 18.0
Guadalupe 16.1 3.4 1.8 12.1
Harding 13.7 ** **
Hidalgo 9.8 32.3 6.0 11.00 20.50
Lea 10.1 5.9 13.6 9.0 13.2
Lincoln 13.2 8.6 2.8 17.2 17.2
Los Alamos 4.5 14.6 5.8 18.9 6.6
Luna 12.0 13.7 18.7 16.4 24.7
McKinley 12.4 9.4 10.1 14.1 8.9
Mora 24.3 15.6 22.7 19.0 15.8
Otero 12.5 13.6 7.6 17.7 8.4
Quay 13.7 14.1 ** 18.4 3.2
RioArriba 10.7 11.0 11.8 19.3 9.2
Roosevelt 15.9 12.8 4.1 9.7 12.5
Sandoval 7.9 10.8 12.1 9.5 13.1
SanJuan 10.2 11.8 11.4 10.4 14.7
SanMiguel 4.7 14.4 9.9 20.4 15.7
SantaFe 10.6 12.7 16.6 10.3 11.6
Sierra 17.2 14.4 4.1 19.2 8.0
Socorro 14.9 13.8 18.2 17.4 21.7
Taos 7.9 7.1 14.6 14.5 4.6
Torrance 19.2 14.4 24.6 9.8 14.9
Union 18.8 7.9 10.1 12.3 2.3
Valencia 11.2 12.9 22.4 31.1 14.1

Alcohol Use Data by NM County
20
Table 1. Youth Measures of Feeling Sadness or Hopelessness Data Source: 2011 YRRS http://www.youthrisk.org/county.php
Youth reporting Feelings of Persistent Sadness or Hopelessness in last 12 Months in 2011
County Percentage 95% CI NM 29.1 (28.0-30.2)
1 Bernalillo 21.3 (28.0-34.8)
2 Catron 19.9 (13.6-28.3)
3 Chaves 30.4 (23.1-38.9)
4 Cibola 26.0 (22.9-29.3)
5 Colfax 24.5 (16.4-34.9)
6 Curry 29.0 (21.8-37.5)
7 DeBaca 24.1 (14.5-37.3)
8 Dona Ana 33.7 (28.3-39.6)
9 Eddy 32.9 (26.1-40.5)
10 Grant 34.8 (30.1-39.9)
11 Guadalupe 28.9 (20.9-38.5)
12 Hidalgo 29.7 (20.7-40.5)
13 Lea 30.9 (25.0-37.5)
14 Lincoln 33.2 (29.8-36.8)
15 Los Alamos 29.3 (22.0-37.7)
16 Luna 34.5 (29.5-39.9)
17 McKinley 27.8 (26.0-29.6)
18 Mora 29.2 (21.3-38.6)
19 Otero 32.3 (27.4-37.6)
20 Quay 25.1 (20.5-30.3)
21 RioArriba 31.7 (23.8-40.9)
22 Roosevelt 26.4 (19.6-34.6)
23 Sandoval 30.2 (24.2-36.9)
24 SanJuan 29.5 (27.2-31.9)
25 SanMiguel 32.0 (25.4-39.5)
26 SantaFe 29.7 (26.4-33.3)
27 Sierra 33.7 (19.8-51.1)
28 Socorro 26.5 (21.6-32.1)
29 Taos 24.8 (20.6-29.7)
30 Torrance* 35.9 (30.9-41.3)
31 Union 24.8 (19.0-35.4)
32 Valencia 23.9 (21.0-27.1)
Alcohol Use Data by NM County
21