Embed Size (px)
Citation preview
www.ccsa.ca • www.ccdus.ca Fall 2017 Canadian Drug Summary
Canadian Centre on Substance Use and Addiction • Centre canadien sur les dépendances et l’usage de substances Page 1
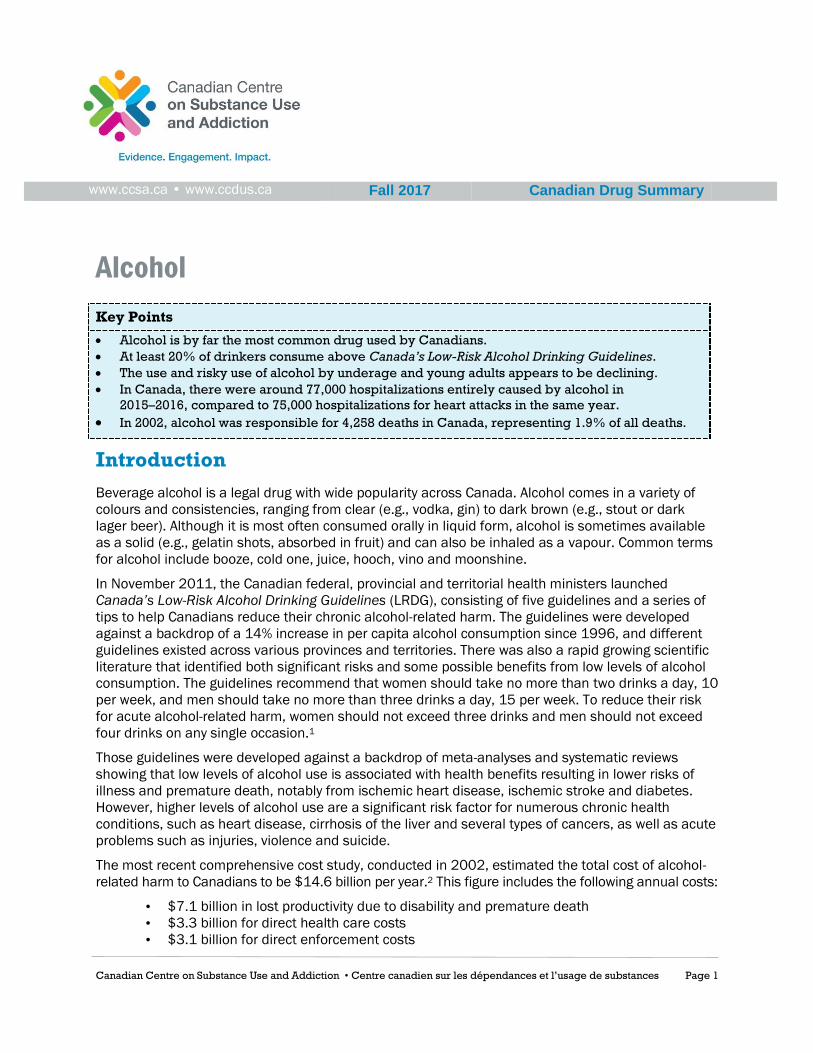
Alcohol
Key Points
Alcohol is by far the most common drug used by Canadians.
At least 20% of drinkers consume above Canada’s Low-Risk Alcohol Drinking Guidelines.
The use and risky use of alcohol by underage and young adults appears to be declining.
In Canada, there were around 77,000 hospitalizations entirely caused by alcohol in
2015–2016, compared to 75,000 hospitalizations for heart attacks in the same year.
In 2002, alcohol was responsible for 4,258 deaths in Canada, representing 1.9% of all deaths.
Introduction
Beverage alcohol is a legal drug with wide popularity across Canada. Alcohol comes in a variety of
colours and consistencies, ranging from clear (e.g., vodka, gin) to dark brown (e.g., stout or dark
lager beer). Although it is most often consumed orally in liquid form, alcohol is sometimes available
as a solid (e.g., gelatin shots, absorbed in fruit) and can also be inhaled as a vapour. Common terms
for alcohol include booze, cold one, juice, hooch, vino and moonshine.
In November 2011, the Canadian federal, provincial and territorial health ministers launched
Canada’s Low-Risk Alcohol Drinking Guidelines (LRDG), consisting of five guidelines and a series of
tips to help Canadians reduce their chronic alcohol-related harm. The guidelines were developed
against a backdrop of a 14% increase in per capita alcohol consumption since 1996, and different
guidelines existed across various provinces and territories. There was also a rapid growing scientific
literature that identified both significant risks and some possible benefits from low levels of alcohol
consumption. The guidelines recommend that women should take no more than two drinks a day, 10
per week, and men should take no more than three drinks a day, 15 per week. To reduce their risk
for acute alcohol-related harm, women should not exceed three drinks and men should not exceed
four drinks on any single occasion.1
Those guidelines were developed against a backdrop of meta-analyses and systematic reviews
showing that low levels of alcohol use is associated with health benefits resulting in lower risks of
illness and premature death, notably from ischemic heart disease, ischemic stroke and diabetes.
However, higher levels of alcohol use are a significant risk factor for numerous chronic health
conditions, such as heart disease, cirrhosis of the liver and several types of cancers, as well as acute
problems such as injuries, violence and suicide.
The most recent comprehensive cost study, conducted in 2002, estimated the total cost of alcohol-
related harm to Canadians to be $14.6 billion per year.2 This figure includes the following annual costs:
• $7.1 billion in lost productivity due to disability and premature death
• $3.3 billion for direct health care costs
• $3.1 billion for direct enforcement costs
Canadian Drug Summary: Alcohol
Canadian Centre on Substance Use and Addiction • Centre canadien sur les dépendances et l’usage de substances Page 2
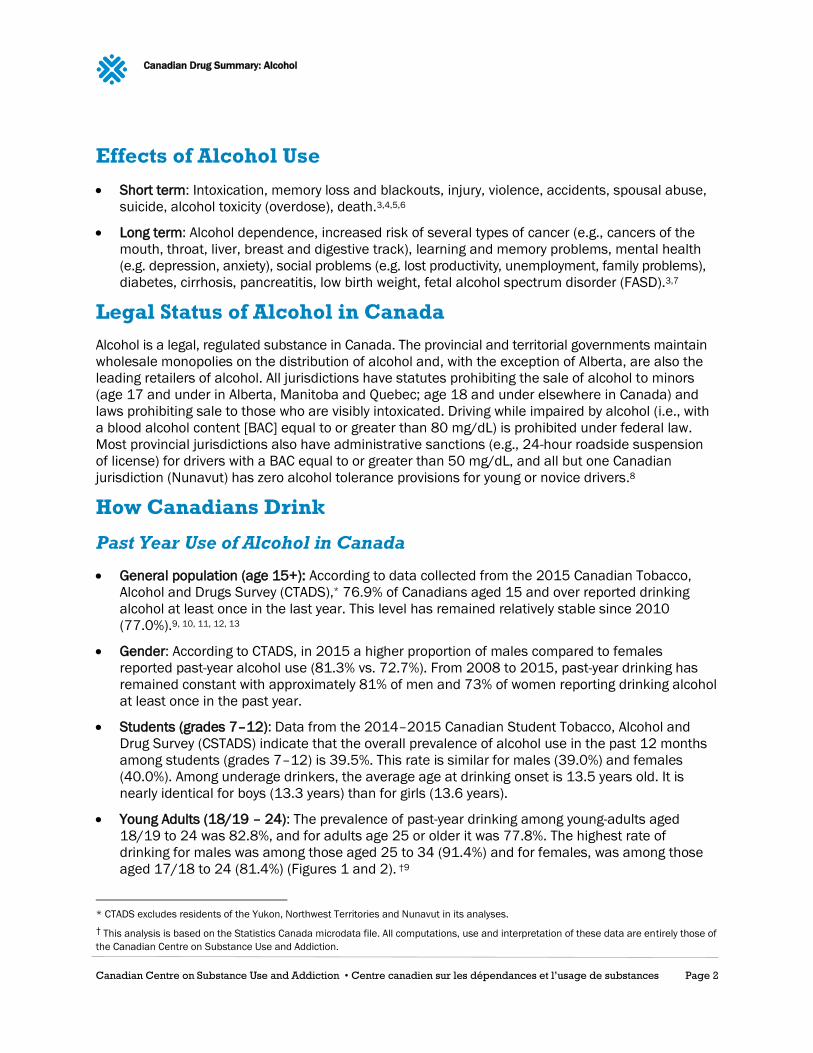
Effects of Alcohol Use
Short term: Intoxication, memory loss and blackouts, injury, violence, accidents, spousal abuse,
suicide, alcohol toxicity (overdose), death.3,4,5,6
Long term: Alcohol dependence, increased risk of several types of cancer (e.g., cancers of the
mouth, throat, liver, breast and digestive track), learning and memory problems, mental health
(e.g. depression, anxiety), social problems (e.g. lost productivity, unemployment, family problems),
diabetes, cirrhosis, pancreatitis, low birth weight, fetal alcohol spectrum disorder (FASD).3,7
Legal Status of Alcohol in Canada
Alcohol is a legal, regulated substance in Canada. The provincial and territorial governments maintain
wholesale monopolies on the distribution of alcohol and, with the exception of Alberta, are also the
leading retailers of alcohol. All jurisdictions have statutes prohibiting the sale of alcohol to minors
(age 17 and under in Alberta, Manitoba and Quebec; age 18 and under elsewhere in Canada) and
laws prohibiting sale to those who are visibly intoxicated. Driving while impaired by alcohol (i.e., with
a blood alcohol content [BAC] equal to or greater than 80 mg/dL) is prohibited under federal law.
Most provincial jurisdictions also have administrative sanctions (e.g., 24-hour roadside suspension
of license) for drivers with a BAC equal to or greater than 50 mg/dL, and all but one Canadian
jurisdiction (Nunavut) has zero alcohol tolerance provisions for young or novice drivers.8
How Canadians Drink
Past Year Use of Alcohol in Canada
General population (age 15+): According to data collected from the 2015 Canadian Tobacco,
Alcohol and Drugs Survey (CTADS),* 76.9% of Canadians aged 15 and over reported drinking
alcohol at least once in the last year. This level has remained relatively stable since 2010
(77.0%).9, 10, 11, 12, 13
Gender: According to CTADS, in 2015 a higher proportion of males compared to females
reported past-year alcohol use (81.3% vs. 72.7%). From 2008 to 2015, past-year drinking has
remained constant with approximately 81% of men and 73% of women reporting drinking alcohol
at least once in the past year.
Students (grades 7–12): Data from the 2014–2015 Canadian Student Tobacco, Alcohol and
Drug Survey (CSTADS) indicate that the overall prevalence of alcohol use in the past 12 months
among students (grades 7–12) is 39.5%. This rate is similar for males (39.0%) and females
(40.0%). Among underage drinkers, the average age at drinking onset is 13.5 years old. It is
nearly identical for boys (13.3 years) than for girls (13.6 years).
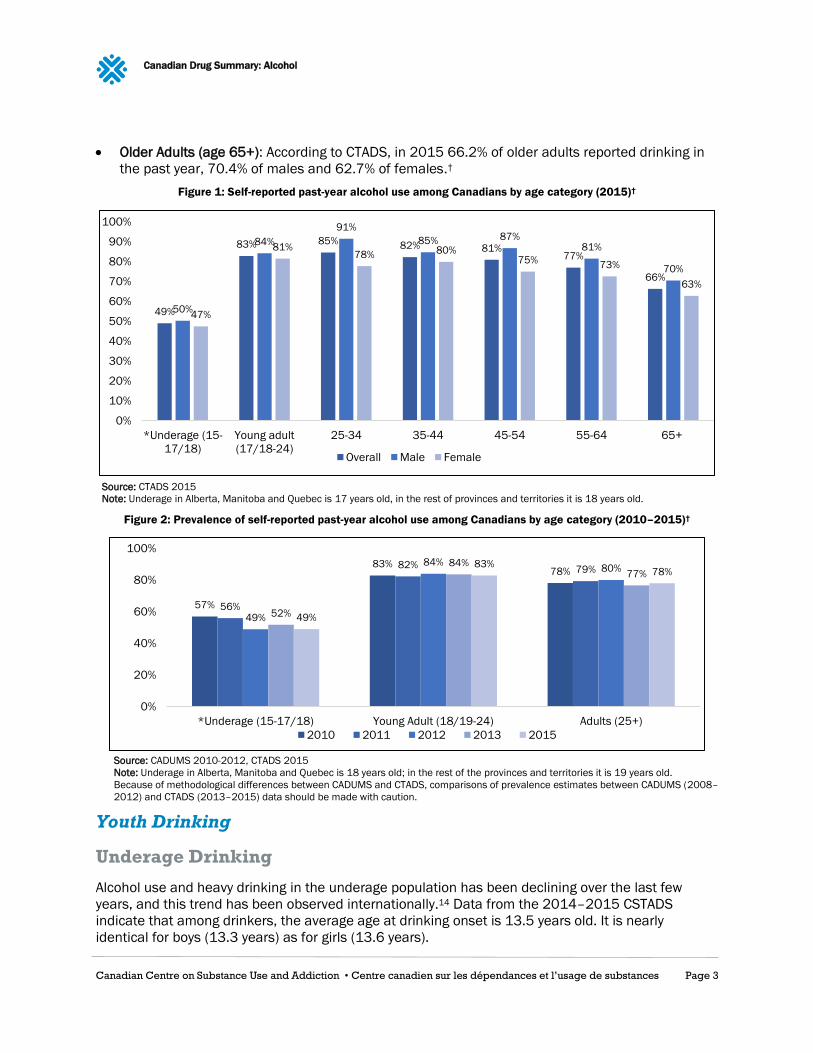
Young Adults (18/19 – 24): The prevalence of past-year drinking among young-adults aged
18/19 to 24 was 82.8%, and for adults age 25 or older it was 77.8%. The highest rate of
drinking for males was among those aged 25 to 34 (91.4%) and for females, was among those
aged 17/18 to 24 (81.4%) (Figures 1 and 2). †9
* CTADS excludes residents of the Yukon, Northwest Territories and Nunavut in its analyses.
† This analysis is based on the Statistics Canada microdata file. All computations, use and interpretation of these data are entirely those of
the Canadian Centre on Substance Use and Addiction.
Canadian Drug Summary: Alcohol
Canadian Centre on Substance Use and Addiction • Centre canadien sur les dépendances et l’usage de substances Page 3
Older Adults (age 65+): According to CTADS, in 2015 66.2% of older adults reported drinking in
the past year, 70.4% of males and 62.7% of females.†
Figure 1: Self-reported past-year alcohol use among Canadians by age category (2015)†
Source: CTADS 2015
Note: Underage in Alberta, Manitoba and Quebec is 17 years old, in the rest of provinces and territories it is 18 years old.
Figure 2: Prevalence of self-reported past-year alcohol use among Canadians by age category (2010–2015)†
Source: CADUMS 2010-2012, CTADS 2015
Note: Underage in Alberta, Manitoba and Quebec is 18 years old; in the rest of the provinces and territories it is 19 years old.
Because of methodological differences between CADUMS and CTADS, comparisons of prevalence estimates between CADUMS (2008–
2012) and CTADS (2013–2015) data should be made with caution.
Youth Drinking
Underage Drinking
Alcohol use and heavy drinking in the underage population has been declining over the last few
years, and this trend has been observed internationally.14 Data from the 2014–2015 CSTADS
indicate that among drinkers, the average age at drinking onset is 13.5 years old. It is nearly
identical for boys (13.3 years) as for girls (13.6 years).
49%
83% 85% 82% 81%77%
66%
50%
84%
91%
85% 87%81%
70%
47%
81%78% 80%
75%73%
63%
0%
10%
20%
30%
40%
50%
60%
70%
80%
90%
100%
*Underage (15-
17/18)
Young adult
(17/18-24)
25-34 35-44 45-54 55-64 65+
Overall Male Female
57%
83%78%
56%
82% 79%
49%
84%80%
52%
84%77%
49%
83%78%
0%
20%
40%
60%
80%
100%
*Underage (15-17/18) Young Adult (18/19-24) Adults (25+)
2010 2011 2012 2013 2015
Canadian Drug Summary: Alcohol
Canadian Centre on Substance Use and Addiction • Centre canadien sur les dépendances et l’usage de substances Page 4
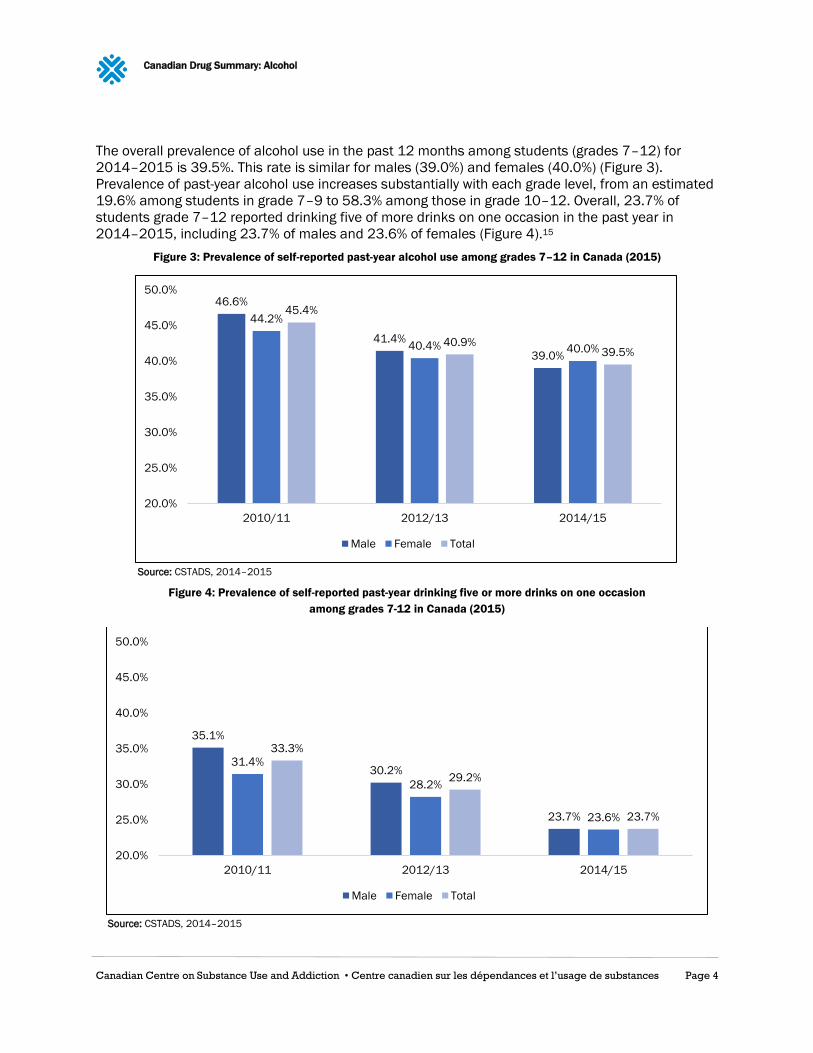
The overall prevalence of alcohol use in the past 12 months among students (grades 7–12) for
2014–2015 is 39.5%. This rate is similar for males (39.0%) and females (40.0%) (Figure 3).
Prevalence of past-year alcohol use increases substantially with each grade level, from an estimated
19.6% among students in grade 7–9 to 58.3% among those in grade 10–12. Overall, 23.7% of
students grade 7–12 reported drinking five of more drinks on one occasion in the past year in
2014–2015, including 23.7% of males and 23.6% of females (Figure 4).15
Figure 3: Prevalence of self-reported past-year alcohol use among grades 7–12 in Canada (2015)
Source: CSTADS, 2014–2015
Figure 4: Prevalence of self-reported past-year drinking five or more drinks on one occasion
among grades 7-12 in Canada (2015)
Source: CSTADS, 2014–2015
46.6%
41.4%
39.0%
44.2%
40.4% 40.0%
45.4%
40.9%39.5%
20.0%
25.0%
30.0%
35.0%
40.0%
45.0%
50.0%
2010/11 2012/13 2014/15
Male Female Total
35.1%
30.2%
23.7%
31.4%
28.2%
23.6%
33.3%
29.2%
23.7%
20.0%
25.0%
30.0%
35.0%
40.0%
45.0%
50.0%
2010/11 2012/13 2014/15
Male Female Total
Canadian Drug Summary: Alcohol
Canadian Centre on Substance Use and Addiction • Centre canadien sur les dépendances et l’usage de substances Page 5
Post-secondary Students’ Drinking
The most current Canadian data on post-secondary student drinking is captured by the National
College Health Assessment Spring 2016 survey, which is drawn from a convenience sample of
43,780 students in 41 post-secondary institutions in Canada, and therefore not representative of all
post-secondary students in Canada, indicated that 69.3% of students reported any use of alcohol
within the last 30 days preceding the survey (70.2% of females and 68.1% of males).
Among college and university drinkers, about 35% reported having five or more drinks of alcohol at a
sitting over the last two weeks. A higher proportion of males (38.8%) than females (33.5%) reported
this risky drinking. The average reported number of drinks consumed is 4.47 for men and 3.64 for
females.16
Provincial Comparison
Prevalence of alcohol use varies across provinces. In 2015, the province with the lowest prevalence
of past-year alcohol use was Prince Edward Island at 73.0%, while Quebec had the highest
prevalence at 82.1%. (The territories are not captured in this data.) Prevalence of alcohol use does
not directly relate to absolute per capita consumption (see subsection on Volume of Alcohol
Consumed), nor to patterns of drinking (see subsection on Drinking Patterns).
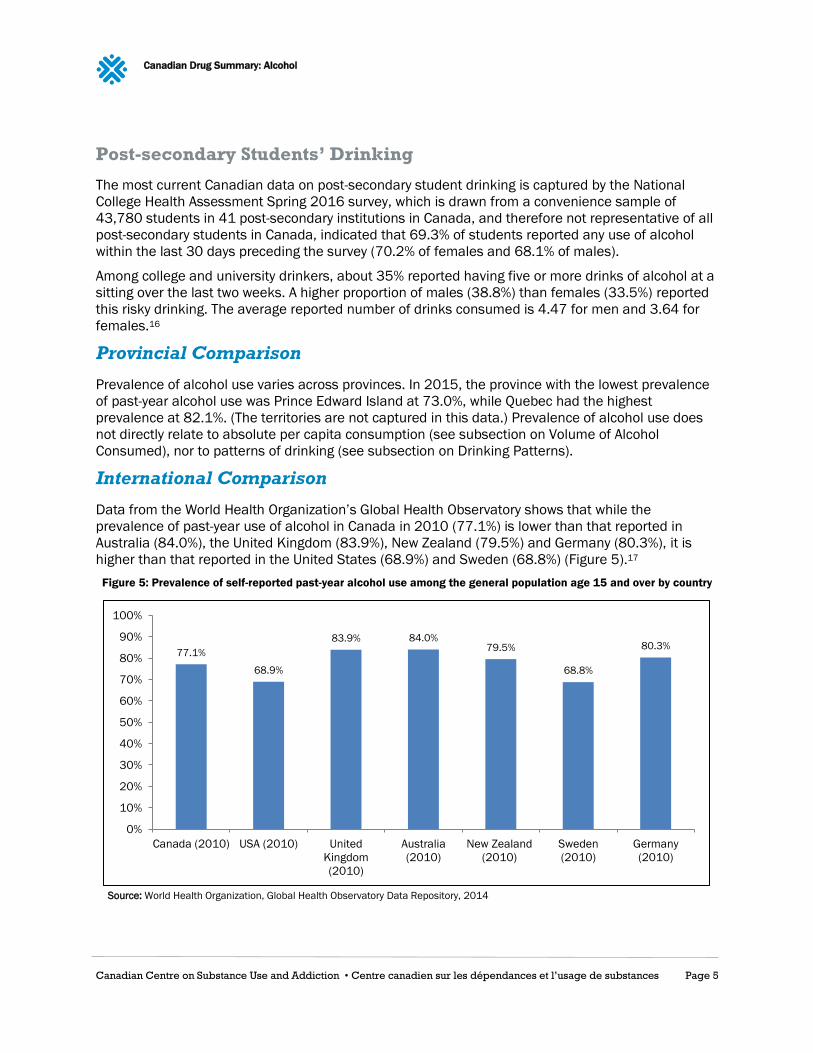
International Comparison
Data from the World Health Organization’s Global Health Observatory shows that while the
prevalence of past-year use of alcohol in Canada in 2010 (77.1%) is lower than that reported in
Australia (84.0%), the United Kingdom (83.9%), New Zealand (79.5%) and Germany (80.3%), it is
higher than that reported in the United States (68.9%) and Sweden (68.8%) (Figure 5).17
Figure 5: Prevalence of self-reported past-year alcohol use among the general population age 15 and over by country
Source: World Health Organization, Global Health Observatory Data Repository, 2014
77.1%
68.9%
83.9% 84.0%79.5%
68.8%
80.3%
0%
10%
20%
30%
40%
50%
60%
70%
80%
90%
100%
Canada (2010) USA (2010) United
Kingdom
(2010)
Australia
(2010)
New Zealand
(2010)
Sweden
(2010)
Germany
(2010)
Canadian Drug Summary: Alcohol
Canadian Centre on Substance Use and Addiction • Centre canadien sur les dépendances et l’usage de substances Page 6
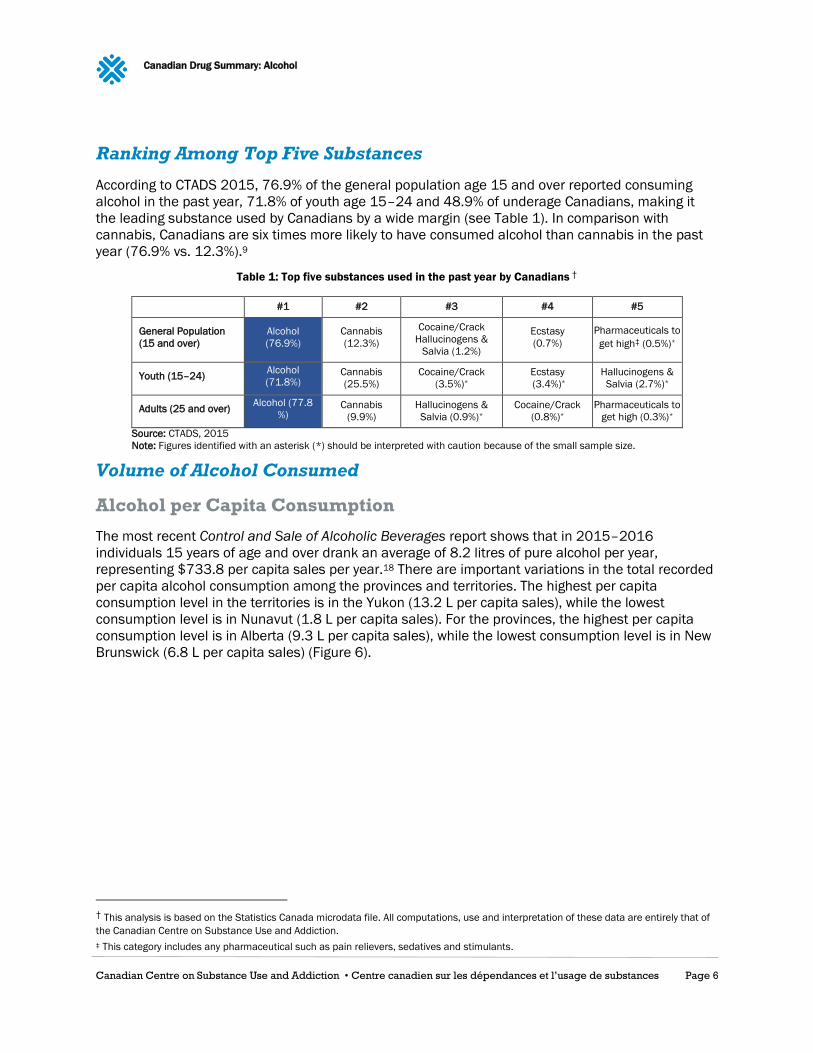
Ranking Among Top Five Substances
According to CTADS 2015, 76.9% of the general population age 15 and over reported consuming
alcohol in the past year, 71.8% of youth age 15–24 and 48.9% of underage Canadians, making it
the leading substance used by Canadians by a wide margin (see Table 1). In comparison with
cannabis, Canadians are six times more likely to have consumed alcohol than cannabis in the past
year (76.9% vs. 12.3%).9
Table 1: Top five substances used in the past year by Canadians †
#1 #2 #3 #4 #5
General Population
(15 and over)
Alcohol
(76.9%)
Cannabis
(12.3%)
Cocaine/Crack
Hallucinogens &
Salvia (1.2%)
Ecstasy
(0.7%)
Pharmaceuticals to
get high‡ (0.5%)*
Youth (15–24) Alcohol
(71.8%) Cannabis
(25.5%)
Cocaine/Crack
(3.5%)*
Ecstasy
(3.4%)*
Hallucinogens &
Salvia (2.7%)*
Adults (25 and over) Alcohol (77.8
%) Cannabis
(9.9%)
Hallucinogens &
Salvia (0.9%)*
Cocaine/Crack
(0.8%)*
Pharmaceuticals to
get high (0.3%)*
Source: CTADS, 2015
Note: Figures identified with an asterisk (*) should be interpreted with caution because of the small sample size.
Volume of Alcohol Consumed
Alcohol per Capita Consumption
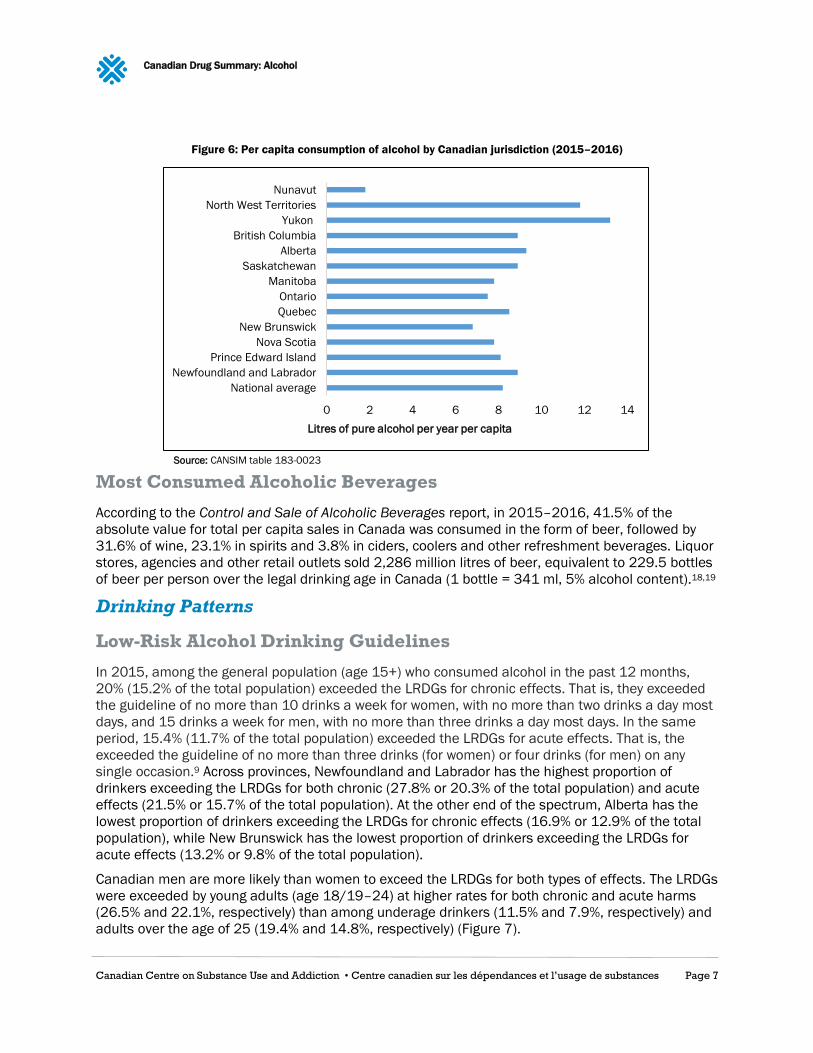
The most recent Control and Sale of Alcoholic Beverages report shows that in 2015–2016
individuals 15 years of age and over drank an average of 8.2 litres of pure alcohol per year,
representing $733.8 per capita sales per year.18 There are important variations in the total recorded
per capita alcohol consumption among the provinces and territories. The highest per capita
consumption level in the territories is in the Yukon (13.2 L per capita sales), while the lowest
consumption level is in Nunavut (1.8 L per capita sales). For the provinces, the highest per capita
consumption level is in Alberta (9.3 L per capita sales), while the lowest consumption level is in New
Brunswick (6.8 L per capita sales) (Figure 6).
† This analysis is based on the Statistics Canada microdata file. All computations, use and interpretation of these data are entirely that of
the Canadian Centre on Substance Use and Addiction.
‡ This category includes any pharmaceutical such as pain relievers, sedatives and stimulants.
Canadian Drug Summary: Alcohol
Canadian Centre on Substance Use and Addiction • Centre canadien sur les dépendances et l’usage de substances Page 7
Figure 6: Per capita consumption of alcohol by Canadian jurisdiction (2015–2016)
Source: CANSIM table 183-0023
Most Consumed Alcoholic Beverages
According to the Control and Sale of Alcoholic Beverages report, in 2015–2016, 41.5% of the
absolute value for total per capita sales in Canada was consumed in the form of beer, followed by
31.6% of wine, 23.1% in spirits and 3.8% in ciders, coolers and other refreshment beverages. Liquor
stores, agencies and other retail outlets sold 2,286 million litres of beer, equivalent to 229.5 bottles
of beer per person over the legal drinking age in Canada (1 bottle = 341 ml, 5% alcohol content).18,19
Drinking Patterns
Low-Risk Alcohol Drinking Guidelines
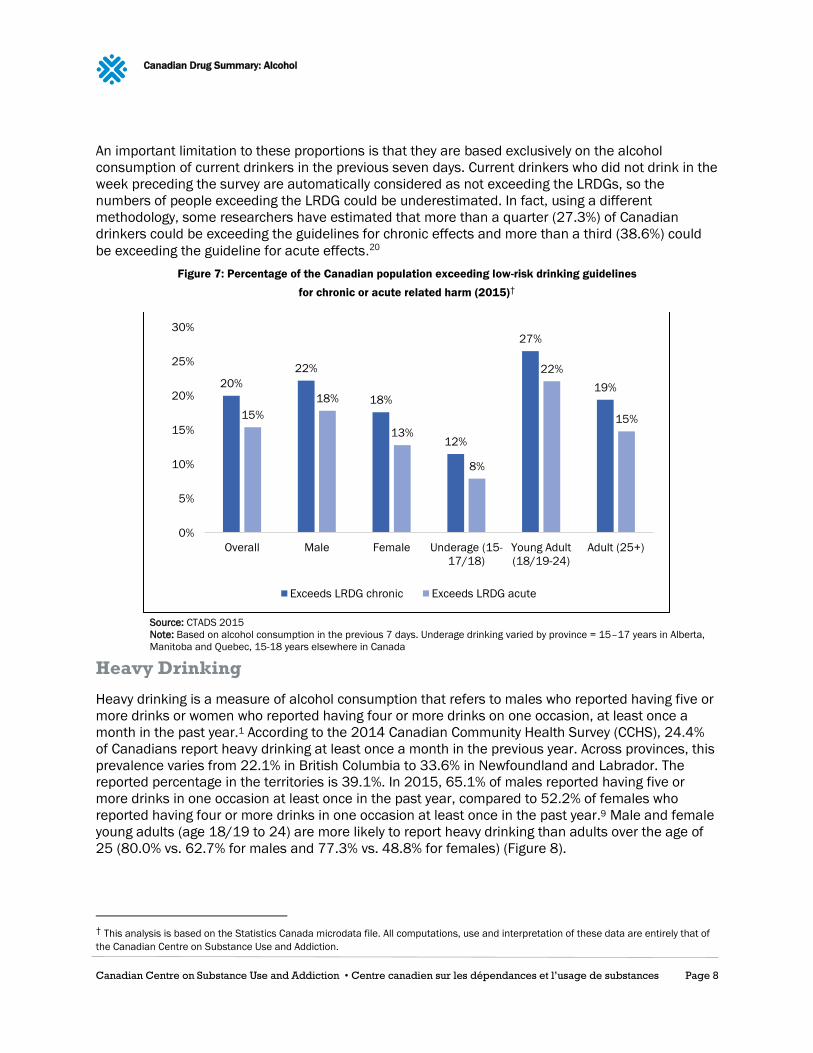
In 2015, among the general population (age 15+) who consumed alcohol in the past 12 months,
20% (15.2% of the total population) exceeded the LRDGs for chronic effects. That is, they exceeded
the guideline of no more than 10 drinks a week for women, with no more than two drinks a day most
days, and 15 drinks a week for men, with no more than three drinks a day most days. In the same
period, 15.4% (11.7% of the total population) exceeded the LRDGs for acute effects. That is, the
exceeded the guideline of no more than three drinks (for women) or four drinks (for men) on any
single occasion.9 Across provinces, Newfoundland and Labrador has the highest proportion of
drinkers exceeding the LRDGs for both chronic (27.8% or 20.3% of the total population) and acute
effects (21.5% or 15.7% of the total population). At the other end of the spectrum, Alberta has the
lowest proportion of drinkers exceeding the LRDGs for chronic effects (16.9% or 12.9% of the total
population), while New Brunswick has the lowest proportion of drinkers exceeding the LRDGs for
acute effects (13.2% or 9.8% of the total population).
Canadian men are more likely than women to exceed the LRDGs for both types of effects. The LRDGs
were exceeded by young adults (age 18/19–24) at higher rates for both chronic and acute harms
(26.5% and 22.1%, respectively) than among underage drinkers (11.5% and 7.9%, respectively) and
adults over the age of 25 (19.4% and 14.8%, respectively) (Figure 7).
0 2 4 6 8 10 12 14
National average
Newfoundland and Labrador
Prince Edward Island
Nova Scotia
New Brunswick
Quebec
Ontario
Manitoba
Saskatchewan
Alberta
British Columbia
Yukon
North West Territories
Nunavut
Litres of pure alcohol per year per capita
Canadian Drug Summary: Alcohol
Canadian Centre on Substance Use and Addiction • Centre canadien sur les dépendances et l’usage de substances Page 8
An important limitation to these proportions is that they are based exclusively on the alcohol
consumption of current drinkers in the previous seven days. Current drinkers who did not drink in the
week preceding the survey are automatically considered as not exceeding the LRDGs, so the
numbers of people exceeding the LRDG could be underestimated. In fact, using a different
methodology, some researchers have estimated that more than a quarter (27.3%) of Canadian
drinkers could be exceeding the guidelines for chronic effects and more than a third (38.6%) could
be exceeding the guideline for acute effects.20
Figure 7: Percentage of the Canadian population exceeding low-risk drinking guidelines
for chronic or acute related harm (2015)†
Source: CTADS 2015
Note: Based on alcohol consumption in the previous 7 days. Underage drinking varied by province = 15–17 years in Alberta,
Manitoba and Quebec, 15-18 years elsewhere in Canada
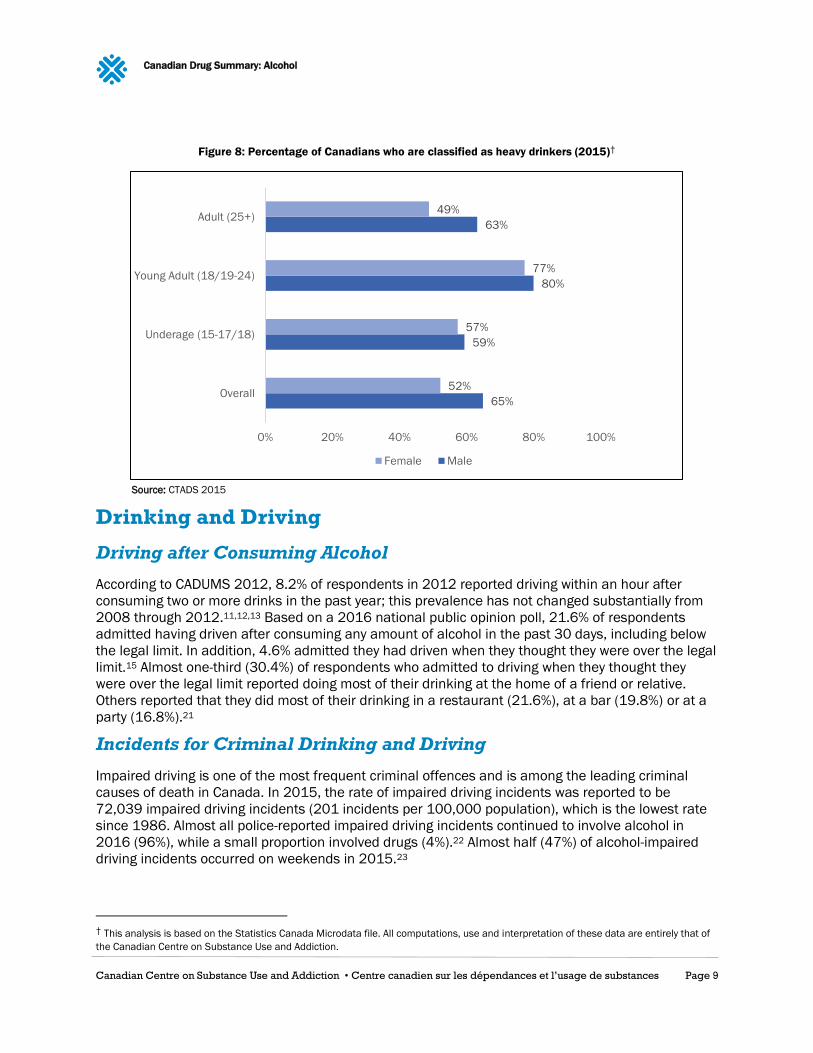
Heavy Drinking
Heavy drinking is a measure of alcohol consumption that refers to males who reported having five or
more drinks or women who reported having four or more drinks on one occasion, at least once a
month in the past year.1 According to the 2014 Canadian Community Health Survey (CCHS), 24.4%
of Canadians report heavy drinking at least once a month in the previous year. Across provinces, this
prevalence varies from 22.1% in British Columbia to 33.6% in Newfoundland and Labrador. The
reported percentage in the territories is 39.1%. In 2015, 65.1% of males reported having five or
more drinks in one occasion at least once in the past year, compared to 52.2% of females who
reported having four or more drinks in one occasion at least once in the past year.9 Male and female
young adults (age 18/19 to 24) are more likely to report heavy drinking than adults over the age of
25 (80.0% vs. 62.7% for males and 77.3% vs. 48.8% for females) (Figure 8).
† This analysis is based on the Statistics Canada microdata file. All computations, use and interpretation of these data are entirely that of
the Canadian Centre on Substance Use and Addiction.
20%
22%
18%
12%
27%
19%
15%
18%
13%
8%
22%
15%
0%
5%
10%
15%
20%
25%
30%
Overall Male Female Underage (15-
17/18)
Young Adult
(18/19-24)
Adult (25+)
Exceeds LRDG chronic Exceeds LRDG acute
Canadian Drug Summary: Alcohol
Canadian Centre on Substance Use and Addiction • Centre canadien sur les dépendances et l’usage de substances Page 9
Figure 8: Percentage of Canadians who are classified as heavy drinkers (2015)†
Source: CTADS 2015
Drinking and Driving
Driving after Consuming Alcohol
According to CADUMS 2012, 8.2% of respondents in 2012 reported driving within an hour after
consuming two or more drinks in the past year; this prevalence has not changed substantially from
2008 through 2012.11,12,13 Based on a 2016 national public opinion poll, 21.6% of respondents
admitted having driven after consuming any amount of alcohol in the past 30 days, including below
the legal limit. In addition, 4.6% admitted they had driven when they thought they were over the legal
limit.15 Almost one-third (30.4%) of respondents who admitted to driving when they thought they
were over the legal limit reported doing most of their drinking at the home of a friend or relative.
Others reported that they did most of their drinking in a restaurant (21.6%), at a bar (19.8%) or at a
party (16.8%).21
Incidents for Criminal Drinking and Driving
Impaired driving is one of the most frequent criminal offences and is among the leading criminal
causes of death in Canada. In 2015, the rate of impaired driving incidents was reported to be
72,039 impaired driving incidents (201 incidents per 100,000 population), which is the lowest rate
since 1986. Almost all police-reported impaired driving incidents continued to involve alcohol in
2016 (96%), while a small proportion involved drugs (4%).22 Almost half (47%) of alcohol-impaired
driving incidents occurred on weekends in 2015.23
† This analysis is based on the Statistics Canada Microdata file. All computations, use and interpretation of these data are entirely that of
the Canadian Centre on Substance Use and Addiction.
65%
59%
80%
63%
52%
57%
77%
49%
0% 20% 40% 60% 80% 100%
Overall
Underage (15-17/18)
Young Adult (18/19-24)
Adult (25+)
Female Male
Canadian Drug Summary: Alcohol
Canadian Centre on Substance Use and Addiction • Centre canadien sur les dépendances et l’usage de substances Page 10
Deaths Caused by Drinking Drivers
In 2016, police reported 100 incidents of impaired driving causing death and 541 causing bodily
harm. These figures are down from 2012 when 137 incidents causing deaths were reported and
729 causing bodily harm.23
CCSA’s Topic Summary on Impaired Driving in Canada provides a comprehensive summary of all
statistics related to impaired driving in Canada.24
Mortality and Morbidity
Chronic Diseases
Twenty-five chronic disease and condition codes in the International Classification of Disease 10 are
entirely attributable to alcohol use. Alcohol plays a contributing role in the risk of developing certain
chronic diseases such as diabetes, colon cancer, ischemic cardiovascular diseases and liver cirrhosis.25
Alcohol use is among the top three leading risk factors for death from cancer worldwide.26 It is
estimated that 3.6% of all cancer are attributable to alcohol drinking.27 A causal link has been
established between alcohol drinking and cancers of the oral cavity, pharynx, esophagus, colon,
rectum, liver, larynx and breast.28 According to data from the Canadian Cancer Registry, new cancer
cases have been increasing from 507.5 (per 100,000 population) in 2009 to 523.9 in 2013. From
these, is it estimated that 67.4 (per 100,000 population) are new cases of breast cancer, 64.1 colon
and rectum cancers, and 12.5 total oral cavity cancers.§,29
In 2013, the age specific mortality rate for colon cancer and diabetes was 24 and 20 per 100,000,
respectively, and for cirrhosis it was double for men, than for women (11.2 vs 5.7) (Table 2).
Table 2. Mortality rate by chronic disease and gender in Canada (2013)
Cause of death Total Males Females
Colon and rectum cancer 24.0 25.8 22.3
Liver cirrhosis 8.4 11.2 5.7
Hypertension 4.3 3.3 5.4
Diabetes 20.0 21.7 18.4
Data source: CANSIM table 102-0551
Note: Age-specific mortality rate per 100,000 population
According to the CCHS 2012, 3.2% of the general population reported alcohol abuse or dependence
in the past year, including 1.7% of females and 4.7% of males. 30
Hospital Costs and Healthcare Impacts of Alcohol Use
Hospitalizations Entirely Caused by Alcohol
In 2015–2016 approximately 56,600 Canadians were hospitalized with a condition entirely caused
by alcohol **. Of these people, 21% had two or more hospitalizations entirely caused by alcohol that
§ Total oral cavities include lip, tongue, salivary gland, floor of mouth, gum and other mouth, nasopharynx, oropharynx, hypopharynx and
pharynx.
** Hospitalizations entirely caused by alcohol are hospital stays for the treatment of conditions considered to be wholly caused by the harmful
consumption of alcohol. The most common conditions contributing to hospitalizations entirely caused by alcohol in 2015–2016 in Canada
Canadian Drug Summary: Alcohol
Canadian Centre on Substance Use and Addiction • Centre canadien sur les dépendances et l’usage de substances Page 11
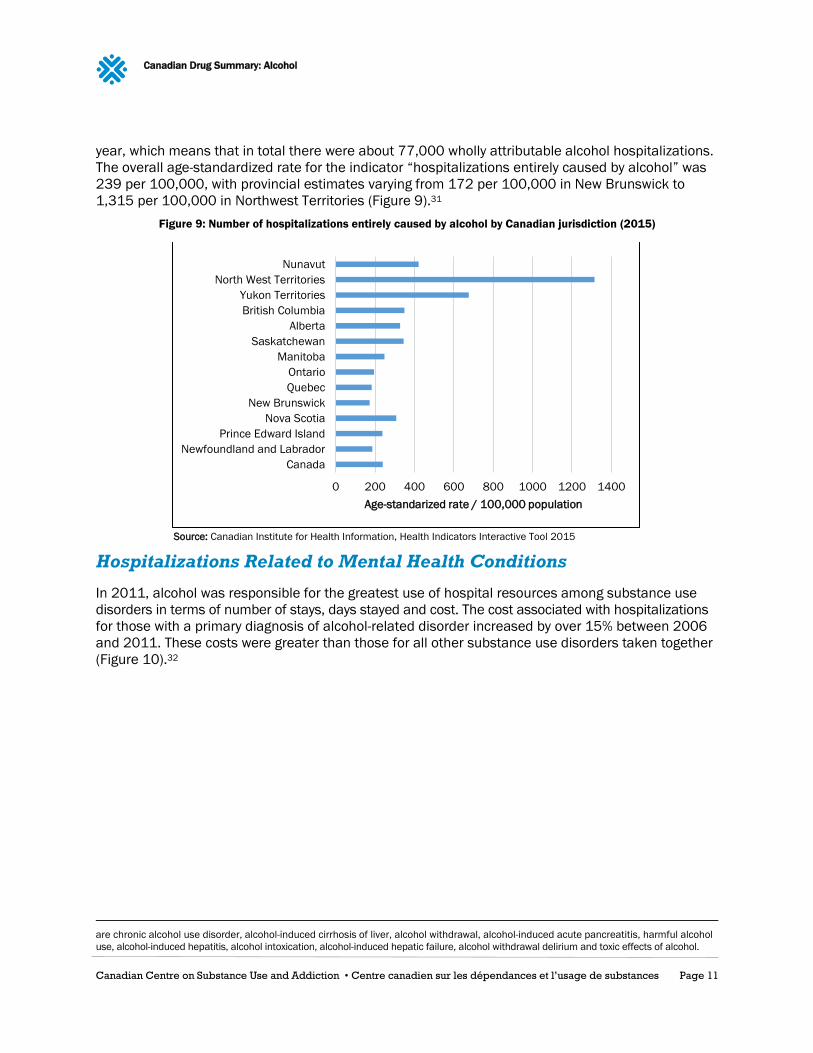
year, which means that in total there were about 77,000 wholly attributable alcohol hospitalizations.
The overall age-standardized rate for the indicator “hospitalizations entirely caused by alcohol” was
239 per 100,000, with provincial estimates varying from 172 per 100,000 in New Brunswick to
1,315 per 100,000 in Northwest Territories (Figure 9).31
Figure 9: Number of hospitalizations entirely caused by alcohol by Canadian jurisdiction (2015)
Source: Canadian Institute for Health Information, Health Indicators Interactive Tool 2015
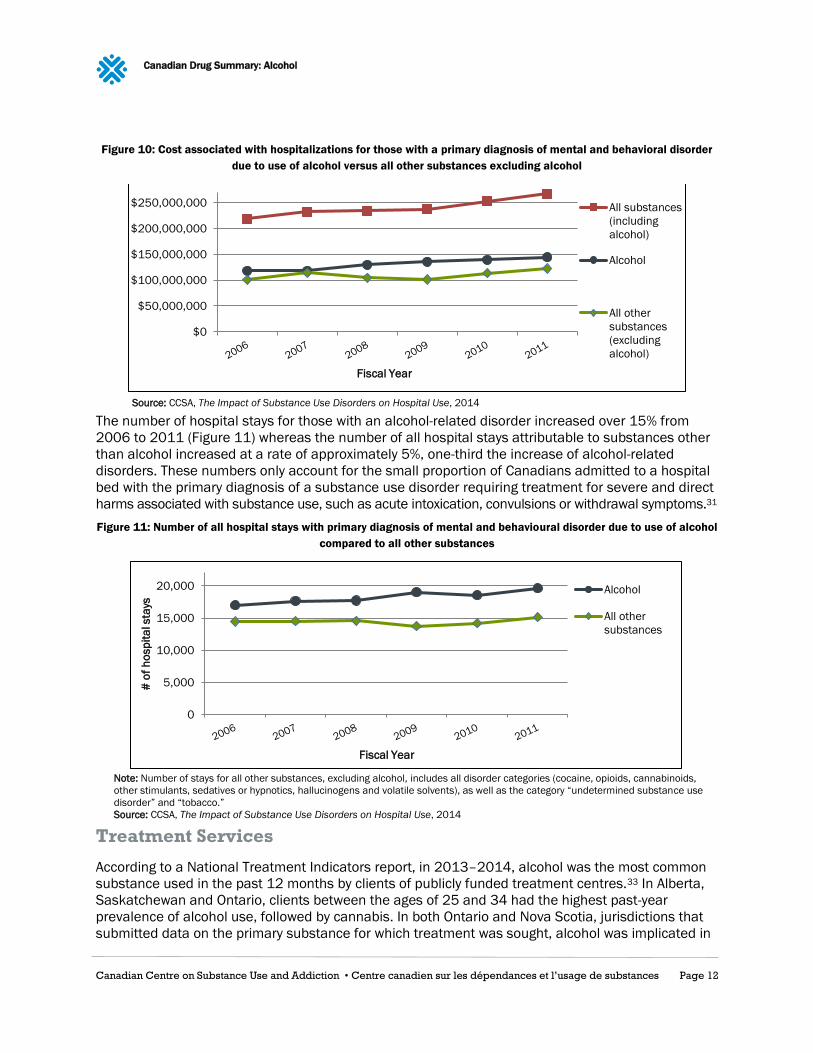
Hospitalizations Related to Mental Health Conditions
In 2011, alcohol was responsible for the greatest use of hospital resources among substance use
disorders in terms of number of stays, days stayed and cost. The cost associated with hospitalizations
for those with a primary diagnosis of alcohol-related disorder increased by over 15% between 2006
and 2011. These costs were greater than those for all other substance use disorders taken together
(Figure 10).32
are chronic alcohol use disorder, alcohol-induced cirrhosis of liver, alcohol withdrawal, alcohol-induced acute pancreatitis, harmful alcohol
use, alcohol-induced hepatitis, alcohol intoxication, alcohol-induced hepatic failure, alcohol withdrawal delirium and toxic effects of alcohol.
0 200 400 600 800 1000 1200 1400
Canada
Newfoundland and Labrador
Prince Edward Island
Nova Scotia
New Brunswick
Quebec
Ontario
Manitoba
Saskatchewan
Alberta
British Columbia
Yukon Territories
North West Territories
Nunavut
Age-standarized rate / 100,000 population
Canadian Drug Summary: Alcohol
Canadian Centre on Substance Use and Addiction • Centre canadien sur les dépendances et l’usage de substances Page 12
Figure 10: Cost associated with hospitalizations for those with a primary diagnosis of mental and behavioral disorder
due to use of alcohol versus all other substances excluding alcohol
Source: CCSA, The Impact of Substance Use Disorders on Hospital Use, 2014
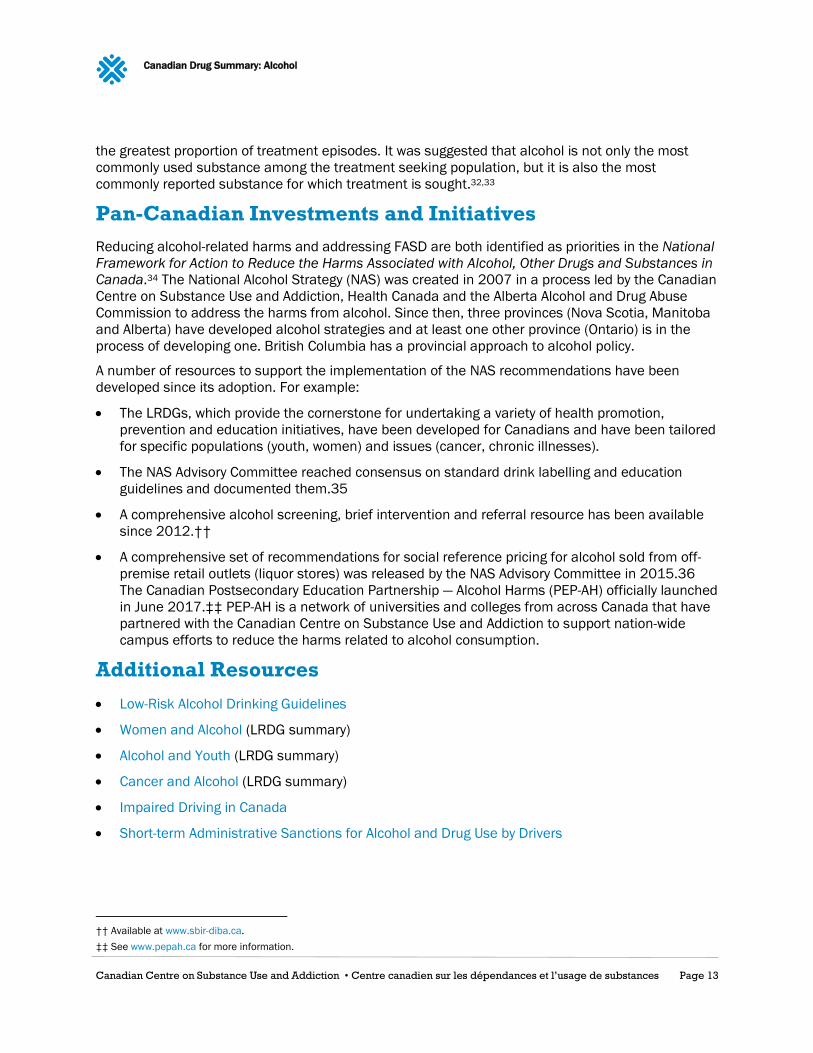
The number of hospital stays for those with an alcohol-related disorder increased over 15% from
2006 to 2011 (Figure 11) whereas the number of all hospital stays attributable to substances other
than alcohol increased at a rate of approximately 5%, one-third the increase of alcohol-related
disorders. These numbers only account for the small proportion of Canadians admitted to a hospital
bed with the primary diagnosis of a substance use disorder requiring treatment for severe and direct
harms associated with substance use, such as acute intoxication, convulsions or withdrawal symptoms.31
Figure 11: Number of all hospital stays with primary diagnosis of mental and behavioural disorder due to use of alcohol
compared to all other substances
Note: Number of stays for all other substances, excluding alcohol, includes all disorder categories (cocaine, opioids, cannabinoids,
other stimulants, sedatives or hypnotics, hallucinogens and volatile solvents), as well as the category “undetermined substance use
disorder” and “tobacco.”
Source: CCSA, The Impact of Substance Use Disorders on Hospital Use, 2014
Treatment Services
According to a National Treatment Indicators report, in 2013–2014, alcohol was the most common
substance used in the past 12 months by clients of publicly funded treatment centres.33 In Alberta,
Saskatchewan and Ontario, clients between the ages of 25 and 34 had the highest past-year
prevalence of alcohol use, followed by cannabis. In both Ontario and Nova Scotia, jurisdictions that
submitted data on the primary substance for which treatment was sought, alcohol was implicated in
$0
$50,000,000
$100,000,000
$150,000,000
$200,000,000
$250,000,000
Fiscal Year
All substances
(including
alcohol)
Alcohol
All other
substances
(excluding
alcohol)
0
5,000
10,000
15,000
20,000
# o
f h
osp
ita
l sta
ys
Fiscal Year
Alcohol
All other
substances
Canadian Drug Summary: Alcohol
Canadian Centre on Substance Use and Addiction • Centre canadien sur les dépendances et l’usage de substances Page 13
the greatest proportion of treatment episodes. It was suggested that alcohol is not only the most
commonly used substance among the treatment seeking population, but it is also the most
commonly reported substance for which treatment is sought.32,33
Pan-Canadian Investments and Initiatives
Reducing alcohol-related harms and addressing FASD are both identified as priorities in the National
Framework for Action to Reduce the Harms Associated with Alcohol, Other Drugs and Substances in
Canada.34 The National Alcohol Strategy (NAS) was created in 2007 in a process led by the Canadian
Centre on Substance Use and Addiction, Health Canada and the Alberta Alcohol and Drug Abuse
Commission to address the harms from alcohol. Since then, three provinces (Nova Scotia, Manitoba
and Alberta) have developed alcohol strategies and at least one other province (Ontario) is in the
process of developing one. British Columbia has a provincial approach to alcohol policy.
A number of resources to support the implementation of the NAS recommendations have been
developed since its adoption. For example:
The LRDGs, which provide the cornerstone for undertaking a variety of health promotion,
prevention and education initiatives, have been developed for Canadians and have been tailored
for specific populations (youth, women) and issues (cancer, chronic illnesses).
The NAS Advisory Committee reached consensus on standard drink labelling and education
guidelines and documented them.35
A comprehensive alcohol screening, brief intervention and referral resource has been available
since 2012.††
A comprehensive set of recommendations for social reference pricing for alcohol sold from off-
premise retail outlets (liquor stores) was released by the NAS Advisory Committee in 2015.36
The Canadian Postsecondary Education Partnership — Alcohol Harms (PEP-AH) officially launched
in June 2017.‡‡ PEP-AH is a network of universities and colleges from across Canada that have
partnered with the Canadian Centre on Substance Use and Addiction to support nation-wide
campus efforts to reduce the harms related to alcohol consumption.
Additional Resources
Low-Risk Alcohol Drinking Guidelines
Women and Alcohol (LRDG summary)
Alcohol and Youth (LRDG summary)
Cancer and Alcohol (LRDG summary)
Impaired Driving in Canada
Short-term Administrative Sanctions for Alcohol and Drug Use by Drivers
†† Available at www.sbir-diba.ca.
‡‡ See www.pepah.ca for more information.
Canadian Drug Summary: Alcohol
Canadian Centre on Substance Use and Addiction • Centre canadien sur les dépendances et l’usage de substances Page 14
_______________________________________________________
1 Stockwell, T., Beirness, D., Butt, P., Gliksman, L., & Paradis, C. (2012). Canada’s low-risk drinking guidelines. Canadian Medical
Association Journal, 184(1), 75–75.
2 Rehm, J., Baliunas, D., Brochu, S., Fischer, B., Gnam, W., Patra, J., ... Taylor, B. (2006). The costs of substance abuse in Canada 2002.
Ottawa, Ont.: Canadian Centre on Substance Use and Addiction.
3 Butt, P., Beirness, D., Gliksman, L., Paradis, C., & Stockwell, T. (2011). Alcohol and health in Canada: a summary of evidence and
guidelines for low-risk drinking. Ottawa, Ont.: Canadian Centre on Substance Abuse.
4 Foran, H. M., & O'Leary, K. D. (2008). Alcohol and intimate partner violence: a meta-analytic review. Clinical Psychology Review, 28(7),
1222–1234.
5 Sher, L. (2006). Alcohol consumption and suicide. Quarterly Journal of Medicine, 99(1), 57–61.
6 Boles, S. M., & Miotto, K. (2003). Substance abuse and violence: a review of the literature. Aggression and Violent Behavior, 8(2), 155-
174.
7 Rehm, J. (2011). The risks associated with alcohol use and alcoholism. Alcohol Research & Health, 34(2), 135–143.
8 Canadian Centre on Substance Use and Addiction. (2017). Short-term Administrative Sanctions for Alcohol and Drug Use by Drivers.
Ottawa, Ont: Author.
9 Health Canada. (2016). Canadian Tobacco, Alcohol and Drugs Survey: summary of results for 2015. Ottawa, Ont.: Author.
10 Health Canada. (2015). Canadian Tobacco, Alcohol and Drugs Survey: summary of results for 2013. Ottawa, Ont.: Author.
11 Health Canada. (2011). Canadian Alcohol and Drug Use Monitoring Survey: summary of results for 2010. Ottawa, Ont.: Author.
12 Health Canada. (2012). Canadian Alcohol and Drug Use Monitoring Survey: summary of results for 2011. Ottawa, Ont.: Author.
13 Health Canada. (2013). Canadian Alcohol and Drug Use Monitoring Survey: summary of results for 2012. Ottawa, Ont.: Author.
14 Pennay, A., Livingston, M., & MacLean, S. (2015). Young people are drinking less: it is time to find out why. Drug and Alcohol Review,
34(2), 115–118.
15 Health Canada. (2016). Canadian Student Tobacco, Alcohol and Drugs Survey: detailed tables for 2014–15. Ottawa, Ont.: Government
of Canada.
16 American College Health Association. (2016). National College Health Assessment II: Canadian reference group executive summary,
Spring 2016. Hanover, Md.: Author.
17 World Health Organization. (2014). Global Health Observatory Data Repository: alcohol consumers, past 12 months by country.
Retrieved from apps.who.int/gho/data/view.main.52480.
18 Statistics Canada. (2017). Table 183-0023: Sales and per capita sales of alcoholic beverages by liquor authorities and other retail
outlets, by value, volume, and absolute volume. Retrieved from www5.statcan.gc.ca/cansim/a26?lang=eng&id=1830023.
190 Statistics Canada. (2017). Control and sale of alcoholic beverages, for the year ending March 31, 2016. Retrieved from
www.statcan.gc.ca/daily-quotidien/170502/dq170502a-eng.htm.
20 Zhao, J., Stockwell, T., & Thomas, G. (2015). An adaptation of the Yesterday Method to correct for under-reporting of alcohol
consumption and estimate compliance with Canadian low-risk drinking guidelines. Canadian Journal of Public Health, 106(4), 204–209.
21 Brown, S.W., Ward, M.M.H., Vanlaar, G.M., & Robertson, R.D. (2016). Road Safety Monitor 2016: drinking and driving in Canada. Ottawa,
Ont.: Traffic Injury Research Foundation.
22 Kathryn, K. (2017). Police-reported crime statistics in Canada, 2016. Ottawa, Ont.: Statistics Canada.
23 Statistics Canada. (2017). Table 252-0051: Incident-based crime statistics, by detailed violations. Retrieved from
www5.statcan.gc.ca/cansim/a26?lang=eng&id=2520051.
24 Canadian Centre on Substance Use and Addiction. (2017). Impaired driving in Canada. Ottawa, Ont: Author.
25 Shield, K.D., Parry, C., & Rehm, J. (2014). Chronic diseases and conditions related to alcohol use. Alcohol Research: Current Reviews,
35(2), 155–171.
26 Danaei, G., Vander Hoorn, S., Lopez, A.D., Murray, C.J., Ezzati, M., & Comparative Risk Assessment Collaborating Group. (2005). Causes
of cancer in the world: comparative risk assessment of nine behavioural and environmental risk factors. The Lancet, 366(9499), 1784–
1793.
27 Boffetta, P., Hashibe, M., La Vecchia, C., Zatonski, W., & Rehm, J. (2006). The burden of cancer attributable to alcohol drinking.
International Journal of Cancer, 119(4), 884–887.
28 Boffetta, P., & Hashibe, M. (2006). Alcohol and cancer. The Lancet Oncology, 7(2), 149–156.
29 Statistics Canada. (2017). Table 102-0551: Deaths and mortality rate, by selected grouped causes, age group and sex, Canada.
Retrieved from http://www5.statcan.gc.ca/cansim/a47.
30 Statistics Canada. (2013). Table 105-1101: Mental Health Profile, Canadian Community Health Survey — Mental Health (CCHS), by age
group and sex, Canada and provinces. Retrieved from www5.statcan.gc.ca/cansim/a26?lang=eng&id=1051101.
31 Canadian Institute for Health Information. (2017). Alcohol harm in Canada: examining hospitalizations entirely caused by alcohol and
strategies to reduce alcohol harm. Ottawa, Ont.: Author.
32 Young, M.M., & Jesseman, R. (2014). The impact of substance use disorders on hospital use. Ottawa, Ont.: Canadian Centre on
Substance Use and Addiction.
Canadian Drug Summary: Alcohol
Canadian Centre on Substance Use and Addiction • Centre canadien sur les dépendances et l’usage de substances Page 15
33 Pirie, T., Wallingford, S.C., Di Gioacchino, L.A., McQuaid, R.J., & National Treatment Indicators Working Group. (2016). National
Treatment Indicators report: 2013–2014 data. Ottawa, Ont.: Canadian Centre on Substance Use and Addiction.
34 Health Canada & Canadian Centre on Substance Use and Addiction. (2005). The national framework for action to address the harms
from alcohol, and other drugs and substances in Canada. Ottawa, Ont.: Canadian Centre on Substance Use and Addiction.
35 National Alcohol Strategy Advisory Committee. (2015). What is a drink? Communicating drink information to the consumer. Ottawa, Ont.:
Canadian Centre on Substance Use and Addiction.
36 National Alcohol Strategy Advisory Committee. (2015). Social reference prices for alcohol: a tool for Canadian governments to promote a
culture of moderation. Ottawa, Ont.: Canadian Centre on Substance Use and Addiction.
ISBN 978-1-77178-449-8 © Canadian Centre on Substance Use and Addiction 2017
CCSA was created by Parliament to provide national leadership to address substance use in
Canada. A trusted counsel, we provide national guidance to decision makers by harnessing
the power of research, curating knowledge and bringing together diverse perspectives.
CCSA activities and products are made possible through a financial contribution from
Health Canada. The views of CCSA do not necessarily represent the views of the
Government of Canada.