Embed Size (px)
Citation preview
1
Table of Contents
Table of Contents
Investment Thesis: Alcoa produces 24% of the world’s aluminum. The company is refocusing on their upstream bauxite mining and refinery business and phasing out their downstream production business. Since the economics behind mining and alumina refining operations is more cost-effective this will keep the company on track to improve their overall profitability in the future and allow for further long term growth opportunities.
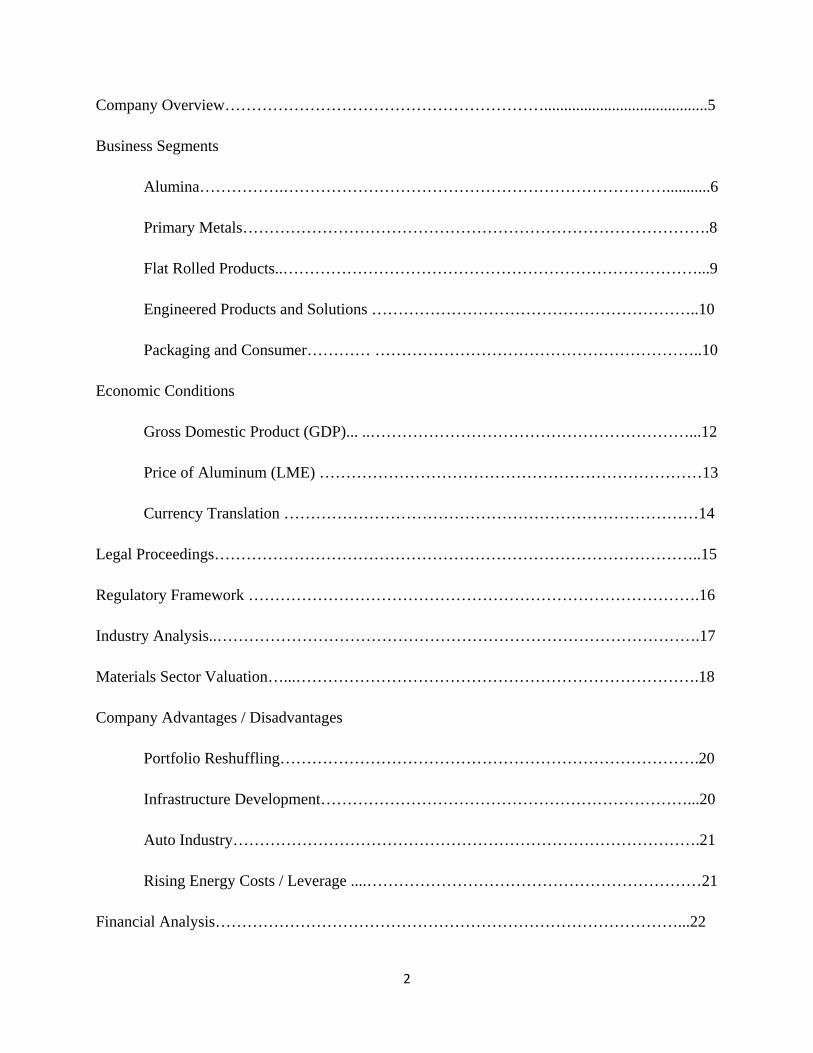
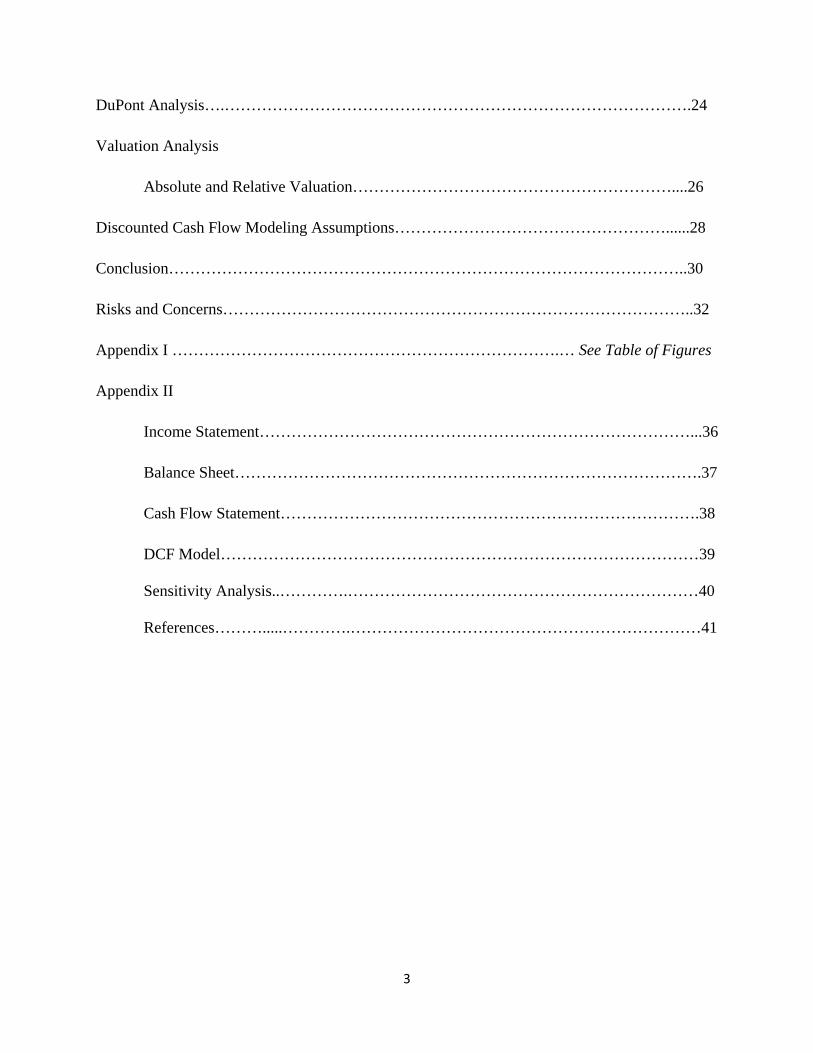
Aluminum prices have had steady if not large increases since 2004 mainly because of demand from China. This is reflected in Alcoa’s 52 week high of $44.77 (May 2008). The greatest catalyst for Alcoa’s stock price is their correlation with the overall condition of the economy. Because of such high uncertainty and a projected compound annual sales growth rate of negative 4% from 2008 to 2014, share price appreciation remains apathetic. Since the release of Alcoa’s 10Q the stock has risen nearly 25% and I personally see tremendous upside to the stock as the economy stabilizes and eventual growth.
Price Performance
Stock Analyst: Theo Constantinou Fisher College of Business The Ohio State University Columbus, OH Contact: 330.620.9361 Email: [email protected] Fund: OSU SIM Class Fund Manager: Chris Henneforth, CFA Recommendation:
BUY Sector: Materials Industry: Aluminum Stock Data: Ticker: AA (NYSE)
Current Price: $10.21
Target Price: $18.25
52 Wk Range: $4.97 – $44.77
Avg Volume (3m): 44,769,000
Market Capitalization: 9.91B
Shares Outstanding: 974,276,000
Beta: 1.97
YTD Return: -8.91%
Dividend Yield: 1.20%
EPS: -0.68
Trailing PE: 41.7
Forward PE (median): 13.2
Annual EPS Est (Dec 09): -0.98
Price to Sales: 0.4
Price to Book: 0.7
2
Company Overview…………………………………………………….........................................5
Business Segments
Alumina…………….………………………………………………………………...........6
Primary Metals…………………………………………………………………………….8
Flat Rolled Products..……………………………………………………………………...9
Engineered Products and Solutions ……………………………………………………..10
Packaging and Consumer………… ……………………………………………………..10
Economic Conditions
Gross Domestic Product (GDP)... ..……………………………………………………...12
Price of Aluminum (LME) ………………………………………………………………13
Currency Translation ……………………………………………………………………14
Legal Proceedings………………………………………………………………………………..15
Regulatory Framework ………………………………………………………………………….16
Industry Analysis..……………………………………………………………………………….17
Materials Sector Valuation…...………………………………………………………………….18
Company Advantages / Disadvantages
Portfolio Reshuffling…………………………………………………………………….20
Infrastructure Development……………………………………………………………...20
Auto Industry…………………………………………………………………………….21
Rising Energy Costs / Leverage ....………………………………………………………21
Financial Analysis……………………………………………………………………………...22
3
DuPont Analysis….…………………………………………………………………………….24
Valuation Analysis
Absolute and Relative Valuation……………………………………………………....26
Discounted Cash Flow Modeling Assumptions……………………………………………......28
Conclusion……………………………………………………………………………………..30
Risks and Concerns……………………………………………………………………………..32
Appendix I ……………………………………………………………….… See Table of Figures
Appendix II
Income Statement………………………………………………………………………...36
Balance Sheet…………………………………………………………………………….37
Cash Flow Statement…………………………………………………………………….38
DCF Model………………………………………………………………………………39
Sensitivity Analysis..………….…………………………………………………………40 References……….....………….…………………………………………………………41
4
Table of Figures
Graphs Graph 1 – Aluminum Price YOY and Over 10 Year Horizon…………………………………....7 Graph 2 – Alcoa’s Revenue by Segment / Geographic Region .......…………………………...11 Graph 3 – Real GDP Projection ...……………………………………………………………….12 Graph 4 – Primary Aluminum Inventories vs. Days Inventory………………………………….13 Graph 5 – 10 Year London Metal Exchange Prices (Aluminum)……………………………….14 Graph 6 – Materials Sector vs. S&P 500 ………………………………………………………..18 Graph 7 – Metal Prices of Steel, Aluminum, Copper and Nickel ...……………………………..21 Graph 8 – EPS and Future Growth ……………………………. ...……………………………..30 Graph 9 – China GDP …………... ……………………………. ...……………………………..31 Graph 10 – Chinese Aluminum Consumption .…………………. .……………………………..31 Graph 11 – OECD Leading Economic Indicators ...……………. .……………………………..33 Graph 12 – Future LT Growth of BRIC Countries ..……………. .……………………………..33 Graph 13 – Escalation in Long Run Marginal Cost ….…………. .……………………………..34 Graph 14 – LME Future Projection ………... .…………………. .……………………………..34 Graph 15 – Credit Suisse Future Financial Valuations ……………………………………….…35
Figures Figure 1 – World Primary Aluminum Production ……………………...………………………..8 Figure 2 – Merrill Lynch Investment Clock …….……………………...……………………….17
Tables Table 1 – Materials Sector vs. Aluminum (US Cents/Pound) – Regression Analysis…………….19 Table 2 – Materials Sector vs. S&P 500 – Regression Analysis..….…………………………….19 Table 3 – Profitability / Liquidity Ratios …………………………………………...…………….22 Table 4 – Asset Management / Leverage Ratios .…………………………………...…………….23 Table 5 – DuPont Analysis …………………... .…………………………………...…………….24 Table 6 – Alcoa Absolute Valuation ..………... .…...……………………………...……………..26 Table 7 – Comparable Analysis of AA, CENX and KALU ..……………………...……………..27 Table 8 – Long-Term Aluminum Demand Growth ...……………………………...……………..29
5
Company Overview1
In 1886, Charles Hall discovered the process of smelting aluminum. Concomitantly, halfway around the
world in France, Paul Héroult discovered the same process. The process consists of passing an electrical
current through a bath of cryolite and aluminum oxide, resulting in the metal aluminum. This procedure
is called the Hall- Héroult process and is still the only process used to make aluminum today.
Alcoa, which gets its name from the Aluminum Company of America, was founded in 1888 and is the
world’s third largest aluminum producer behind Rio Tinto Alcan and Rusal. Alcoa are the world leader in
the production and management of primary aluminum, fabricated aluminum and alumina. Alcoa serves
numerous markets, including aerospace, automotive, packaging, building and construction, commercial
transportation, and industry. Additionally, Alcoa produces flat-rolled products, hard alloy extrusions, and
forgings. Alcoa conducts operations in 44 countries on 5 continents. As of December 31, 2008 they have
107,000 employees.
In May 2008, Klaus Kleinfeld was appointed as Alcoa’s President and Chief Executive Officer. A proven
leader with outstanding international credentials and an existing board member of Alcoa, Kleinfeld was
the ideal leader to guide Alcoa through the current economic crisis and shape its bright future.
During spring, 2007, Alcoa conducted a hostile takeover for $27 billion to acquire Alcan. A successful
takeover would have undoubtedly formed the world’s largest aluminum producer. The takeover bid,
however, was withdrawn after Alcoa’s major competitor Rio Tinto announced a friendly takeover in
summer, 2007, forming what is now currently Rio Tinto Alcan.
For the 1Q of 2009, Alcoa reported a loss of $497 million, or $0.61 per share. This was due to weak
aluminum prices and volume. Revenue fell 13% from the previous quarter. The company raised $1.3
billion in common equity and convertible bonds to address liquidity issues. This stock sale has been
extremely dilutive to existing shareholders. Aluminum inventory approached historically high levels that
created trouble for a rebound in aluminum prices. Cost-cutting and liquidity preservation should and will
be the main priority for Alcoa in 2009.
6
Business Segments2 Alcoa has five primary business segments that generate revenue for the company: Alumina, Primary
Metals, Flat-Rolled Products, Engineered Products and Solutions, Packaging and Consumer.
Alumina
Aluminum is one of the most plentiful elements in the earth’s crust. Aluminum is produced primarily
from bauxite, an ore containing aluminum in the form of aluminum oxide, commonly referred to as
alumina. Aluminum is made by extracting alumina from bauxite and then removing oxygen from the
alumina. Alcoa processes most of the bauxite that it mines into alumina. Alumina is sold directly to
internal and external smelter customers worldwide or is processed into industrial chemical products.
Late in 2008, management made the decision to reduce Alcoa’s aluminum and alumina production in
response to the significant economic downturn. As a result of this decision, reductions of 750 kmt, or
18%, of annualized output from Alcoa’s global smelting system were implemented. Accordingly,
reductions in alumina output were also initiated with a plan to reduce production by 1,500 kmt-per-year
across the global refining system.
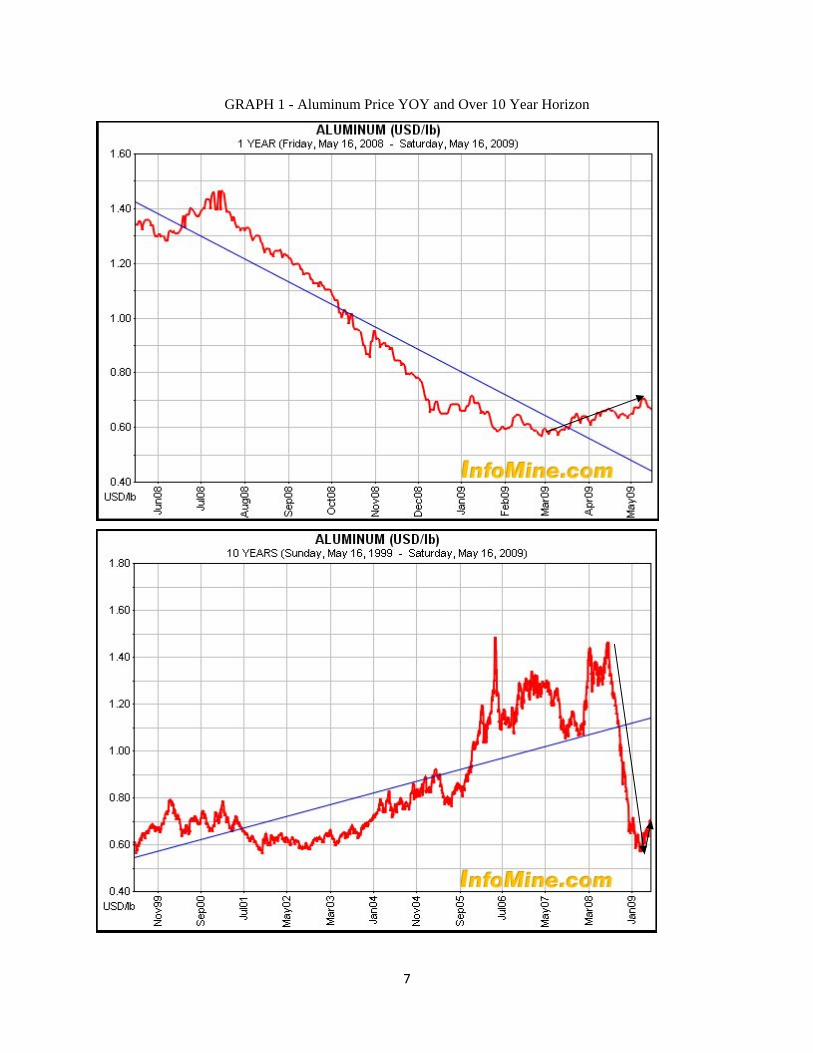
It is important to note that; sales for the 2009 first quarter decreased $2,851M, or 41%, compared with the
same period in 2008. The decline was driven mainly by three factors: (1) a drop in realized prices for
alumina (36%) and aluminum (44%), (2) decreases in volume in the downstream segments due to weak
end markets, and (3) the absence of sales from the businesses within the former Packaging and Consumer
segment ($497 in the 2008 first quarter). Alumina production decreased 11% in the 2009 first quarter
compared with the corresponding period in 2008. This illustrates the sharp decline of aluminum prices
over the past year compared to their steady growth over the past decade to show the inevitable rebound in
the global price of aluminum that directly correlates to Alcoa’s alumina production (Graph 1)3. The
downside risks associated with Alcoa should start to lighten as aluminum prices start to stabilize and
increase.
7
GRAPH 1 - Aluminum Price YOY and Over 10 Year Horizon
8
Alumina continued
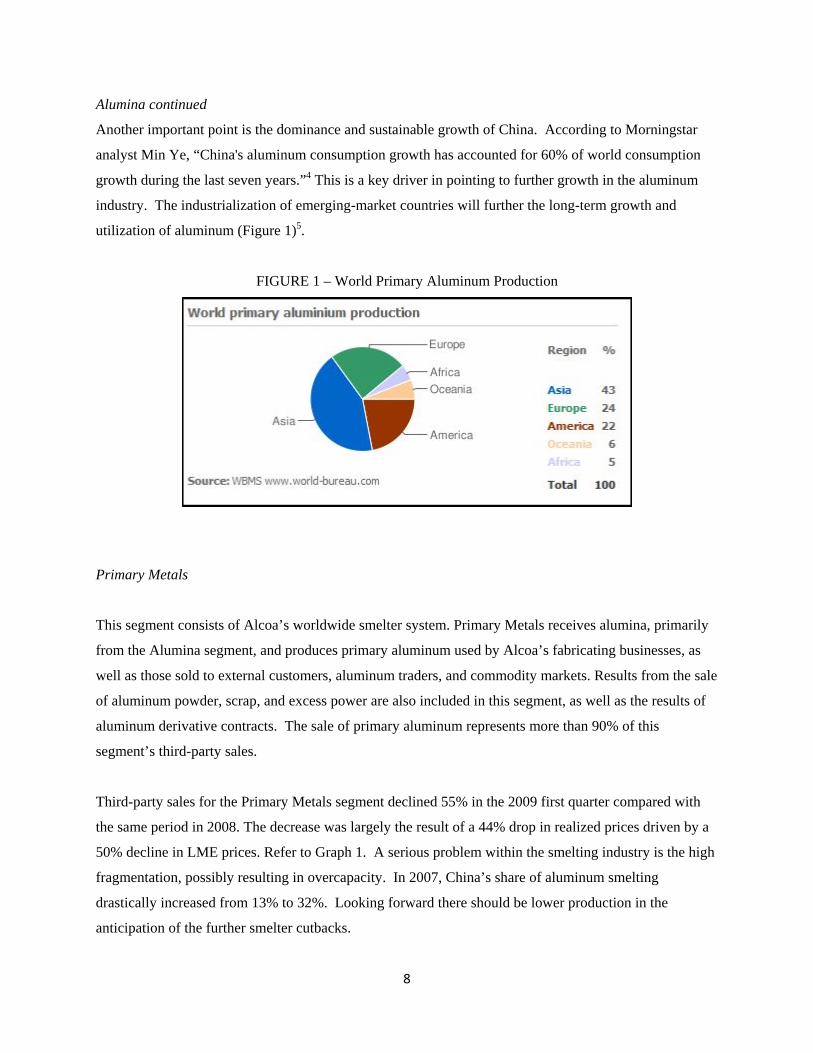
Another important point is the dominance and sustainable growth of China. According to Morningstar
analyst Min Ye, “China's aluminum consumption growth has accounted for 60% of world consumption
growth during the last seven years.”4 This is a key driver in pointing to further growth in the aluminum
industry. The industrialization of emerging-market countries will further the long-term growth and
utilization of aluminum (Figure 1)5.
FIGURE 1 – World Primary Aluminum Production
Primary Metals
This segment consists of Alcoa’s worldwide smelter system. Primary Metals receives alumina, primarily
from the Alumina segment, and produces primary aluminum used by Alcoa’s fabricating businesses, as
well as those sold to external customers, aluminum traders, and commodity markets. Results from the sale
of aluminum powder, scrap, and excess power are also included in this segment, as well as the results of
aluminum derivative contracts. The sale of primary aluminum represents more than 90% of this
segment’s third-party sales.
Third-party sales for the Primary Metals segment declined 55% in the 2009 first quarter compared with
the same period in 2008. The decrease was largely the result of a 44% drop in realized prices driven by a
50% decline in LME prices. Refer to Graph 1. A serious problem within the smelting industry is the high
fragmentation, possibly resulting in overcapacity. In 2007, China’s share of aluminum smelting
drastically increased from 13% to 32%. Looking forward there should be lower production in the
anticipation of the further smelter cutbacks.
9
Even though this is a downstream business for Alcoa it is interesting to note two things about their
smelting business: secured long-term power contracts for almost half of the global smelting system and
the successful start-up of the first ‘greenfield’ smelter in two decades.
According to United States Patent and Trademark Office Application #200600011996
New investments (called "greenfield plants" in engineering lingo) are rare (one per year to one every two years in average worldwide) due to the growing difficulty in concentrating on one site an energy source allowing for sufficiently low cost per kWh procured, for a period allowing depreciation of the huge capital costs (typically $4,500 to 5,000 per tonne/year capacity in 2000-2004). It is generally recognized that between 2000 and 2004 the world aluminum industry spent on average 2 US cents per kWh or roughly $280 per tonne of aluminum produced.
In 2008, Alcoa produced roughly 4 million tonnes. Since producing aluminum costs nearly $280 per
tonne, the developments of this ‘greenfield’ plant is detrimental for reduced cost in this segment and
future growth.
Flat-Rolled Products
The principal business of the company’s Flat-Rolled Products segment is the production and sale of
aluminum plate, sheet, foil and hard alloy extrusions. These products serve the packaging and consumer,
transportation, building and construction, distribution, aerospace and automotive markets. This segment
includes rigid container sheet (RCS), which is sold directly to customers in the packaging and consumer
market and is used to produce aluminum beverage cans. Third-party sales for the Flat-Rolled Products
segment decreased 35% in the 2009 first quarter compared with the corresponding period in 2008. This is
largely the result of a reduction in volumes across all businesses, due to weak end markets in Europe and
North America, and a decline in realized prices.
When the Euro is strong, this segment is somewhat offset due to the positive foreign currency movement.
The gradual downstream shift in Flat-Rolled Products and Primary Metals will help Alcoa focus on their
bauxite mining and refinery business.
10
Engineered Products and Solutions This segment includes titanium, aluminum, and super alloy investment castings; forgings and fasteners;
aluminum wheels; integrated aluminum structural systems; and architectural extrusions used in the
aerospace, automotive, building and construction, commercial transportation, and power generation
markets. A major problem with this segment is that it is heavily tied to the auto and construction
industries. Since these two industries are materially weak and the pending bankruptcy of General
Motors*, overall optimism is not warranted.
Some positive outlook comes from productivity in the aerospace and industrial gas turbine markets.
According to the US Department of Energy7,
Domestic and global potential markets for advanced turbines are large. At least half of all new power generating capacity added between now and 2010 is likely to use gas turbines. In addition, mid-sized turbines have tremendous potential for use as base-load, peaking, and standby/backup power in commercial and industrial settings.
The above statement from the US Department of Energy generates sanguinity for engineered products and
solutions with increased productivity and strong future demand for gas turbines.
Packaging and Consumer
On February 29, 2008, Alcoa completed the sale of its Packaging and Consumer businesses to Rank
Group Limited. The Packaging and Consumer segment no longer contains any operations. The principal products in this segment included aluminum foil; plastic wraps and bags; plastic beverage
and food closures; flexible packaging products; thermoformed plastic containers; and extruded plastic
sheet and film. Consumer products were marketed under brands including Reynolds Wrap®, Diamond®,
Baco®, and Cut-Rite®.
*General Motors, as of June 1, 2009, have filed for bankruptcy.
11
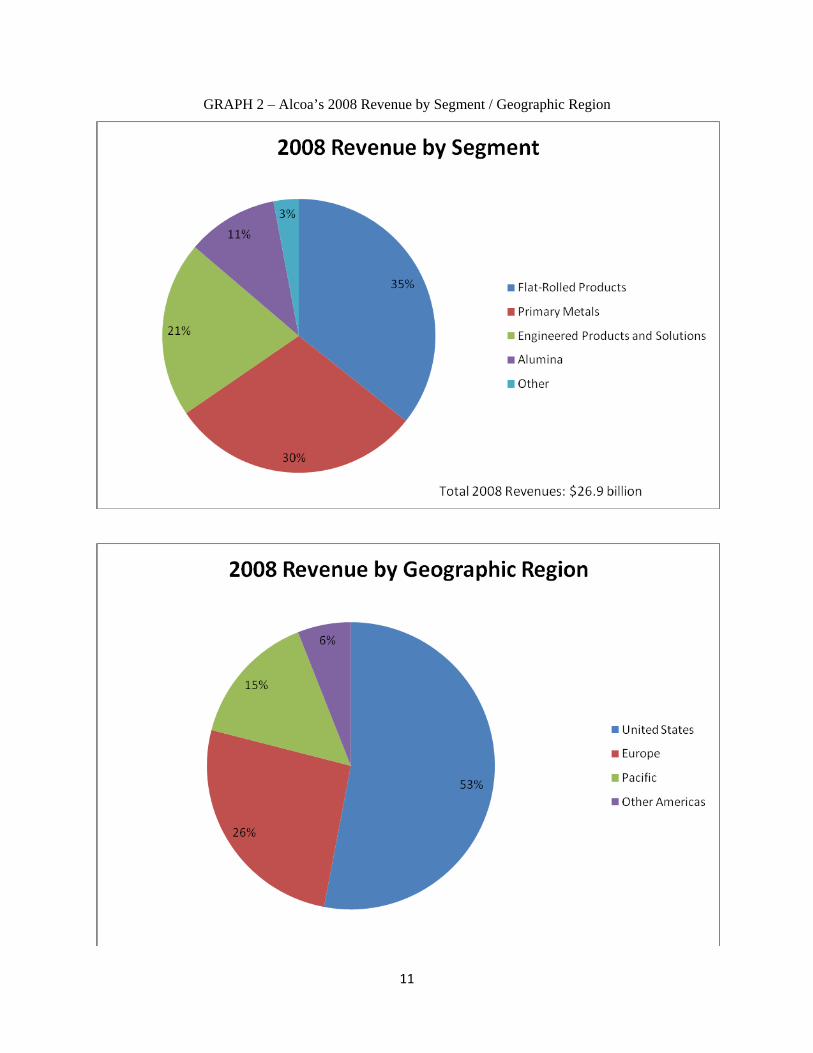
GRAPH 2 – Alcoa’s 2008 Revenue by Segment / Geographic Region
12
Macroeconomic Conditions8 Important macroeconomic factors significant to Alcoa’s performance include: industrial production in
important emerging market countries, economic growth domestically (GDP) and overall prices of
aluminum on the LME (London Mercantile Exchange). Alcoa’s primary business is cyclical in direct
correlation to economic growth and current economic conditions. When there is economic uncertainty
and a continuing recession, aluminum inventories will be high, thereby driving prices down directly and
affecting Alcoa’s ability to generate higher revenue. Another important factor for Alcoa as a multi-
national firm is fluctuation in currencies and the result this has on amount of P/L reported in their
financial statements.
Gross Domestic Product (GDP)
The overall growth of a country is determined by their GDP growth. Developing GDP shows signs of a
strong economy that would allow for development in building and construction. Currently the average
GDP growth rate is decreasing at an annual rate of -6.1% in the first quarter of 2009. This does not favor
well for Alcoa since Real GDP is decreasing; however, GDP cannot stay negative forever and when this
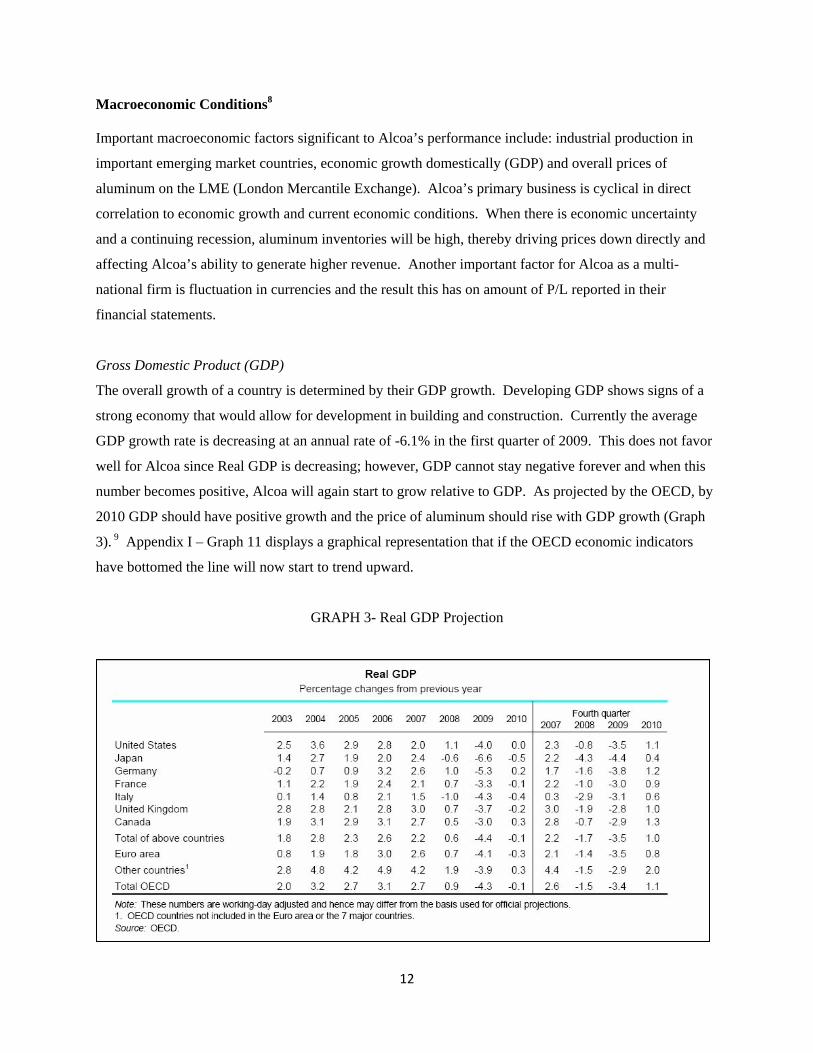
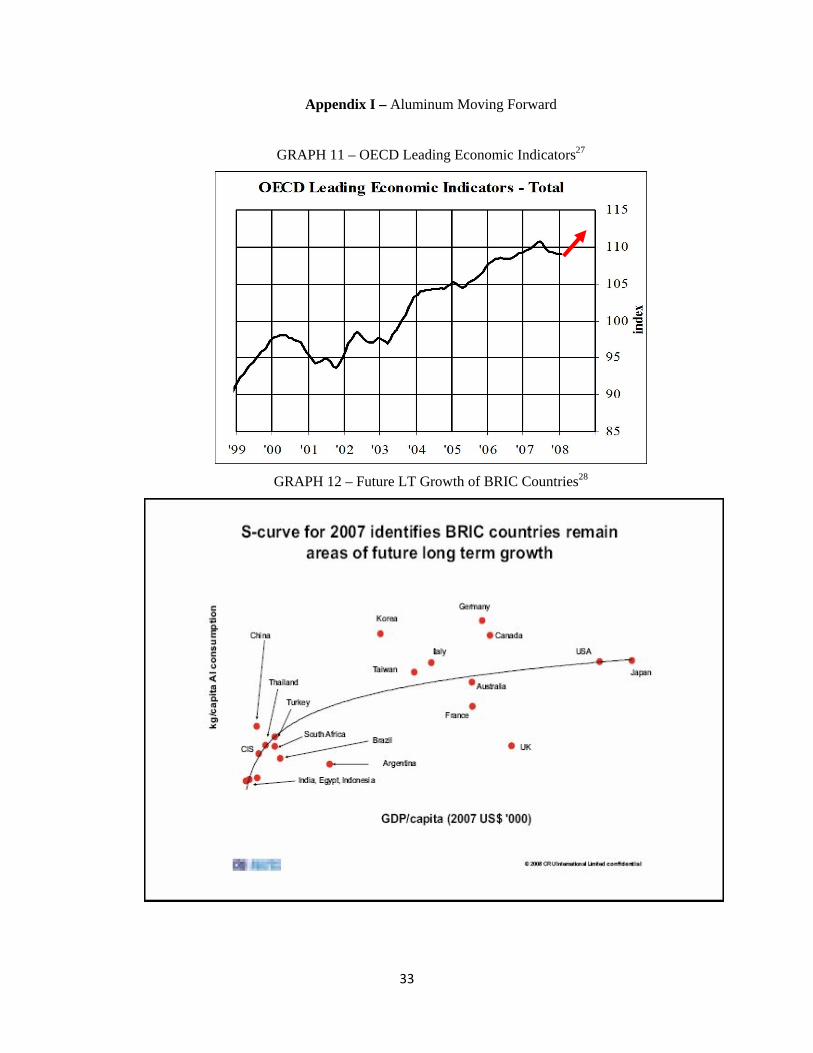
number becomes positive, Alcoa will again start to grow relative to GDP. As projected by the OECD, by
2010 GDP should have positive growth and the price of aluminum should rise with GDP growth (Graph
3). 9 Appendix I – Graph 11 displays a graphical representation that if the OECD economic indicators
have bottomed the line will now start to trend upward.
GRAPH 3- Real GDP Projection
13
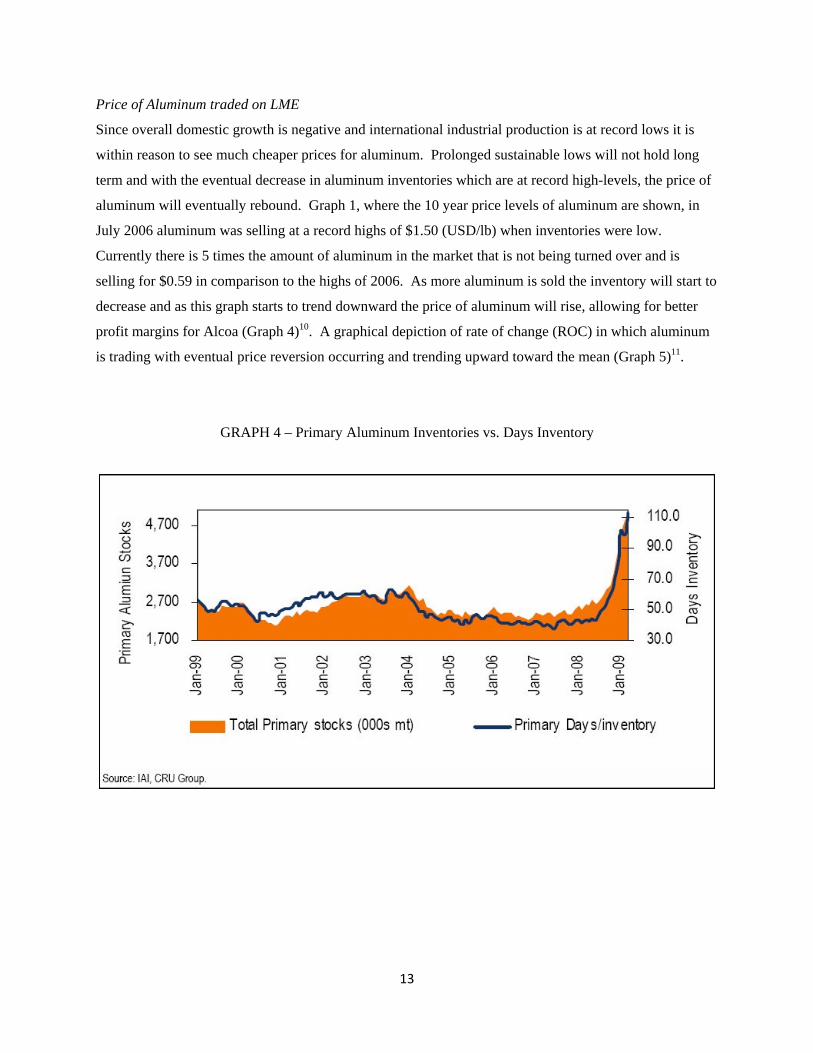
Price of Aluminum traded on LME
Since overall domestic growth is negative and international industrial production is at record lows it is
within reason to see much cheaper prices for aluminum. Prolonged sustainable lows will not hold long
term and with the eventual decrease in aluminum inventories which are at record high-levels, the price of
aluminum will eventually rebound. Graph 1, where the 10 year price levels of aluminum are shown, in
July 2006 aluminum was selling at a record highs of $1.50 (USD/lb) when inventories were low.
Currently there is 5 times the amount of aluminum in the market that is not being turned over and is
selling for $0.59 in comparison to the highs of 2006. As more aluminum is sold the inventory will start to
decrease and as this graph starts to trend downward the price of aluminum will rise, allowing for better
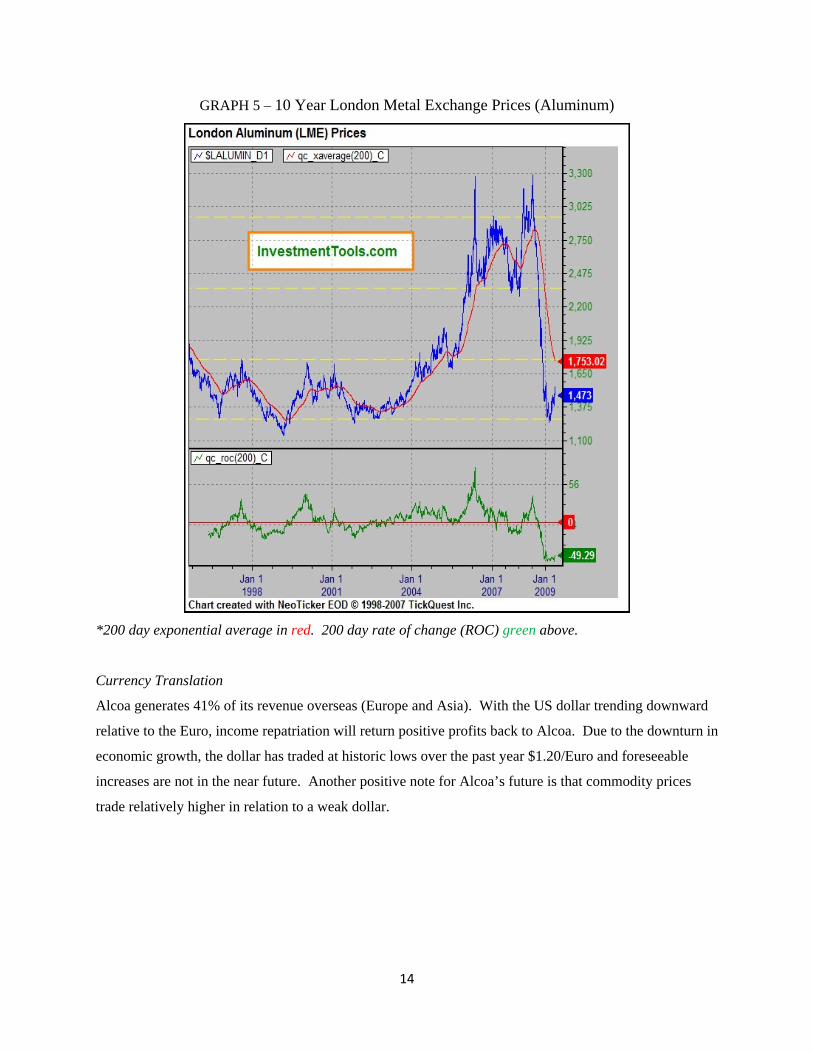
profit margins for Alcoa (Graph 4)10. A graphical depiction of rate of change (ROC) in which aluminum
is trading with eventual price reversion occurring and trending upward toward the mean (Graph 5)11.
GRAPH 4 – Primary Aluminum Inventories vs. Days Inventory
14
GRAPH 5 – 10 Year London Metal Exchange Prices (Aluminum)
*200 day exponential average in red. 200 day rate of change (ROC) green above.
Currency Translation
Alcoa generates 41% of its revenue overseas (Europe and Asia). With the US dollar trending downward
relative to the Euro, income repatriation will return positive profits back to Alcoa. Due to the downturn in
economic growth, the dollar has traded at historic lows over the past year $1.20/Euro and foreseeable
increases are not in the near future. Another positive note for Alcoa’s future is that commodity prices
trade relatively higher in relation to a weak dollar.
15
Legal Proceedings12 As previously reported, in November 2006, in Curtis v. Alcoa Inc., Civil Action No. 3:06cv448 (E.D.
Tenn.), a class action was filed by plaintiffs representing approximately 13,000 retired former employees
of Alcoa or Reynolds and spouses and dependents of such retirees alleging violation of the Employee
Retirement Income Security Act (ERISA) and the Labor-Management Relations Act by requiring
plaintiffs, beginning January 1, 2007, to pay health insurance premiums and increased co-payments and
co-insurance for certain medical procedures and prescription drugs. Plaintiffs allege these changes to
their retiree health care plans violate their rights to vested health care benefits. Plaintiffs additionally
allege that Alcoa has breached its fiduciary duty to plaintiffs under ERISA by misrepresenting to them
that their health benefits would never change. Plaintiffs seek injunctive and declaratory relief, back
payment of benefits and attorneys’ fees.
In August 2008, the court set a new trial date of March 24, 2009 and in January 2009 moved it to
September 22, 2009. Alcoa estimates that, in the event of an unfavorable outcome, the maximum
exposure would be an additional post-retirement benefit liability of approximately $300 million and
approximately $40 million of expense (includes an interest cost component) annually, on average, for the
next 11 years. Alcoa believes that it has valid defenses and intends to defend this matter vigorously.
However, at this stage of the proceeding, the company is unable predict the outcome.
This could cause issues for Alcoa moving forward. They are already facing liquidity issues; if they are
found guilty and forced to pay $300 million, this would further impact Alcoa’s liquidity.
(Refer to Risks and Concerns to Investment Thesis for further explanation).
16
Regulatory Framework13
Energy prices are a significant input in a number of Alcoa’s operations. There is growing recognition that
energy consumption is a contributor to global warming, greenhouse effects and potential climate change.
A number of governments have recognized the needs for regulatory change in response to the potential
impacts of climate change. There is current and emerging regulation, such as the mandatory renewable
energy target in Australia, or potential carbon trading regimes that will affect energy prices. This impacts
Alcoa because they have two smelters in Australia, so that alterations in energy prices could affect their
profitability. Alcoa will likely see changes in the margins of greenhouse gas-intensive assets and energy-
intensive assets as a result of regulatory impacts in those countries in which the company operates.
Assessments of the potential impact of future climate change regulation are uncertain, given the wide
scope of potential regulatory change in countries in which Alcoa operates.
The potential physical impacts of climate change on the company’s operations are highly uncertain, and
will be unique to the geographic circumstances. These may include changes in rainfall patterns, water
shortages, sea levels, storm patterns and intensities and temperature levels. These effects may adversely
impact the cost, production and financial performance of Alcoa’s operations.
17
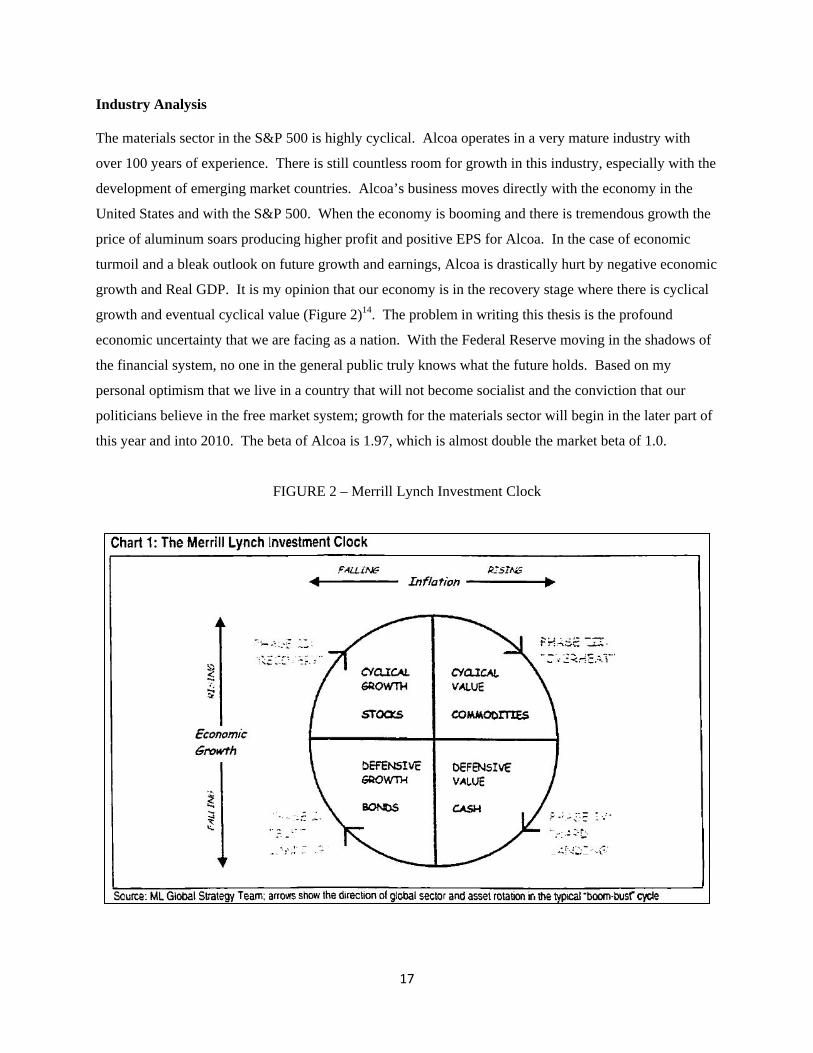
Industry Analysis The materials sector in the S&P 500 is highly cyclical. Alcoa operates in a very mature industry with
over 100 years of experience. There is still countless room for growth in this industry, especially with the
development of emerging market countries. Alcoa’s business moves directly with the economy in the
United States and with the S&P 500. When the economy is booming and there is tremendous growth the
price of aluminum soars producing higher profit and positive EPS for Alcoa. In the case of economic
turmoil and a bleak outlook on future growth and earnings, Alcoa is drastically hurt by negative economic
growth and Real GDP. It is my opinion that our economy is in the recovery stage where there is cyclical
growth and eventual cyclical value (Figure 2)14. The problem in writing this thesis is the profound
economic uncertainty that we are facing as a nation. With the Federal Reserve moving in the shadows of
the financial system, no one in the general public truly knows what the future holds. Based on my
personal optimism that we live in a country that will not become socialist and the conviction that our
politicians believe in the free market system; growth for the materials sector will begin in the later part of
this year and into 2010. The beta of Alcoa is 1.97, which is almost double the market beta of 1.0.
FIGURE 2 – Merrill Lynch Investment Clock
18
Materials Sector Valuation
It is important to understand how the Materials sector and the S&P 500 are correlated with the metals and
mining industry (aluminum). Two of Porter’s 5 forces are important here when analyzing the sector and
specifically aluminum. The first is the customer’s / high, especially in the auto industry where Alcoa sells
aluminum alloy to car manufacturers. The second is rivalry / high where global competition exists and
there are cheap imports. These mature companies in the materials sector are constantly fighting for
market share as was seen when Alcoa tried a hostile takeover of Alcan.
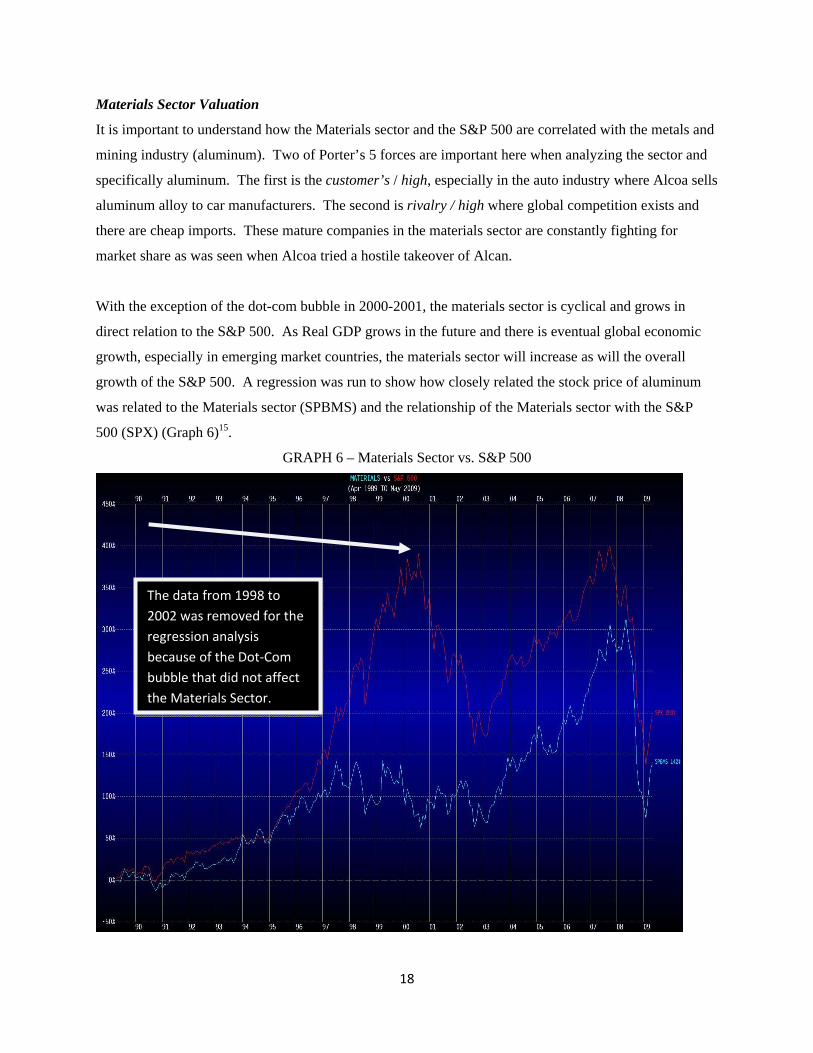
With the exception of the dot-com bubble in 2000-2001, the materials sector is cyclical and grows in
direct relation to the S&P 500. As Real GDP grows in the future and there is eventual global economic
growth, especially in emerging market countries, the materials sector will increase as will the overall
growth of the S&P 500. A regression was run to show how closely related the stock price of aluminum
was related to the Materials sector (SPBMS) and the relationship of the Materials sector with the S&P
500 (SPX) (Graph 6)15.
GRAPH 6 – Materials Sector vs. S&P 500
The data from 1998 to 2002 was removed for the regression analysis because of the Dot‐Com bubble that did not affect the Materials Sector.
19
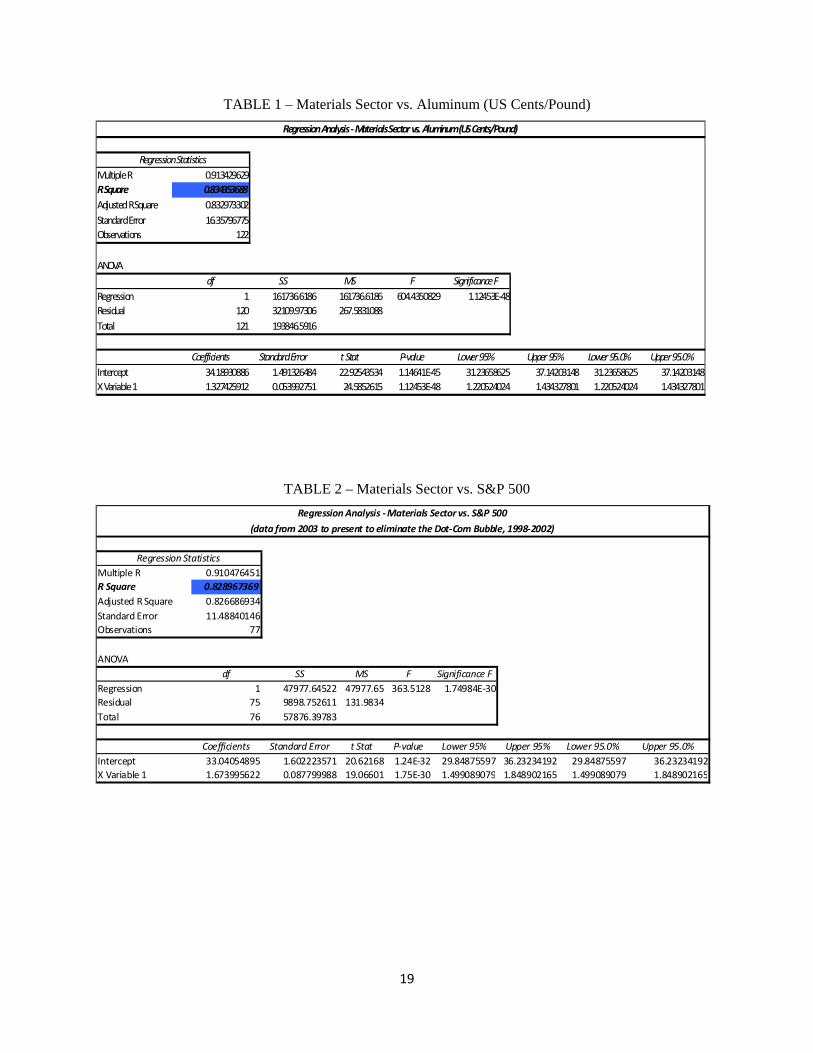
TABLE 1 – Materials Sector vs. Aluminum (US Cents/Pound)
Regression StatisticsMultiple R 0.913429629R Square 0.834353688Adjusted R Square 0.832973302Standard Error 16.35796775Observations 122
ANOVAdf SS MS F Significance F
Regression 1 161736.6186 161736.6186 604.4350829 1.12453E‐48Residual 120 32109.97306 267.5831088Total 121 193846.5916
Coefficients Standard Error t Stat P‐value Lower 95% Upper 95% Lower 95.0% Upper 95.0%Intercept 34.18930886 1.491326484 22.92543534 1.14641E‐45 31.23658625 37.14203148 31.23658625 37.14203148X Variable 1 1.327425912 0.053992751 24.5852615 1.12453E‐48 1.220524024 1.434327801 1.220524024 1.434327801
Regression Analysis ‐ Materials Sector vs. Aluminum (US Cents/Pound)
TABLE 2 – Materials Sector vs. S&P 500
Regression StatisticsMultiple R 0.910476451R Square 0.828967369Adjusted R Square 0.826686934Standard Error 11.48840146Observations 77
ANOVAdf SS MS F Significance F
Regression 1 47977.64522 47977.65 363.5128 1.74984E‐30Residual 75 9898.752611 131.9834Total 76 57876.39783
Coefficients Standard Error t Stat P‐value Lower 95% Upper 95% Lower 95.0% Upper 95.0%Intercept 33.04054895 1.602223571 20.62168 1.24E‐32 29.84875597 36.23234192 29.84875597 36.23234192X Variable 1 1.673995622 0.087799988 19.06601 1.75E‐30 1.499089079 1.848902165 1.499089079 1.848902165
Regression Analysis ‐ Materials Sector vs. S&P 500
(data from 2003 to present to eliminate the Dot‐Com Bubble, 1998‐2002)
20
Competitive Advantages / Disadvantages16
There are several drivers of growth that will positively affect Alcoa over the long-term and give them
competitive advantage. However, there are also some negative catalysts that will affect Alcoa in the
future.
Advantages
Portfolio Reshuffling
Alcoa moved to reinforce their strategic fundamental: producing aluminum. When they addressed their
largest input cost, Alcoa successfully guaranteed that 80% of smelting power would be either self-
generated or covered by long-term power contracts through 2028. In 2008, Alcoa removed the Packaging
and Consumer business to create more profit. They also obtained two high growth fastener businesses
and agreed on a cashless asset swap with their joint venture partner, Orkla. With the swap between Orkla
and Alcoa, they were able to exit the non-core business of producing soft alloy extrusions. With Alcoa in
full control of two smelters in Norway, this again made them the largest aluminum producer in the world.
The potential of their downstream business in Engineered Products and Solutions had a record year with a
23% increase in profitability, so as projections are made long-term, it might be possible that Engineered
Products and Solutions move to an upstream line of business.
Infrastructure Development
Another very important aspect of Alcoa’s business is growth in global infrastructure. With the current
government infrastructure stimulus programs in the US and Europe and the remarkable growth of cities in
developing countries, the demand for aluminum in construction and mass transit will increase
exponentially. Growth in the BRIC countries (Brazil, Russia, India and China) potentially will have the
largest impact on Alcoa over the long haul (Appendix I – Graph 11). In the global aerospace and defense
markets, aluminum will continue to be vital. Alcoa created 90% of the advanced alloys required by
Airbus and Boeing aircraft. Alcoa is also developing new partnerships among the community of defense
contractors building the next generation of military aircraft and ships. China’s new civil aircraft industry
chose Alcoa-developed high-performance alloys and products for China’s first regional jet, the ARJ21-
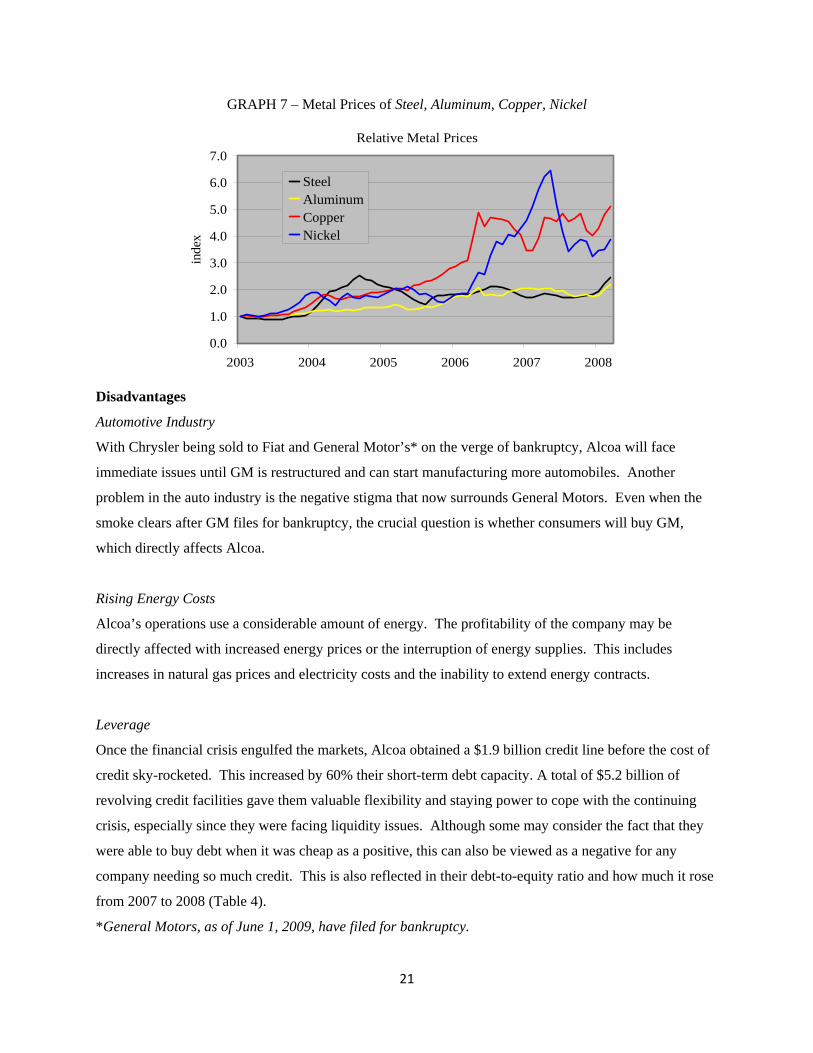
700. In addition, it is possible that aluminum can be used as a substitute metal. Next to steel, aluminum
is one of the cheapest metals and can be used as a substitute for other more expensive metals like copper
and nickel (Graph 7) 17.
21
GRAPH 7 – Metal Prices of Steel, Aluminum, Copper, Nickel
Relative Metal Prices
0.0
1.0
2.0
3.0
4.0
5.0
6.0
7.0
2003 2004 2005 2006 2007 2008
inde
xSteelAluminumCopperNickel
Disadvantages
Automotive Industry
With Chrysler being sold to Fiat and General Motor’s* on the verge of bankruptcy, Alcoa will face
immediate issues until GM is restructured and can start manufacturing more automobiles. Another
problem in the auto industry is the negative stigma that now surrounds General Motors. Even when the
smoke clears after GM files for bankruptcy, the crucial question is whether consumers will buy GM,
which directly affects Alcoa.
Rising Energy Costs
Alcoa’s operations use a considerable amount of energy. The profitability of the company may be
directly affected with increased energy prices or the interruption of energy supplies. This includes
increases in natural gas prices and electricity costs and the inability to extend energy contracts.
Leverage
Once the financial crisis engulfed the markets, Alcoa obtained a $1.9 billion credit line before the cost of
credit sky-rocketed. This increased by 60% their short-term debt capacity. A total of $5.2 billion of
revolving credit facilities gave them valuable flexibility and staying power to cope with the continuing
crisis, especially since they were facing liquidity issues. Although some may consider the fact that they
were able to buy debt when it was cheap as a positive, this can also be viewed as a negative for any
company needing so much credit. This is also reflected in their debt-to-equity ratio and how much it rose
from 2007 to 2008 (Table 4).
*General Motors, as of June 1, 2009, have filed for bankruptcy.
22
Financial Analysis / DuPont Analysis18
Financial Analysis
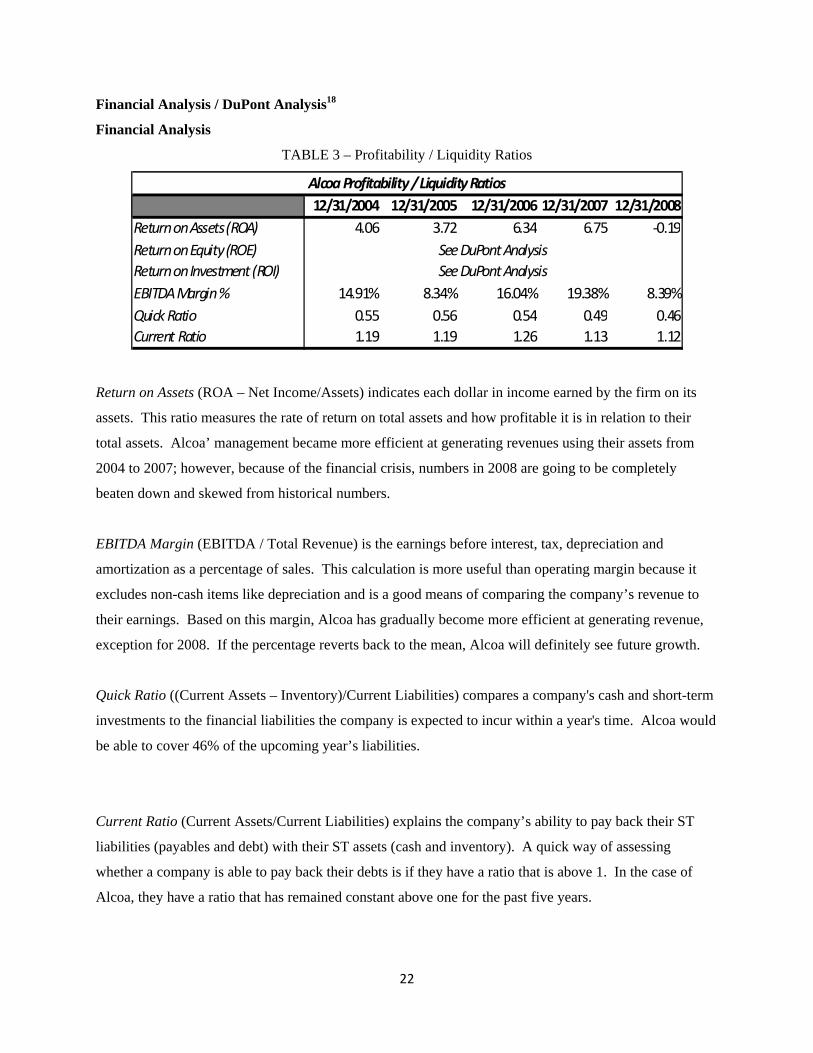
TABLE 3 – Profitability / Liquidity Ratios
12/31/2004 12/31/2005 12/31/2006 12/31/2007 12/31/2008Return on Assets (ROA) 4.06 3.72 6.34 6.75 ‐0.19Return on Equity (ROE)Return on Investment (ROI)EBITDA Margin % 14.91% 8.34% 16.04% 19.38% 8.39%Quick Ratio 0.55 0.56 0.54 0.49 0.46Current Ratio 1.19 1.19 1.26 1.13 1.12
See DuPont AnalysisSee DuPont Analysis
Alcoa Profitability / Liquidity Ratios
Return on Assets (ROA – Net Income/Assets) indicates each dollar in income earned by the firm on its
assets. This ratio measures the rate of return on total assets and how profitable it is in relation to their
total assets. Alcoa’ management became more efficient at generating revenues using their assets from
2004 to 2007; however, because of the financial crisis, numbers in 2008 are going to be completely
beaten down and skewed from historical numbers.
EBITDA Margin (EBITDA / Total Revenue) is the earnings before interest, tax, depreciation and
amortization as a percentage of sales. This calculation is more useful than operating margin because it
excludes non-cash items like depreciation and is a good means of comparing the company’s revenue to
their earnings. Based on this margin, Alcoa has gradually become more efficient at generating revenue,
exception for 2008. If the percentage reverts back to the mean, Alcoa will definitely see future growth.
Quick Ratio ((Current Assets – Inventory)/Current Liabilities) compares a company's cash and short-term
investments to the financial liabilities the company is expected to incur within a year's time. Alcoa would
be able to cover 46% of the upcoming year’s liabilities.
Current Ratio (Current Assets/Current Liabilities) explains the company’s ability to pay back their ST
liabilities (payables and debt) with their ST assets (cash and inventory). A quick way of assessing
whether a company is able to pay back their debts is if they have a ratio that is above 1. In the case of
Alcoa, they have a ratio that has remained constant above one for the past five years.
23
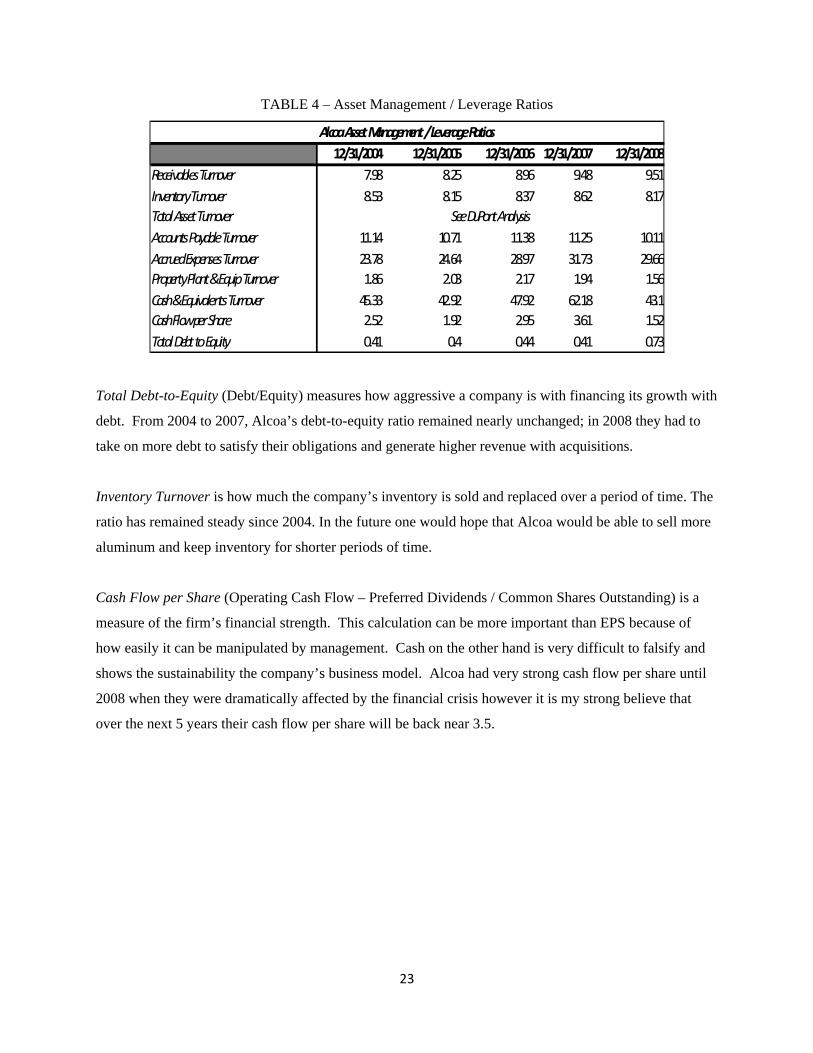
TABLE 4 – Asset Management / Leverage Ratios
12/31/2004 12/31/2005 12/31/2006 12/31/2007 12/31/2008Receivables Turnover 7.98 8.25 8.96 9.48 9.51Inventory Turnover 8.53 8.15 8.37 8.62 8.17Total Asset TurnoverAccounts Payable Turnover 11.14 10.71 11.38 11.25 10.11Accrued Expenses Turnover 23.78 24.64 28.97 31.73 29.66Property Plant & Equip Turnover 1.86 2.03 2.17 1.94 1.56Cash & Equivalents Turnover 45.33 42.92 47.92 62.18 43.1Cash Flow per Share 2.52 1.92 2.95 3.61 1.52Total Debt to Equity 0.41 0.4 0.44 0.41 0.73
See DuPont Analysis
Alcoa Asset Management / Leverage Ratios
Total Debt-to-Equity (Debt/Equity) measures how aggressive a company is with financing its growth with
debt. From 2004 to 2007, Alcoa’s debt-to-equity ratio remained nearly unchanged; in 2008 they had to
take on more debt to satisfy their obligations and generate higher revenue with acquisitions.
Inventory Turnover is how much the company’s inventory is sold and replaced over a period of time. The
ratio has remained steady since 2004. In the future one would hope that Alcoa would be able to sell more
aluminum and keep inventory for shorter periods of time.
Cash Flow per Share (Operating Cash Flow – Preferred Dividends / Common Shares Outstanding) is a
measure of the firm’s financial strength. This calculation can be more important than EPS because of
how easily it can be manipulated by management. Cash on the other hand is very difficult to falsify and
shows the sustainability the company’s business model. Alcoa had very strong cash flow per share until
2008 when they were dramatically affected by the financial crisis however it is my strong believe that
over the next 5 years their cash flow per share will be back near 3.5.
24
DuPont Analysis
See the chart below for the complete five year DuPont analysis of Alcoa’s financial statements.
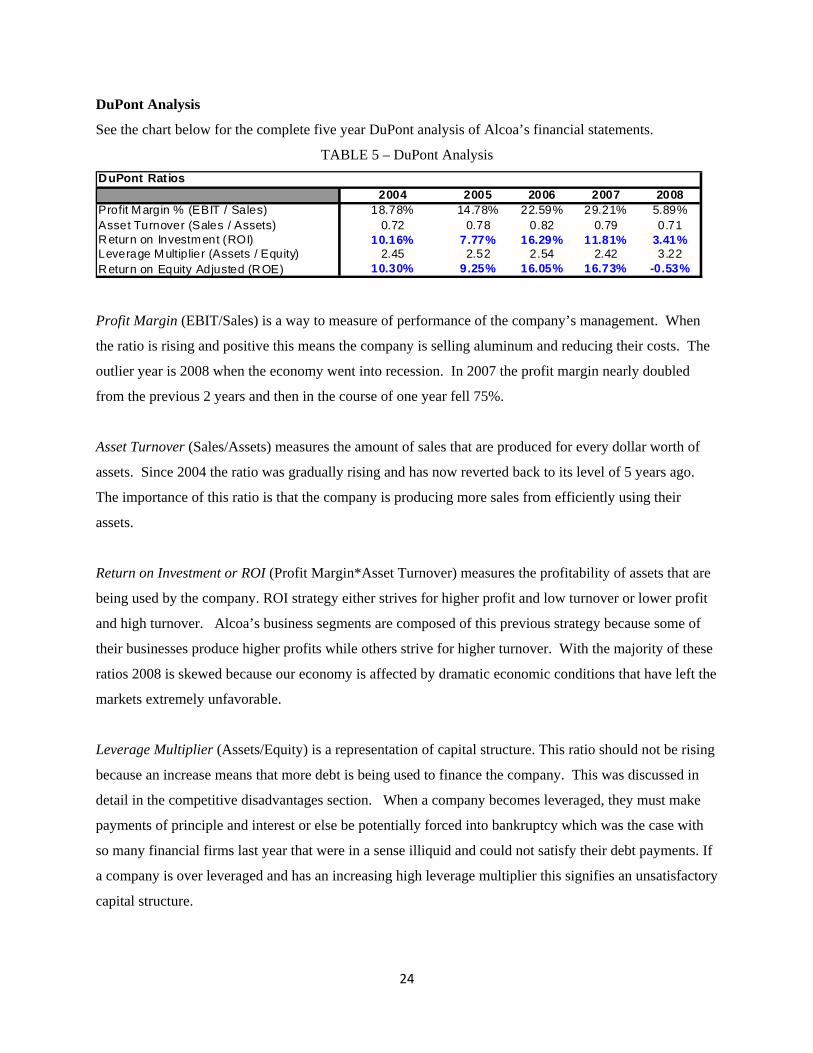
TABLE 5 – DuPont Analysis
2004 2005 2006 2007 2008Profit Margin % (EBIT / Sales) 18.78% 14.78% 22.59% 29.21% 5.89%Asset Turnover (Sales / Assets) 0.72 0.78 0.82 0.79 0.71Return on Investment (ROI) 10.16% 7.77% 16.29% 11.81% 3.41%Leverage Multiplier (Assets / Equity) 2.45 2.52 2.54 2.42 3.22Return on Equity Adjusted (ROE) 10.30% 9.25% 16.05% 16.73% -0.53%
DuPont Ratios
Profit Margin (EBIT/Sales) is a way to measure of performance of the company’s management. When
the ratio is rising and positive this means the company is selling aluminum and reducing their costs. The
outlier year is 2008 when the economy went into recession. In 2007 the profit margin nearly doubled
from the previous 2 years and then in the course of one year fell 75%.
Asset Turnover (Sales/Assets) measures the amount of sales that are produced for every dollar worth of
assets. Since 2004 the ratio was gradually rising and has now reverted back to its level of 5 years ago.
The importance of this ratio is that the company is producing more sales from efficiently using their
assets.
Return on Investment or ROI (Profit Margin*Asset Turnover) measures the profitability of assets that are
being used by the company. ROI strategy either strives for higher profit and low turnover or lower profit
and high turnover. Alcoa’s business segments are composed of this previous strategy because some of
their businesses produce higher profits while others strive for higher turnover. With the majority of these
ratios 2008 is skewed because our economy is affected by dramatic economic conditions that have left the
markets extremely unfavorable.
Leverage Multiplier (Assets/Equity) is a representation of capital structure. This ratio should not be rising
because an increase means that more debt is being used to finance the company. This was discussed in
detail in the competitive disadvantages section. When a company becomes leveraged, they must make
payments of principle and interest or else be potentially forced into bankruptcy which was the case with
so many financial firms last year that were in a sense illiquid and could not satisfy their debt payments. If
a company is over leveraged and has an increasing high leverage multiplier this signifies an unsatisfactory
capital structure.
25
Return on Equity or ROE (ROI*Leverage Multiplier) is a measure of much profit a company is able to
generate with the money invested by stakeholders. Every company, regardless of industry, should look to
maximize ROE over the long-term. An adjusted multiplier since Alcoa has high leverage to better
understand this ratio. Since the majority of ROE is produced by ROI, asset turnover and profit margin, I
did not use the leverage multiplier for this analysis.
DuPont Analysis Summary
At the end of 2007, Alcoa was in very a strong financial position due to their growing ROE. However,
with a current ROE of -0.53% it does not reflect well on the company moving forward. Alcoa is truly a
cyclical company and their ROE is not going to be at 16% anytime in the near future; however over a
long-term horizon, one could safely predict that their ROE will not be negative at the end of the year. In
addition, one would also expect their leverage multiplier to trend back down near 2.5 within the next year.
26
Equity Valuation: Multiples19
Several valuation methods were used to derive the true intrinsic value of Alcoa’s stock price: absolute -
relative valuation and a comparable valuation of other domestic aluminum companies.
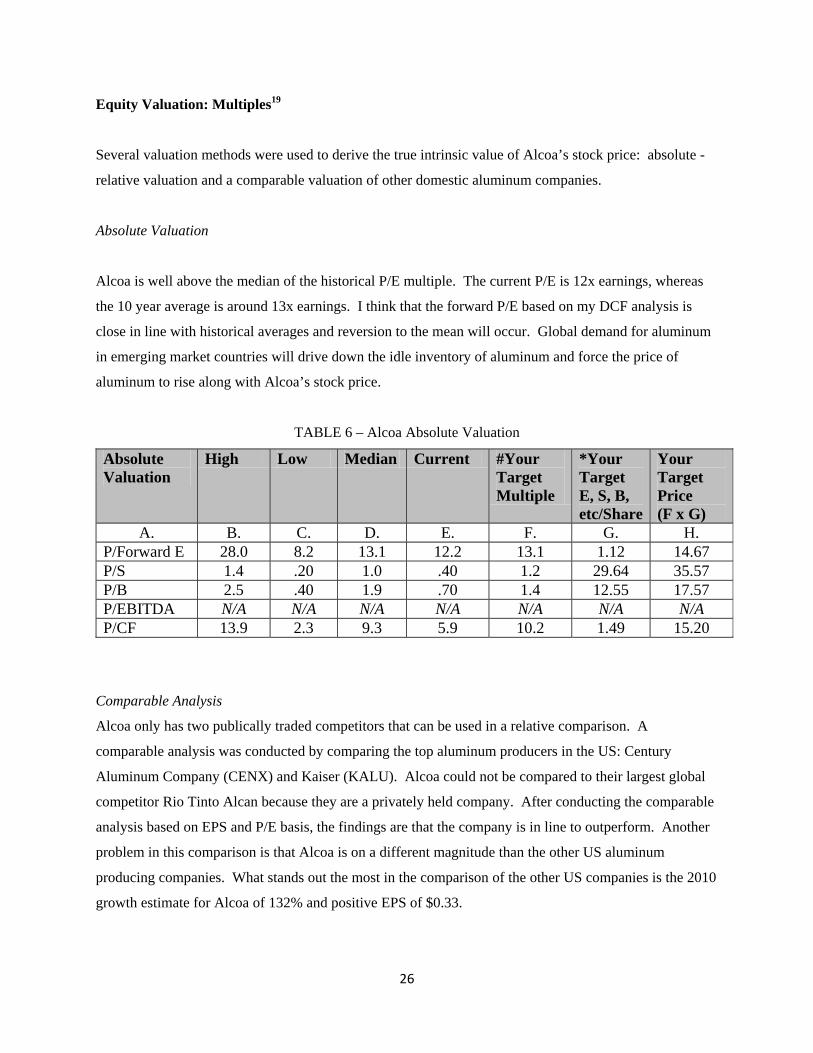
Absolute Valuation
Alcoa is well above the median of the historical P/E multiple. The current P/E is 12x earnings, whereas
the 10 year average is around 13x earnings. I think that the forward P/E based on my DCF analysis is
close in line with historical averages and reversion to the mean will occur. Global demand for aluminum
in emerging market countries will drive down the idle inventory of aluminum and force the price of
aluminum to rise along with Alcoa’s stock price.
TABLE 6 – Alcoa Absolute Valuation
Absolute Valuation
High Low Median Current #Your Target Multiple
*Your Target E, S, B, etc/Share
Your Target Price (F x G)
A. B. C. D. E. F. G. H. P/Forward E 28.0 8.2 13.1 12.2 13.1 1.12 14.67 P/S 1.4 .20 1.0 .40 1.2 29.64 35.57 P/B 2.5 .40 1.9 .70 1.4 12.55 17.57 P/EBITDA N/A N/A N/A N/A N/A N/A N/A P/CF 13.9 2.3 9.3 5.9 10.2 1.49 15.20
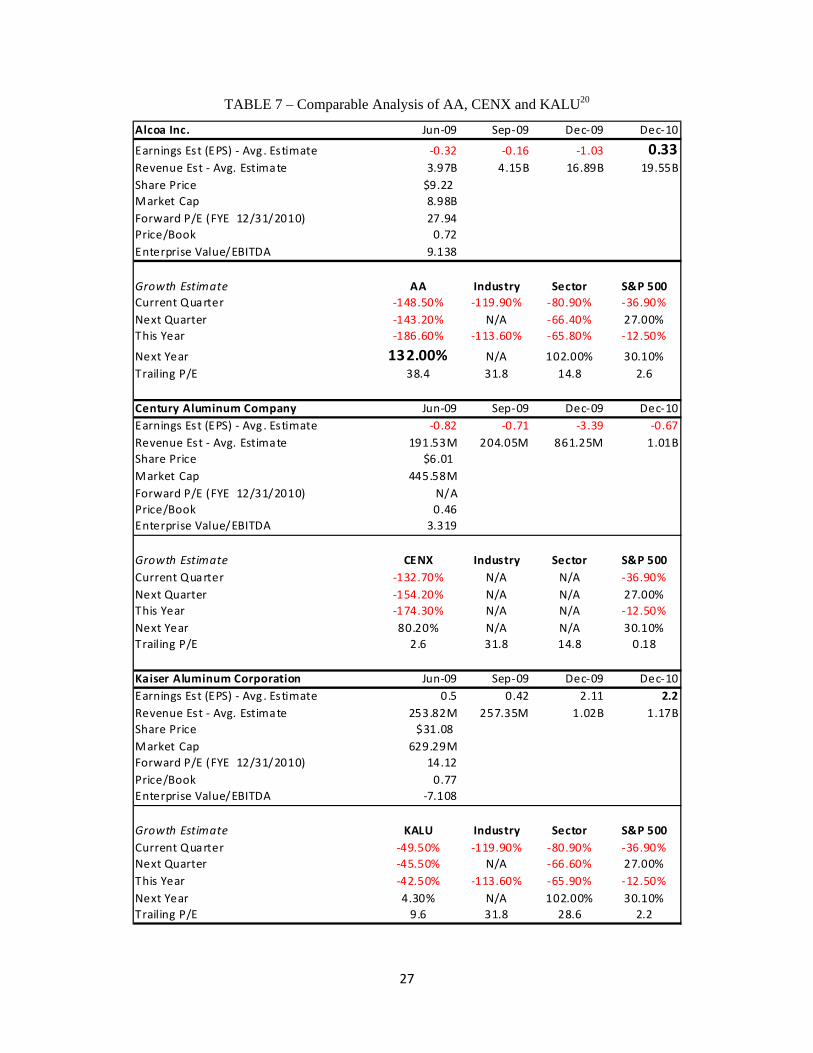
Comparable Analysis
Alcoa only has two publically traded competitors that can be used in a relative comparison. A
comparable analysis was conducted by comparing the top aluminum producers in the US: Century
Aluminum Company (CENX) and Kaiser (KALU). Alcoa could not be compared to their largest global
competitor Rio Tinto Alcan because they are a privately held company. After conducting the comparable
analysis based on EPS and P/E basis, the findings are that the company is in line to outperform. Another
problem in this comparison is that Alcoa is on a different magnitude than the other US aluminum
producing companies. What stands out the most in the comparison of the other US companies is the 2010
growth estimate for Alcoa of 132% and positive EPS of $0.33.
27
TABLE 7 – Comparable Analysis of AA, CENX and KALU20
Alcoa Inc. Jun‐09 Sep‐09 Dec‐09 Dec‐10
Earnings Est (EPS) ‐ Avg. Estimate ‐0.32 ‐0.16 ‐1.03 0.33Revenue Est ‐ Avg. Estimate 3.97B 4.15B 16.89B 19.55BShare Price $9.22Market Cap 8.98BForward P/E (FYE 12/31/2010) 27.94Price/Book 0.72Enterprise Value/EBITDA 9.138
Growth Estimate AA Industry Sector S&P 500Current Quarter ‐148.50% ‐119.90% ‐80.90% ‐36.90%Next Quarter ‐143.20% N/A ‐66.40% 27.00%This Year ‐186.60% ‐113.60% ‐65.80% ‐12.50%
Next Year 132.00% N/A 102.00% 30.10%Trailing P/E 38.4 31.8 14.8 2.6
Century Aluminum Company Jun‐09 Sep‐09 Dec‐09 Dec‐10Earnings Est (EPS) ‐ Avg. Estimate ‐0.82 ‐0.71 ‐3.39 ‐0.67Revenue Est ‐ Avg. Estimate 191.53M 204.05M 861.25M 1.01BShare Price $6.01Market Cap 445.58MForward P/E (FYE 12/31/2010) N/APrice/Book 0.46Enterprise Value/EBITDA 3.319
Growth Estimate CENX Industry Sector S&P 500Current Quarter ‐132.70% N/A N/A ‐36.90%Next Quarter ‐154.20% N/A N/A 27.00%This Year ‐174.30% N/A N/A ‐12.50%Next Year 80.20% N/A N/A 30.10%Trailing P/E 2.6 31.8 14.8 0.18
Kaiser Aluminum Corporation Jun‐09 Sep‐09 Dec‐09 Dec‐10Earnings Est (EPS) ‐ Avg. Estimate 0.5 0.42 2.11 2.2Revenue Est ‐ Avg. Estimate 253.82M 257.35M 1.02B 1.17BShare Price $31.08Market Cap 629.29MForward P/E (FYE 12/31/2010) 14.12Price/Book 0.77Enterprise Value/EBITDA ‐7.108
Growth Estimate KALU Industry Sector S&P 500Current Quarter ‐49.50% ‐119.90% ‐80.90% ‐36.90%Next Quarter ‐45.50% N/A ‐66.60% 27.00%This Year ‐42.50% ‐113.60% ‐65.90% ‐12.50%Next Year 4.30% N/A 102.00% 30.10%Trailing P/E 9.6 31.8 28.6 2.2
28
Equity Valuation: Discounted Cash Flow (DCF)
To better understand the intrinsic value of Alcoa, a DCF model was used to support the multiple valuation
estimation. The DCF model produces an implied equity value per share of $29.90. My price target is
$18.25; however, over the next 5 years, I definitely believe that $29.90 is a reasonable price target. For
further explanation I will clarify and outline the assumptions made in the DCF model.
DCF Modeling Assumptions
Revenue Forecast
The revenue forecast was generated by calculating the revenue for each business segment of
Alcoa: Alumina and Chemicals, Primary Metals, Flat-Rolled Products, Extruded and End
Products, Engineered Products, Packaging and Consumer, and Other.
Each segment’s revenue was calculated based on a historical performance growth rate that would
guardedly estimate total revenues.
Total Revenues for 2009-2011 were -6.35%, 3.16% and 10.63% respectively.
In 2006, Alcoa was trading at their 52-week highs and their revenue was near 19% so gradually
over the next three years I think that they will be recording revenues near their average as well as
increase in aluminum prices will drive their revenue higher.
As Alcoa reshuffles their portfolio and focuses more on their upstream bauxite mining and
refinery business their revenue will growth even more.
Income Statement
Net Sales: Derived from the Segment sheet of the DCF
Minority Interest: % of revenues
COGS: % of gross margin
Income Tax Expense: Assumed 30% tax rate
According to Michael J. Mauboussin, “Analysts frequently project growth (sales and margins)
independent of investments. A simple way to check for this error is to add a ROI line in the
model.”21 According to my DCF from 2009-2011, ROI increases from $724, $1,099 and $1,356
respectively (millions).
29
Balance Sheet
Cash and cash equivalents: This was produced by taking the cash generated at the end of the year
and adding it back to the cash made at the beginning of the year.
Receivables: Total Sales * Days Receivable / 365
Inventories: % of total sales
Goodwill: Calculated using historical levels
Accounts Payable: % of total sales
Due to difficulties in forecasting debt levels of Alcoa it was done so conservatively.
Summary and Relative Outputs
Operating margins of about 8.0% were used due to future sustainability. This is rational because
Alcoa’s margins were growing and I believe them to stay constant over the next decade.
Terminal Discount Rate of 10.0%
Terminal FCF Growth Rate of 3.0%
Implied terminal P/E multiple of 12.2 which is in line with the historical median P/E of 15.5.
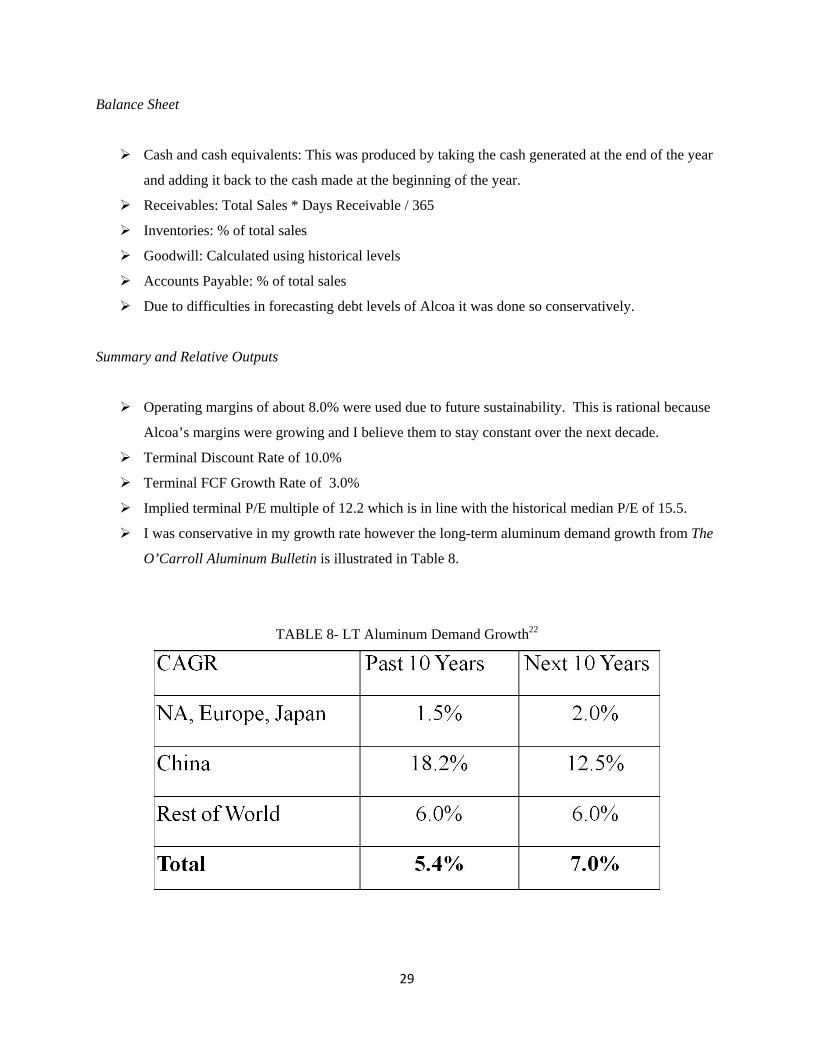
I was conservative in my growth rate however the long-term aluminum demand growth from The
O’Carroll Aluminum Bulletin is illustrated in Table 8.
TABLE 8- LT Aluminum Demand Growth22
30
CONCLUSION: BUY
Alcoa is the largest aluminum producer in the United States and produces 30% of the world’s aluminum.
The company has revenues in 5 different segments: 2009 1Q figures, Flat-rolled products (-4%), Primary
Metals (-17%), Engineered Products and Solutions (8%), and Alumina (4%).
With the current recession and the collapse of the market last fall, Alcoa’s stock price lost nearly 90% of
its value from its 52-week high of $44.24. When Alcoa reported its first quarter earnings with a net loss
of $497M compared to net income of $303M a year earlier, the market had already valued the bad news
of their earnings into the current stock price. At the close of trading on April 7th, 2009, after Alcoa
reported their 1Q loss, Alcoa’s share price rose 22 cents, to $8.01 after the official close of the NYSE.
The global recession has increasingly reduced the demand for aluminum used in automobiles and
appliances and the drop of the overall market over the past year has drastically hurt Alcoa’s stock price.
Coupled with all this bad news, aluminum prices on the LME have dropped 51 percent over the past year.
However, to preserve cash, Alcoa cut their dividend for the first time in more than two decades and plan
on selling stock, having pledged to cut costs by more than $2.4B annually. Over the next year, there may
not be much room for growth in the aluminum industry due to lack of demand for the metal; however, by
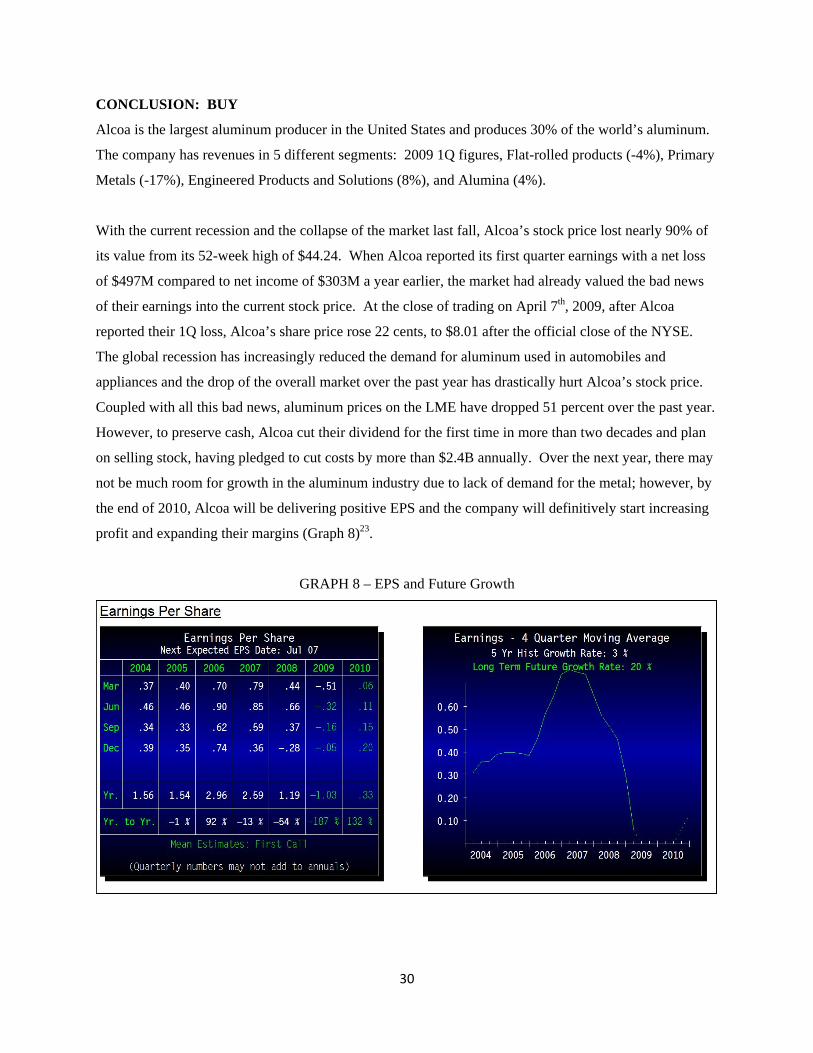
the end of 2010, Alcoa will be delivering positive EPS and the company will definitively start increasing
profit and expanding their margins (Graph 8)23.
GRAPH 8 – EPS and Future Growth
31
As aluminum supplies drop worldwide and the demand eventually starts to grow along with government
stimulus programs like the one in China, this will definitely be a huge catalyst of growth for Alcoa.
China is the world’s largest aluminum consumer, and as China grows, so will the potential for Alcoa’s
growth. With a forecasted 7% drop in global aluminum demand this year, China will be the only market
where the demand for aluminum grows and eventually as the demand increases in Europe and North
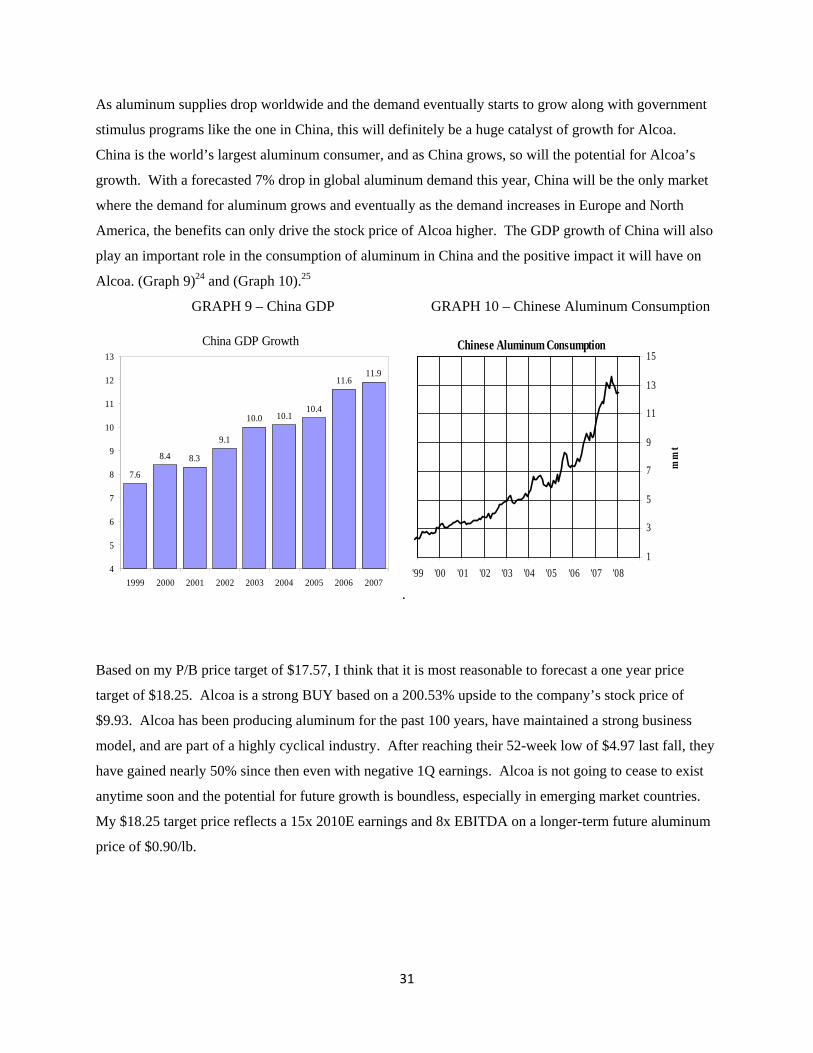
America, the benefits can only drive the stock price of Alcoa higher. The GDP growth of China will also
play an important role in the consumption of aluminum in China and the positive impact it will have on
Alcoa. (Graph 9)24 and (Graph 10).25
GRAPH 9 – China GDP GRAPH 10 – Chinese Aluminum Consumption
7.6
8.4 8.3
9.1
10.0 10.110.4
11.611.9
4
5
6
7
8
9
10
11
12
13
1999 2000 2001 2002 2003 2004 2005 2006 2007
China GDP Growth
.
1
3
5
7
9
11
13
15
'99 '00 '01 '02 '03 '04 '05 '06 '07 '08
mm
t
Chinese Aluminum Consumption
Based on my P/B price target of $17.57, I think that it is most reasonable to forecast a one year price
target of $18.25. Alcoa is a strong BUY based on a 200.53% upside to the company’s stock price of
$9.93. Alcoa has been producing aluminum for the past 100 years, have maintained a strong business
model, and are part of a highly cyclical industry. After reaching their 52-week low of $4.97 last fall, they
have gained nearly 50% since then even with negative 1Q earnings. Alcoa is not going to cease to exist
anytime soon and the potential for future growth is boundless, especially in emerging market countries.
My $18.25 target price reflects a 15x 2010E earnings and 8x EBITDA on a longer-term future aluminum
price of $0.90/lb.
32
Risks and Concerns to Investment Thesis26
The extent and relentlessness of the global economic downturn and disorder in the financial
markets.
Alcoa could be negatively affected by further declines in aluminum prices.
Downgrades in Alcoa’s credit ratings which will increase the cost at which they can borrow from
the banks and have access to the capital markets.
Alcoa consumes large amounts of energy and profitably could be affected with increasing energy
costs.
Alcoa may not be able to effectively realize its growth projects in Brazil due to lack of financing
and increasing construction costs.
Alcoa operates globally and are exposed to political and economic risks and events that are
beyond its control.
Any reduction in Chinese demand for aluminum may negatively impact Alcoa.
Fluctuations in foreign currency exchange rates and interest rates as well as inflation impact
Alcoa.
Union disputes along with pending legal disputes and other employee relations issues could
unfavorably affect Alcoa.
Alcoa is subject to a broad range of health, safety and environmental laws and regulations in the
jurisdictions in which it operates and may be exposed to substantial costs and liabilities associated
33
Appendix I – Aluminum Moving Forward
GRAPH 11 – OECD Leading Economic Indicators27
GRAPH 12 – Future LT Growth of BRIC Countries28
34
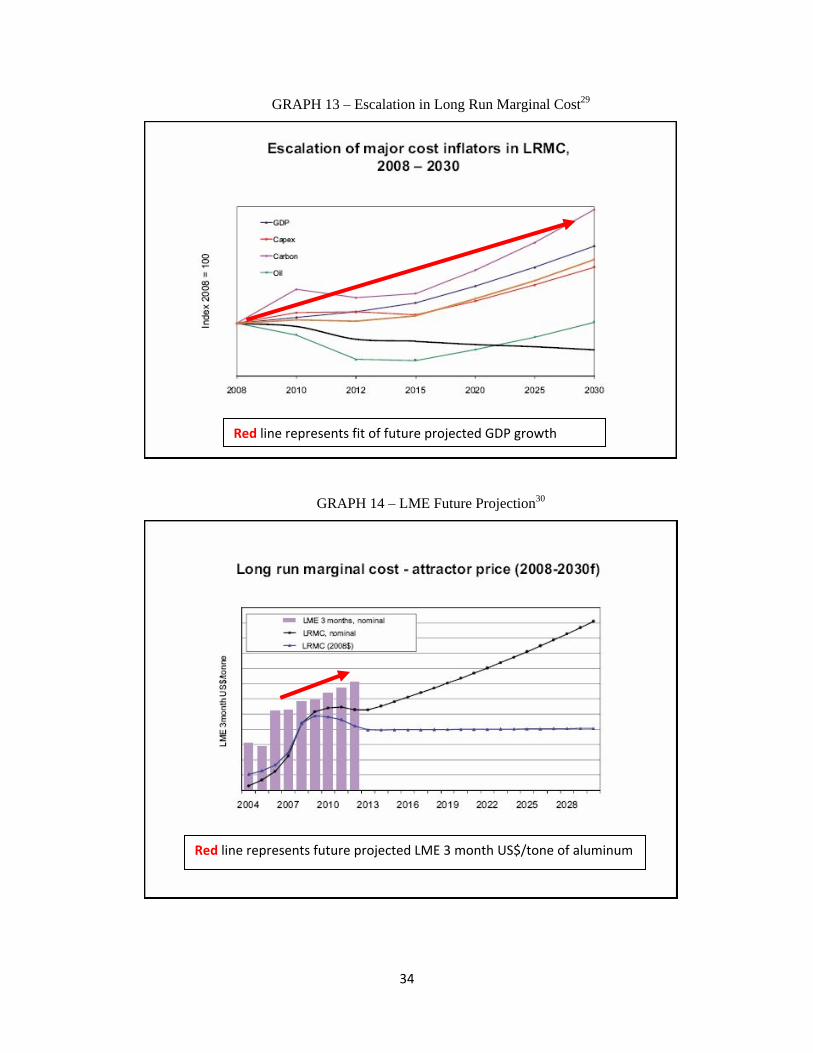
GRAPH 13 – Escalation in Long Run Marginal Cost29
GRAPH 14 – LME Future Projection30
Red line represents fit of future projected GDP growth
Red line represents future projected LME 3 month US$/tone of aluminum

35
GRAPH 15 - Credit Suisse Future Financial Valuations31
According to this future data projection by Credit Suisse analysts Davld Gagllano, Richard
Garchltorena and Sean Wright, they estimate that Alcoa should be producing normal levels of
EBITDA by 2010, along with positive EPS of $0.35 and relative P/E (%) estimate returning to
positive levels over the next 2 years. In my DCF model, the EV/EBITDA for 2010E closely
matches that of the Credit Suisse analysts, 6.46 and 4.50 respectively.
36
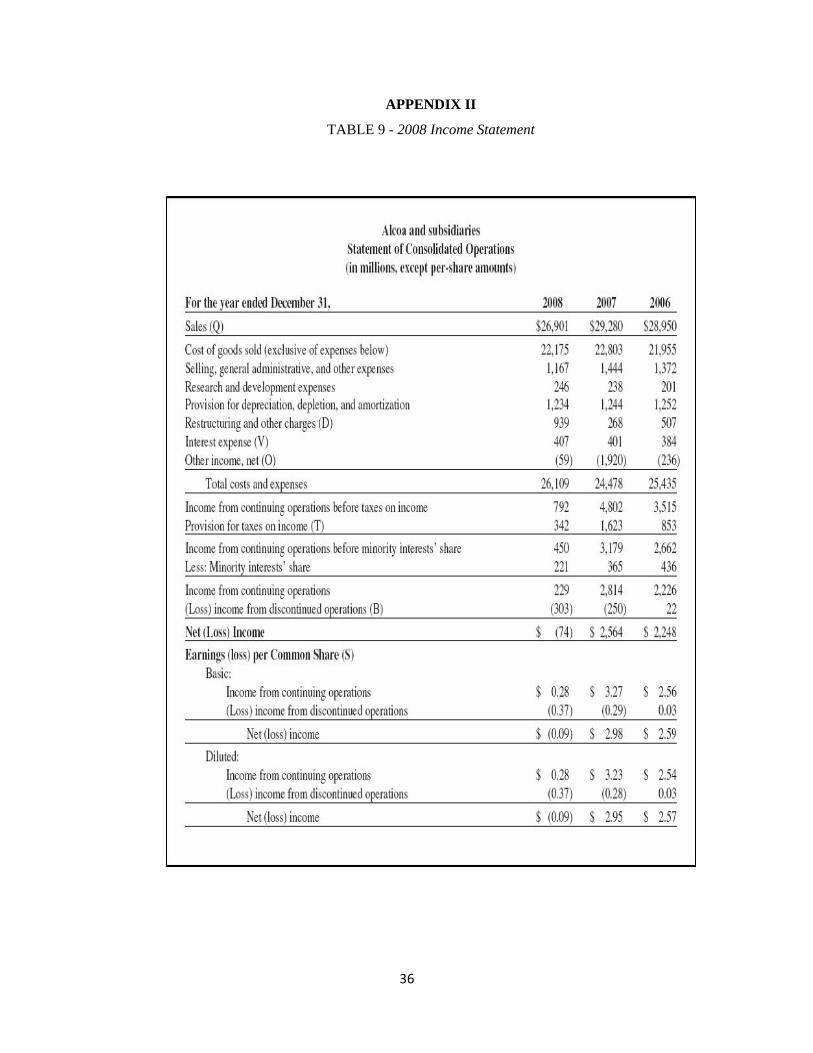
APPENDIX II
TABLE 9 - 2008 Income Statement
37
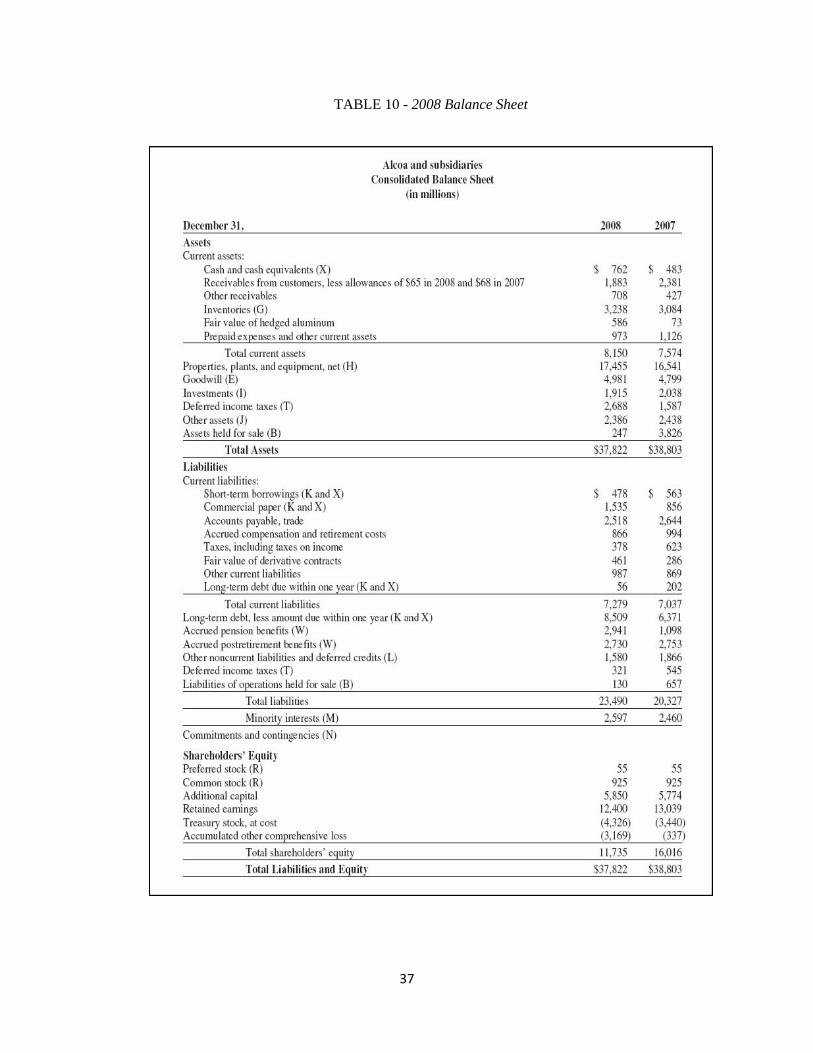
TABLE 10 - 2008 Balance Sheet
38
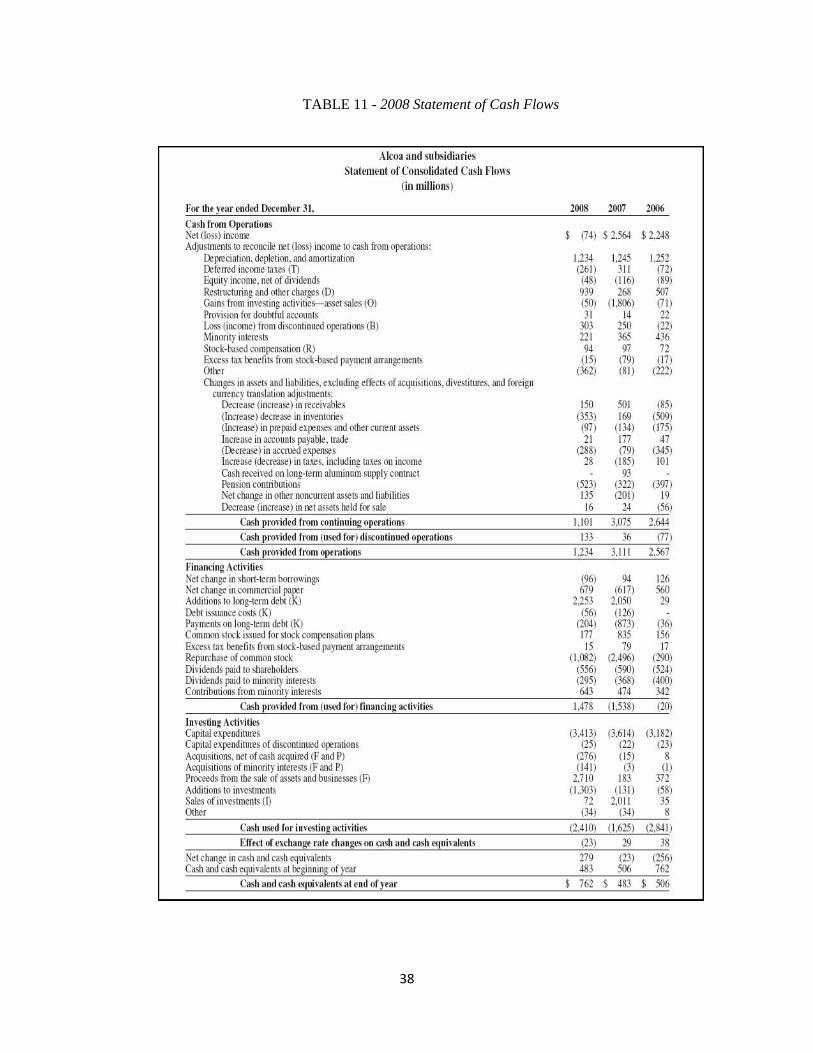
TABLE 11 - 2008 Statement of Cash Flows
39
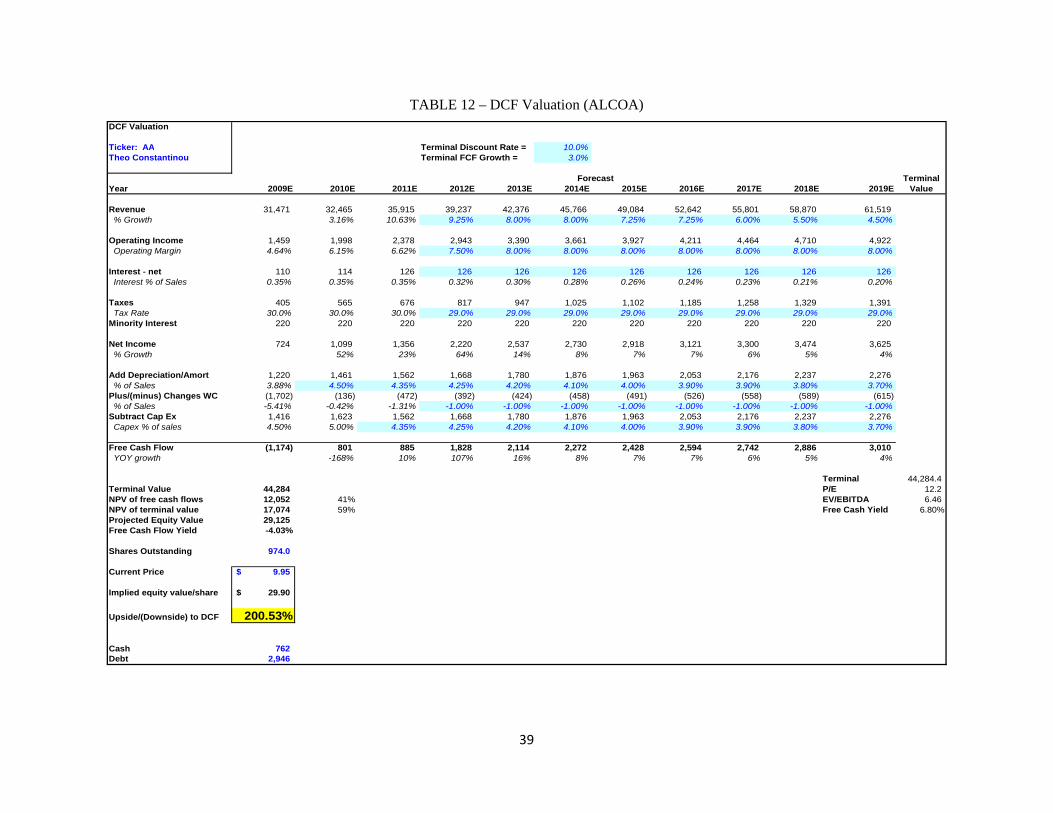
TABLE 12 – DCF Valuation (ALCOA) DCF Valuation
Ticker: AA Terminal Discount Rate = 10.0%Theo Constantinou Terminal FCF Growth = 3.0%
Forecast TerminalYear 2009E 2010E 2011E 2012E 2013E 2014E 2015E 2016E 2017E 2018E 2019E Value
Revenue 31,471 32,465 35,915 39,237 42,376 45,766 49,084 52,642 55,801 58,870 61,519 % Growth 3.16% 10.63% 9.25% 8.00% 8.00% 7.25% 7.25% 6.00% 5.50% 4.50%
Operating Income 1,459 1,998 2,378 2,943 3,390 3,661 3,927 4,211 4,464 4,710 4,922 Operating Margin 4.64% 6.15% 6.62% 7.50% 8.00% 8.00% 8.00% 8.00% 8.00% 8.00% 8.00%
Interest - net 110 114 126 126 126 126 126 126 126 126 126 Interest % of Sales 0.35% 0.35% 0.35% 0.32% 0.30% 0.28% 0.26% 0.24% 0.23% 0.21% 0.20%
Taxes 405 565 676 817 947 1,025 1,102 1,185 1,258 1,329 1,391 Tax Rate 30.0% 30.0% 30.0% 29.0% 29.0% 29.0% 29.0% 29.0% 29.0% 29.0% 29.0%Minority Interest 220 220 220 220 220 220 220 220 220 220 220
Net Income 724 1,099 1,356 2,220 2,537 2,730 2,918 3,121 3,300 3,474 3,625 % Growth 52% 23% 64% 14% 8% 7% 7% 6% 5% 4%
Add Depreciation/Amort 1,220 1,461 1,562 1,668 1,780 1,876 1,963 2,053 2,176 2,237 2,276 % of Sales 3.88% 4.50% 4.35% 4.25% 4.20% 4.10% 4.00% 3.90% 3.90% 3.80% 3.70%Plus/(minus) Changes WC (1,702) (136) (472) (392) (424) (458) (491) (526) (558) (589) (615) % of Sales -5.41% -0.42% -1.31% -1.00% -1.00% -1.00% -1.00% -1.00% -1.00% -1.00% -1.00%Subtract Cap Ex 1,416 1,623 1,562 1,668 1,780 1,876 1,963 2,053 2,176 2,237 2,276 Capex % of sales 4.50% 5.00% 4.35% 4.25% 4.20% 4.10% 4.00% 3.90% 3.90% 3.80% 3.70%
Free Cash Flow (1,174) 801 885 1,828 2,114 2,272 2,428 2,594 2,742 2,886 3,010 YOY growth -168% 10% 107% 16% 8% 7% 7% 6% 5% 4%
Terminal 44,284.4 Terminal Value 44,284 P/E 12.2 NPV of free cash flows 12,052 41% EV/EBITDA 6.46 NPV of terminal value 17,074 59% Free Cash Yield 6.80%Projected Equity Value 29,125 Free Cash Flow Yield -4.03%
Shares Outstanding 974.0
Current Price 9.95$
Implied equity value/share 29.90$
Upside/(Downside) to DCF 200.53%
Cash 762 Debt 2,946

40
TABLE 13 – Sensitivity Analysis: Implied Equity
Terminal Discount RateTerminal FCF 10.00% 10.50% 11.00% 11.50% 12.00% 12.50% 13.00% 13.50% 14.00%
2.50% 28.65 26.64 24.87 23.30 21.90 20.64 19.51 18.48 17.543.00% 29.90 27.69 25.76 24.06 22.55 21.20 20.00 18.91 17.923.50% 31.34 28.89 26.76 24.91 23.28 21.83 20.54 19.38 18.334.00% 33.02 30.27 27.92 25.88 24.10 22.53 21.14 19.90 18.784.50% 35.01 31.88 29.24 26.98 25.03 23.32 21.81 20.48 19.28
Sensitivity Analysis- Implied Equity Value ($)
TABLE 14 – Sensitivity Analysis: Up Side / Downside
Terminal Discount RateTerminal FCF 10.00% 10.50% 11.00% 11.50% 12.00% 12.50% 13.00% 13.50% 14.00%
2.50% 187.9% 167.7% 149.9% 134.2% 120.1% 107.4% 96.1% 85.7% 76.3%3.00% 200.5% 178.3% 158.9% 141.8% 126.6% 113.1% 101.0% 90.1% 80.1%3.50% 215.0% 190.4% 168.9% 150.4% 134.0% 119.4% 106.4% 94.8% 84.2%4.00% 231.9% 204.2% 180.6% 160.1% 142.2% 126.4% 112.5% 100.0% 88.7%4.50% 251.9% 220.4% 193.9% 171.2% 151.6% 134.4% 119.2% 105.8% 93.8%
Sensitivity Analysis- Up Side/Downside (%)
41
1 Adapted from the 2008 Alcoa Company 10-K and Wikipedia Contributors: Alcoa 2 Adapted from the 2008 Alcoa Company 10-K 3 InfoMine: Mining Intelligence & Technology 4 Morningstar 5 World Bureau of Metal Statistics 6 Fresh Patents 7 US Department of Energy 8 Thomson Baseline 9 Thomson Baseline 10 CRU: The Independent Authority 11 Investment Tools 12 Adapted from the 2008 Alcoa Company 10-K 13 Adapted from the 2008 Alcoa Company 10-K 14 Merrill Lynch Investment Clock 15 Thomson Baseline 16 2008 Alcoa Company 10-K and 2009 Alcoa Company 10-Q 17 Relative Prices: Platts Metals Week, Purchasing, Bloomberg 18 Adapted from the 2008 Alcoa Company 10-K and Mergent Online 19 Thomson Baseline 20 Companies for comparable analysis: Yahoo Finance 21 Legg Mason Capital Management: Common Errors in DCF Models 22 Long-Term Aluminum Demand Growth: The O’Carroll Aluminum Bulletin 23 Thomson Baseline 24 China GDP: Bloomberg 25 World Bureau of Metal Statistics 26 2008 Alcoa Company 10-K 27 Organisation for Economic Co-Operation and Development 28 CRU: The Independent Authority 29 CRU: The Independent Authority 30 CRU: The Independent Authority 31 Credit Suisse Equity Research: Alcoa