Embed Size (px)
Citation preview
1
11/02/2010
ALCATEL-LUCENT
CONSOLIDATED FINANCIAL STATEMENTS
AT DECEMBER 31, 2009
Table of Contents
Consolidated income statements............................................................................................... 1 Consolidated statements of comprehensive income ........................................................................ 2 Consolidated statements of financial position ............................................................................... 3 Consolidated statements of cash flows........................................................................................ 5 Consolidated statements of changes in equity............................................................................... 6 Notes to Consolidated Financial Statements ................................................................................. 7 Note 1 Summary of accounting policies ..................................................................................... 7
Note 2 Principal uncertainties regarding the use of estimates ........................................................19
Note 3 Changes in consolidated companies................................................................................27
Note 4 Change in accounting policy and presentation ...................................................................28
Note 5 Information by operating segment and by geographical segment ............................................29
Note 6 Revenues................................................................................................................32
Note 7 Impairment losses recognized in the income statement .......................................................33
Note 8 Financial income (loss) ...............................................................................................34
Note 9 Income tax and related reduction of goodwill ...................................................................35
Note 10 Discontinued operations, assets held for sale and liabilities related to disposal groups held for sale37
Note 11 Earnings per Share...................................................................................................38
Note 12 Goodwill...............................................................................................................40
Note 13 Intangible assets .....................................................................................................43
Note 14 Property, plant and equipment ...................................................................................46
Note 15 Finance leases and operating leases..............................................................................48
Note 16 Share in net assets of equity affiliates and joint ventures...................................................49
Note 17 Financial assets ......................................................................................................51
Note 18 Operating working capital..........................................................................................53
Note 19 Inventories and work in progress..................................................................................54
Note 20 Trade receivables and related accounts .........................................................................54
Note 21 Other assets and liabilities ........................................................................................55
Note 22 Allocation of 2009 net income (loss) .............................................................................55
Note 23 Shareholders’ equity ................................................................................................55
Note 24 Compound financial instruments..................................................................................73
Note 25 Pensions, retirement indemnities and other post-retirement benefits ....................................76
Note 26 Financial debt ........................................................................................................90
Note 27 Provisions .............................................................................................................96
Note 28 Market-related exposures ..........................................................................................97
Note 29 Customers’ deposits and advances.............................................................................. 106
Note 30 Net cash provided (used) by operating activities before changes in working capital, interest and taxes............................................................................................................. 106
Note 31 Contractual obligations and disclosures related to off balance sheet commitments .................. 106

2
Note 32 Related party transactions....................................................................................... 110
Note 33 Employee benefit expenses, staff training rights and audit fees ......................................... 112
Note 34 Contingencies....................................................................................................... 112
Note 35 Events after the statement of financial position date ...................................................... 117
Note 36 Main consolidated companies.................................................................................... 117
Note 37 Quarterly information (unaudited) ............................................................................. 118

1
CONSOLIDATED INCOME STATEMENTS
(in millions of euros except per share information) Notes Q4 2009 Q4 2008 2009 2008 2007
Revenues (5) & (6) 3,967 4,954 15,157 16,984 17,792
Cost of sales (1) (4) (2,514) (3,308) (10,046) (11,190) (12,083)
Gross profit 1,453 1,646 5,111 5,794 5,709
Administrative and selling expenses (1) (4)) (677) (807) (2,913) (3,093) (3,462)
Research and development expenses before capitalization of development expenses (571) (706) (2,527) (2,858) (3,107)
Impact of capitalization of development expenses 2 23 4 101 153
Research and development costs (1) (569) (683) (2,523) (2,757) (2,954)
Income (loss) from operating activities before restructuring costs, impairment of assets, gain/(loss) on disposal of consolidated entities, litigations and post-retirement benefit plan amendments (5) 207 156 (325) (56) (707)
Restructuring costs (1) (27) (268) (81) (605) (562) (856)
Litigations (2) (109) (109)
Impairment of assets (7) - (3,910) - (4,725) (2,944)
Gain/(loss) on disposal of consolidated entities (3) (3) 99 (6) 99 (7) -
Post-retirement benefit plan amendments 211 2 248 47 258
Income (loss) from operating activities 140 (3,839) (692) (5,303) (4,249)
Interest relative to gross financial debt (83) (103) (313) (391) (403)
Interest relative to cash and cash equivalents 13 41 59 179 230
Finance costs (8) (70) (62) (254) (212) (173)
Other financial income (loss) (8) 58 54 249 366 541
Share in net income (losses) of equity affiliates (16) 5 12 1 96 110
Income (loss) before income tax, related reduction of goodwill and discontinued operations 133 (3,835) (696) (5,053) (3,771)
Reduction of goodwill related to deferred tax assets initially unrecognized (9) - - - - (256)
Income tax benefit (expense) (9) (41) (74) 60 (153) (60)
Income (loss) from continuing operations 92 (3,909) (636) (5,206) (4,087)
Income (loss) from discontinued operations (10) 3 35 132 33 610
NET INCOME (LOSS) 95 (3,874) (504) (5,173) (3,477)
Attributable to:
• Equity owners of the parent 46 (3,892) (524) (5,215) (3,518)
• Non-controlling interests 49 18 20 42 41
Net income (loss) attributable to the equity owners of the parent per share (in euros)
• Basic earnings per share (11) 0.02 (1.72) (0.23) € (2.31) € (1.56)
• Diluted earnings per share (11) 0.02 (1.72) (0.23) € (2.31) € (1.56)
Net income (loss) before discontinued operations attributable to the equity owners of the parent per share (in euros)
• Basic earnings per share 0.02 (1.73) (0.29) € (2.32) € (1.83)
• Diluted earnings per share 0.02 (1.73) 0.29) € (2.32) € (1.83)
Net income (loss) of discontinued operations per share (in euros)
• Basic earnings per share 0.00 0.01 0.06 € 0.01 € 0.27
• Diluted earnings per share 0.00 0.01 0.06 € 0.01 € 0.27
(1) Classification of share-based payments between cost of sales, administrative and selling expenses, research & development costs and restructuring costs is provided in note 23e.
(2) Related to material litigations (see note 1p): the FCPA litigation disclosed in notes 34a (for an amount of € 93 million representing the net present value of U.S.$ 137.4 million) and the Fox River litigation disclosed in note 31 (Lucent's separation agreements for an amount of € 16 million or U.S.$ 22 million).
(3) 2009 amount is related to the disposal of the Fractional Horsepower Motors activity (see note 3).

2
CONSOLIDATED STATEMENTS OF COMPREHENSIVE INCOME
(in millions of euros) Notes 2009 2008 2007
Net income (loss) for the year (504) (5,173) (3,477)
Financial assets available for sale: (17) 13 (38) 20
Valuation gains/(losses) taken to equity 22 (38) 47
Transferred to profit or loss on sale (9) - (27)
Cumulative translation adjustments 39 112 (993)
Cash flow hedging: (28) 11 5 (4)
Amount taken to equity (9) (14) (7)
Recycling in income (loss) 20 19 3
Actuarial gains (losses) and adjustments arising from asset ceiling limitation and IFRIC 14 (25) (582) (1,965) 43
Tax on items recognized directly in equity (9) (1) 429 68
Other adjustments (53) 86 (14)
Total other comprehensive income/(loss) (573) (1,371) (880)
Of which transferred to profit and loss 11 19 (24)
TOTAL COMPREHENSIVE INCOME (LOSS) FOR THE YEAR (1,077) (6,544) (4,357)
Attributable to:
• Equity owners of the parent (1,079) (6,635) (4,395)
• Non-controlling interests 2 91 38

3
CONSOLIDATED STATEMENTS OF FINANCIAL POSITION
ASSETS (in millions of euros) Notes
December 31, 2009
December 31, 2008
December 31, 2007
Non-current assets:
Goodwill (12) 4,168 4,215 7,328
Intangible assets, net (13) 2,214 2,567 4,230
Goodwill and intangible assets, net 6,382 6,782 11,558
Property, plant and equipment, net (14) 1,260 1,351 1,428
Share in net assets of equity affiliates (16) 60 113 1,352
Other non-current financial assets, net (17) 392 696 704
Deferred tax assets (9) 836 852 1,232
Prepaid pension costs (25) 2,400 2,298 3,472
Other non-current assets (21) 314 650 389
Total non-current assets 11,644 12,742 20,135
Current assets:
Inventories and work in progress, net (18) & (19) 1,624 2,196 2,235
Amounts due from customers on construction contracts (18) 528 495 704
Trade receivables and other receivables, net (18) & (20) 3,221 4,330 4,163
Advances and progress payments (18) 93 99 110
Other current assets (21) 960 1,395 1,117
Current income taxes 157 113 60
Marketable securities, net (17) & (26) 1,993 906 894
Cash and cash equivalents (26) 3,577 3,687 4,377
Current assets before assets held for sale 12,153 13,221 13,660
Assets held for sale and assets included in disposal groups held for sale (10) 51 1,348 35
Total current assets 12,204 14,569 13,695
TOTAL ASSETS 23,848 27,311 33,830
4
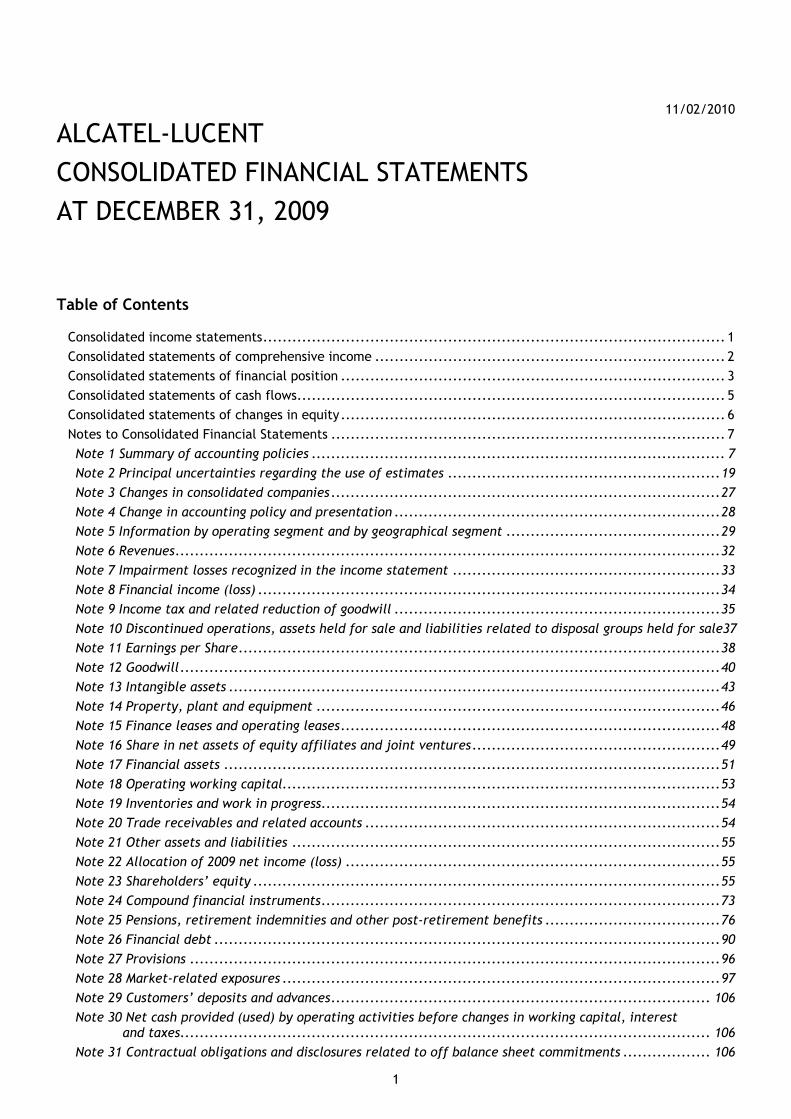
EQUITY AND LIABILITIES (in millions of euros) Notes
December 31, 2009
December 31, 2008
December 31, 2007
Equity:
Capital stock (€ 2 nominal value: 2,318,060,818 ordinary shares is-sued at December 31, 2009, 2,318,041,761 ordinary shares issued at December 31, 2008 and 2,317,441,420 ordinary shares issued at De-cember 31, 2007) (23) 4,636 4,636 4,635
Additional paid-in capital 16,689 16,628 16,543
Less treasury stock at cost (1,567) (1,566) (1,567)
Retained earnings, fair value and other reserves (14,518) (8,820) (3,821)
Cumulative translation adjustments (976) (1,030) (1,085)
Net income (loss) – attributable to the equity owners of the parent (11) & (22) (524) (5,215) (3,518)
Equity attributable to equity owners of the parent (23) 3,740 4,633 11,187
Non-controlling interests (23) 569 591 515
Total equity (23) & (24) 4,309 5,224 11,702
Non-current liabilities:
Pensions, retirement indemnities and other post-retirement benefits (25) 5,043 4,807 4,447
Bonds and notes issued, long-term (24) & (26) 4,084 3,931 4,517
Other long-term debt (26) 95 67 48
Deferred tax liabilities (9) 1,058 1,152 1,897
Other non-current liabilities (21) 209 443 366
Total non-current liabilities 10,489 10,400 11,275
Current liabilities:
Provisions (27) 2,008 2,424 2,566
Current portion of long-term debt (26) 576 1,097 483
Customers’ deposits and advances (18) & (29) 639 929 847
Amounts due to customers on construction contracts (18) 66 188 407
Trade payables and other payables (18) 3,926 4,571 4,514
Current income tax liabilities 72 185 70
Other current liabilities (21) 1,763 2,293 1,966
Total current liabilities 9,050 11,687 10,853
TOTAL EQUITY AND LIABILITIES 23,848 27,311 33,830

5
CONSOLIDATED STATEMENTS OF CASH FLOWS
(in millions of euros) Notes Q4 2009 2009 2008 2007Cash flows from operating activities Net income (loss) – attributable to the equity owners of the parent 46 (524) (5,215) (3,518)Non-controlling interests 49 20 42 41Adjustments (30) 88 289 5,826 3,890Net cash provided (used) by operating activities before changes in working capital, interest and taxes (30) 183 (215) 653 413Net change in current assets and liabilities (excluding financing): Inventories and work in progress (18) 277 409 (88) (311)Trade receivables and other receivables (18) (5) 892 109 (685)Advances and progress payments (18) 10 12 9 (29)Trade payables and other payables (18) (145) (747) 4 627Customers’ deposits and advances (18) (37) (76) (64) 164Other current assets and liabilities 128 (19) (101) 22Cash provided (used) by operating activities before interest and taxes 411 256 522 201Interest received 15 72 157 202Interest paid (32) (244) (349) (354)Taxes (paid)/received (27) (89) (123) (73)Net cash provided (used) by operating activities 367 (5) 207 (24)Cash flows from investing activities: Proceeds from disposal of tangible and intangible assets 7 25 188 93Capital expenditures (13) & (14) (194) (691) (901) (842)Of which impact of capitalization of development costs (13) (74) (284) (410) (414)
Decrease (increase) in loans and other non-current financial assets 4 20 26 (31)Cash expenditures for acquisition of consolidated and non-consolidated companies (6) (12) (73) (24)Cash and cash equivalents from consolidated companies acquired - 13 - -Cash proceeds from sale of previously consolidated and non-consolidated companies 159 1,765 22 293Cash expenditure for acquisition of marketable securities (90) (1,062) 12 1,050Net cash provided (used) by investing activities (120) 58 (726) 539Cash flows from financing activities: Issuance/(repayment) of short-term debt 9 (85) (24) (251)Issuance of long-term debt (26) 71 1,056 - -Repayment/repurchase of long-term debt (26) (185) (1,214) (226) (509)Proceeds from issuance of shares - - - 15Proceeds from disposal/(acquisition) of treasury stock - - - 5Dividends paid 2 (4) (7) (366)Net cash provided (used) by financing activities (103) (247) (257) (1,106)Cash provided (used) by operating activities of discontinued operations (10) - - - (77)Cash provided (used) by investing activities of discontinued operations (10) (3) 115 21 652Cash provided (used) by financing activities of discontinued operations (10) - - - (352)Net effect of exchange rate changes 58 (31) 65 (125)NET INCREASE (DECREASE) IN CASH AND CASH EQUIVALENTS 199 (110) (690) (493)Cash and cash equivalents at beginning of period / year 3,378 3,687 4,377 4,749Cash and cash equivalents at end of year (1) 3,577 3,577 3,687 4,377Cash and cash equivalents at beginning of year classified as assets held for sale - - - 121Cash and cash equivalents at end of year classified as assets held for sale - - - -
(1) Includes € 718 million of cash and cash equivalents held in countries subject to exchange control restrictions as of December 31, 2009 (€ 678 million as of December 31, 2008 and € 460 million as of December 31, 2007). Such restrictions can limit the use of such cash and cash equivalents by other group subsidiaries and the parent.

6
CONSOLIDATED STATEMENTS OF CHANGES IN EQUITY
(in millions of euros and number of shares)
Number of shares (3)
Capital stock
Additional paid-in capital
Retained Earnings
Fair value and other reserves
Treasury stock
Cumulative translation
adjustments
Net income
(loss)
Total attributable to the owners of
the parent
Non-controlling
interests TOTAL Balance at December 31, 2006 after appropriation 2,250,939,150 4,619 16,443 (3,837) 290 (1,572) (115) - 15,828 495 16,323 Changes in equity for 2007 Total comprehensive income (loss) for 2007 (1) (14) 107 (970) (3,518) (4,395) 38 (4,357) Capital increases 7,762,279 16 28 44 44 Early redemption of 8% convertible debenture (30) (30) (30) Share-based payments 102 102 102 Treasury stock 349,304 (4) 5 1 1 Dividends (361) (361) (18) (379) Appropriation of 2007 net income (loss) (3 518) 3 518 Other adjustments (2) (2) - (2) Balance at December 31, 2007 after appropriation 2,259,050,733 4,635 16,543 (7,736) 397 (1,567) (1,085) - 11,187 515 11,702 Changes in equity for 2008 Total comprehensive income (loss) for 2008 (1) 86 (1,561) - 55 (5,215) (6,635) 91 (6,544) Capital increases 600,341 1 1 1 Share-based payments 88 88 88 Treasury stock 4,697 - - (3) 1 (2) (2) Dividends - (19) (19) Appropriation of 2008 net income (loss) (5,215) 5,215 - - Other adjustments (6) (6) 4 (2) Balance at December 31, 2008 after appropriation 2,259,655,771 4,636 16,631 (12,874) (1,164) (1,566) (1,030) - 4,633 591 5,224 Changes in equity for 2009 Total comprehensive income (loss) for 2009 (1) (53) (556) 54 (524) (1,079) 2 (1,077) Capital increases 19,057 Share-based payments 58 58 - 58 Treasury stock 65,596 (4) (1) (5) - (5) Equity component of Oceane 2015 issued in 2009, net of tax 128 128 - 128 Dividends (5) (5) Other adjustments 4 1 5 (19) (14) Balance at December 31, 2009 before appropriation 2,259,740,424 4,636 16,689 (12,799) (1,719) (1,567) (976) (524) 3,740 569 4,309 Proposed appropriation (2) Balance at December 31, 2009 after appropriation
(1) See consolidated statements of comprehensive income. (2) The appropriation is proposed by the Board of Directors and must be approved at the Shareholders Meeting, to be held June 1, 2010 before being final. (3) See note 23.

7
NOTES TO CONSOLIDATED FINANCIAL STATEMENTS
Alcatel-Lucent (formerly called Alcatel) is a French public limited liability company that is subject to the French Commercial Code and to all the legal requirements governing commercial companies in France. Alcatel changed its name to Alcatel-Lucent on completion of the business combination with Lucent Technologies Inc. Alcatel-Lucent was incorporated on June 18, 1898 and will be dissolved on June 30, 2086, unless its existence is extended or shortened by shareholder vote. Alcatel-Lucent’s headquarters are situated at 54, rue la Boétie, 75008 Paris, France. Alcatel-Lucent is listed principally on the Paris and New York stock exchanges.
The consolidated financial statements reflect the results and financial position of Alcatel-Lucent and its subsidiaries (the “Group”) as well as its investments in associates (“equity affiliates”) and joint ventures. They are presented in Euros rounded to the nearest million.
The Group develops and integrates technologies, applications and services to offer innovative global communications solutions.
On February 9, 2010, Alcatel-Lucent's Board of Directors authorized for issuance these consolidated financial statements at December 31, 2009. The consolidated financial statements will be final once approved at the Annual Shareholders’ Meeting to be held on June 1st, 2010.
Note 1 Summary of accounting policies
Due to the listing of Alcatel-Lucent’s securities on the Euronext Paris and in accordance with the European Union’s regulation No. 1606/2002 of July 19, 2002, the consolidated financial statements of the Group are prepared in accordance with IFRSs (International Financial Reporting Standards), as adopted by the European Union (“EU”), as of the date when our Board of Directors authorized these consolidated financial statements for issuance.
IFRSs can be found at: www.ec.europa.eu/internal_market/accounting/ias_en.htm#adopted-commission
IFRSs include the standards approved by the International Accounting Standards Board (“IASB”), that is, IFRSs, International Accounting Standards (“IASs”) and accounting interpretations issued by the International Financial Reporting Interpretations Committee (“IFRIC”) or the former Standing Interpretations Committee (“SIC”).
The accounting policies and measurement principles adopted for the consolidated financial statements at December 31, 2009 are the same as those used in the consolidated financial statements at December 31, 2008, except the changes disclosed hereafter.
As of December 31, 2009, all IFRSs that the IASB has published and that are mandatory are the same as those endorsed by the EU and mandatory in the EU, with the exception of both:
• IAS 39, which the EU only partially adopted. The part not adopted by the EU has no impact on Alcatel-Lucent’s financial statements, and
• IFRIC 12 “Service Concession Arrangements”, IFRIC 15 “Agreements for the Construction of Real Estate”, IFRIC 18 “Transfers of Assets from Customers”, and IFRIC 16 “Hedges of a Net Investment in a Foreign Operation”, which are all not yet mandatory in the EU. However, the first three interpretations are not applicable to the Group, because none of the Group’s transactions are currently within their scopes, and the last interpretation is also not applicable, because it is not the Group’s policy to hedge net investments in foreign operations.
As a result, the Group’s consolidated financial statements comply with International Financial Reporting Standards as published by the IASB.
New published IASB financial reporting standards, amendments and interpretations, which the EU has endorsed and which are mandatory in the EU as of January 1, 2009
The IASB published a revised IAS 1 “Presentation of Financial Statements” in 2007, which became effective as of January 1, 2009. The main changes from the previous version of IAS 1 are as follows:
• the titles “balance sheet” and “cash flow statement” are now denominated “statement of financial position” and “statement of cash flows”.
• all changes arising from transactions with owners in their capacity as owners are presented separately from non-owner changes in equity,
• income and expenses are presented in either one statement (statement of comprehensive income) or two statements (a separate income statement and a statement of comprehensive income);

8
• total comprehensive income is presented in the financial statements.
The IASB also published the following amendments, improvements and interpretations, which became effective as of January 1, 2009:
• amendment to IFRS 2 “Share-based Payment” - Vesting Conditions and Cancellations;
• amendments to IAS 32 “Financial Instruments: Presentation” and IAS 1 “Presentation of Financial Statements” - Puttable Financial Instruments and Obligations arising on Liquidation;
• improvements to IFRSs issued by the IASB in May 2008 (except the improvements related to IFRS 5- “Non-current Assets Held For Sale and Discontinued Operations”, improvement applicable as of January 1, 2010);
• amendments to IFRS 1 “First-time Adoption of IFRSs” and IAS 27 “Consolidated and Separate Financial Statements – Cost of an Investment in a Subsidiary, Jointly Controlled Entity or Associate”;
• amendment to IFRS 7 “Financial Instruments: Disclosures – Improving Disclosures about Financial Instruments”;
• amendments to IFRIC 9 and IAS 39 “Financial Instruments: Recognition and Measurement – Embedded Derivatives” (effective July 1, 2009);
• IFRIC 13 “Customer Loyalty Programmes”.
None of the above had a material impact on the Group’s consolidated financial statements for the year ended December 31, 2009.
New published IASB financial reporting standards, amendments and interpretations, which are not yet mandatory, but which the EU has endorsed
The IASB published the following standards, amendments and interpretations prior to December 31, 2009, which are not yet mandatory and for which the Group did not elect early application:
• a revised IFRS 3 “Business Combinations” and an amended IAS 27 “Consolidated and Separate Financial Statements”. We will apply these revised and amended standards to business combinations, for which the acquisition date is on or after January 1, 2010;
• revised IFRS 1 “First-time Adoption of IFRSs”;
• amendment to IAS 39 “Financial Instruments: Recognition and Measurement – Eligible Hedged Items”;
• amendment to IAS 32 “Financial Instruments: Presentation - Classification of Rights Issues”;
• IFRIC 17 “Distributions of Non-cash Assets to Owners”.
None of these revised standards, amendments or interpretations is anticipated to have a material impact on our future consolidated financial statements except IFRS 3 revised and IAS 27 amended. If we were to enter into significant, new business combinations, these revised and amended standards could have a material impact on our future consolidated financial statements.
Transitional provisions of IFRS 3 affecting income taxes could also have a material impact on our future consolidated financial statements, since deferred tax assets recognized after completion of a business combination that had not been initially recognized will be recognized in the income statement without any related reduction of goodwill, contrary to the accounting treatment prescribed in the current IFRS 3 (see note 1n).
In this respect, significant unrecognized income tax loss carry-forwards that relate to Lucent Technologies could materially impact the Group’s consolidated income statement in a positive way, if, in compliance with IAS 12 “Income Taxes”, the Group is able to recognize deferred tax assets in the future corresponding to these tax losses.
9
New IASB financial reporting standards, amendments and interpretations published, which are not yet mandatory, and which the EU has not yet endorsed
The IASB published the following standards, amendments and interpretations prior to December 31, 2009, which are not yet mandatory:
• improvements to IFRSs (issued April 2009);
• amendments to IFRS 2 “Share-based Payment - Group Cash-settled Share-based Payment Transactions” (issued June 2009);
• IFRS 1 “First-Time Adoption of IFRSs – Additional Exemptions for First-Time Adopters” (issued July 2009);
• a revised IAS 24 “Related Party Disclosures” (issued November 2009);
• IFRS 9 “Financial Instruments” (issued November 2009);
• IFRIC 14 “Prepayments of a Minimum Funding Requirement” (issued November 2009).
• IFRIC 19 “Extinguishing Financial Liabilities with Equity Instruments” (issued November 2009);
a/ Basis of preparation
The consolidated financial statements have been prepared in accordance with IFRSs under the historical cost convention, with the exception of certain categories of assets and liabilities. The categories concerned are detailed in the following notes.
b/ Consolidation methods
Companies over which the Group has control are fully consolidated.
Companies over which the Group has joint control are accounted for using proportionate consolidation.
Companies over which the Group has significant influence (investments in “associates" or equity affiliates) are accounted for under the equity method. Significant influence is assumed when the Group's interest in the voting rights is 20% or more.
In accordance with SIC 12 "Consolidation – Special Purpose Entities", special purpose entities (SPE) are consolidated when the substance of the relationship between the Group and the SPE indicates that the SPE is controlled by the Group.
All significant intra-group transactions are eliminated.
c/ Business combinations
Regulations governing first-time adoption: business combinations that were completed before January 1, 2004, the transition date to IFRSs, were not restated, as permitted by the optional exemption included in IFRS 1. Goodwill was therefore not recognized for business combinations occurring prior to January 1, 2004, which was previously accounted for in accordance with Article 215 of Regulation No. 99-02 of the “Comité de la Réglementation Comptable”. According to this regulation, the assets and liabilities of the acquired company are maintained at their carrying value at the date of the acquisition, adjusted for the Group’s accounting policies, and the difference between this value and the acquisition cost of the shares is adjusted directly against equity.
Business combinations after January 1, 2004: these business combinations are accounted for in accordance with the purchase method required by IFRS 3. Once control is obtained over a company, its assets, liabilities and contingent liabilities are measured at their fair value at the acquisition date in accordance with IFRS requirements. Any difference between the fair value and the carrying value is accounted for in the respective underlying asset or liability, including both the Group interest and non-controlling interests. Any excess between the purchase price and the Group’s share in the fair value of such net assets is recognized as goodwill (see intangible and tangible assets).
If the initial accounting for a business combination cannot be completed before the end of the annual period in which the business combination is effected, the initial accounting must be completed within twelve months of the acquisition date.
The accounting treatment of deferred taxes related to business combinations is described in Note 1n below.
The accounting treatment of stock options of companies acquired in the context of a business combination is described in Note 1w below.

10
d/ Translation of financial statements denominated in foreign currencies
The statements of financial position of consolidated entities having a functional currency different from the presentation currency of the Group (i.e. euro) are translated into euros at the closing exchange rate (spot exchange rate at the statement of financial position date), and the income statements, statements of comprehensive income and statement of cash flow of such consolidated entities are translated at the average period to date exchange rate. The resulting translation adjustments are included in equity under the caption "Cumulative translation adjustments".
Goodwill and fair value adjustments arising from the acquisition of a foreign entity are considered as assets and liabilities of that entity. They are therefore expressed in the entity’s functional currency and translated into euros using the closing exchange rate.
Regulations governing first-time adoption: in accordance with the option available under IFRS 1, the accumulated total of translation adjustments at the transition date was deemed to be zero. This amount was reversed against retained earnings, leaving the amount of equity unchanged. Translation adjustments that predate the IFRS transition will therefore not be included when calculating gains or losses arising from the future disposal of consolidated subsidiaries or equity affiliates existing as of the IFRS transition date.
e/ Translation of foreign currency transactions
Foreign currency transactions are translated at the rate of exchange applicable on the transaction date. At period-end, foreign currency monetary assets and liabilities are translated at the rate of exchange prevailing on that date. The resulting exchange gains or losses are recorded in the income statement in “other financial income (loss)”.
Exchange gains or losses on foreign currency financial instruments that represent an economic hedge of a net investment in a foreign subsidiary are reported as translation adjustments in equity under the caption “Cumulative translation adjustments” until the disposal of the investment. Refer to Note 1d above for information on the recognition of translation adjustments at the IFRS transition date.
In order for a currency derivative to be eligible for hedge accounting treatment (cash flow hedge or fair value hedge), its hedging role must be defined and documented and it must be seen to be effective for the entirety of its period of use. Fair value hedges allow companies to protect themselves against exposure to changes in fair value of their assets, liabilities or firm commitments. Cash flow hedges allow companies to protect themselves against exposure to changes in future cash flows (for example, revenues generated by the company’s assets).
The value used for derivatives is their fair value. Changes in the fair value of derivatives are accounted for as follows:
• for derivatives treated as cash flow hedges, changes in their fair value are accounted for in shareholders’ equity and then transferred from equity to the income statement (cost of sales) when the hedged revenue is accounted for. The ineffective portion is recorded in “other financial income (loss)”;
• for derivatives treated as fair value hedges, changes in their fair value are recorded in the income statement where they offset the changes in fair value of the hedged asset, liability or firm commitment.
In addition to derivatives used to hedge firm commitments documented as fair value hedges, beginning on April 1, 2005, Alcatel-Lucent designated and documented highly probable future streams of revenue and entered into hedge transactions with respect to such revenue. The corresponding derivatives are accounted for in accordance with the requirements governing cash flow hedge accounting.
Certain foreign exchange derivatives are not considered eligible for hedge accounting treatment, as the derivatives are not designated as such for cost/benefit reasons.
Derivatives related to commercial bids are not considered eligible for hedge accounting treatment and therefore changes in their fair values are accounted for in the statement of income.
Once a commercial contract is effective, the corresponding firm commitment is hedged with a derivative treated as a fair value hedge. Revenues made pursuant to such a contract are then accounted for, throughout the duration of the contract, using the spot rate prevailing on the date on which the contract was effective, insofar as the exchange rate hedging is effective.
f/ Research and development expenses and other capitalized development costs
In accordance with IAS 38 “Intangible Assets”, research and development expenses are recorded as expenses in the year in which they are incurred, except for:

11
• development costs, which are capitalized as an intangible asset when the following criteria are met:
— the project is clearly defined, and the costs are separately identified and reliably measured,
— the technical feasibility of the project is demonstrated,
— the ability to use or sell the products created during the project,
— the intention exists to finish the project and use or sell the products created during the project,
— a potential market for the products created during the project exists or their usefulness, in case of internal use, is demonstrated, leading one to believe that the project will generate probable future economic benefits, and
— adequate resources are available to complete the project.
These development costs are amortized over the estimated useful life of the projects or the products they are incorporated within. The amortization of capitalized development costs begins as soon as the related product is released.
Specifically for software, useful life is determined as follows:
— in case of internal use: over its probable service lifetime,
— in case of external use: according to prospects for sale, rental or other forms of distribution.
Capitalized software development costs are those incurred during the programming, codification and testing phases. Costs incurred during the design and planning, product definition and product specification stages are accounted for as expenses.
The amortization of capitalized software costs during a reporting period is the greater of the amount computed using (a) the ratio that current gross revenues for a product bear to the total of current and anticipated future gross revenues for that product and (b) the straight-line method over the remaining estimated economic life of the software or the product they are incorporated within.
The amortization of internal use software capitalized development costs is accounted for by function depending on the beneficiary function;
• customer design engineering costs (recoverable amounts disbursed under the terms of contracts with customers), are included in work in progress on construction contracts.
With regard to business combinations, a portion of the purchase price is allocated to in-process research and development projects that may be significant. As part of the process of analyzing these business combinations, Alcatel-Lucent may make the decision to buy technology that has not yet been commercialized rather than develop the technology internally. Decisions of this nature consider existing opportunities for Alcatel-Lucent to stay at the forefront of rapid technological advances in the telecommunications-data networking industry.
The fair value of in-process research and development acquired in business combinations is usually based on present value calculations of income, an analysis of the project’s accomplishments and an evaluation of the overall contribution of the project, and the project’s risks.
The revenue projection used to value in-process research and development is based on estimates of relevant market sizes and growth factors, expected trends in technology, and the nature and expected timing of new product introductions by Alcatel-Lucent and its competitors. Future net cash flows from such projects are based on management’s estimates of such projects’ cost of sales, operating expenses and income taxes.
The value assigned to purchased in-process research and development is also adjusted to reflect the stage of completion, the complexity of the work completed to date, the difficulty of completing the remaining development, costs already incurred, and the projected cost to complete the projects.
Such value is determined by discounting the net cash flows to their present value. The selection of the discount rate is based on Alcatel-Lucent’s weighted average cost of capital, adjusted upward to reflect additional risks inherent in the development life cycle.
Capitalized development costs considered as assets (either generated internally and capitalized or reflected in the purchase price of a business combination) are generally amortized over 3 to 10 years.
Impairment tests are carried out using the methods described in Note 1g.
g/ Goodwill, intangible assets and property, plant and equipment
In accordance with IAS 16 “Property, Plant and Equipment” and with IAS 38 “Intangible Assets”, only items whose cost can be reliably measured and for which future economic benefits are likely to flow to the Group are recognized as assets.

12
In accordance with IAS 36 “Impairment of Assets”, whenever events or changes in market conditions indicate a risk of impairment of intangible assets and property, plant and equipment, a detailed review is carried out in order to determine whether the net carrying amount of such assets remains lower than their recoverable amount, which is defined as the greater of fair value (less costs to sell) and value in use. Value in use is measured by discounting the expected future cash flows from continuing use of the asset and its ultimate disposal. Intangible assets with indefinite useful lives (such as trade names) are tested for impairment annually.
If the recoverable value is lower than the net carrying value, the difference between the two amounts is recorded as an impairment loss. Impairment losses for property, plant and equipment or intangible assets with finite useful lives can be reversed if the recoverable value becomes higher than the net carrying value (but not exceeding the loss initially recorded).
Goodwill
Since transition to IFRSs, goodwill is no longer amortized in accordance with IFRS 3 “Business Combinations”. Before January 1, 2004, goodwill was amortized using the straight-line method over a period, determined on a case-by-case basis, not exceeding 20 years.
Goodwill is tested for impairment at least annually. This is done during the second quarter of the year. The impairment test methodology is based on a comparison between the recoverable amounts of each of the Group’s Business Divisions (considered as the grouping of cash generating units (“CGU”) at which level the impairment test is performed) and the Group Business Division’s net asset carrying values (including goodwill). Within Alcatel-Lucent’s reporting structure, Business Divisions are one level below the four operating segments (Carrier, Applications Software, Enterprise and Services). Such recoverable amounts are mainly determined using discounted cash flows over five years and a discounted residual value.
An additional impairment test is also performed when events indicating a potential decrease of the recoverable value of a Business Division occur. Goodwill impairment losses cannot be reversed.
Equity affiliate goodwill is included with the related investment in “share in net assets of equity affiliates”. The requirements of IAS 39 are applied to determine whether any impairment loss must be recognized with respect to the net investment in equity affiliates. The impairment loss is calculated according to IAS 36 requirements.
When the reporting structure is reorganized in a way that changes the composition of one or more Business Divisions to which goodwill was allocated, a new impairment test is performed on the goodwill for which the underlying Business Divisions have changed. Such reallocations were made in October 2007 and on January 1, 2009, using a relative value approach similar to the one used when an entity disposes of an operation within a Business Division.
Intangible assets
Intangible assets mainly include capitalized development costs and those assets acquired in business combinations, being primarily acquired technologies or customer relationships. Intangible assets, other than trade names, are generally amortized on a straight-line basis over their estimated useful lives (i.e. 3 to 10 years). However, software amortization methods may be adjusted to take into account how the product is marketed. Amortization is taken into account within cost of sales, research and development costs (acquired technology, IPR&D, etc.) or administrative and selling expenses (customer relationships), depending on the designation of the asset. Impairment losses are accounted for in a similar manner or in restructuring costs if they occur as part of a restructuring plan or on a specific line item if very material (refer to Note 1p). In-process R&D amortization begins once technical feasibility is reached. Certain trade names are considered to have indefinite useful lives and therefore are not amortized.
Capital gains/losses from disposals of intangible assets are accounted for in the corresponding cost line items in the income statement depending of the nature of the underlying asset (i.e. cost of sales, administrative and selling expenses or research and development costs).
Property, plant and equipment
Property, plant and equipment are valued at historical cost for the Group less accumulated depreciation expenses and any impairment losses. Depreciation expense is generally calculated over the following useful lives:
buildings and building improvements 5-50 years
infrastructure and fixtures 5-20 years
plant and equipment 1-10 years
Depreciation expense is determined using the straight-line method.

13
Assets acquired through finance lease arrangements or long-term rental arrangements that transfer substantially all the risks and rewards associated with ownership of the asset to the Group (tenant) are capitalized.
Residual value, if considered to be significant, is included when calculating the depreciable amount. Property, plant and equipment are segregated into their separate components if there is a significant difference in their expected useful lives, and depreciated accordingly.
Depreciation and impairment losses are accounted for in the income statement under cost of sales, research and development costs or administrative and selling expenses, depending on the nature of the asset or in restructuring costs if they occur as part of a restructuring plan or on a specific line item if very material (see Note 1p).
In addition, capital gains/losses from disposals of property, plant and equipment are accounted for in the corresponding cost line items in the income statement depending on the nature of the underlying asset (i.e. cost of sales, administrative and selling expenses, research and development costs or restructuring costs).
h/ Non-consolidated investments and other non-current financial assets
In accordance with IAS 39 “Financial Instruments: Recognition and Measurement”, investments in non-consolidated companies are classified as available-for-sale and therefore measured at their fair value. The fair value for listed securities is their market price. If a reliable fair value cannot be established, securities are valued at cost. Fair value changes are accounted for directly in shareholders’ equity. When objective evidence of impairment of a financial asset exists (for instance, a significant or prolonged decline in the value of an asset), an irreversible impairment loss is recorded. This loss can only be released upon the sale of the securities concerned.
Loans are measured at amortized cost and are subject to impairment losses if there is objective evidence of a loss in value. The impairment represented by the difference between net carrying amount and recoverable value is recognized in the income statement and can be reversed if recoverable value rises in the future.
The portfolio of non-consolidated securities and other financial assets is assessed at each quarter-end for objective evidence of impairment.
i/ Inventories and work in progress
Inventories and work in progress are valued at the lower of cost (including indirect production costs where applicable) or net realizable value.
Net realizable value is the estimated sales revenue for a normal period of activity less expected selling costs.
j/ Treasury stock
Treasury shares owned by Alcatel-Lucent or its subsidiaries are valued at cost and are deducted from equity. Proceeds from the sale of such shares are recognized directly in equity.
k/ Pension and retirement obligations and other employee and post-employment benefit obligations
In accordance with the laws and practices of each country where Alcatel-Lucent is established, the Group participates in employee benefit plans.
For defined contribution plans, the Group expenses contributions as and when they are due. As the Group is not liable for any legal or constructive obligations under the plans beyond the contributions paid, no provision is made. Provisions for defined benefit plans and other long-term employee benefits are determined as follows:
• using the Projected Unit Credit Method (with projected final salary), each period of service gives rise to an additional unit of benefit entitlement and each unit is measured separately to calculate the final obligation. Actuarial assumptions such as mortality rates, rates of employee turnover and projection of future salary levels are used to calculate the obligation;
• the “corridor” method is no longer used from January 1, 2007 (see below).
The service cost is recognized in “income from operating activities” and the interest cost and expected return on plan assets are recognized in “financial income (loss)”. The impact of plan amendments is presented on a specific line item of the income statement if material (see Note 1p).
The amount of prepaid pension obligations cannot exceed the net total present value of any available refund from the plan or reduction in future contributions to the plan. The use of excess pension plan assets to fund retiree healthcare obligations for formerly represented retirees is considered a refund from the related plan. In particular, under Section 420 of the Internal Revenue Code in the United States of America as amended by the Pension Protection Act of 2006, Alcatel-Lucent can use excess pension plan assets applicable to formerly represented retirees to fund the retiree healthcare plan for such retirees until 2013.

14
As of January 1, 2007, the Group has elected the option provided for in the amendment of IAS 19 “Employee Benefits – Actuarial Gains and Losses, Group Plans and Disclosures” (paragraphs 93A to 93D) that allows for the immediate recognition of actuarial gains and losses and any adjustments arising from asset ceiling limitations, net of deferred tax effects, outside of the income statement in the statement of comprehensive income.
Regulations governing first-time adoption
In accordance with the option available under IFRS 1, the accumulated unrecognized actuarial gains and losses at the transition date were recorded in equity. Before the change in accounting method, which was retroactively applied from January 1, 2005, the corridor method had been applied starting January 1, 2004.
Certain other post-employment benefits, such as life insurance and health insurance (particularly in the United States) or long-service medals (bonuses awarded to employees for extended service particularly in France and Germany), are also recognized as provisions, which are determined by means of an actuarial calculation similar to the one used for retirement provisions.
The accounting treatment used for employee stock options is detailed in Note 1w below.
l/ Provisions for restructuring and restructuring costs
Provisions for restructuring costs are made when restructuring programs have been finalized and approved by Group management and have been announced and committed before the date of the Group’s financial statements, resulting in an obligating event of the Group to third parties. Such costs primarily relate to severance payments, early retirement, costs for notice periods not worked, training costs of terminated employees, costs linked to the closure of facilities or the discontinuance of product lines and any costs arising from plans that materially change the scope of the business undertaken by the Group or the manner in which such business is conducted.
Other costs (removal costs, training costs of transferred employees, etc) and write-offs of fixed assets, inventories, work in progress and other assets, directly linked to restructuring measures, are also accounted for in restructuring costs in the income statement.
The amounts reserved for anticipated payments made in the context of restructuring programs are valued at their present value in cases where the settlement date is beyond the normal operating cycle of the company and the time value of money is deemed to be significant. The impact of the passage of time on the present value of the payments is included in “other financial income (loss)”.
m/ Financial debt – compound financial instruments
Certain financial instruments contain both a liability and an equity component, including bonds that can be converted into or exchanged for new or existing shares and notes mandatorily redeemable for new or existing shares. The different components of compound financial instruments are accounted for in equity and in bonds and notes issued according to their classification, as defined in IAS 32 “Financial Instruments: Disclosure and Presentation”.
For instruments issued by historical Alcatel, the financial liability component was valued on the issuance date at the present value (taking into account the credit risk at issuance date) of the future cash flows (including interest and repayment of the nominal value) of a bond with the same characteristics (maturity, cash flows) but without any equity component. The portion included in equity is equal to the difference between the debt issue amount and the financial liability component.
The financial liability component of historical Lucent’s convertible bonds was computed at present value on the business combination closing date, using the method as described in the preceding paragraph, taking into account the contractual maturity dates. The difference between the fair value of the convertible bonds and the corresponding financial liability component was accounted for in equity.
In accordance with IAS 32 AG33 and AG34 requirements, the consideration paid in connection with an early redemption of a compound financial instrument is allocated at the date of redemption between the liability and the equity components with an allocation method consistent with the method used initially. The amount of gain or loss relating to the liability component is recognized in “other financial income (loss)” and the amount of consideration relating to the equity component is recognized in equity.
n/ Deferred taxation and penalties on tax claims
Deferred taxes are computed in accordance with the liability method for all temporary differences arising between the tax basis of assets and liabilities and their carrying amounts, including the reversal of entries recorded in individual accounts of subsidiaries solely for tax purposes. All amounts resulting from changes in tax rates are recorded in equity or in net income (loss) for the year in which the tax rate change is enacted.
Deferred tax assets are recorded in the consolidated statement of financial position when it is probable that the tax benefit will be realized in the future. Deferred tax assets and liabilities are not discounted.

15
To assess the ability of the Group to recover deferred tax assets, the following factors are taken into account:
• existence of deferred tax liabilities that are expected to generate taxable income, or limit tax deductions upon reversal;
• forecasts of future tax results;
• the impact of non-recurring costs included in income or loss in recent years that are not expected to be repeated in the future;
• historical data concerning recent years’ tax results, and
• if required, tax planning strategy, such as the planned disposal of undervalued assets.
As a result of a business combination, an acquirer may consider it probable that it will recover its own deferred tax assets that were not recognized before the business combination. For example, an acquirer may be able to utilize the benefit of its unused tax losses against the future taxable profit of the acquiree. In such cases, the acquirer recognizes a deferred tax asset, but does not include it as part of the accounting for the business combination, and therefore does not take it into account in determining the goodwill or the amount of any excess of the acquirer’s interest in the net fair value of the acquiree’s identifiable assets, liabilities and contingent liabilities over the cost of the combination.
If the potential benefit of the acquiree’s income tax loss carry-forwards or other deferred tax assets do not satisfy the criteria in IFRS 3 for separate recognition when a business combination is initially accounted for, but are subsequently realized, the acquirer will recognize the resulting deferred tax income in profit or loss. In addition:
• the carrying amount of goodwill is reduced to the amount that would have been recognized if the deferred tax asset had been recognized as an identifiable asset from the acquisition date; and
• the reduction in the carrying amount of goodwill is recognized as an expense.
If any deferred tax assets related to the business combination with Lucent are recognized in future financial statements of the combined company, the impact will be accounted for in the income statement (for the tax losses not yet recognized related to both historical Alcatel and Lucent entities), but the goodwill will be reduced accordingly (for the tax losses related to Lucent entities only).
Amounts of reduction of goodwill already accounted for in the purchase price allocation related to the acquisition of Lucent are disclosed in Note 9.
Penalties recognized on tax claims are accounted for in the “income tax” line item in the income statement.
o/ Revenues
Revenues include net goods, equipment, and services sales from the Group’s principal business activities and income due from licensing fees and from grants, net of value added taxes (VAT).
Most of the Group’s sales are generated from complex contractual arrangements that require significant revenue recognition judgments, particularly in the areas of the sale of goods and equipment with related services constituting multiple-element arrangements, construction contracts and contracts including software. Judgment is also needed in assessing the ability to collect the corresponding receivables.
The majority of revenues from the sale of goods and equipment are recognized under IAS 18 when persuasive evidence of an arrangement with the customer exists, delivery has occurred, the significant risks and rewards of ownership of a product have been transferred to the customer, the amount of revenue can be measured reliably and it is probable that the economic benefits associated with the transaction will flow to the Group. For arrangements in which the customer specifies formal substantive acceptance of the goods, equipment, services or software, revenue is deferred until all the acceptance criteria have been met.
Revenues from contracts that are multiple-element arrangements, such as those including products with installation and integration services, are recognized as the revenue for each unit of accounting is earned based on the relative fair value of each unit of accounting as determined by internal or third-party analyses of market-based prices or by deferring the fair value associated with undelivered elements. A delivered element is considered a separate unit of accounting if it has value to the customer on a standalone basis, and delivery or performance of the undelivered elements is considered probable and substantially under the Group’s control. If these criteria are not met, revenue for the arrangement as a whole is accounted for as a single unit of accounting in accordance with the criteria described in the preceding paragraph.
The remaining revenues are recognized from construction contracts under IAS 11. Construction contracts are defined as contracts specifically negotiated for the construction of an asset or a combination of assets that are closely interrelated or interdependent in terms of their design, technology and function or their ultimate purpose of use (primarily those related to customized network solutions and network build-outs with a duration

16
of more than two quarters). For revenues generated from construction contracts, the Group applies the percentage of completion method of accounting in application of the above principles, provided certain specified conditions are met, based either on the achievement of contractually defined milestones or on costs incurred compared with total estimated costs. Any probable construction contract losses are recognized immediately in cost of sales. If uncertainty exists regarding customer acceptance, or the contract’s duration is relatively short, revenues are recognized only to the extent of costs incurred that are recoverable, or on completion of the contract. Construction contract costs are recognized as incurred when the outcome of a construction contract cannot be estimated reliably. In this situation, revenues are recognized only to the extent of the costs incurred that are probable of recovery. Work in progress on construction contracts is stated at production cost, excluding administrative and selling expenses. Changes in provisions for penalties for delayed delivery or poor contract execution are reported in revenues and not in cost of sales.
Advance payments received on construction contracts, before corresponding work has been carried out, are recorded in customers’ deposits and advances. Costs incurred to date plus recognized profits less the sum of recognized losses (in the case of provisions for contract losses) and progress billings are determined on a contract-by-contract basis. If the amount is positive, it is included as an asset under “amount due from customers on construction contracts”. If the amount is negative, it is included as a liability under “amount due to customers on construction contracts”.
When software is embedded in the Group’s hardware and the software and hardware function together to deliver the product’s essential functionality, the transaction is considered a hardware transaction and guidance from IAS 18 is applied. For revenues generated from licensing, selling or otherwise marketing software solutions or standalone software sales, the Group also applies the guidance from IAS 18 but requires vendor specific objective evidence (VSOE) of fair value to separate multiple software elements. In addition, if any undelivered element in these transactions is essential to the functionality of delivered elements, revenue is deferred until such element is delivered or the last element is delivered. If the last undelivered element is a service, revenue for such transactions is recognized ratably over the service period.
For arrangements to sell services only, revenue from training or consulting services is recognized when the services are performed. Maintenance service revenue, including post-contract customer support, is deferred and recognized ratably over the contracted service period. Revenue from other services is generally recognized at the time of performance.
For product sales made through retailers and distributors, assuming all other revenue recognition criteria have been met, revenue is recognized upon shipment to the distribution channel, if such sales are not contingent on the distributor selling the product to third parties and the distribution contracts contain no right of return. Otherwise, revenue is recognized when the reseller or distributor sells the product to the end user.
Product rebates or quantity discounts are deducted from revenues, even in the case of promotional activities giving rise to free products.
Revenue in general is measured at the fair value of the consideration received or to be received. Where a deferred payment has a significant impact on the calculation of fair value, it is accounted for by discounting future payments.
The assessment of the ability to collect is critical in determining whether revenue or expense should be recognized. As part of the revenue recognition process, the Group assesses whether it is probable that economic benefits associated with the transaction will flow to the Group. If the Group is uncertain as to whether economic benefits will flow to the Group, revenue is deferred and recognized on a cash basis. However, if uncertainty arises about the ability to collect an amount already included in revenue, the amount in respect of which recovery has ceased to be probable is recognized as an expense in “cost of sales”.
p/ Income (loss) from operating activities before restructuring costs, impairment of assets, gain/(loss) on disposal of consolidated entities, litigations and post-retirement benefit plan amendments and income (loss) from operating activities
Alcatel-Lucent has considered it relevant to the understanding of the Group’s financial performance to present on the face of the income statement a subtotal inside the income (loss) from operating activities.
This subtotal, named “Income (loss) from operating activities before restructuring costs, impairment of assets, gain/(loss) on disposal of consolidated entities, litigations and post-retirement benefit plan amendments”, excludes those elements that are difficult to predict due to their nature, frequency and/or materiality.
Those elements can be divided in two categories: • Elements that are both very infrequent and material, such as a major impairment of an asset, a disposal of
investments, the settlement of litigation having a material impact or a major amendment of a pension or other post-retirement plan.

17
• Elements that are by nature unpredictable in their amount and/or in their frequency, if they are material. Alcatel-Lucent considers that materiality must be assessed not only by comparing the amount concerned with the income (loss) from operating activities of the period, but also in terms of changes in the item from one period to another. For example, restructuring charges have shown significant changes from one period to an-other.
Income (loss) from operating activities includes gross margin, administrative and selling expenses and research and development costs (see note 1f) and, in particular, pension costs (except for the financial component, see note 1k), employee profit sharing, valuation allowances on receivables (including the two categories of vendor financing as described in note 1v) and capital gains (losses) from the disposal of intangible assets and property, plant and equipment, and all other operating expenses or income regardless of their predictive value in terms of nature, frequency and/or materiality.
Income (loss) from operating activities is calculated before financial income (loss), which includes the financial component of retirement expenses, financing costs and capital gains (losses) from disposal of financial assets (shares in a non-consolidated company or company consolidated under the equity method and other non-current financial assets, net), and before reduction of goodwill related to realized unrecognized income tax loss carry forwards, share in net income (losses) of equity affiliates and income (loss) from discontinued operations.
q/ Finance costs and other financial income (loss)
Finance costs include interest charges and interest income relating to net consolidated debt, which consists of bonds, the liability component of compound financial instruments such as OCEANE and other convertible bonds, other long-term debt (including lease-financing liabilities), all cash and similar items (cash, cash equivalents and marketable securities) and the changes in fair values of marketable securities accounted for at fair value through the income statement.
Borrowing costs that are directly attributable to the acquisition, construction or production of an asset are capitalized as part of the cost of that asset.
When tax law requires interest to be paid (received) on an underpayment (overpayment) of income taxes, this interest is accounted for in the "other financial income (loss)" line item in the income statement.
r/ Structure of consolidated statement of financial position
Most of the Group's activities in the various business segments have long-term operating cycles. As a result, the consolidated statement of financial position combines current assets (including other inventories and work in progress and trade receivables and other receivables) and current liabilities (including other provisions, customers' deposits and advances, trade payables and other payables) without distinction between the amounts due within one year and those due after one year.
s/ Financial instruments and derecognition of financial assets
Financial instruments
The Group uses financial instruments to manage and reduce its exposure to fluctuations in interest rates, foreign currency exchange rates and commodities.
The accounting policies applied to currency hedge-related instruments are detailed in Note 1e.
Financial instruments for interest rate hedges are subject to fair value hedge accounting. Financial liabilities hedged using interest rate swaps are measured at the fair value of the obligation linked to interest rate movements. Fair value changes are recorded in the income statement for the year and are offset by equivalent changes in the interest rate swaps for the effective part of the hedge.
Derecognition of financial assets
A financial asset as defined under IAS 32 “Financial Instruments: Disclosure and Presentation” is totally derecognized (removed from the statement of financial position) when, for instance, the Group expects no further cash flow to be generated by it and transfers substantially all risks and rewards attached to it.
In the case of trade receivables, a transfer without recourse in case of payment default by the debtor is regarded as a transfer of substantially all risks and rewards of ownership, thus making such receivables eligible for derecognition, on the basis that risk of late payment is considered marginal. A more restrictive interpretation of the concept of “substantial transfer of risks and rewards” could put into question the accounting treatment that has been adopted. The amount of receivables sold without recourse is given in Note 18.

18
t/ Cash and cash equivalents
In accordance with IAS 7 “Statement of Cash Flows”, cash and cash equivalents in the consolidated statements of cash flows include cash (cash funds) and cash equivalents (term deposits and short-term investments that are very liquid and readily convertible to known amounts of cash and are only subject to negligible risks of changes in value). Cash and cash equivalents in the statement of cash flows do not include investments in listed securities, investments with an initial maturity date exceeding three months and without an early exit clause, or bank accounts restricted in use, other than restrictions due to regulations applied in a specific country (exchange controls) or sector of activities.
Bank overdrafts are considered as financing and are also excluded from cash and cash equivalents.
Cash and cash equivalents in the consolidated statements of financial position correspond to the cash and cash equivalents defined above.
u/ Marketable securities
Marketable securities are quoted market funds with original maturities exceeding three months and/or with underlying assets such as listed shares. In accordance with IAS 39 “Financial Instruments: Recognition and Measurement”, marketable securities are valued at their fair value. No securities are classified as “held-to-maturity”. For securities designated as financial assets at fair value through profit or loss, changes in fair value are recorded in the income statement (in finance costs). For available-for-sale securities, changes in fair value are recorded in equity, or in the income statement (other financial income (loss)), if there is objective evidence of a more than temporary decline in the fair value, or in connection with a disposal of such securities.
v/ Customer financing
The Group undertakes two types of customer financing:
• financing relating to the operating cycle and directly linked to actual contracts; • longer-term financing (beyond the operating cycle) through customer loans, minority investments or other
forms of financing. Both categories of financing are accounted for in "Other current or non-current assets, net".
Changes in these two categories of assets are included in cash flows from operating activities in the consolidated statement of cash flows.
Furthermore, the Group may give guarantees to banks in connection with customer financing. These are included in commitments that are not in the statement of financial position.
w/ Stock options
In accordance with the requirements of IFRS 2 “Share-based Payment”, stock options granted to employees are included in the financial statements using the following principles: the stock option’s fair value, which is considered to be a reflection of the fair value of the services provided by the employee in exchange for the option, is determined on the grant date. It is accounted for in additional paid-in capital (credit) at grant date, with a counterpart in deferred compensation (debit) (also included in additional paid-in capital). During the vesting period, deferred compensation is amortized in the income statement.
Stock option fair value is calculated at grant date (i.e. date of approval of the plan by the Board of Directors) using the Cox-Ross-Rubinstein binomial model. This model permits consideration of the option’s characteristics, such as exercise price and expiry date, market data at the time of issuance, the interest rate on risk-free securities, share price, expected volatility at grant date and expected dividends, and behavioral factors of the beneficiary, such as expected early exercise. It is considered that a beneficiary will exercise his/her option once the potential gain becomes higher than 50% of the exercise price.
Only options issued after November 7, 2002 and not fully vested at January 1, 2005 and those issued after January 1, 2005 are accounted for according to IFRS 2.
The impact of applying IFRS 2 on net income (loss) is accounted for in “cost of sales”, “research and development costs” or “administrative and selling expenses” depending on the functions of the beneficiaries.
Outstanding stock options at the acquisition date of a company acquired by Alcatel-Lucent in a business combination are usually converted into options to purchase Alcatel-Lucent shares using the same exchange ratio as for the acquired shares of the target company. In accordance with IFRS 3 “Business Combinations” and IFRS 2 “Share-based Payment” requirements, the fair value of stock options acquired at the time of acquisition is accounted for in the caption “additional paid-in capital”. Unvested options at the acquisition date are accounted for at their fair value as deferred compensation in equity (included in additional paid-in capital). The sum of these two amounts (fair value of outstanding stock options less deferred compensation), equivalent to the fair value of vested options, is taken into account in the cost of the business combination.

19
Only acquisitions made after January 1, 2004 and for which unvested stock options as of December 31, 2004 existed at the acquisition date are accounted for as described above.
x/ Assets held for sale and discontinued operations
A non-current asset or disposal group (group of assets or a cash generating unit) to be sold is considered as held for sale if its carrying amount will be recovered through a sale transaction rather than through continuing use. For this to be the case, the asset must be available for sale and its sale must be highly probable. These assets or disposal groups classified as held for sale are measured at the lower of carrying amount and fair value less costs to sell.
A discontinued operation is a separate major line of business or geographical area of operations for the Group that is either being sold or is being held for sale. The net income (loss) and statement of cash flow elements relating to such discontinued operations are presented in specific captions in the consolidated financial statements for all periods presented.
NOTE 2 PRINCIPAL UNCERTAINTIES REGARDING THE USE OF ESTIMATES
The preparation of consolidated financial statements in accordance with IFRSs requires that the Group make a certain number of estimates and assumptions that are considered realistic and reasonable. In the context of the current global economic environment, the degree of volatility and subsequent lack of visibility remains particularly high as of December 31, 2009. Subsequent facts and circumstances could lead to changes in these estimates or assumptions, which would affect the Group’s financial condition, results of operations and cash flows.
a/ Valuation allowance for inventories and work in progress
Inventories and work in progress are measured at the lower of cost or net realizable value. Valuation allowances for inventories and work in progress are calculated based on an analysis of foreseeable changes in demand, technology or the market, in order to determine obsolete or excess inventories and work in progress.
The valuation allowances are accounted for in cost of sales or in restructuring costs depending on the nature of the amounts concerned.
(in millions of euros) December 31, 2009
December 31, 2008
December 31, 2007
Valuation allowance for inventories and work in progress on construction contracts (500) (654) (514)
2009 2008 2007
Impact of write-downs in income (loss) before income tax, related reduction of goodwill and discontinued operations (139) (285) (186)
b/ Impairment of customer receivables
An impairment loss is recorded for customer receivables if the present value of the future receipts is below the nominal value. The amount of the impairment loss reflects both the customers’ ability to honor their debts and the age of the debts in question. A higher default rate than estimated or the deterioration of our major customers’ creditworthiness could have an adverse impact on our future results.
(in millions of euros) December 31, 2009
December 31, 2008
December 31, 2007
Accumulated impairment losses on customer receivables (168) (207) (187)
2009 2008 2007
Impact of impairment losses in income (loss) before income tax related reduction of goodwill, and discontinued operations (23) (17) (3)
c/ Capitalized development costs, other intangible assets and goodwill
Capitalized development costs
(in millions of euros) December 31, 2009
December 31, 2008
December 31, 2007
Capitalized development costs, net 558 578 596
The criteria for capitalizing development costs are set out in Note 1f. Once capitalized, these costs are amortized over the estimated useful lives of the products concerned (3 to 10 years).

20
The Group must therefore evaluate the commercial and technical feasibility of these development projects and estimate the useful lives of the products resulting from the projects. Should a product fail to substantiate these assumptions, the Group may be required to impair or write off some of the capitalized development costs in the future.
An impairment loss of € 20 million on capitalized development costs was accounted for in 2009.
Impairment losses for capitalized development costs of € 135 million were accounted for in the fourth quarter of 2008 mainly related to a change in our WiMAX strategy, by focusing on supporting fixed and nomadic broadband access applications for providers. These impairment losses are presented on the specific line item “Impairment of assets” in the income statement.
During the fourth quarter of 2009, following the Group’s decision to stop any new WiMAX development on the existing hardware platform and software release, restructuring costs of € 44 million were reserved.
Impairment losses for capitalized development costs of € 41 million were accounted for in 2007 mainly related to the UMTS (Universal Mobile Telecommunications Systems) business.
Other intangible assets and Goodwill
(in millions of euros) December 31, 2009
December 31, 2008
December 31, 2007
Goodwill, net 4,168 4,215 7,328
Intangible assets, net (1) 2,214 2,567 4,230
TOTAL 6,382 6,782 11,558
(1) Including capitalized development costs, net.
Goodwill amounting to € 8,051 million and intangible assets amounting to € 4,813 million were accounted for in 2006 as a result of the Lucent business combination (see note 3), using market-related information, estimates (primarily based on risk adjusted discounted cash flows derived from Lucent’s management) and judgment (in particular in determining the fair values relating to the intangible assets acquired).
No impairment loss on goodwill was accounted for during 2009.
Impairment losses of € 4,545 million were accounted for in 2008 mainly related to the CDMA (€ 2,533 million), Optics (€ 1,019 million), Multicore (€ 300 million), and Applications (€ 339 million) business divisions, which are considered to be groups of Cash Generating Units (“CGUs”) at which level impairment tests of goodwill are performed (see notes 7, 12 and 13).
An impairment loss of € 2,832 million was accounted for in 2007, of which € 2,657 million was charged to goodwill and € 175 million was charged to other intangible assets, mainly for the CDMA and IMS Business Divisions and the UMTS business.
The recoverable value of each business division is calculated upon a five years discounted cash flow approach plus a discounted residual value, corresponding to the weighted average of the following three approaches:
• capitalization to perpetuity of the normalized cash flows of year 5 (Gordon Shapiro approach) – weighted 50%,
• application of a Sales Multiple (Enterprise Value-“EV”/Sales) – weighted 25%, • application of an Operating Profit Multiple (Enterprise Value-“EV”/Earnings Before Interest, Tax, Deprecia-
tion and Amortization-“EBITDA”) –weighted 25%. The recoverable values of our goodwill and intangible assets, as determined for the 2009 annual impairment test performed by the Group in the second quarter 2009, were based on key assumptions which could have a significant impact on the consolidated financial statements. Some of these key assumptions are:
• discount rate; and • projected cash-flows arising out of the successful implementation of the strategic plan the Group publicly
announced on December 12, 2008 and on a nominal rate of growth of our revenues in 2010. The discount rates used for the annual impairment tests of 2009, 2008 and 2007 were the Group’s weighted average cost of capital (“WACC”) of 11%, 10% and 10% respectively. For the additional impairment tests performed during the fourth quarter of 2008 and 2007, the rates used were 12% and 10% respectively. These discount rates are after-tax rates applied to after-tax cash flows. The use of such rates results in recoverable values that are identical to those that would be obtained by using, as required by IAS 36, pre-tax rates applied to pre-tax cash flows. Given the absence of comparable “pure player” listed companies for each group of Cash Generating Units, we do not believe that the assessment of a specific WACC for each product or market is

21
feasible. A single discount rate has therefore been used on the basis that risks specific to certain products or markets have been reflected in determining the cash flows.
Holding all other assumptions constant, a 0.5% increase or decrease in the discount rate would have decreased or increased the 2009 recoverable value of goodwill and intangible assets by € 373 million and € 406 million, respectively. An increase of 0.5% in the discount rate would not have impacted impairment losses as of December 31, 2009.
As indicated in Note 1g, in addition to the annual goodwill impairment tests, impairment tests are carried out if Alcatel-Lucent has indications of a potential reduction in the value of its goodwill or intangible assets. Possible impairments are based on discounted future cash flows and/or fair values of the assets concerned. Changes in the market conditions or the cash flows initially estimated can therefore lead to a review and a change in the impairment losses previously recorded.
Due to the change in the recent economic environment and the volatile behaviour of financial markets, the Group assessed whether as of December 31, 2009 there was any indication that any business division goodwill may be impaired at that date. The Group concluded that there were no triggering events that would justify performing an additional impairment test as of December 31, 2009.
d/ Impairment of property, plant and equipment
In accordance with IAS 36 “Impairment of Assets”, when events or changes in market conditions indicate that tangible or intangible assets may be impaired, such assets are reviewed in detail to determine whether their carrying value is lower than their recoverable value, which could lead to recording an impairment loss (recoverable value is the higher of value in use and fair value less costs to sell) (see Note 1g). Value in use is estimated by calculating the present value of the future cash flows expected to be derived from the asset. Fair value less costs to sell is based on the most reliable information available (market statistics, recent transactions, etc.).
When determining recoverable values of property, plant and equipment, assumptions and estimates are made, based primarily on market outlooks, obsolescence and sale or liquidation disposal values. Any change in these assumptions can have a significant effect on the recoverable amount and could lead to a revision of recorded impairment losses.
The planned closing of certain facilities, additional reductions in personnel and unfavorable market conditions have been considered impairment triggering events in prior years. No impairment loss on property, plant and equipment was accounted for in 2009 (€ 39 million in 2008). Impairment losses of € 94 million were accounted for during 2007 mainly related to the UMTS business and the planned disposal of real estate.
e/ Provision for warranty costs and other product sales reserves
Provisions are recorded for (i) warranties given to customers on Alcatel-Lucent products, (ii) expected losses at completion and (iii) penalties incurred in the event of failure to meet contractual obligations. These provisions are calculated based on historical return rates and warranty costs expensed as well as on estimates. These provisions and subsequent changes to the provisions are recorded in cost of sales either when revenue is recognized (provision for customer warranties) or, for construction contracts, when revenue and expenses are recognized by reference to the stage of completion of the contract activity. Costs and penalties ultimately paid can differ considerably from the amounts initially reserved and could therefore have a significant impact on future results.
Product sales reserves (in millions of euros)
December 31, 2009
December 31, 2008
December 31, 2007
Related to construction contracts (1) 114 186 147
Related to other contracts (2) 482 575 557
TOTAL 596 761 704
(1) See Note 18, included in the amounts due to/from customers on construction contracts. (2) See Note 27.
For further information on the impact on the income statement of the change in these provisions, see notes 18 and 27.
f/ Deferred taxes
Deferred tax assets relate primarily to tax loss carry-forwards and to deductible temporary differences between reported amounts and the tax bases of assets and liabilities. The assets relating to the tax loss carry-forwards are recognized if it is probable that the Group will generate future taxable profits against which these tax losses can be set off.

22
Deferred tax assets recognized (in millions of euros)
December 31, 2009
December 31, 2008
December 31, 2007
Related to the United States 206 (1) 339 (1) (2) 675 (2)
Related to France 451 (1) 339 (1) (2) 404 (2)
Related to other tax jurisdictions 179 174 153
TOTAL 836 852 1,232
(1) Following the performance of the 2009 and 2008 annual goodwill impairment tests, a reassessment of deferred taxes resulted in reducing the deferred tax assets recorded in the United States and increasing those recognized in France compared to the situation as of Decem-ber 31, 2008 and December 31, 2007.
(2) Following the performance of an additional impairment test of goodwill during the fourth quarter of 2008 and 2007, a reassessment of deferred taxes resulted in the reduction of deferred tax assets recorded in the United States and in France compared to the situation as of December 31, 2007 and December 31, 2006 respectively.
Evaluation of the Group’s capacity to utilize tax loss carry-forwards relies on significant judgment. The Group analyzes past events and the positive and negative elements of certain economic factors that may affect its business in the foreseeable future to determine the probability of its future utilization of these tax loss carry-forwards, which also consider the factors indicated in note 1n. This analysis is carried out regularly in each tax jurisdiction where significant deferred tax assets are recorded. If future taxable results are considerably different from those forecast that support recording deferred tax assets, the Group will be obliged to revise downwards or upwards the amount of the deferred tax assets, which would have a significant impact on Alcatel-Lucent's statement of financial position and net income (loss).
As a result of the business combination with Lucent, € 2,395 million of net deferred tax liabilities were recorded as of December 31, 2006, resulting from the temporary differences generated by the differences between the fair value of assets and liabilities acquired (mainly intangible assets such as acquired technologies) and their corresponding tax bases. These deferred tax liabilities will be reduced in future Group income statements as and when such differences are amortized. The remaining deferred tax liabilities related to the purchase price allocation of Lucent as of December 31, 2009 are € 751 million (€ 957 million as of December 31, 2008 and € 1,629 million as of December 31, 2007).
As prescribed by IFRSs, Alcatel-Lucent had a twelve-month period to complete the purchase price allocation and to determine whether certain deferred tax assets related to the carry-forward of Lucent’s unused tax losses that had not been recognized in Lucent’s historical financial statements should be recognized in Alcatel-Lucent's financial statements. If any additional deferred tax assets attributed to the combined company’s unrecognized tax losses existing as of the transaction date are recognized in future financial statements, the tax benefit will be included in the income statement.
g/ Pension and retirement obligations and other employee and post-employment benefit obligations
Actuarial assumptions
Alcatel-Lucent’s results of operations include the impact of significant pension and post-retirement benefits that are measured using actuarial valuations. Inherent in these valuations are key assumptions, including assumptions about discount rates, expected return on plan assets, healthcare cost trend rates and expected participation rates in retirement healthcare plans. These assumptions are updated on an annual basis at the beginning of each fiscal year or more frequently upon the occurrence of significant events. In addition, discount rates are updated quarterly for those plans for which changes in this assumption would have a material impact on Alcatel-Lucent’s results or shareholders’ equity.
2009 2008 2007
Weighted average expected rates of return on pension and post-retirement plan assets 6.69% 7.04% 7.39%
Weighted average discount rates used to determine the pension and post-retirement obligations 5.84% 6.44% 5.54%
The net effect of pension and post-retirement costs included in “income (loss) before tax, related reduction of goodwill and discontinued operations” was a € 150 million increase in pre-tax income during 2009 (€ 246 million increase in pre-tax income during 2008 and a € 628 million increase in pre-tax income during 2007). Included in the € 150 million increase in 2009 was € 253 million booked as a result of certain changes to management retiree pension and healthcare benefit plans (refer to Note 25f). Included in the € 246 million increase in 2008 was € 65 million booked as a result of certain changes to management retiree healthcare benefit plans (refer to Note 25f). Included in the € 628 million increase in 2007 was € 258 million booked as a result of certain changes to management retiree healthcare benefit plans (refer to Note 25f).

23
Discount rates
Discount rates for Alcatel-Lucent's U.S. plans are determined using the values published in the "original" CitiGroup Pension Discount Curve which is based on AA-rated corporate bonds. Each future year's expected benefit payments are discounted by the corresponding value in the CitiGroup Curve, and for those years not presented in the CitiGroup Curve, we use the value ot the last year presented for benefit payments expected to occur beyond the final year of the curve. Then a single discount rate is selected that results in the same interest cost for the next period as the application of the individual rates would have produced. Discount rates for Alcatel-Lucent's non U.S. plans are determined based on Bloomberg AA Corporate yields.
Holding all other assumptions constant, a 0.5% increase or decrease in the discount rate would have decreased or increased the 2009 net pension and post-retirement result by approximately € (35) million and € 49 million, respectively.
Expected return on plan assets
Expected return on plan assets for Alcatel-Lucent's U.S. plans are determined based on recommendations from our external investment advisor and our own experienced historical returns. Our advisor develops its recommendations by applying the long-term return expectations it develops for each of many classes of investments, to the specific classes and values of investments held by each of our benefit plans. Expected return assumptions are long-term assumptions and are not intended to reflect expectations for the period immediately following their determination. Although these assumptions are reviewed each year, we do not update them for small changes in our advisor's recommendations. However, the pension expense or credit for our U.S. plans is updated every quarter using the fair value of assets and discount rates as of the beginning of the quarter. The 2009 fourth quarter expected return on plan assets (accounted for in “other financial income (loss)”) for Alcatel-Lucent’s U.S. plans is based on September 30, 2009 plan asset fair values. However, the expected return on plan assets for Alcatel-Lucent’s non U.S. plans is based on the fair values of plan assets at December 31, 2008.
Holding all other assumptions constant, a 0.5% increase or decrease in the expected return on plan assets would have increased or decreased the 2009 net pension and post-retirement result by approximately € 122 million.
Alcatel-Lucent recognized a US$ 70 million increase between the 2009 third quarter and the 2009 fourth quarter in the net pension credit, which is accounted for in “other financial income (loss)” (expected return on plan assets for Alcatel-Lucent’s U.S. plans due to the increase of the plan asset fair values and expected change of the interest cost in relation with the change of the liability). On Alcatel-Lucent’s U.S. plans, Alcatel-Lucent expects a US$ 30 million decrease of the net pension credit to be accounted for in “other financial income (loss)” between the 2009 fourth quarter and the 2010 first quarter. Alcatel-Lucent does not anticipate a material impact from on U.S. plans.
Healthcare inflation trends
Regarding healthcare inflation trend rates for Alcatel-Lucent’s U.S. plans, our actuary annually reviews expected cost trends from numerous healthcare providers, recent developments in medical treatments, the utilization of medical services, and Medicare future premium rates published by the U.S. government's Center for Medicare and Medicaid Services (CMS) as these premiums are reimbursed for some retirees. They apply these findings to the specific provisions and experience of Alcatel-Lucent's U.S. post-retirement healthcare plans in making their recommendations. In determining our assumptions, we review our recent experience together with our actuary's recommendations.
Participation assumptions
Alcatel-Lucent's U.S. post-retirement healthcare plans allow participants to opt out of coverage at each annual enrollment period, and for almost all to opt back in at any future annual enrollment. An assumption is developed for the number of eligible retirees who will elect to participate in our plans at each future enrollment period. Our actuaries develop a recommendation based on the expected increases in the cost to be paid to a retiree participating in our plans and recent participation history. We review this recommendation annually after the annual enrollment has been completed and update it if necessary.
Mortality assumptions
The mortality assumption for Alcatel-Lucent’s U.S. plans is based on actual recent experience of the participants in our management pension plan and our occupational pension plans. For the 2009 year-end valuation, we updated the mortality assumptions, again based on the actual experience of the two plans. We looked at the experience for the years of 2004 through 2008. As was the case previously, there was insufficient experience to develop assumptions for active employees and former employees who have delayed commencing their pension benefits, so we used the RP 2000 mortality table projected up to year 2009.

24
Plan assets investment
At its meeting in July 29, 2009, the Board of Directors approved the following modifications to the asset allocation of Alcatel-Lucent 's funds: the investments in equity securities is to be reduced from 22.5% to 15% and the investments in bonds is to be increased from 62.5% to 70%, while investments in alternatives (i.e., real estate, private equity and hedge funds) is to remain unchanged. The reduction in equity investments in favor of fixed income securities was achieved immediately. The changes within the fixed income portfolio could take up to a year to complete. We believe that these changes should lead to a slight decrease in long-term returns from financial assets. The impact of these changes have been reflected in our expected return assumptions for year 2010.
Plans assets are invested in many different asset categories (such as cash, equities, bonds, real estate, private equity, etc.). In the quarterly update of plan asset fair values, approximately 80% are based on closing date fair values and 20% have a one to three month delay as the fair value of private equity, venture capital, real estate and absolute return investments are not available in a short period. This is standard practice in the investment management industry. Assuming that the December 31, 2009 actual fair values of private equity, venture capital, real estate and absolute return investments at year end were 10% lower than the ones used for accounting purposes as of December 31, 2009, and since the Management Pension Plan has a material investment in these asset classes (and the asset ceiling described below is not applicable to this plan), equity would be negatively impacted by approximately € 210 million.
Asset ceiling
According to IAS19, the amount of prepaid pension costs that can be recognized in our financial statements is limited to the sum of (i) the cumulative unrecognized net actuarial losses and past service cost, (ii) the present value of any available refunds from the plan and (iii) any reduction in future contributions to the plan. As Alcatel-Lucent currently used and intends to use in the future eligible excess pension assets applicable to formerly represented retirees to fund certain retiree healthcare benefits for such retirees, such use is considered as a reimbursement from the pension plan when setting the asset ceiling.
The impact of expected future economic benefits on the pension plan asset ceiling is a complex matter. For formerly represented retirees, we expect to fund our current retiree healthcare obligation with Section 420 Transfers (IRS Section 420 provides for transfers of certain excess pension plan assets held by a defined pension plan into a retiree health benefits account established to pay retiree health benefits) from the U.S. Occupational pension plan. We may select among numerous methods available for valuing plan assets and obligations for funding purposes and for determining the amount of excess assets available for Section 420 Transfers. The assumptions to be used for the January 1, 2010 valuation have not been chosen at this time. Also, asset values for private equity, real estate, and certain alternative investments, and the obligation based on January 1, 2010 census data will not be final until late in the third quarter of 2010. Based on latest estimates and using variations of the available methods, as of the January 1, 2010 valuation date, pension plan assets that would be eligible for "collectively bargained" transfers and above 120% of the plan obligations is between € 1.2 billion and € 2.3 billion (alternatively, excess above 125% of plan obligations that would be available for “multi-year” transfers, which also require the plan to remain 120% funded during the transfer period is between € 0.8 billion and € 1.9 billion). However, deterioration in the funded status of the U.S. occupational pension plan could negatively impact our ability to make future Section 420 Transfers.
h/ Revenue recognition
As indicated in note 1o, revenue under IAS 18 accounting is measured at the fair value of the consideration received or to be received when the Group has transferred the significant risks and rewards of ownership of a product to the buyer.
For revenues and expenses generated from construction contracts, the Group applies the percentage of completion method of accounting, provided certain specified conditions are met, based either on the achievement of contractually defined milestones or on costs incurred compared with total estimated costs. The determination of the stage of completion and the revenues to be recognized rely on numerous estimations based on costs incurred and acquired experience. Adjustments of initial estimates can, however, occur throughout the life of the contract, which can have significant impacts on future net income (loss).
Although estimates inherent in construction contracts are subject to uncertainty, certain situations exist whereby management is unable to reliably estimate the outcome of a construction contract. These situations can occur during the early stages of a contract due to a lack of historical experience or throughout the contract as significant uncertainties develop related to additional costs, claims and performance obligations, particularly with new technologies. During the fourth quarter of 2007, as a result of cost overruns and major technical problems that we experienced in implementing a large W-CDMA (Wideband Code Division Multiple Access) contract, we determined then that we could no longer estimate with sufficient reliability the final revenue and associated costs of such contract. As a result, we expensed all the contract costs incurred to that date, and we only recognized revenues to the extent that the contract costs incurred were recoverable. Consequently,

25
revenues of € 72 million and cost of sales of € 298 million were recognized in 2007 in connection with this construction contract. The negative impact on income (loss) before tax, related reduction of goodwill and discontinued operations of changing from the percentage of completion method to this basis of accounting was € 98 million for 2007. This basis of accounting was maintained in 2008 and for the first nine months of 2009. During that 21 month period, our operational performance on the contract steadily improved to a point where we could then estimate reliably the outcome of the contract. However, because the contract was considered complete starting on October 1, 2009, reverting back to percentage of completion accounting was no longer necessary.
Contracts that are multiple-element arrangements can include hardware products, stand-alone software, installation and/or integration services, extended warranty, product roadmaps, etc. Revenue for each unit of accounting is recognized when earned based on the relative fair value of each unit of accounting as determined by internal or third-party analyses of market-based prices. If the criteria described in Note 1o are met, revenue is earned when units of accounting are delivered. If such criteria are not met, revenue for the arrangement as a whole is accounted for as a single unit of accounting. Significant judgment is required to allocate contract consideration to each unit of accounting and determine whether the arrangement is a single unit of accounting or a multiple element arrangement. Depending upon how such judgment is exercised, the timing and amount of revenue recognized could differ significantly.
For multiple element arrangements that are based principally on licensing, selling or otherwise marketing software solutions, judgment is required as to whether such arrangements are accounted for under IAS 18 or IAS 11. Software arrangements requiring significant production, modification or customization are accounted for as a construction contract under IAS 11. All other software arrangements are accounted for under IAS 18, in which case the Group requires vendor specific objective evidence (VSOE) of fair value to separate the multiple software elements. If VSOE of fair value is not available, revenue is deferred until the final element in the arrangement is delivered or revenue is recognized over the period that services are being performed if services are the last undelivered element. Significant judgment is required to determine the most appropriate accounting model to be applied in this environment and whether VSOE of fair value exists to allow separation of multiple software elements.
For product sales made through distributors, product returns that are estimated according to contractual obligations and past sales statistics are recognized as a reduction of sales. Again, if the actual product returns were considerably different from those estimated, the resulting impact on the net income (loss) could be significant.
It can be difficult to evaluate the Group’s capacity to recover receivables. Such evaluation is based on the customers’ creditworthiness and on the Group’s capacity to sell such receivables without recourse. If, subsequent to revenue recognition, the recoverability of a receivable that had been initially considered as likely becomes doubtful, a provision for an impairment loss is then recorded (see Note 2b above).
i/ Purchase price allocation of a business combination
In a business combination, the acquirer must allocate the cost of the business combination at the acquisition date by recognizing the acquiree’s identifiable assets, liabilities and contingent liabilities at fair value at that date. The allocation is based upon certain valuations and other studies performed with the assistance of outside valuation specialists. Due to the underlying assumptions made in the valuation process, the determination of those fair values requires estimations of the effects of uncertain future events at the acquisition date and the carrying amounts of some assets, such as fixed assets, acquired through a business combination could therefore differ significantly in the future.
As prescribed by IFRS 3, if the initial accounting for a business combination can be determined only provisionally by the end of the reporting period in which the combination is effected, the acquirer must account for the business combination using those provisional values and has a twelve-month period to complete the purchase price allocation. Any adjustment of the carrying amount of an identifiable asset or liability made as a result of completing the initial accounting is accounted for as if its fair value at the acquisition date had been recognized from that date. Detailed adjustments accounted for in the allocation period are disclosed in Note 3.
Once the initial accounting of a business combination is complete, only errors may be corrected.
j/ Accounting treatment of convertible bonds with optional redemption periods/dates before contractual maturity
Some of our convertible bonds have optional redemption periods/dates occurring before their contractual maturity, as described in Note 24. All the Alcatel-Lucent convertible bond issues were accounted for in accordance with IAS 32 requirements (paragraphs 28 to 32) as described above in Note 1m. Classification of the liability and equity components of a convertible instrument is not revised when a change occurs in the likelihood that a conversion will be exercised. On the other hand, if optional redemption periods/dates occur before the contractual maturity of a debenture, a change in the likelihood of redemption before the contractual maturity can lead to a change in the estimated payments. As prescribed by IAS 39, if an issuer revises the estimates of payment due to reliable new estimates, it must adjust the carrying amount of the instrument by computing the

26
present value of the remaining cash flows at the original effective interest rate of the financial liability to reflect the revised estimated cash flows. The adjustment is recognized as income or expense in profit or loss.
As described in Notes 8, 24 and 26, such a change in estimates occurred during the second quarter of 2009 regarding Lucent’s 2.875% Series A convertible debenture. Similar changes in estimates could occur in the future for all convertible debentures with optional redemption periods/dates. A loss corresponding to the difference between the present value of the revised estimated cash flows and the carrying amount derived from the split accounting, as described in note 1m, could impact “other financial income (loss)” as a result of any change in the Group’s estimate of redemption triggers on all of Lucent’s convertible debt. An approximation of the potential negative impact on “other financial income (loss)” is the carrying amount of the equity component, as disclosed in Notes 24 and 26.
If all or some of the holders of Lucent’s 2.875% Series A convertible debentures do not demand redemption on the first optional redemption date, which is on June 15, 2010, the estimated cash flows related to the remaining debt will then be revised accordingly, if new estimates are considered reliable, with a corresponding potential positive impact on “other financial income (loss)”. The initial accounting treatment could then be reapplied.
k/ Insured damages
In 2008, Alcatel-Lucent experienced a fire in a newly-built factory containing new machinery. Non-recoverable assets having a net book value of € 4 million were written off as of September 30, 2008, representing an equivalent negative impact on cost of sales in 2008. The cost of the physical damage and business interruption were insured and gave right to an indemnity claim, the amount of which was definitively settled as of September 30, 2009. Alcatel-Lucent received € 33 million on its business interruption insurance which was accounted for in other revenues during 2009, only when the cash was received.
In December 2009, the roof and technical floor of Alcatel-Lucent Spain’s headquarters’ building in Madrid partially collapsed for unknown reasons. Alcatel-Lucent Spain rents this building and the lease is accounted for as an operating lease. The damaged assets were derecognized as of December 31, 2009 with a negative impact of € 1 million on income (loss) from operating activities. All costs related to this incident (damaged assets, displacement and relocation costs, etc.) are insured for amounts a € 15 million deductible. Displacement and relocation costs below this threshold will be accounted for as incurred in 2010. As the cause of the incident is still not known, nothing has been reserved related to Alcatel-Lucent Spain’s potential liability to third parties. At this stage, Alcatel-Lucent Spain’s liability is not considered probable. However, depending upon the results of the investigation, this situation could evolve.
NOTE 3 CHANGES IN CONSOLIDATED COMPANIES
The main changes in consolidated companies for 2009 were as follows:
• On November 23, 2009, Alcatel-Lucent announced an agreement to sell its electrical fractional horsepower motors and drives activities, Dunkermotoren GmbH, to Triton, a leading European private equity firm, for an enterprise value of € 145 million. The sale was completed on December 31, 2009 and the preliminary cash proceeds received was €128 million. The net capital gain of €99 million is presented in the line item “Gain/(loss) on disposal of consolidated entities” in the income statement.
• On April 30, 2009, Bharti Airtel and Alcatel-Lucent announced the formation of a joint venture to manage Bharti Airtel’s pan-India broadband and telephone services and help Airtel’s transition to next generation network across India. A new legal entity was formed which was fully consolidated by Alcatel-Lucent from September 30, 2009 onwards.
• The sale of our 20.8% stake in Thales was completed during the second quarter of 2009 with a capital gain of € 255 million accounted for in “other financial income (loss)”. This capital gain takes into account € 191 mil-lion corresponding to the remaining part of the capital gain that was accounted for on different assets dis-posed of or contributed to Thales in the past, and which was eliminated as an intra-group transaction.
• The purchase price of € 670 million paid to the Group by Thales for the disposal of the space business com-pleted in 2007 was subject to adjustment in 2009. As a result, Thales was required to pay to the Group an additional € 130 million (before fees), which was accounted for in “income from discontinued operations” and cashed in for an amount of € 118 million during the second quarter of 2009.
The main changes in consolidated companies for 2008 were as follows:
• On December 19, 2008, Alcatel-Lucent and Dassault Aviation announced that they had signed the definitive agreement to sell Alcatel-Lucent’s shares in Thales (41,262,481 shares) at a price of € 38 per share, repre-senting a total value of € 1.57 billion.
• On May 12, 2008, Alcatel-Lucent and Reliance Communications announced the formation of a global joint venture to offer managed network services to telecom operators. The first project of this joint venture is to

27
provide managed services for Reliance Communications CDMA and GSM networks in India. Alcatel-Lucent controls the operations of the joint venture and fully consolidates it.
• On June 17, 2008, Alcatel-Lucent announced that it had entered into a definitive agreement to acquire Mo-tive, Inc, a leading provider of service management software for broadband and mobile data services, through a cash tender offer for all outstanding Motive shares at a price of US$ 2.23 per share, representing a value of approximately US$ 67.8 million. Based upon the preliminary purchase price allocation, goodwill for this acquisition amounted to € 58 million as of December 31, 2008.
The main changes in consolidated companies for 2007 were as follows:
• On December 2007, our 49.9% share in Draka Comteq B.V. (“Draka Comteq”) was sold to Draka for € 209 million in cash. Under this transaction, Draka acquired full ownership of Draka Comteq. Since the initial es-tablishment of the joint venture, Draka Comteq was controlled by Draka and its results were consolidated in full in the Draka consolidated financial statements and under the equity method in the Alcatel-Lucent con-solidated financial statements. The gain on disposal amounted to € 74 million and was recorded in the line item “Other financial income (loss)” (see Note 8). The amount of capital gain takes into account the esti-mated impact of an indemnity clause related to a pending litigation and, as a result, the capital gain may be revised in future periods (refer to Note 8);
• On January 5, 2007, we completed the contribution to Thales of our railway signaling business and our inte-gration and services activities for mission-critical systems not dedicated to operators or suppliers of tele-communications services;
• In April 2007, the ownership interests in two joint ventures in the space sector were sold to Thales for € 670 million in cash, which was subject to adjustment in 2009;
• The adjustments recognized in 2007 that related to the business combination with Lucent during 2006 were as follows:
(in millions of euros)
As of December
31, 2007
As of December
31, 2006 Difference
Cost of the business combination (A) 9,895 9,891 4 (1)
Net assets acquired (B) 2,186 1,840 346 (2)
GOODWILL (A) – (B) 7,709 8,051 (342)
(1) Relates to changes in the estimated transaction cost. (2) Of which: – change in the fair value of intangible assets: € 94 million; – change in the fair value of property, plant and equipment: € (205) million; – increase of deferred tax assets recognized: € 181 million in connection with the option elected in accounting for pension and other
employee benefits (see Note 1k); – reduction of goodwill due to the recognition of deferred tax assets of € 256 million (of which € 181 million related to the post-retirement
benefit plan amendment); – decrease of goodwill in connection with the change in deferred taxes related to other adjustments: € 50 million; – other adjustments: € (30) million.
The impact of these adjustments on the 2007 net profit (loss) was not material.
The purchase price allocation was completed as of November 30, 2007.
NOTE 4 CHANGE IN ACCOUNTING POLICY AND PRESENTATION
a/ Change in accounting policy
2009
No change in accounting policy occurred in 2009.
2008
First application of IFRIC 14 (Interpretation of IAS 19 - The limit on a defined benefit asset, minimum funding requirements and their interaction)
The “asset ceiling” rule of IAS 19 limits the measurement of a defined benefit asset to “the present value of economic benefits available in the form of refunds from the plan or reductions in future contributions to the plan plus unrecognized gains and losses”. Questions have arisen about when refunds or reductions in future contributions should be considered available, particularly when a minimum funding requirement exists.

28
In the United Kingdom, for example, minimum funding requirements exist to improve the security of the post-employment benefit obligations to participants of an employee benefit plan. Such requirements normally stipulate a minimum amount or level of contributions that must be made to a plan over a given period. Therefore, a minimum funding requirement may limit the ability of the entity to reduce future contributions.
Further, the limit on the measurement of the value of a defined benefit asset may cause the minimum funding requirement to be onerous. Normally, a requirement to make contributions to a plan would not affect the value of the defined benefit asset or liability. This is because the contributions, once paid, will become plan assets and so the additional net liability is nil. However, a minimum funding requirement may give rise to a liability if the required contributions will not be available to the entity once they have been paid.
The first application of this new interpretation had a negative impact on our shareholders’ equity as of December 31, 2008 of (€ 91) million? (€ 45) million as of December 31, 2007 and (€ 82) million as of December 31, 2006 in connection with our pension plans in the United Kingdom.
2007
On January 1, 2007, Alcatel-Lucent adopted (with retrospective effect as of January 1, 2005) the option offered by Amendment to IAS 19 “Employee benefits – Actuarial gains and losses, Group plans and Disclosures”, to immediately recognize all actuarial gains and losses and any adjustment arising from an asset ceiling, net of deferred tax effects, in the period in which they occur outside the income statement in the Statement Of Recognized Income and Expense (SORIE)° This statement was renamed “Statement of Comprenhensive Income” beginning in 2009. Management believes that the change will more fairly present the fair value of assets and liabilities related to retiree benefits in the company’s statement of financial position and eliminate significant volatility in its results of operations for certain plans, the participants of which are all, or almost all, fully eligible to receive benefits.
Previously, Alcatel-Lucent applied the corridor method, under which actuarial gains and losses exceeding 10% of the greater of (i) the benefit obligation or (ii) the fair value of plan assets were recognized in the income statement over the expected remaining working lives of the employees participating in the plans. The impact of the limitation in the value of plan assets to the lower of: (i) the value resulting from applying IAS 19 “Employee Benefits” prior to the Group’s adoption of the option provided by the amendment to IAS 19, and (ii) the net total present value of any available refund from the plan or reduction in future contributions to the plan (arising from asset ceilings) was accounted for in the income statement.
b/ Change in presentation
Since January 1, 2007, the Group presents sales commissions under “administrative and selling expenses” and not in “cost of sales” as previously presented by historical Alcatel.
NOTE 5 INFORMATION BY OPERATING SEGMENT AND BY GEOGRAPHICAL SEGMENT
In accordance with IFRS 8 “Operating Segments”, the information by operating segment comes from the business organization and activities of Alcatel-Lucent.
The tables below present information for the operating segments described hereunder. They take into account the new organization announced in the fourth quarter 2008 and comprise four operating segments: Carrier, Applications Software, Enterprise and Services. This new organization was effective January 1, 2009.
The information reported for each of our four operating segments is the same as that presented to the Chief Operating Decision Maker (i.e. the Chief Executive Officer) and is used to make decisions on resource allocation and to assess performance. As of January 1, 2009, the four operating segments are:
• Carrier: this segment is streamlined to encompass four main business divisions: IP, Optics (hosting terres-trial as well as submarine activities), Wireless networks and Wireline networks. Carrier segment also hosts another business division of smaller size: Radio Frequency Systems.
• Applications Software: a new operating segment that consolidates the various software businesses that were previously spread throughout the Group, and is designed to increase our focus on and support for our soft-ware applications business. The Applications Software segment is an integral part of our new strategic focus on new services and applications that combine the trusted capabilities of the network with the creative services delivered over the internet. This segment consists of the Applications Software business division that had previously been part of the Carrier business group configuration in 2008, the Genesys contact cen-ter software business that had previously been part of the Enterprise business group configuration in 2008, and the applications maintenance business division.
• Enterprise: focused on small, medium and large enterprises and is unchanged compared to the Enterprise business group configuration in 2008apart from the exclusion of Genesys now reported under the Applica-

29
tions Software segment. This segment hosts the Enterprise solutions business division and also another busi-ness division related to activities of smaller size in the field of industrial components.
• Services: this segment is composed of four business divisions: Managed & outsourcing solutions, Carrier Product attached maintenance, Multivendor maintenance, and Network and system integration. It no longer includes OSS/BSS (operations support systems/business support systems) software activities that are now part of the Applications Software segment.
The information presented below for 2008 and 2007 is restated to take into account the new organization described above. Additionally, the presentation of certain other information, such as the difference between the employee bonus accrual and the initially budgeted amount is modified to be presented within each operating segment, whereas it used to be presented in the “Other & unallocated amounts” column in the former segment information.
The information by operating segment follows the same accounting policies as those used and described in these consolidated financial statements.
All inter-segment commercial relations are conducted on an arm’s length basis on terms and conditions identical to those prevailing for the supply of goods and services to third parties.
The new business model also comprises three regions, Americas; Europe, Middle East and Africa (EMEA); and Asia Pacific (APAC), rather than the two we had prior to January 1, 2009. The regions’ primary mission is to sell and ensure the highest customer satisfaction. The three regions each have complete responsibility for all customer-focused activities except for the Enterprise and IPS markets.

30
a/ Information by operating segment
(in millions of euros) CarrierApplications
Software Enterprise Services
Total reportable segments
Other and unallocated
amounts Total
2009
Revenues from external customers 9,047 1,084 1,006 3,537 14,674 483 15,157
Revenues from transactions with other operating segments 29 51 30 32 142 (142) -
Revenues from operating segments 9,076 1,135 1,036 3,569 14,816 341 15,157
Segment operating income (loss) (297) 14 (17) 203 (97) 41 (56)
Amounts included in the segment operating income (loss):
• depreciation and amortization (483) (48) (67) (63) (661) (44) (705)
• material non-cash items other than depreciation and amortization -
- - - - - -
Segment assets (1) 6,406 409 358 914 8,087 901 8,988
2008
Revenues from external customers 10,957 1,008 1,200 3,339 16,504 480 16,984
Revenues from transactions with other operating segments 23 37 23 14 97 (97) -
Revenues from operating segments 10,980 1,045 1,223 3,353 16,601 383 16,984
Segment operating income (loss) 251 (49) 84 234 520 (54) 466
Amounts included in the segment operating income (loss):
• depreciation and amortization (530) (73) (70) (59) (732) (19) (751)
• material non-cash items other than depreciation and amortization -
- - - - - -
Segment assets (1) 8,022 467 528 1,040 10,057 1,043 11,100
2007
Revenues from external customers 12,251 944 1,210 3,019 17,424 368 17,792
Revenues from transactions with other operating segments 79 31 22 140 272 (272) -
Revenues from operating segments 12,330
975 1,232 3,159 17,696 96 17,792
Segment operating income (loss) 72 (133) 77 108 124 (14) 110
Amounts included in the segment operating income (loss):
• depreciation and amortization (634) (94) (81) (61) (870) (16) (886)
• material non-cash items other than depreciation and amortization -
- - - - - -
Segment assets (1) 9,598 777 523 853 11,751 1,082 12,833
(1) Assets included in segment assets consist of intangible assets, property, plant and equipment and assets included in operating working capital (comprised of inventory and work in progress, customer receivables (including those recorded in amounts due from customers on construction contracts) and advances and progress payments). See Note 18. The amounts reported as segment assets include the PPA entries related to the Lucent business combination.

31
b/ Reconciliation to consolidated financial statements
(in millions of euros) 2009 2008 2007
Revenues from reportable segments 14,816 16,601 17,696
Revenues from Other segment 483 480 368
Intersegment eliminations (142) (97) (272)
Total Group revenues 15,157 16,984 17,792
Reportable segments operating income (loss) (97) 520 124
Operating income (loss) of other segment and unallocated amounts (1) 41 (54) (14)
Segment operating income (loss) (56) 466 110
PPA (2) adjustments (excluding restructuring costs and impairment of assets) (269) (522) (3) (817)
Income (loss) from operating activities before restructuring costs, impairment of assets, gain/(loss) on disposal of consolidated entities, litigations and post-retirement benefit plan amendments (325) (56) (707)
Restructuring costs (605) (562) (856)
Impairment of assets - (4,725) (2,944)
Litigations (109) - -
Post-retirement benefit plan amendments 248 47 258
Gain/(loss) on disposal of consolidated entities 99 (7) -
INCOME (LOSS) FROM OPERATING ACTIVITIES (692) (5,303) (4,249)
(1) Including € 58 million of share-based payments that are not allocated to reportable segments in 2009 (€ 85 million in 2008 and € 102 million in 2007).
(2) PPA: purchase price allocation entries related to Lucent business combination. (3) Including € 27 million of patents at net book value that were sold during the first quarter 2008. The net book value is based on fair value
resulting from the purchase price allocation of the Lucent business combination. The capital gain on the disposal of patents included in the reportable segment operating income was € 61 million in 2008, of which € 27 million occurred in the fourth quarter 2008.
c/ Products and Services revenues
The following table sets forth revenues by product and service for the years ended December 31:
(in millions of euros) 2009 2008 2007
IP products 1,151 1,207 1,301
Optics products 2,836 3,195 3,080
Wireline products 1,592 2,179 2,771
Wireless products 3,468 4,375 5,099
Applications Software products 1,084 1,008 944
Enterprise products 1,006 1,199 1,210
Services 3,537 3,339 3,019
Other 483 480 367
TOTAL 15,157 16,984 17,792
d/ Information by geographical segment
(in millions of euros) France
Other Western Europe
Rest of Europe
Asia Pacific U.S.A.
Other Americas
Rest of world Total
2009
Revenues:
• by customer location 1,533 3,039 631 2,978 4,369 1,185 1,422 15,157
Non-current assets (1) 500 338 28 262 2,222 98 26 3,474
2008
Revenues:
• by customer location 1,419 3,537 944 3,192 4,812 1,538 1,542 16,984
Non-current assets (1) 472 401 34 268 2,624 106 13 3,918

32
(in millions of euros) 2007 France
Other Western Europe
Rest of Europe
Asia Pacific U.S.A.
Other Americas
Rest of world Total
Revenues:
• by customer location 1,219 3,657 954 3,386 5,438 1,534 1,604 17,792
Non-current assets (1) 500 434 50 229 4,326 106 13 5,658
(1) Represents intangible and tangible assets.
e/ Concentrations
A few large telecommunications service providers account for a significant portion of our revenues. Nevertheless, no single customer represented more than 10% of our total revenues either in 2009, 2008 or 2007.
NOTE 6 REVENUES
(in millions of euros) 2009 2008 2007
Construction contract revenues 2,331 2,220 2,493
Other product sales 8,944 11,139 12,101
Other service revenues 3,437 3,200 2,949
License revenues 178 235 139
Rental income and other revenues (1) 267 190 110
TOTAL 15,157 16,984 17,792
(1) Of which in 2009 € 93 million related to R&D tax credits (mainly in France). Corresponding amounts in 2008 and 2007 were respectively € 84 million and € 43 million. 2008 other revenues also include € 34 million corresponding to a partial settlement with Microsoft (see Note 34).

33
NOTE 7 IMPAIRMENT LOSSES RECOGNIZED IN THE INCOME STATEMENT
(in millions of euros) Carrier Applications
Software Enterprise Services Other Total
Group
2009
Impairment losses for goodwill - - - - - -
Impairment losses for capitalized development costs (1) (4) - (16) - - (20)
Impairment losses for other intangible assets - - - - - -
Impairment losses for property, plant and equipment - - - - - -
Impairment losses for shares in equity affiliates - - - - - -
Impairment losses for financial assets (3) - - - - (1) (1)
TOTAL – NET (4) - (16) - (1) (21)
of which reversal of impairment losses 1 1
2008
Impairment losses for goodwill (3,272) - - - (3,272)
Impairment losses for capitalized development costs (2) (135) - - (135)
Impairment losses for other intangible assets (1,276) - - (1,276)
Impairment losses for property, plant and equipment (39) - - - (39)
Impairment losses for shares in equity affiliates - - - (1) (1)
Impairment losses for financial assets (3) (11) - - (3) (14)
TOTAL – NET(4) (4,733) (4) (4,737)
of which reversal of impairment losses 3 - - 2 5
2007
Impairment losses for goodwill (2,633) (5) - (24) (5) - (2,657)
Impairment losses for capitalized development costs (41) (5) - - - (41)
Impairment losses for other intangible assets (175) (5) - - - (175)
Impairment losses for property, plant and equipment (77) (5) - - (17) (94)
Impairment losses for shares in equity affiliates (2) - - (1) (3)
Impairment losses for financial assets (3) - - - (16) (16)
TOTAL – NET (2,928) - (24) (34) (2,986)
of which reversal of impairment losses - - - - -
(1) Refer to Note 2c and Note 13. (2) Mainly related to the WiMAX technology following the decision announced on December 12, 2008 to limit our WiMAX efforts to supporting
fixed and nomadic broadband access applications and to stop the WiMAX full Mobility developments. These impairment losses are presented on the specific line item of the income statement “Impairment of assets”.
(3) Refer to Note 17. (4) Of which €(4,725) million accounted for in a specific line item (“impairment of assets”) in the income statement and the remainder is
accounted for in Income (loss) from operating activities before restructuring costs, impairment of assets, gain (loss) on disposal of consolidated entities, litigations and post-retirement benefit plan amendments.
(5) Accounted for in a specific line item (“impairment of assets”) in the income statement comprising € 2,657 million for goodwill, € 39 million for capitalized development costs, € 174 million for other intangible assets and € 74 million for property, plant and equipment and the remainder is accounted for in Income (loss) from operating activities before restructuring costs, impairment of assets, gain/(loss) on disposal of consolidated entities, litigations and post-retirement benefit plan amendments.

34
NOTE 8 FINANCIAL INCOME (LOSS)
(in millions of euros) Q4 2009 2009 2008 2007
Interest at effective interest rate (334) (379) (402)
Interest on interest rate derivatives hedging 13 (10) (2)
Interest on interest rate derivatives trading 1 1 -
Interest received on cash and marketable securities 66 176 231
Finance costs (70) (254) (212) (173)
Dividends 1 3 4 3
Provisions for financial risks - - 2 (4)
Impairment of financial assets (2) (1) (3) (16)
Net exchange gain (loss) (12) - 18 (29)
Of which:
- ineffective portion of hedge when hedge accounting is applied 2 13 (19)
- non-hedged transactions and non-application of hedge accounting (7) (1) (16)
- trading 5 6 6
Financial component of pension and post-retirement benefit costs (1) 62 105 349 544
Actual and potential capital gain/(loss) on financial assets (shares of equity affiliates or non-consolidated securities and financial receivables) and marketable securities (2) 17 295 26 126
Other (3) (8) (153) (30) (82)
Other financial income (loss) 58 249 366 541
TOTAL FINANCIAL INCOME (LOSS) (12) (5) 154 368
(1) Change between 2009 and 2008 is mainly related to Lucent pension credit (refer to Note 25). (2) Of which for 2009: a capital gain of € 250 million related to the disposal of Thales shares in May 2009.
Net gain on disposal of Draka Comteq BV shares for € 74 million during the fourth quarter of 2007. (3) 2009: of which a gain of € 50 million in the first quarter of 2009 related to the partial repurchase of Lucent’s 7.75% bonds due March 2017
(see Note 26). In the second quarter 2009 a loss of € 175 million related to a change of estimated future cash flows related to Lucent’s 2.875 % Series A convertible debentures (see Notes 15 and 17) and a loss of € 1 million and € 2 million respectively in the third and fourth quarters 2009 related to the partial repurchases of Lucent's 2.875% Series A convertible bonds and of Alcatel’s 4.75% Oceane due January 2011 (see Note 26).
2008: of which a gain of € 30 million related to the partial repurchase of Lucent’s 7.75% bonds due March 2017 and a gain of € 1 million related to the partial repurchase of Alcatel’s 4.375% bonds due February 2009 (see Note 26b).
2007: of which in the first quarter 2007, a loss of € 12 million related to the early redemption of the 8% convertible debenture (refer to Note 24). This loss was computed in accordance with IAS 32 AG33 and AG34 requirements (see Note 1m)..

35
NOTE 9 INCOME TAX AND RELATED REDUCTION OF GOODWILL
a/ Analysis of income tax benefit (expense)
(in millions of euros) Q4 2009 2009 2008 2007
Reduction of goodwill related to deferred tax assets initially unrecognized (1) (2) - - - (256)
Current income tax (expense) benefit (42) (63) (99) (111)
Deferred taxes related to the purchase price allocation for the Lucent transaction (2) 24 115 740 396
Recognition of deferred tax assets initially unrecognized at the Lucent transaction closing date (1) - - - 256
Deferred tax (charge) related to the post-retirement benefit plan amendments (3) - - (25) (181)
Deferred taxes related to Lucent’s post-retirement benefit plans (4) (17) (35) (293) (206)
Deferred taxes related to the Lucent 2.875 % Series A convertible debenture (5) (1) 65 - -
Other deferred income tax (charge) benefit, net (6) (5) (22) (476) (214)
Deferred income tax benefit (expense), net 1 123 (54) 51
Income taxes (41) 60 (153) (60)
INCOME TAX BENEFIT (EXPENSE) AND RELATED REDUCTION OF GOODWILL (41) 60 (153) (316)
(1) If the potential benefit of Lucent’s income tax loss carry-forwards or other deferred tax assets does not satisfy the criteria for separate recognition, as defined in IFRS 3, when the business combination was initially accounted for but such benefits are subsequently realized, Alcatel-Lucent will recognize the resulting deferred tax income in profit or loss and in addition, reduce the carrying amount of goodwill (as an expense) to the amount that would have been recognized if the deferred tax asset had been recognized as an identifiable asset from the closing date.
(2) Related to the reversal of deferred tax liabilities accounted for in the purchase price allocation of Lucent as described in Note 3. (3) Related to the post-retirement plan amendments described in Note 25. (4) Tax impact of the pension credit and changes in deferred tax assets and liabilities recognized on temporary differences related to pension
and other post-employment benefits, other than those recognized directly in equity as prescribed by the option of IAS 19 that the Group is applying (see Note 1k and Note 25).
(5) Reversal of deferred tax liabilities related to Lucent’s 2.875 % Series A convertible debentures (see Notes 8, 24 & 26). (6) 2009, 2008 and 2007 impacts are mainly due to the re-assessment of the recoverability of deferred tax assets recognized in connection with
the annual impairment test of goodwill performed in the second quarter 2009 and the additional impairment tests performed in the fourth quarter in each of 2008 and 2007.
b/ Disclosure of tax effects relating to each component of other comprehensive income
(in millions of euros) 2009 2008 2007
Value before taxes
Tax (ex-pense) benefit
Value net of
tax
Value before taxes
Tax (ex-pense) benefit
Value net of
tax amount
Value before-taxes
Tax (ex-
pense) benefit
Value net of
tax Financial assets available for sale 13 1 14 (38) (5) (43) 20 - 20 Cumulative translation ad-justments 39 39 112 112 (993) - (993) Cash flow hedging 11 11 5 5 (4) - (4) Actuarial gains (losses) (582) (3) (585) (1,965) 434 (1,531) 43 68 111 Other (53) 1 (52) 86 86 (14) - (14) Other comprehensive income (572) (1) (573) (1,800) 429 (1,371) (948) 68 (880)

36
c/ Effective income tax rate
The effective tax rate can be analyzed as follows:
(in millions of euros except for percentage) 2009 2008 2007
Income (loss) before income tax, related reduction of goodwill and discontinued operations (696) (5,053) (3,771)
Average income tax rate 33.2% 35.8% 35.0%
Expected tax (charge) benefit 231 1,811 1,320
Impact on tax (charge) benefit of:
• reduced taxation of certain revenues - - 50
• permanent differences and utilization of previously unrecognized tax losses 49 (896) (708)
• adjustment to prior years’ current tax charge 9 - (2)
• recognition of previously unrecognized deferred tax assets 198 2 396
• deferred tax assets no longer recognized (127) (463) (110)
• non-recognition of tax losses (332) (638) (1,033)
• tax credits 29 31 43
• other 3 - (16)
ACTUAL INCOME TAX (CHARGE) BENEFIT 60 (153) (60)
Effective tax rate 8.6% (3.0)% (1.6)%
Average income tax rate is the sum of income (loss) before taxes of each subsidiary, multiplied by the local statutory rate for each subsidiary, divided by consolidated income (loss) before taxes from continuing operations.
Changes in average income tax rate are due to differences in the contribution of each tax entity to income (loss) before tax and to the fact that some units have a positive contribution and others have a negative one.
d/ Deferred tax balances
Balances: (in millions of euros) 2009 2008 2007
Deferred tax assets:
• deferred tax assets recognizable 11,607 12,289 11,733
• of which not recognized (10,771) (11,437) (10,501)
Net deferred tax assets recognized 836 852 1,232
Net deferred tax (liabilities) (1,058) (1,152) (1,897)
NET DEFERRED TAX ASSETS (LIABILITIES) (222) (300) (665)
Analysis of deferred tax by temporary differences
(in millions of euros) December 31, 2008
Impact on net income
(loss) Translation
adjustments Reclassification
and Other December 31, 2009
Fair value adjustments of tax assets and liabilities resulting from business combinations (946) 183 27 - (736)
Provisions 580 (212) 5 19 392
Pension reserves 1,823 (187) (46) 46 1,636
Prepaid pensions (871) (78) 21 94 (834)
Property, plant and equipment and intangible assets 647 (29) (25) 194 787
Temporary differences arising from other statement of financial position captions 585 (34) (4) (166) 381
Tax loss carry-forwards and tax credits 9,319 (1,085) (128) 817 8,923
DEFERRED TAX ASSETS (LIABILITIES), GROSS 11,137 (1,442) (150) 1,004 10,549
Deferred tax assets not recognized (11,437) 1,565 173 (1,072) (10,771)
NET DEFERRED TAX ASSETS (LIABILITIES) (300) 123 23 (68) (222)

37
Change during the period
(in millions of euros) December 31, 2008
Impact on net income
(loss) Translation
adjustments Other December 31, 2009
Deferred tax assets recognized 852 9 (5) (20) 836
Deferred tax liabilities (1,152) 114 28 (48) (1,058)
NET DEFERRED TAX ASSETS (LIABILITIES) (300) 123 23 (68) (222)
Deferred taxes not recognized relating to temporary differences on investments in subsidiaries, equity affiliates and joint ventures were zero at December 31, 2009, December 31, 2008 and December 31, 2007.
As the Board of Directors does not intend to propose a dividend for 2009 to the Annual Shareholders’ Meeting (see Note 22), there will be no tax consequences.
e/ Tax losses carried forward and temporary differences
Total tax losses carried forward represent a potential tax saving of € 8,923 million at December 31, 2009 (€ 9,319 million at December 31, 2008 and € 9,435 million at December 31, 2007). The potential tax savings relate to tax losses carried forward that expire as follows:
Years (in millions of euros) Recognized Unrecognized Total
2010 - 33 33
2011 - 278 278
2012 - 49 49
2013 - 15 15
2014 - 33 33
2015 and thereafter - 4,726 4,726
indefinite 465 3,323 3,788
TOTAL 465 8,458 8,923
In addition, temporary differences were € 1,626 million at December 31, 2009 (€ 1,818 million at December 31, 2008 and € 401 million at December 31, 2007), of which € (687) million have been recognized and € 2,313 million have not been recognized (€ (649) million and € 2,467 million respectively at December 31, 2008 and € 1,585 million and € 1,986 million respectively at December 31, 2007).
Recognized negative temporary differences mainly correspond to deferred tax liabilities that have been recorded resulting from the Lucent purchase accounting entries (in particular intangible assets).
NOTE 10 DISCONTINUED OPERATIONS, ASSETS HELD FOR SALE AND LIABILITIES RELATED TO DISPOSAL GROUPS HELD FOR SALE
Discontinued operations for 2009, 2008 and 2007 were as follows:
• In 2009: adjustment of the selling price related to the disposal of the space business to Thales that was sold in 2007.
• In 2008: adjustments on initial capital gain (loss) on discontinued operations that were sold or contributed in previous periods.
• in 2007: The net capital gain on the disposal of the railway transport systems activities and critical systems integration activities not dedicated to operators or suppliers of telecommunications services to Thales in January 2007 and on the sale to Thales of our ownership interests in two joint ventures in the space sector in April 2007 is booked as income (loss) on discontinued operations, as well as some adjustments on initial capital gain (loss) on discontinued operations that were sold or contributed in previous periods;
Other assets held for sale concern real estate property sales in progress at December 31, 2009, real estate property sales in progress and our stake in Thales shares (see Notes 3 and 16) at December 31, 2008 and real estate property sales in progress as of December 31, 2007.

38
Income statement of discontinued operations (in millions of euros) Q4 2009 2009 2008 2007
Revenues - - - 213
Cost of sales - - - (178)
Gross profit - - - 35
Administrative and selling expenses - - - (30)
Research and development costs - - - (8)
Net capital gain (loss) on disposal of discontinued operations (1) 3 132 33 615
Income (loss) from operations 3 132 33 612
Financial income (loss) - - - -
Other income (loss) - - - (2)
INCOME (LOSS) FROM DISCONTINUED OPERATIONS 3 132 33 610
(1) The 2009 impact results from an adjustment of the purchase price related to the contribution of our interests in two joint ventures in the space sector to Thales (refer to Note 3).
Statement of financial position (in millions of euros)
December 31, 2009
December 31, 2008
December 31, 2007
Goodwill - - -
Other assets - - -
Cash - - -
Assets of disposal groups - - -
Real estate properties and other assets held for sale 51 45 35
Stake in Thales (1) - 1,303 -
Assets held for sale 51 1,348 35
Customer deposits and advances - - -
Other liabilities (1) - -
LIABILITIES RELATED TO DISPOSAL GROUPS HELD FOR SALE (1) - -
(1) The change between December 31, 2008 and December 31, 2009 in the carrying value of our stake in Thales was due to the disposal of our shares in May 2009.
The cash flows of discontinued operations are as follows:
(in millions of euros) Q4 2009 2009 2008 2007
Net income (loss) 3 132 33 610
Net cash provided (used) by operating activities before changes in working capital
-- - 9
Other net increase (decrease) in net cash provided (used) by operating activities
-- - (86)
Net cash provided (used) by operating activities (a) - - - (77)
Net cash provided (used) by investing activities (b) (3) 115 21 652 (1)
Net cash provided (used) by financing activities (c) - - - (352)
TOTAL (a) + (b) + (c) (3) 115 21 223
(1) Including € 670 million of cash received in connection with the contribution of our interests in two joint ventures in the space sector to Thales (refer to Note 3).
NOTE 11 EARNINGS PER SHARE
Basic earnings per share is computed using the number of shares issued, after deduction of the weighted average number of shares owned by consolidated subsidiaries and the weighting effect of shares issued during the year.
In accordance with IAS 33 revised (paragraph 23), the weighted average number of shares to be issued upon conversion of bonds redeemable for shares is included in the calculation of basic earnings per share.
Diluted earnings per share takes into account share equivalents having a dilutive effect, after deducting the weighted average number of share equivalents owned by consolidated subsidiaries, but not share equivalents that do not have a dilutive effect. Net income (loss) is adjusted for after-tax interest expense relating to convertible bonds.

39
The dilutive effects of stock option and stock purchase plans are calculated using the "treasury stock method", which provides that proceeds to be received from the exercise of options or purchase of stock are assumed to be used first to purchase shares at market price. The dilutive effects of convertible bonds are calculated on the assumption that the bonds and notes will be systematically redeemed for shares (the "if converted method").
The tables below reconcile basic earnings per share to diluted earnings per share for the periods presented:
Net income (loss) (in millions of euros) Q4 2009 Q4 2008 2009 2008 2007
Net income (loss) – basic 46 (3,892) (524) (5,215) (3,518)
Adjustment for dilutive securities on net income: Interest expense related to convertible securities - - - - -
Net income (loss) – diluted 46 (3,892) (524) (5,215) (3,518)
Number of shares
Weighted average number of shares – basic 2,259,737,570 2,259,387,650 2,259,696,863 2,259,174,970 2,255,890,753
Dilutive effects:
• Equity plans (stock options, RSU) 14,849,281 - - - -
• Alcatel-Lucent’s convertible bonds (OCEANE) issued on June 12, 2003 and on September 10, 2009 - - - - -
• 7.75% convertible securities - - - - -
• 2.875% Series A convertible securities - - - - -
• 2.875% Series B convertible securities - - - - -
WEIGHTED AVERAGE NUMBER OF SHARES – DILUTED 2,274,586,851 2,259,387,650 2,259,696,863 2,259,174,970 2,255,890,753
Earnings per share, attributable to the owners of the parent (in euros) Q4 2009 Q4 2008 2009 2008 2007
Basic 0.02 (1.72) (0.23) (2.31) (1.56)
Diluted 0.02 (1.72) (0.23) (2.31) (1.56)
Ordinary shares
Ordinary shares owned by consolidated subsidiaries of the Group Q4 2009 Q4 2008 2009 2008 2007
Number of Alcatel-Lucent ordinary shares (weighted average number) 58,322,581 58,338,627 58,351,371 58,351,831 58,630,445
Number of Alcatel-Lucent share equivalents - - - - -
Shares subject to future issuance
December 31, 2009
December31, 2008
December31, 2007
Number of stock options not exercised 212,292,704 221,247,918 201,259,446
The following table summarizes the number of potential ordinary shares that were excluded from the diluted per share calculation, because the effect of including these potential shares was anti-dilutive:
Q4 2009 Q4 2008 2009 2008 2007
Equity plans (stock option, RSU) - 690,798 7,624,288 1,660,424 6,841,930
Alcatel-Lucent’s convertible bonds (OCEANE) issued on June 12, 2003 and on September 10, 2009 360,162,302 63,192,019 360,162,302 63,192,019 63,192,019
7.75% convertible securities 37,557,287 44,463,051 37,557,287 44,463,051 44,463,051
2.875% Series A convertible securities 145,466,921 328,114,266 196,117,249 152,333,655 68,203,544
2.875% Series B convertible securities 241,667,216 385,206,148 325,813,655 178,839,711 80,161,899

40
NOTE 12 GOODWILL
(in millions of euros) Net
Goodwill at December 31, 2006 10,891
Additions 46
Disposals and discontinued operations -
Changes during goodwill allocation period -
Impairment losses for the period (2,657)
Reduction of goodwill related to deferred taxes initially unrecognized (256)
Net effect of exchange rate changes (697)
Other changes 1
Goodwill at December 31, 2007 7,328
Additions 72
Disposals and discontinued operations -
Changes during goodwill allocation period (7)
Impairment losses for the period (3,272)
Reduction of goodwill related to deferred taxes initially unrecognized -
Net effect of exchange rate changes 92
Other changes 2
Goodwill at December 31, 2008 4,215
Additions 7
Disposals and discontinued operations (4)
Changes during goodwill allocation period -
Impairment losses for the period -
Reduction of goodwill related to deferred taxes initially unrecognized -
Net effect of exchange rate changes (50)
Other changes -
GOODWILL AT DECEMBER 31, 2009 4,168
Main changes accounted for in 2009
No major change related to new acquisitions during the period. No impairment loss was accounted for during 2009 (see below).
Main changes accounted for in 2008
Additions to goodwill include the Motive acquisition (see Note 3). Impairment losses were recorded in connection with the 2008 annual impairment test and the additional impairment test performed in the fourth quarter 2008 (see below).
Main changes accounted for in 2007
No major change related to new acquisitions during the period. Impairment losses were recorded in connection with the 2007 annual impairment test and the additional impairment test performed in the fourth quarter 2007 (see below).
Goodwill was reduced in relation to the recognition during 2007 of initially unrecognized deferred tax assets in Lucent, as prescribed by IAS 12 “Income Taxes” (refer to Note 9).
Goodwill allocation
All goodwill recognized in 2009, 2008 and 2007 was allocated to cash generating units by December 31 of the relevant year.
Due to the new organization effective January 1, 2009, goodwill was reallocated, at this date, to the new Business Divisions, corresponding to the groups of Cash Generating Units, at which level Goodwill is monitored and tested for impairment. A specific impairment test triggered by this new organization was performed as of January 1, 2009.
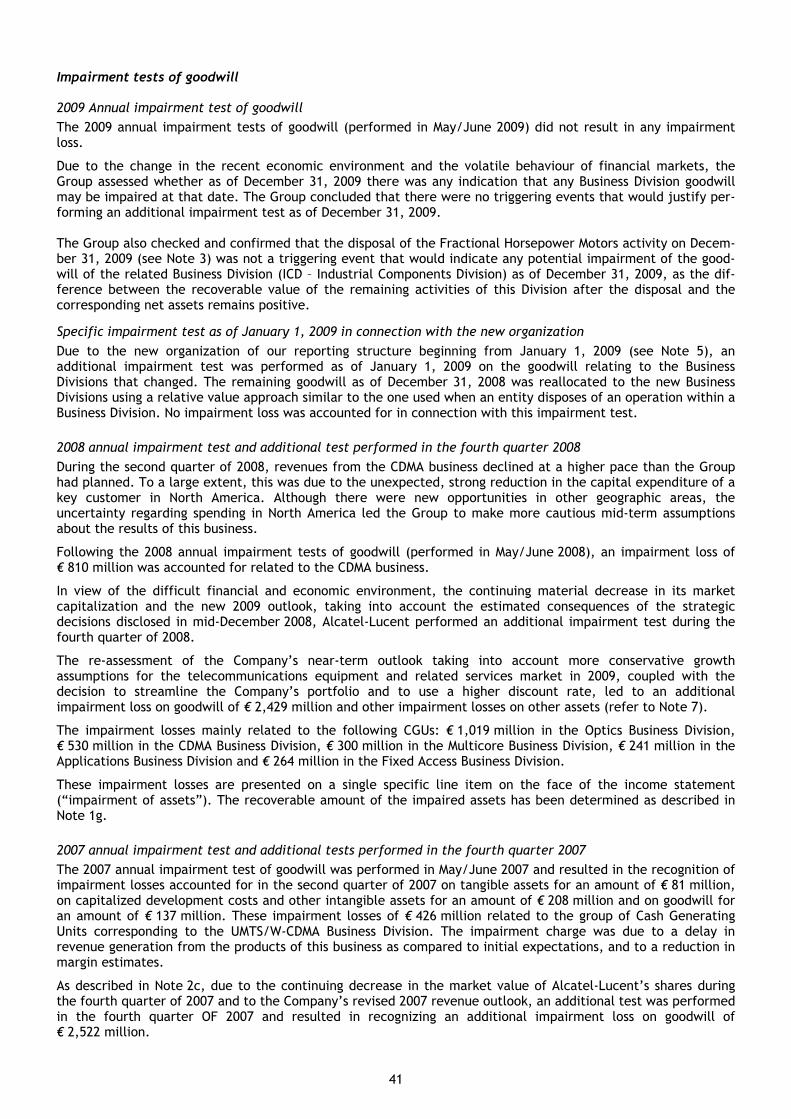
41
Impairment tests of goodwill
2009 Annual impairment test of goodwill
The 2009 annual impairment tests of goodwill (performed in May/June 2009) did not result in any impairment loss.
Due to the change in the recent economic environment and the volatile behaviour of financial markets, the Group assessed whether as of December 31, 2009 there was any indication that any Business Division goodwill may be impaired at that date. The Group concluded that there were no triggering events that would justify per-forming an additional impairment test as of December 31, 2009. The Group also checked and confirmed that the disposal of the Fractional Horsepower Motors activity on Decem-ber 31, 2009 (see Note 3) was not a triggering event that would indicate any potential impairment of the good-will of the related Business Division (ICD – Industrial Components Division) as of December 31, 2009, as the dif-ference between the recoverable value of the remaining activities of this Division after the disposal and the corresponding net assets remains positive.
Specific impairment test as of January 1, 2009 in connection with the new organization
Due to the new organization of our reporting structure beginning from January 1, 2009 (see Note 5), an additional impairment test was performed as of January 1, 2009 on the goodwill relating to the Business Divisions that changed. The remaining goodwill as of December 31, 2008 was reallocated to the new Business Divisions using a relative value approach similar to the one used when an entity disposes of an operation within a Business Division. No impairment loss was accounted for in connection with this impairment test.
2008 annual impairment test and additional test performed in the fourth quarter 2008
During the second quarter of 2008, revenues from the CDMA business declined at a higher pace than the Group had planned. To a large extent, this was due to the unexpected, strong reduction in the capital expenditure of a key customer in North America. Although there were new opportunities in other geographic areas, the uncertainty regarding spending in North America led the Group to make more cautious mid-term assumptions about the results of this business.
Following the 2008 annual impairment tests of goodwill (performed in May/June 2008), an impairment loss of € 810 million was accounted for related to the CDMA business.
In view of the difficult financial and economic environment, the continuing material decrease in its market capitalization and the new 2009 outlook, taking into account the estimated consequences of the strategic decisions disclosed in mid-December 2008, Alcatel-Lucent performed an additional impairment test during the fourth quarter of 2008.
The re-assessment of the Company’s near-term outlook taking into account more conservative growth assumptions for the telecommunications equipment and related services market in 2009, coupled with the decision to streamline the Company’s portfolio and to use a higher discount rate, led to an additional impairment loss on goodwill of € 2,429 million and other impairment losses on other assets (refer to Note 7).
The impairment losses mainly related to the following CGUs: € 1,019 million in the Optics Business Division, € 530 million in the CDMA Business Division, € 300 million in the Multicore Business Division, € 241 million in the Applications Business Division and € 264 million in the Fixed Access Business Division.
These impairment losses are presented on a single specific line item on the face of the income statement (“impairment of assets”). The recoverable amount of the impaired assets has been determined as described in Note 1g.
2007 annual impairment test and additional tests performed in the fourth quarter 2007
The 2007 annual impairment test of goodwill was performed in May/June 2007 and resulted in the recognition of impairment losses accounted for in the second quarter of 2007 on tangible assets for an amount of € 81 million, on capitalized development costs and other intangible assets for an amount of € 208 million and on goodwill for an amount of € 137 million. These impairment losses of € 426 million related to the group of Cash Generating Units corresponding to the UMTS/W-CDMA Business Division. The impairment charge was due to a delay in revenue generation from the products of this business as compared to initial expectations, and to a reduction in margin estimates.
As described in Note 2c, due to the continuing decrease in the market value of Alcatel-Lucent’s shares during the fourth quarter of 2007 and to the Company’s revised 2007 revenue outlook, an additional test was performed in the fourth quarter OF 2007 and resulted in recognizing an additional impairment loss on goodwill of € 2,522 million.

42
Impairment losses of € 2,109 million related to the CGUs in the CDMA Business Division, € 396 million related to the CGUs in the IMS Business Division (Internet Protocol Multimedia Subsystem) and the remainder related to the CGUs corresponding to the Business Division Network Integration. The impairment charge in the CDMA Business Division was due to a revision in the long-term outlook for this activity, taking into account the change in market conditions as well as potential future technology evolutions.
These impairment losses are presented on a single specific line item on the face of the income statement (“impairment of assets”). The recoverable amount of the impaired assets was determined as described in Note 1g.
These tests were performed after allocating the goodwill related to the Lucent business combination to the different Business Divisions (i.e. groups of Cash Generating Units) based upon the carrying values of the Business Divisions at the beginning of the quarter according to the Business Division structure existing before the change of our business organization that was announced and put in place in November 2007.
As prescribed by IAS 36 “Impairment of Assets”, a third impairment test was performed in 2007, due to the reorganization of the reporting structure that occurred in November 2007, based upon the same recoverable values and carrying values of the Business Divisions as of December 31, 2007. This test was performed only to ensure that, after the change in our reporting structure, the recoverable values of each Business Division were higher than the corresponding carrying values. No additional impairment loss was accounted for in relation to this third impairment test.
In those groups of Cash Generating Units (Note 1g) in which there is significant goodwill, the data and assumptions used for the annual goodwill impairment test were as follows:
2009 Annual test
(in millions of euros)
Net carrying amount of
goodwill
Difference between recoverable amount (A) and carrying amount
of the net assets (B) (A) – (B) (3) Discount rate Valuation method
Optics division 1,145 269 11.0% Discounted cash flows
and other data (1) Maintenance division 1,623 379 11.0% Same as above (1) Other CGU 1,434 - - Same as above (1) TOTAL NET 4,202 (2)
(1) Discounted cash flows for 5 years plus a terminal value. Other data : multiples derived from market capitalizations. Growth rates are those used in the Group’s budgets and industry rates for the subsequent periods. Perpetual growth rates used for the
residual values are between 0% and +2.5% depending on the CGU. (2) At the date of the annual impairment test (i.e. June 30, 2009). (3) The recoverable amount is the value in use for the Business Divisions disclosed.
In those groups of Cash Generating Units (Note 1g) in which there is significant goodwill, the data and assumptions used for the goodwill impairment tests performed in the fourth quarter of each 2008 and 2007 were as follows:
2008 additional test in Q4 – current reporting structure (in millions of euros)
Net carrying amount of goodwill (1)
Difference between recoverable amount (A) and carrying amount of
the net assets (B) (A) – (B) (1) Discount rate Valuation method
Optics division 1,138 0 12.0% Discounted cash flows
and other data (2)
Maintenance division 1,439 694 12.0% Same as above (2)
Other CGU 1,638 - - Same as above (2)
TOTAL NET 4,215
(1) As of December 31, 2008. The recoverable amount is the value in use for the Business Divisions disclosed. (2) Discounted cash flows for 5 years plus a terminal value. Growth rates are those used in the Group’s budgets and industry rates for the
subsequent periods. Perpetual growth rates used for the residual values are between -10% and +2.5% depending on the CGUs.

43
2007 additional test in Q4 (in millions of euros)
Net carrying amount of goodwill (1)
Difference between recoverable amount (A) and carrying amount of
the net assets (B) (A) – (B) (1) Discount rate Valuation method
CDMA (Code Division Multiple Access) division 1,381 8 10.0%
Discounted cash flows and other data (2)
Optics division 2,160 653 10.0% Same as above (2)
Maintenance division 1,388 1,040 10.0% Same as above (2)
Other CGU 2,399 - - Same as above (2)
TOTAL NET 7,328
(1) As of December 31, 2007. The recoverable amount is the value in use for the Business Divisions disclosed. (2) Discounted cash flows for 5 years plus a terminal value. Growth rates are those used in the Group’s budgets and industry rates for the
subsequent periods. Perpetual growth rates used for the residual values are between -10% and +4% depending on the CGUs.
NOTE 13 INTANGIBLE ASSETS
a/ Gross value
(in millions of euros)
Capitalized development
costs
Other intangible
assets Total
At December 31, 2006 1,218 5,374 6,592
Capitalization 414 34 448
Additions - 39 39
Assets held for sale, discontinued operations and disposals (1) (15) (16)
Write-offs (46) (14) (60)
Business combinations - 13 13
Net effect of exchange rate changes (36) (525) (561)
Other changes (1) (2) (3)
At December 31, 2007 1,548 4,904 6,452
Capitalization 410 65 475
Additions - 13 13
Assets held for sale, discontinued operations and disposals - (42) (42)
Write-offs (11) (8) (19)
Business combinations - 36 36
Net effect of exchange rate changes 38 257 295
Other changes - - -
At December 31, 2008 1,985 5,225 7,210
Capitalization 284 64 348
Additions - 13 13
Assets held for sale, discontinued operations and disposals - (12) (12)
Write-offs (197) (6) (203)
Net effect of exchange rate changes (25) (160) (185)
Other changes - 4 4
AT DECEMBER 31, 2009 2,047 5,128 7,175
Other intangible assets include primarily intangible assets acquired in business combinations (acquired technologies, in-process research and development and customer relationships), patents, trademarks and licenses.

44
b/ Amortization and impairment losses
(in millions of euros)
Capitalized development
costs
Other intangible
assets Total
At December 31, 2006 (717) (434) (1,151)
Amortization (258) (758) (1,016)
Impairment losses (41) (175) (216)
Write-offs 46 1 47
Assets held for sale, discontinued operations and disposals - 14 14
Net effect of exchange rate changes 18 77 95
Other changes - 5 5
At December 31, 2007 (952) (1,270) (2,222)
Amortization (308) (561) (869)
Impairment losses (135) (1) (1,276) (2) (1,411)
Write-offs 11 8 19
Assets held for sale, discontinued operations and disposals - 14 14
Net effect of exchange rate changes (23) (153) (176)
Other changes - 2 2
At December 31, 2008 (1,407) (3,236) (4,644)
Amortization (276) (355) (631)
Impairment losses (20) - (20)
Write-offs 197 6 203
Assets held for sale, discontinued operations and disposals - 12 12
Net effect of exchange rate changes 17 106 123
Other changes - (5) (5)
AT DECEMBER 31, 2009 (1,489) (3,472) (4,961)
(1) Mainly related to the capitalized development costs related to the WiMAX technology following the decision announced as of December 12, 2008 to limit our WiMAX efforts to the support of fixed and nomadic broadband access applications and to cease the WiMAX full mobility developments. These impairment losses are presented on the specific line item of the income statement “Impairment of assets”.
(2) Impairments resulting from the additional impairment test performed in December 2008 and mainly related to the intangibles recognized on the CDMA business in connection with the Lucent business combination.

45
c/ Net value
(in millions of euros)
Capitalized development
costs
Other intangible
assets Total
At December 31, 2006 501 4,940 5,441
Capitalization 414 34 448
Additions - 39 39
Amortization (258) (758) (1,016)
Impairment losses (41) (175) (216)
Write-offs - (13) (13)
Assets held for sale, discontinued operations and disposals (1) (1) (2)
Business combinations - 13 13
Net effect of exchange rate changes (18) (448) (466)
Other changes (1) 3 2
At December 31, 2007 596 3,634 4,230
Capitalization 410 65 475
Additions - 13 13
Amortization (308) (561) (869)
Impairment losses (135) (1) (1,276) (2) (1,411)
Assets held for sale, discontinued operations and disposals - (28) (28)
Business combinations - 36 36
Net effect of exchange rate changes 15 104 119
Other changes - 2 2
At December 31, 2008 578 1,989 2,567
Capitalization 284 64 348
Additions - 13 13
Amortization (276) (355) (631)
Impairment losses (20) - (20)
Assets held for sale, discontinued operations and disposals - - -
Net effect of exchange rate changes (8) (54) (62)
Other changes - (1) (1)
AT DECEMBER 31, 2009 558 1,656 2,214
(1) Mainly related to the capitalized development costs related to the WiMAX technology following the decision announced as of December 12, 2008 to limit our WiMAX efforts to supporting fixed and nomadic broadband access applications and to stop the WiMAX full Mobility developments. These impairment losses are presented on the specific line item of the income statement “Impairment of assets”.
(2) Impairments resulting from the additional impairment test performed in December 2008 and mainly related to the intangibles recognized on the CDMA business in connection with the Lucent business combination.

46
NOTE 14 PROPERTY, PLANT AND EQUIPMENT
a/ Changes in property, plant and equipment, gross
(in millions of euros) Land Buildings
Plant, equipment
and tools Other Total
At December 31, 2006 287 1,128 2,683 572 4,670
Additions 1 43 209 101 354
Assets held for sale, discontinued operations and disposals (96) (39) (153) (21) (309)
Write-offs - (1) (18) (3) (22)
Business combinations - 11 5 2 18
Net effect of exchange rate changes (21) (74) (107) (8) (210)
Other changes (2) (10) 32 (35) (15)
At December 31, 2007 169 1,058 2,651 608 4,486
Additions - 46 211 157 414
Assets held for sale, discontinued operations and disposals (6) (50) (119) (78) (253)
Write-offs - (8) (33) (16) (57)
Business combinations - 5 (6) - (1)
Net effect of exchange rate changes 7 32 49 (5) 83
Other changes (7) 22 83 (96) 2
At December 31, 2008 163 1,105 2,836 570 4,674
Additions - 49 166 112 327
Assets held for sale, discontinued operations and disposals (28) (49) (259) (21) (357)
Write-offs - (7) (49) (7) (63)
Business combinations - 4 6 3 13
Net effect of exchange rate changes (2) (17) (17) (1) (37)
Other changes (1) 16 (104) 65 (24)
AT DECEMBER 31, 2009 132 1,101 2,579 721 4,533

47
b/ Changes in accumulated depreciation of property, plant and equipment and impairment losses
(in millions of euros) Land Buildings
Plant, equipment
and tools Other Total
At December 31, 2006 (8) (376) (2,062) (402) (2,848)
Depreciation charge - (105) (262) (49) (416)
Impairment losses - (44) (29) (21) (94)
Reversals of impairment losses - - - - -
Write-offs - 1 18 3 22
Assets held for sale, discontinued operations and disposals (1) - 28 132 18 178
Net effect of exchange rate changes - 22 81 4 107
Other changes - (7) 8 (8) (7)
At December 31, 2007 (8) (481) (2,114) (455) (3,058)
Depreciation charge - (103) (258) (26) (387)
Impairment losses - - (39) - (39)
Reversals of impairment losses - - - - -
Write-offs - 8 33 16 57
Assets held for sale, discontinued operations and disposals (1) - 18 106 26 150
Net effect of exchange rate changes (1) (14) (37) 5 (46)
Other changes - (4) 4 -
At December 31, 2008 (9) (572) (2,313) (430) (3,323)
Depreciation charge (1) (100) (232) (34) (367)
Impairment losses - - - - -
Reversals of impairment losses - - - - -
Write-offs - 7 49 7 63
Assets held for sale, discontinued operations and disposals - 14 170 102 286
Net effect of exchange rate changes - 4 15 2 21
Other changes (3) 181 21 (151) 48
AT DECEMBER 31, 2009 (13) (466) (2,290) (504) (3,273)
(1) Mainly related to activities disposed of or contributed to Thales in 2007 (refer to Note 3).

48
c/ Changes in property, plant and equipment, net
(in millions of euros) Land Buildings
Plant, equipment
and tools Other Total
At December 31, 2006 279 752 621 170 1,822
Additions 1 43 209 101 354
Depreciation charge - (105) (262) (49) (416)
Impairment losses - (44) (29) (21) (94)
Reversals of impairment losses - - - - -
Assets held for sale, discontinued operations and disposals (96) (11) (21) (3) (131)
Business combinations - 11 5 2 18
Net effect of exchange rate changes (21) (52) (26) (4) (103)
Other changes (2) (17) 40 (43) (22)
At December 31, 2007 161 577 537 153 1,428
Additions - 46 211 157 414
Depreciation charge - (103) (258) (26) (387)
Impairment losses - - (39) - (39)
Reversals of impairment losses - - - - -
Assets held for sale, discontinued operations and disposals (6) (32) (13) (52) (103)
Business combinations - 5 (6) - (1)
Net effect of exchange rate changes 7 18 12 - 37
Other changes (7) 22 79 (92) 2
At December 31, 2008 155 533 523 140 1,351
Additions - 49 166 112 327
Depreciation charge (1) (100) (232) (34) (367)
Impairment losses - - - - -
Reversals of impairment losses - - - - -
Assets held for sale, discontinued operations and disposals (28) (35) (89) 81 (71)
Business combinations - 4 6 3 13
Net effect of exchange rate changes (3) (14) (2) 1 (18)
Other changes (4) 198 (83) (86) 24
AT DECEMBER 31, 2009 119 635 289 217 1,260
NOTE 15 FINANCE LEASES AND OPERATING LEASES
a/ Finance leases
Property, plant and equipment held under finance leases have a net carrying amount of € 42 million at December 31, 2009 (€ 0 million at December 31, 2008 and 2007). Such finance leases relate primarily to IS/IT equipments sold and leased back in connection with the Hewlett Packard co-sourcing agreement (refer to Note 31).
Future minimum lease payments under non-cancellable finance leases are shown in Note 31a – Off balance sheet commitments.
b/ Operating leases
Future minimum lease payments under non-cancellable operating leases are shown in Note 31a – Off balance sheet commitments.
Future minimum sublease rental income expected to be received under non-cancellable operating subleases was € 143 million at December 31, 2009 (€ 163 million at December 31, 2008 and € 180 million at December 31, 2007).

49
Net lease payments under operating leases recognized as an expense in the income statement are analyzed as follows:
(in millions of euros) 2009 2008 2007
Lease payments – minimum 235 211 204
Lease payments – conditional 20 38 37
Sublease rental income (29) (27) (22)
TOTAL RECOGNIZED IN THE INCOME STATEMENT 226 222 219
NOTE 16 SHARE IN NET ASSETS OF EQUITY AFFILIATES AND JOINT VENTURES
a/ Share in net assets of equity affiliates
Percentage owned Value
(in millions of euros) 2009 2008 2007 2009 2008 2007
Thales (1) - 20.80% - - 1,200
Draka Comteq BV (2) - - - - -
2Wire 26.7% 26.7% 26.7% 34 39 62
Other (less than € 50 million each) - - 26 74 90
SHARE IN NET ASSETS OF EQUITY AFFILIATES 60 113 1,352
(1) Although historical Alcatel owned only 9.5% in Thales before the increase of our ownership resulting from the contribution of our railway transport systems business and our critical integration systems business that occurred during the first quarter of 2007, we were nevertheless the largest private shareholder of this group, with three seats on Thales’ Board of Directors and therefore had a significant influence on this company. Our stake in Thales was accordingly accounted for using the equity method in 2006. Following the contribution of our railway transport systems and our critical integration systems business to Thales on January 5, 2007, Alcatel-Lucent’s stake in Thales increased to 20.95% (20.90% in voting rights). Subsequently, due to various capital increases that occurred in 2007, our stake at December 31, 2007 was 20.80% (21.05% in voting rights).
Following the definitive agreement announced as of December 19, 2008 to sell our stake in Thales to Dassault Aviation, our shares were reclassified at this date from net assets of equity affiliates to assets held for sale. Our stake was disposed of in May 2009. The Group’s share of net income (loss) of equity affiliates accounted for in 2008 was based on Thales’ results for 2008 adjusted for the purchase price allocation entries.
(2) During the last quarter of 2007, Alcatel-Lucent sold its 49.9% stake in Draka Comteq BV (see Note 3)
Alcatel-Lucent’s share in the market capitalization of listed equity affiliates at December 31 was as follows:
(in millions of euros) 2009 2008 2007
Thales - - 1,681
b/ Change in share of net assets of equity affiliates
(in millions of euros) 2009 2008 2007
CARRYING AMOUNT AT JANUARY 1 113 1,352 682
Change in perimeter of equity affiliates (33) (18) 629(1)
Share of net income (loss) 1 96 110(2)
Net effect of exchange rate changes (2) 4 (10)
Reclassification to assets held for sale (Thales shares) - (1,303) -
Other changes (19) (18) (59)
CARRYING AMOUNT AT DECEMBER 31 60 113 1,352
(1) Of which € 757 million accounted for in 2007 relates to the contribution of our railway transport systems business and critical integration systems business to Thales and the resulting increase of our ownership in this entity and € (120) million accounted for in 2007 relates to the disposal of Draka Comteq BV.
(2) Including € 3 million of impairment losses in 2007 relating to equity affiliate goodwill (see Note 7).

50
c/ Summarized financial information for equity affiliates
Summarized financial information for Thales:
(in millions of euros)
December 31, 2008 (2)
December 31, 2007 (1)
Statement of financial position
Non-current assets - 6,817
Current assets - 10,879
TOTAL ASSETS - 17,696
Shareholders’ equity - 3,884
Non-current liabilities - 2,867
Current liabilities - 10,945
TOTAL LIABILITIES - 17,696
Income statement
Revenues 12,296
Income (loss) from operating activities 1,020
Net income (loss) attributable to equity owners of the parent(1) 887
(1) The share of net income (loss) of equity affiliates related to Thales was computed based upon a preliminary estimated net income of Thales of approximately € 800 million. Consolidated results of Alcatel-Lucent were authorized for publication by our Board on February 7, 2008, which was before Thales’ results were authorized for publication by Thales’ board on March 6, 2008.
(2) The share of net income (loss) of equity affiliates related to Thales was computed based upon a preliminary estimated net income of Thales. Information related to Thales had not yet been published at the time.
Aggregated financial information for other equity affiliates as if those entities were fully consolidated
(in millions of euros) 2009 2008 2007 (1)
Total assets 895 932 907
Liabilities (excluding shareholders’ equity) 873 678 497
Shareholders’ equity 22 254 410
Revenues 530 572 646
NET INCOME (LOSS) ATTRIBUTABLE TO EQUITY OWNERS OF THE PARENT 8 (41) (53)
(1) 2007 aggregated financial information excludes information for Draka Comteq, because Alcatel-Lucent had sold its interest in this equity affiliate during the fourth quarter of 2007 (see Note 3).
d/ Aggregated financial information for joint ventures
Aggregated financial information for the Group’s share in the net assets of joint ventures proportionately consolidated (Alda Marine in 2009, 2008 and 2007) was as follows:
Statement of financial position data (in millions of euros) 2009 2008 2007
Non-current assets 36 38 41
Current assets 5 6 7
Shareholders’ equity 4 - -
Non-current liabilities - - -
Current liabilities 37 44 48

51
(in millions of euros) 2009 2008 2007
Income statement data
Revenues - - -
Cost of sales 6 5 5
Income (loss) from operating activities before restructuring costs, impairment of assets, gain/(loss) on disposal of consolidated entities, litigatins and post-retirement benefit plan amendments 6 5 4
Income (loss) from discontinued operations (1) - - (3)
NET INCOME (LOSS) ATTRIBUTABLE TO EQUITY OWNERS OF THE PARENT 4 - (3)
Cash flow statement data
Net cash provided (used) by operating activities 9 3 7
Net cash provided (used) by investing activities (1) - (1)
Net cash provided (used) by financing activities (10) (5) (2)
Net cash provided (used) by operating activities of discontinued operations (1) - - (71)
Net cash provided (used) by investing activities of discontinued operations (1) - - (18)
Net cash provided (used) by financing activities of discontinued operations (1) - - 44
(1) Aggregated financial information for Alcatel Alenia Space and Telespazio only relates to the first three months of 2007. Such financial information was reported as discontinued operations (see Note 3 and Note 10).
NOTE 17 FINANCIAL ASSETS
(in millions of euros) 2009 2008 2007
Other non-current
financial assets (1)
Marketable securities (2) Total
Other non-current
financial assets(1)
Marketable securities (2) Total
Other non-current
financial assets
Marketable securities (2) Total
Financial assets available for sale (3) 305 271 576 585 253 838 549 261 810
Financial assets at fair value through profit or loss 1,722 1,722 653 653 633 633
Financial assets at amortized cost 87 87 111 111 155 155
TOTAL 392 1,993 2,385 696 906 1,602 704 894 1,598
(1) Of which € 78 million matures within one year as of December 31, 2009 (€ 301 million as of December 31, 2008). Of which € 29 million of financial assets at amortized cost represented a loan to one of Alcatel-Lucent's joint ventures as of December 31, 2009 (€ 42 million as of December 31, 2008).
(2) All of which is current as of December 31, 2009, as of December 31, 2008 and as of December 31, 2007). (3) Of which a decrease of € 252 million (US$ 328 million) in 2009, including € 223 million of reclassification against general risks reserves
(see note 27), during the first quarter related to the restricted cash on the Winstar litigation that was settled during the first quarter of 2009, representing a net positive impact in our cash provided by operating activities of € 24 million.
No financial asset is considered as being held to maturity.
The cumulated fair value changes of financial assets available for sale represented a potential gain as of December 31, 2009 of € 43 million that was booked directly in equity (€ 65 million as of December 31, 2008).

52
a/ Financial assets available for sale
(in millions of euros) 2009 2008 2007
Other non-current
financial assets
Marketable securities Total
Other non-current
financial assets
Marketable securities Total
Other non-current
financial assets
Marketable securities Total
Net carrying amount at january 1 585 253 838 549 261 810 674 1,122 1,796
Additions/(disposals) (39) (6) (45) (9) 19 10 (44) (834) (878)
Fair value changes (11) 24 13 (8) (30) (38) 12 8 20
Impairment losses (1) (2) 1 (1) (12) (2) (14) (16) - (16)
Change in consolidation group (8) - (8) - - - (18) - (18)
Other changes (2) (220) (1) (222) 65 5 70 (59) (35) (94)
NET CARRYING AMOUNT AT DECEMBER 31 305 271 575 585 253 838 549 261 810
Of which:
• at fair value (3) 51 223 274 79 199 278 48 257 305
• at cost 254 48 280 506 54 560 501 4 505
(1) Included in the amounts reported in Note 7 (2) Of which a € 223 million reclassification against general risks reserves (see note 16), during the first quarter related to the restricted cash
on the Winstar litigation that was settled during the first quarter of 2009. (3) Fair value hierarchy is presented in Note 28c.
Financial assets available for sale are stated at fair value, except for non-listed financial assets, which are stated at amortized cost, if no reliable fair value exists.
(in millions of euros) 2009 2008 2007
Fair value changes:
Fair value changes recognized directly in shareholders’ equity 22 (38) 47
Changes resulting from gains (losses) previously recognized in shareholders’ equity now recognized in net income (loss) due to disposals (1) (9) - (27)
(1) Relates to the disposal of Avanex in 2007.
b/ Financial assets at fair value through profit or loss
(in millions of euros) 2009 2008 2007
Net carrying amount at january 1 653 633 820
Additions/(disposals) 1,075 (44) (181)
Fair value changes - 19 2
Impairment losses - - -
Other changes (6) 45 (8)
NET CARRYING AMOUNT AT DECEMBER 31 1,722 653 633
c/ Financial assets at amortized cost
(in millions of euros) 2009 2008 2007
Net carrying amount at january 1 111 155 129
Additions/(disposals) (33) (26) 32
Impairment losses - - -
Change in consolidation group - - -
Other changes (reclassifications) 9 (18) (6)
NET CARRYING AMOUNT AT DECEMBER 31 87 111 155

53
NOTE 18 OPERATING WORKING CAPITAL
Operating working capital
(in millions of euros) December 31, 2009
December 31, 2008
December 31, 2007
Inventories and work in progress, net 1,624 2,196 2,235
Trade receivables and other receivables, net 3,221 4,330 4,163
Advances and progress payments 93 99 110
Customers’ deposits and advances (639) (929) (847)
Trade payables and other payables (3,926) (4,571) (4,514)
Amounts due from customers on construction contracts 528 495 704
Amounts due to customers on construction contracts (66) (188) (407)
OPERATING WORKING CAPITAL, NET 835 1,432 1,444
Analysis of amounts due from/to customers on construction contracts (in millions of euros)
December 31, 2009
December 31, 2008
December 31, 2007
Amounts due from customers on construction contracts 528 495 704
Amounts due to customers on construction contracts (66) (188) (407)
TOTAL 462 307 297
Work in progress on construction contracts, gross 306 219 272
Work in progress on construction contracts, depreciation (28) (25) (42)
Accrued receivables on construction contracts 298 363 438
Advance payments received on construction contracts - (64) (224)
Product sales reserves – construction contracts (114) (186) (147)
TOTAL 462 307 297
(in millions of euros) December 31, 2008 Cash flow
Change in consolidated
companies
Translation adjustments
and other December 31, 2009
Inventories and work in progress (1) 3,044 (409) 22 (255) 2,402
Trade receivables and other receivables (1) 4,900 (892) 8 (329) 3,687
Advances and progress payments 99 (12) 4 2 93
Customers’ deposits and advances (1) (993) 76 (10) 288 (639)
Trade payables and other payables (4,571) 747 (20) (82) (3,926)
Operating working capital, gross 2,479 (490) 4 (376) 1,617
Product sales reserves – construction contracts (1) (186) - - 72 (114)
Cumulated valuation allowances (861) - (2) 195 (668)
OPERATING WORKING CAPITAL, NET 1,432 (490) 2 (109) 835
(1) These line items include amounts relating to construction contracts that are presented in the statement of financial position caption “amounts due from/to customers on construction contracts”.
Receivables sold without recourse
Balances
(in millions of euros) December 31, 2009
December 31, 2008
December 31, 2007
Outstanding amounts of receivables sold without recourse (1) 612 830 877
(1) Without recourse in case of payment default by the debtor. See accounting policy in Note 1s.
Changes in receivables sold without recourse
(in millions of euros) Q4 2009 2009 2008 2007
Impact on cash flows from operating activities (18) (218) (47) (101)

54
NOTE 19 INVENTORIES AND WORK IN PROGRESS
a/ Analysis of net value
(in millions of euros) 2009 2008 2007
Raw materials and goods 429 649 564
Work in progress excluding construction contracts 825 972 958
Finished products 842 1,204 1,185
Gross value (excluding construction contracts) 2,096 2,825 2,707
Valuation allowance (472) (629) (472)
Net value (excluding construction contracts) 1,624 2,196 2,235
Work in progress on construction contracts, gross (1) 306 219 272
Valuation allowance (1) (28) (25) (42)
Work in progress on construction contracts, net 278 194 230
TOTAL, NET 1,902 2,390 2,465
(1) These line items include amounts relating to construction contracts that are presented in the statement of financial position caption “amounts due from/to customers on construction contracts”.
b/ Change in valuation allowance
(in millions of euros) 2009 2008 2007
AT JANUARY 1 (654) (514) (378)
(Additions)/ reversals (139) (285) (186)
Utilization 71 69 38
Changes in consolidation group - - -
Net effect of exchange rate changes and other changes 222 75 12
AT DECEMBER 31 (500) (654) (514)
NOTE 20 TRADE RECEIVABLES AND RELATED ACCOUNTS
(in millions of euros) 2009 2008 2007
Receivables bearing interest 316 202 263
Other trade receivables 3,073 4,335 4,087
Gross value - (excluding construction contracts) 3,389 4,537 4,350
Accumulated impairment losses (168) (207) (187)
Net value - (excluding construction contracts) 3,221 4,330 4,163
Accrued receivables on construction contracts (1) 298 363 438
TOTAL, NET 3,519 4,693 4,601
Of which due after one year on the “net value – (excluding construction contracts)” 111 41 54
(1) These line item includes amounts relating to construction contracts that are presented in the statement of financial position caption “amounts due from/to customers on construction contracts”.

55
NOTE 21 OTHER ASSETS AND LIABILITIES
(in millions of euros) December 31, 2009
December 31, 2008
December 31, 2007
Other assets
Other current assets 960 1,395 1,117
Other non-current assets 314 650 389
TOTAL 1,274 2,045 1,506
Of which:
• Currency derivatives 35 185 203
• Interest-rate derivatives - hedging 44 72 19
• Interest-rate derivatives – other 235 379 198
• Commodities derivatives - - -
• Other tax receivables 502 662 435
• Other current and non-current assets 458 747 651
Other liabilities
Other current liabilities 1,763 2,293 1,966
Other non-current liabilities 209 443 366
TOTAL 1,972 2,736 2,332
Of which:
• Currency derivatives 51 339 128
• Interest-rate derivatives - hedging 1 1 16
• Interest-rate derivatives – other 237 381 197
• Commodities derivatives - 7 -
• Other tax payables 350 331 317
• Accrued wages and social charges 850 968 1,015
• Other current and non-current liabilities 483 709 659
NOTE 22 ALLOCATION OF 2009 NET INCOME (LOSS)
Our Board of Directors will propose to the Annual Shareholders’ Meeting to be held on June 1st, 2010 not to distribute any dividend for the year ended December 31, 2009. No dividends for the years 2008 and 2007 were made.
NOTE 23 SHAREHOLDERS’ EQUITY
a/ Number of shares comprising the capital stock
Number of shares 2009 2008 2007
Number of ordinary shares issued (share capital) 2,318,060,818 2,318,041,761 2,317,441,420
Treasury shares (58,320,394) (58,385,990) (58,390,687)
Number of shares in circulation 2,259,740,424 2,259,655,771 2,259,050,733
Weighting effect of share issued for stock options exercised (12,584) (514,960) (2,920,222)
Weighting effect of treasury shares (30,977) 34,159 (239,758)
Weighting effect of share issued in respect of business combinations - - -
NUMBER OF SHARES USED FOR CALCULATING BASIC EARNINGS PER SHARE 2,259,696,863 2,259,174,970 2,255,890,753
b/ Capital increase program for employees with subscription stock option plan
Under a capital increase program for employees of the Group, approved by the Board of Directors on March 7, 2001, 91,926 Class A shares were issued at a price of € 50 per share (all Class A shares are now referred to as ordinary shares). Each share subscribed included the right to receive three options, each exercisable for one Class A share. 275,778 options were granted and were exercisable during the one-year period from July 1, 2004 until July 1, 2005 or from the end of the unavailability period set by Article 163 bis C of the General Tax Code (4 years from July 1, 2004), for the beneficiaries who were employees of a member of the Group whose registered office is located in France at the time the options were granted.

56
c/ Capital stock and additional paid-in capital
At December 31, 2009, the capital stock consisted of 2,318,060,818 ordinary shares of nominal value € 2 (2,318,041,761 ordinary shares of nominal value € 2 at December 31, 2008 and 2,317,441,420 ordinary shares of nominal value € 2 at December 31, 2007).
During 2009, increases in capital stock and additional paid-in capital amounted to € 1 million. These increases related to the following transactions:
• issuance of 1,803 shares for € 0 million, as a result of the exercise of options and warrants (including additional paid-in capital of € 0 million);
• conversion of 17,254 convertible bonds into Alcatel-Lucent shares generating a capital increase of € 1 million (including additional paid-in capital of € 0 million).
During 2008, increases in capital stock and additional paid-in capital amounted to € 5 million. These increases related to the following transactions:
• issuance of 6,100 shares for € 0 million, as a result of the exercise of options and warrants (including additional paid-in capital of € 0 million);
• conversion of 544,241 convertible bonds into Alcatel-Lucent shares generating a capital increase of € 5 million (including additional paid-in capital of € 4 million); and
• redemption of 50,000 bonds redeemable for Alcatel-Lucent shares in connection with the acquisition of Spatial Wireless in 2004 to cover stock options, generating a capital increase of € 0 million (including additional paid-in capital of € 0 million).
During 2007, increases in capital stock and additional paid-in capital amounted to € 44 million. These increases related to the following transactions:
• issuance of 2,755,287 shares for € 18 million, as a result of the exercise of options and warrants (including additional paid-in capital of € 13 million);
• conversion of 4,506,992 convertible bonds into Alcatel-Lucent shares generating a capital increase of € 25 million (including additional paid-in capital of € 16 million);
• redemption of 500,000 bonds redeemable for Alcatel-Lucent shares in connection with the acquisition of TiMetra Inc. in 2003 to cover stock options, generating a capital increase of € 4 million (including additional paid-in capital of € 3 million); and
• other increases for € 4 million.
In order to maintain or adjust the capital structure, the Group can adjust the amount of dividends paid to shareholders (see Note 22), or repurchase its own shares (see Note 23f) or issue new shares, or issue convertible bonds or similar instruments (see Note 24).
The Group is not party to any contract restricting the issuance of additional equity.
d/ Stock options
At December 31, 2009, stock option plans (excluding Lucent derived plans) were as follows, however only part of the outstanding stock options are in the scope of IFRS 2 (see Note 25e):

57
(in number of options) 1999-2000 U.S. Plans 2000 Plans
Exercise price U.S. $ 21.40-U.S. $ 84.88 € 48.00 € 65.00 € 64.00
Exercise period
From
04/01/03 04/01/05
12/13/03 12/13/05
12/13/01 12/13/04
To
12/31/05 12/31/07
12/31/05 12/31/07
12/12/08 12/12/08
Granted - - -
Exercised - - - -
Forfeited - - - -
Expired - - - -
Outstanding at December 31, 1998 - - - -
Granted 7,866,630 - -
Exercised - - - -
Forfeited (143,650) - - -
Expired - - - -
Outstanding at December 31, 1999 7,722,980 - - -
Granted 19,407,838 15,239,250 1,235,500 306,700
Exercised (393,296) (10,000) - -
Forfeited (3,060,818) (923,120) - -
Expired - - - -
Outstanding at December 31, 2000 23,676,704 14,306,130 1,235,500 306,700
Exercised (261,205) (3,000) - -
Forfeited (3,327,376) (161,500) (130,150) (3,600)
Expired - - - -
Outstanding at December 31, 2001 20,088,123 14,141,630 1,105,350 303,100
Exercised - - - -,
Forfeited (3,871,401) (581,075) (40,000) (5,100)
Expired - - - -
Outstanding at December 31, 2002 16,216,722 13,560,555 1,065,350 298,000
Exercised - - - -
Forfeited (2,797,641) (320,500) (32,500) (86,421)
Expired - - - -
Outstanding at December 31, 2003 13,419,081 13,240,055 1,032,850 211,579
Exercised - - - -
Forfeited (2,276,230) (174,000) (11,000) (3,838)
Expired - - - -
Outstanding at December 31, 2004 11,142,851 13,066,055 1,021,850 207,741
Exercised - - - -
Forfeited (476 095) (203,750) (18,000) (10,241)
Expired (608 141) - - -
Outstanding at December 31, 2005 10,058,615 12,862,305 1,003,850 197,500
Exercised - - - -
Forfeited - (51,000) (9,500) (1,500)
Expired (1,225,128) (5,182,500) (448,500) -
Outstanding at December 31, 2006 8,833,487 7,628,805 545,850 196,000
Exercised - - - -
Forfeited - (95,500) (500) -
Expired (604,010) - - -
Outstanding at December 31, 2007 8,229,477 7,533,305 545,350 196,000
Exercised - - - -
Forfeited - - - -
Expired (588,006) 7,533,305 545,350 196,000
Outstanding at December 31, 2008 7,641,471 - - -
Exercised - - - -
Forfeited - - - -
Expired (673,929) - - -
OUTSTANDING AT DECEMBER 31, 2009 5,970,996 - - -

58
(in number of options) 2001 Plans
Exercise price € 50.00 € 41.00 € 39.00 € 32.00 € 19.00 € 9.00 € 20.80 € 9.30
Exercise period
From 03/07/02 03/07/05 04/02/02 04/02/02
06/15/02 06/15/05
09/03/02 09/03/05
11/15/02 11/15/05
12/19/02 12/19/05
12/19/02 12/19/05
To 03/06/09 03/06/09 04/01/09 04/01/09
06/14/09 06/14/09
09/02/09 09/02/09
11/14/09 11/14/09
12/18/09 12/18/09
12/18/09 12/18/09
Granted 37,668,588 48,850 2,500 977,410 138,200 162,000 27,871,925 565,800
Exercised - - - - - - - -
Forfeited (1,075,160) (7,050) - (19,350) - - - -
Expired - - - - - - - -
Outstanding at December 31, 2001 36,593,428 41,800 2,500 958,060 138,200 162,000 27,871,925 565,800
Exercised - - - - - - - -
Forfeited (1,271,749) (5,500) - (21,175) (10,300) (30,000) (2,283,225) (37,200)
Expired - - - - - - - -
Outstanding at December 31, 2002 35,321,679 36,300 2,500 936,885 127,900 132,000 25,588,700 528,600
Exercised - - - - - - - (64,444)
Forfeited (6,345,632) (24,050) - (119,780) (13,050) (23,000) (2,517,719) (68,750)
Expired - - - - - - - -
Outstanding at December 31, 2003 28,976,047 12,250 2,500 817,105 114,850 109,000 23,070,981 395,406
Exercised - - - - - (3,000) - (42,574)
Forfeited (1,047,721) - - (33,484) (8,800) (2,539,840) (13,326)
Expired - - - - - - - -
Outstanding at December 31, 2004 27,928,326 12,250 2,500 783,621 106,050 106,000 20,531,141 339,506
Exercised - - - - - - - (2,500)
Forfeited (806,956) - - (15,981) (2,250) - (1,547,776) (101)
Expired - - - - - - - -
Outstanding at December 31, 2005 27,121,370 12,250 2,500 767,640 103,800 106,000 18,983,365 336,905
Exercised - - - - - (24,000) - (149,967)
Forfeited (623,065) - - (22,590) (8,000) - (3,606,350) (77,837)
Expired - - - - - - - -
Outstanding at December 31, 2006 26,498,305 12,250 2,500 745,050 95,800 82,000 15,377,015 109,101
Exercised - - - - - - - (6,500)
Forfeited (987,543) (6,250) - (27,600) (1,750) - (1,885,430) (7,400)
Expired - - - - - - - -
Outstanding at December 31, 2007 25,510,762 6,000 2,500 717,450 94,050 82,000 13,491,585 95,201
Exercised - - - - - - - -
Forfeited (425,160) - - (14,010) - - (922,695) 2,900
Expired - - - - - - - -
Outstanding at December 31, 2008 25,085,602 6,000 2,500 703,440 94,050 82,000 12,568,890 92,301
Exercised - - - - - - - -
Forfeited (25,085,602) (6,000) (2,500) (703,440) (94,050) (82,000) (12,568,890) (92,301)
Expired - - - - - - - -
OUTSTANDING AT DECEMBER 31, 2009 - - - - - - - -

59
(in number of options) 2002 Plans
Exercise price €€17.20 € 16.90 € 14.40 € 13.30 € 5.20 € 3.20 € 4.60 € 5.40
Exercise period
From 02/15/03 02/15/06 04/02/03
05/13/03 05/13/06
06/03/03 06/03/06
09/02/03 09/02/06
10/07/03 10/07/06
11/14/03 11/14/06
12/02/03 12/02/06
To 02/14/10 02/14/10 04/01/10
05/12/10 05/12/10
06/02/10 06/02/10
06/01/10 06/01/10
10/06/10 10/06/10
11/13/10 11/13/10
12/01/10 12/01/10
Granted 123,620 55,750 54,300 281,000 1,181,050 30,500 111,750 54,050
Exercised - - - - - - - -
Forfeited (14,250) (1,000) - (17,660) (64,250) - - -
Expired - - - - - - - -
Outstanding at December 31, 2002 109,370 54,750 54,300 263,340 1,116,800 30,500 111,750 54,050
Exercised - - - - (32,182) (853) (3,375) -
Forfeited (20,425) (13,000) (5,250) (14,090) (165,232) (9,138) (4,250) (10,250)
Expired - - - - - - - -
Outstanding at December 31, 2003 88,945 41,750 49,050 249,250 919,386 20,509 104,125 43,800
Exercised - - - - (204,147) (3,165) (20,838) (3,562)
Forfeited (5,578) (6,000) (4,469) (5,771) (60,849) (3,885) (7,294) (2,000)
Expired - - - - - - - -
Outstanding at December 31, 2004 83,367 35,750 44,581 243,479 654,390 13,459 75,993 38,238
Exercised - - - - (228,445) (3,000) (25,873) (15,685)
Forfeited (10,537) (1,000) (3,281) (11,500) (15,544) - - (10,918)
Expired - - - - - - - -
Adjustments - - - - - - 1,104 -
Outstanding at December 31, 2005 72,830 34,750 41,300 231,979 410,401 10,459 51,224 11,635
Exercised - - - - (159,016) (1,649) (23,524) -
Forfeited (18,250) (7,500) (4,000) (4,479) (5,063) (251) (968) (480)
Expired - - - - - - - -
Outstanding at December 31, 2006 54,580 27,250 37,300 227,500 246,322 8,559 26,732 11,155
Exercised - - - - (32,400) - (6,814) (1,355)
Forfeited (5,000) - (1,500) (31,000) (8,054) - - -
Expired - - - - - - - -
Outstanding at December 31, 2007 49,580 27,250 35,800 196,500 205,868 8,559 19,918 9,800
Exercised - - - - - (850) - -
Forfeited (12,000) - (7,500) (4,000) (20,180) - - -
Expired - - - - - - - -
Outstanding at December 31, 2008 37,580 27,250 28,300 192,500 185,688 7,709 19,918 9,800
Exercised - - - - - - - -
Forfeited (15,000) - - (10,000) (47,037) - (14,167) (5,000)
Expired - - - - - - - -
OUTSTANDING AT DECEMBER 31, 2009 22,580 27,250 28,300 182,500 138,651 7,709 5,751 4,800

60
(in number of options) 2003 Plans
Exercise price € 6.70 € 6.70 € 7.60 € 8.10 € 9.30 € 10.90 € 11.20 € 11.10
Exercise period
From 03/07/04 03/07/07
07/01/06 07/01/07
06/18/04 06/18/07
07/01/04 07/01/07
09/01/04 09/01/07
10/01/04 10/01/07
11/14/04 11/14/07
12/01/04 12/01/07
To 03/06/11 03/06/11
06/30/07 06/30/08
06/17/11 06/17/11
06/30/11 06/30/11
08/31/11 08/31/11
09/30/11 09/30/11
11/13/11 11/13/11
11/30/11 11/30/11
Granted 25,626,865 827,348 338,200 53,950 149,400 101,350 63,600 201,850
Exercised (7,750) (28) - - - - - -
Forfeited (1,583,230) (17,193) - - - - - -
Expired - - - - - - - -
Outstanding at December 31, 2003 24,035,885 810,127 338,200 53,950 149,400 101,350 63,600 201,850
Exercised (1,221,749) (111) (6,944) (473) (1,603) - - (562)
Forfeited (1,142,822) (605) (31,654) (23,951) (6,300) (29,376) (2,000) (37,300)
Expired - - - - - - - -
Outstanding at December 31, 2004 21,671,314 809,411 299,602 29,526 141,497 71,974 61,600 163,988
Exercised (1,566,542) (147) (10,746) (1,842) (833) - - -
Forfeited (477,617) (467) (10,378) (5,434) (2,735) (10,291) (1,500) (29,501)
Expired - - - - - - - -
Outstanding at December 31, 2005 19,627,155 808,797 278,478 22,250 137,929 61,683 60,100 134,487
Exercised (2,097,255) (14,658) (24,573) (9,154) (2,062) (906) - (7,660)
Forfeited (362,806) (317) (4,164) (1,001) (7,641) (4,594) (49,500) (34,616)
Expired - - - - - - - -
Outstanding at December 31, 2006 17,167,094 793,822 249,741 12,095 128,226 56,183 10,600 92,211
Exercised (2,335,784) (175,884) (17,098) (4,399) - - - -
Forfeited (428,652) (257,203) (4,378) (2,695) (4,763) (4,865) (2,000) (17,000)
Expired - (34,358) - - - - - -
Outstanding at December 31, 2007 14,402,658 326,377 228,265 5,001 123,463 51,318 8,600 75,211
Exercised (100) (150) - - - - - -
Forfeited (2,160,900) (9,096) (14,813) - (2,100) (3,000) (1,300) (9,973)
Expired - (317,131) - - - - - -
Outstanding at December 31, 2008 12,241,658 - 213,452 5,001 121,363 48,318 7,300 65,238
Exercised - - - - - - - -
Forfeited (1,057,691) - (12,450) - (1,600) 1,500 (2,300) (4,750)
Expired - - - - - - - -
OUTSTANDING AT DECEMBER 31, 2009 11,183,967 - 201,002 5,001 119,703 46,818 5,000 60,488

61
(in number of options) 2004 Plans
Exercise price € 13.20 €13.10 € 12.80 € 11.70 € 9.90 € 9.80 € 11.20 € 11.90
Exercise period
From 03/10/05 03/10/08
04/01/05 04/01/08
05/17/05 05/17/08
07/01/05 07/01/08
09/01/05 09/01/08
10/01/05 10/01/08
11/12/05 11/12/08
12/01/05 12/01/08
To 03/09/12 03/09/12
03/31/12 03/31/12
05/16/12 05/16/12
06/30/12 06/30/12
08/31/12 08/31/12
09/30/12 09/30/12
11/11/12 11/11/12
11/30/12 11/30/12
Granted 18,094,315 48,100 65,100 313,450 38,450 221,300 69,600 42,900
Exercised - - - - - - - -
Forfeited (724,065) (7,350) (2,550) (13,500) - - - -
Expired - - - - - - - -
Outstanding at December 31, 2004 17,370,250 40,750 62,550 299,950 38,450 221,300 69,600 42,900
Exercised - - - - - (300) - -
Forfeited (1,017,737) (11,292) (6,050) (22,450) (1,300) (27,700) (800) (5,000)
Expired - - - - - - - -
Outstanding at December 31, 2005 16,352,513 29,458 56,500 277,500 37,150 193,300 68,800 37,900
Exercised (700) - - (2,399) (822) (11,330) - -
Forfeited (1,131,200) (3,467) (3,750) (10,638) (5,778) (44,297) (6,100) (1,938)
Expired - - - - - - - -
Outstanding at December 31, 2006 15,220,613 25,991 52,750 264,463 30,550 137,673 62,700 35,962
Exercised - - - - - (7,148) - -
Forfeited (1,070,056) (5,191) (3,000) (60,462) (1,000) (28,757) (30,000) (2,162)
Expired - - - - - - - -
Outstanding at December 31, 2007 14,150,557 20,800 49,250 204,001 29,550 101,768 32,700 33,800
Exercised - - - - - - - -
Forfeited (927,741) (3,000) (4,349) (6,051) (500) (11,979) (6,000) -
Expired - - - - - - - -
Outstanding at December 31, 2008 13,222,816 17,800 44,901 197,950 29,050 89,789 26,700 33,800
Exercised - - - - - - - -
Forfeited (2,318,253) (1,500) (5,000) (21,250) - (8,601) (1,200) (3,500)
Expired - - - - - - - -
OUTSTANDING AT DECEMBER 31, 2009 10,904,563 16,300 39,901 176,700 29,050 81,188 25,500 30,300

62
(in number of options) 2005 Plans
Exercise price € 11.41 € 10.00 € 8.80 € 9.80 € 10.20
Exercise period
From 01/03/06 01/03/09
03/10/06 03/10/09
06/01/06 06/01/09
09/01/06 09/01/09
11/14/06 11/14/09
To 01/02/13 01/02/13
03/09/13 03/09/13
05/31/13 05/31/13
08/31/13 08/31/13
11/13/13 11/13/13
Granted 497,500 16,756,690 223,900 72,150 54,700
Exercised - - - - -
Forfeited (17,400) (707,210) (8,800) - -
Expired - - - - -
Outstanding at December 31, 2005 480,100 16,049,480 215,100 72,150 54,700
Exercised (7,558) (158,438) (965) - (1,250)
Forfeited (61,087) (654,528) (27,243) (7,100) (8,350)
Expired - - - - -
Outstanding at December 31, 2006 411,455 15,236,514 186,892 65,050 45,100
Exercised - (133,932) (6,611) - -
Forfeited (40,427) (1,080,029) (32,480) (5,900) (4,600)
Expired - - - - -
Outstanding at December 31, 2007 371,028 14,022,553 147,801 59,150 40,500
Exercised - - - - -
Forfeited (10,671) (912,558) (8,720) (2,638) (9,000)
Expired - - - - -
Outstanding at December 31, 2008 360,357 13,109,995 139,081 56,512 31,500
Exercised - - - - -
Forfeited (33,468) (966,029) (18,446) (6,262) (7,016)
Expired - - - - -
OUTSTANDING AT DECEMBER 31, 2009 326,889 12,143,966 120,635 50,250 24,484
(in number of options) 2006 Plans
Exercise price € 11.70 € 12.00 € 9.30 € 10.40
Exercise period
From 03/08/07 03/08/10
05/15/07 05/15/10
08/16/07 08/16/10
11/08/07 11/08/07
To 03/07/14 03/07/14
05/14/14 05/14/14
08/15/14 08/15/14
11/07/14 11/07/14
Granted 17,009,320 122,850 337,200 121,100
Exercised - - - -
Forfeited (482,130) (7,100,) - -
Expired - - - -
Outstanding at December 31, 2006 16,527,190 115,750 337,200 121,100
Exercised - - - -
Forfeited (1,272,052) (11,288) (42,180) (19,500)
Expired - - - -
Outstanding at December 31, 2007 15,255,138 104,462 295,020 101,600
Exercised - - - -
Forfeited (1,083,347) (3,468) (8,770) (5,000)
Expired - - - -
Outstanding at December 31, 2008 14,171,791 100,994 286,250 96,600
Exercised - - - -
Forfeited (837,631) (6,052) (8,864) (8,000)
Expired - - - -
OUTSTANDING AT DECEMBER 31, 2009 13,334,160 94,942 277,386 88,600
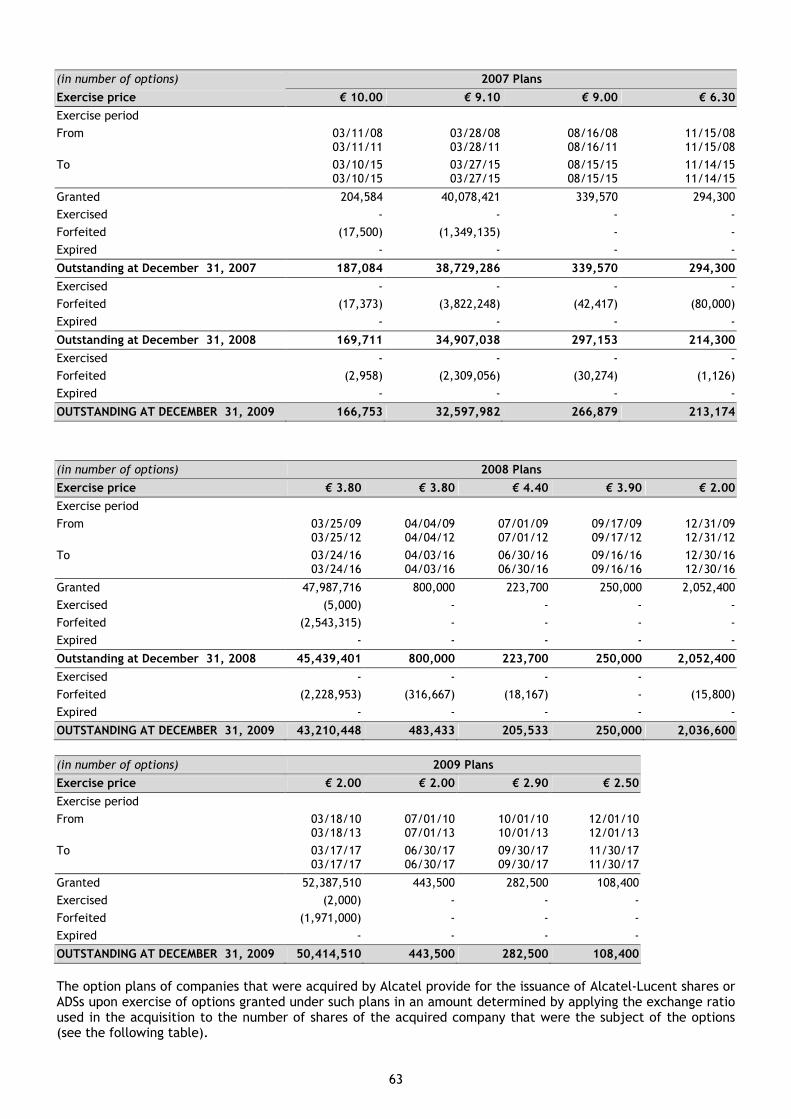
63
(in number of options) 2007 Plans
Exercise price € 10.00 € 9.10 € 9.00 € 6.30
Exercise period
From 03/11/08 03/11/11
03/28/08 03/28/11
08/16/08 08/16/11
11/15/08 11/15/08
To 03/10/15 03/10/15
03/27/15 03/27/15
08/15/15 08/15/15
11/14/15 11/14/15
Granted 204,584 40,078,421 339,570 294,300
Exercised - - - -
Forfeited (17,500) (1,349,135) - -
Expired - - - -
Outstanding at December 31, 2007 187,084 38,729,286 339,570 294,300
Exercised - - - -
Forfeited (17,373) (3,822,248) (42,417) (80,000)
Expired - - - -
Outstanding at December 31, 2008 169,711 34,907,038 297,153 214,300
Exercised - - - -
Forfeited (2,958) (2,309,056) (30,274) (1,126)
Expired - - - -
OUTSTANDING AT DECEMBER 31, 2009 166,753 32,597,982 266,879 213,174
(in number of options) 2008 Plans
Exercise price € 3.80 € 3.80 € 4.40 € 3.90 € 2.00
Exercise period
From 03/25/09 03/25/12
04/04/09 04/04/12
07/01/09 07/01/12
09/17/09 09/17/12
12/31/09 12/31/12
To 03/24/16 03/24/16
04/03/16 04/03/16
06/30/16 06/30/16
09/16/16 09/16/16
12/30/16 12/30/16
Granted 47,987,716 800,000 223,700 250,000 2,052,400
Exercised (5,000) - - - -
Forfeited (2,543,315) - - - -
Expired - - - - -
Outstanding at December 31, 2008 45,439,401 800,000 223,700 250,000 2,052,400
Exercised - - - -
Forfeited (2,228,953) (316,667) (18,167) - (15,800)
Expired - - - - -
OUTSTANDING AT DECEMBER 31, 2009 43,210,448 483,433 205,533 250,000 2,036,600
(in number of options) 2009 Plans
Exercise price € 2.00 € 2.00 € 2.90 € 2.50
Exercise period
From 03/18/10 03/18/13
07/01/10 07/01/13
10/01/10 10/01/13
12/01/10 12/01/13
To 03/17/17 03/17/17
06/30/17 06/30/17
09/30/17 09/30/17
11/30/17 11/30/17
Granted 52,387,510 443,500 282,500 108,400
Exercised (2,000) - - -
Forfeited (1,971,000) - - -
Expired - - - -
OUTSTANDING AT DECEMBER 31, 2009 50,414,510 443,500 282,500 108,400
The option plans of companies that were acquired by Alcatel provide for the issuance of Alcatel-Lucent shares or ADSs upon exercise of options granted under such plans in an amount determined by applying the exchange ratio used in the acquisition to the number of shares of the acquired company that were the subject of the options (see the following table).

64
The following table sets forth the U.S. and Canadian companies (other than Lucent) that issued these plans, the range of exercise prices, the number of outstanding and exercisable options as of December 31, 2009, the weighted average exercise price and the weighted average exercise period.
Outstanding options Exercisable options
Company Exercise price
Number outstanding at December 31,
2009 (1)
Weighted remaining
exercise period(years)
Weighted average exercise
price
Number exercisable at December 31,
2009 (1)
Weighted average exercise
price
Genesys U.S. $ 2.99-U.S. $ 40.67 451,833 0.05 U.S. $ 26.42 451,833 U.S. $ 26.42
Astral Point € 9.95-€ 58.71 25,917 1.32 € 25.21 25,917 € 25.21
Telera € 0.43-€ 6.36 88,824 0.85 € 4.93 88,824 € 4.93
TiMetra € 0.53-€ 7.97 1,153,443 3.14 € 6.47 1,153,443 € 6.47
Spatial Wireless € 0.24-€ 9.10 306,855 4.28 € 4.21 306,855 € 4.21
TOTAL NUMBER OF OPTIONS 2,026,872 2,026,872
(1) In number of Alcatel-Lucent shares.
Except in the case of Astral Point, Telera TiMetra and Spatial Wireless, upon exercise, Alcatel-Lucent will not issue new ADSs (or, consequently, shares); the options set forth in the above table for Genesys entitle the holders to purchase existing ADSs held by Group subsidiaries.
Former Lucent stock-based awards
As indicated in the business combination agreement with Lucent, each outstanding option to purchase shares granted under Lucent’s compensation or benefit plans or agreements pursuant to which shares may be issued (excluding the Lucent 2001 employee stock purchase plan), whether vested or not vested, was converted into a right to acquire the number of Alcatel-Lucent ordinary shares determined by applying the exchange ratio used in the transaction. The exercise price is equal to the product of (a) the quotient of (i) the U.S. dollar exercise price per share otherwise purchasable pursuant to such Lucent stock option, divided by (ii) the exchange ratio, multiplied by (b) the euro exchange rate of € 1.22.
Stock option activity for former Lucent plans is as follows:
(in number of options) Former Lucent plans
Exercise price € 9.35 € 10.89 € 15.28 € 12.40 € 5.49 € 6.88
Exercise period
From 11/01/07 12/01/06 12/01/06 12/01/06 12/01/06 12/01/06
To 10/31/13 11/30/12 11/30/11 11/30/10 12/15/09 11/24/08
Outstanding at December 1, 2006 6,088,483 4,576,237 8,010,525 7,658,168 5,328,118 9,205,331
Granted - - - - - -
Exercised - - - - - -
Expired (73,030) (21,892) (19,751) (12,200) (7,243) (13,966)
Outstanding at December 31, 2006 6,015,453 4,554,345 7,990,774 7,645,968 5,320,875 9,191,365
Exercised (11,636) (9,738) - - (847,800) (2,792,464)
Forfeited (1,195,101) (418,932) (696,150) (657,127) (121,400) -
Expired - - - - - (6,360,315)
Outstanding at December 31, 2007 4,808,716 4,125,675 7,294,624 6,988,841 4,351,675 38,586
Exercised - - - - - -
Forfeited (1,098,706) (670,857) (829,853) (800,785) (341,060) -
Expired - - - - - (38,586)
Outstanding at December 31, 2008 3,710,010 3,454,818 6,464,771 6,188,056 4,010,615 -
Exercised - - - - - -
Forfeited (427,337) (401,399) (757,041) (737,100) - -
Expired - - - - (4,010,615) -
OUTSTANDING AT DECEMBER 31, 2009 3,282,673 3,053,419 5,707,730 5,450,956 - -

65
(in number of options) Former Lucent plans
Exercise price € 61.93 € 224.93 € 0.28 to 10.00 € 10.01 to
20.00 € 20.01 and
more
Exercise period
From 12/01/06 12/01/06 12/01/06 12/01/06 12/01/06
To 12/25/10 05/31/10 12/03/06 12/01/06 12/01/06
05/03/14 12/01/14 01/05/12
Outstanding at December 1, 2006 1,484,527 1,260,610 1,392,124 662,880 10,776,344
Granted - - - - -
Exercised - - - - -
Expired - (150) (3,804) (35,117) (64,652)
Outstanding at December 31, 2006 1,484,527 1,260,460 1,388,320 627,763 10,711,692
Exercised - - (164,608) - -
Adjustment - - - 126,355 (126,355)
Forfeited (1,504) (110,367) (519,079) - (2,445,915)
Expired - - - - -
Outstanding at December 31, 2007 1,483,023 1,150,093 704,633 754,118 8,139,422
Exercised - - (9,296) - -
Forfeited (107,021) (12,779) (224,271) (233,239) (3,508,464)
Expired - - - - -
Outstanding at December 31, 2008 1,376,002 1,137,314 471,066 520,879 4,630,958
Exercised - - (3,526) - -
Forfeited (62,003) (2,187) (22,206) (101,464) (1,628,781)
Expired - - - - -
OUTSTANDING AT DECEMBER 31, 2009 1,313,999 1,135,127 445,334 419,415 3,002,177
Moreover, each unvested restricted stock unit granted under Lucent’s compensation or benefit plans or agreements was converted into the number of Alcatel-Lucent ordinary shares determined by applying the exchange ratio used in the transaction.
The following table summarizes unvested restricted stock unit activity:
(in number of stocks)
Former Lucent restricted stock
unit activity
Unvested at December 1, 2005 1,684,575
Vested (961)
Forfeited (20,918)
Unvested at December 31, 2006 1,662,696
Vested (679,998)
Forfeited (69,366)
Unvested at December 31, 2007 913,332
Vested (807,591)
Forfeited (85,620)
Unvested at December 31, 2008 20,121
Vested (13,728)
Forfeited (6,393)
UNVESTED AT DECEMBER 31, 2009 -
e/ Share-based payments
Only share-based payments established after November 7, 2002 that were not yet fully vested at January 1, 2005 were restated according to IFRS 2 “Share-based Payment”. Those share-based payments that were fully vested at December 31, 2004 did not result in a charge due to the adoption of IFRS in subsequent accounting periods.
By simplification, for historical Alcatel plans, during the vesting period and as a result of employees leaving the Group, no share-based payment forfeitures are taken into account when determining compensation expense for share-based payments granted. During the vesting period and as a result of employees leaving the Group, the accounting impact of share-based payment forfeiture is recognized when the forfeiture is made. For share-based

66
payments cancelled by forfeiture before the end of the vesting period, this can mean correcting the charge, recognized in prior accounting periods, in the period following the forfeiture.
During the vesting period, estimated annual forfeiture rates of 7% for Lucent plans and 5% for share-based payments granted by Alcatel-Lucent since March 2007 are applied when determining compensation expense. The estimated forfeiture rate is ultimately adjusted to actual.
Share-based payments cancelled after the vesting period and share-based payments not exercised do not result in correcting charges previously recognized.
Stock options
Fair value of options granted by historical Alcatel (prior to December 1, 2006) and by Alcatel-Lucent (after December 1, 2006)
The fair value of stock options is measured at granting date using the Cox-Ross-Rubinstein binomial model. This allows behavioral factors governing the exercise of stock options to be taken into consideration and to consider that all options will not be systematically exercised by the end of the exercise period. The expected volatility is determined as being the implied volatility at the grant date.
Assumptions for the plans representing more than 1,000,000 outstanding options related to historical Alcatel (before December 1, 2006) and Alcatel-Lucent (after December 1, 2006) are as follows:
• expected volatility: 40% for the March 2005 plan, 32% for the March 2006 plan, 33% for the March 2007 plan, 45% for the March 2008 plan and 64% for the March 2009 plans;
• risk-free rate: 3.50% for the March 2005 plan and March 2006 plan, 4% for the March 2007 plan, 3.90% for the March 2008 Plan and 3.00% for the March 2009 plans;
• distribution rate on future income: 0% in 2005, 1% for March 2006 plan and 0.8% for later years.
Based on these assumptions, the fair values of historical Alcatel options (before December 1, 2006) and Alcatel-Lucent options (after December 1, 2006) used in the calculation of compensation expense for share-based payments are as follows:
• March 2005 plan with an exercise price of € 10.00: fair value of € 3.72; • March 2006 plan with an exercise price of € 11.70: fair value of € 3.77; • March 2007 plan with an exercise price of € 9.10: fair value of € 3.04; • March 2008 plan with an exercise price of € 3.80: fair value of € 1.50; • March 2009 plan with an exercise price of € 2.00: fair value of € 0.49; • March 2009 all employees plan with an exercise price of € 2.00: fair value of € 0.46; • Other plans have fair values between € 0.69 and € 4.18 and a weighted average fair value of € 1.96.
Lucent stock-based awards
The fair values were recalculated at November 30, 2006, the business combination date, with the following assumptions:
• expected volatility: 26.20% to 32.37% depending on the remaining life of the options;
• risk-free rate: 3.35% to 3.62% depending on the remaining life of the options;
• distribution rate on future income: 0.8%.
The estimated fair value of outstanding stock awards as of November 30, 2006 amounted to € 133 million, consisting of € 96 million for vested options and € 37 million for unvested options.

67
Impact on income (loss) from operating activities of share-based payments resulting from stock options, stock purchase plans and restricted stock and cash units
Compensation expense recognized for share-based payments in accordance with IFRS 2 is analyzed as follows:
(in millions of euros) 2009 2008 2007
Compensation expense for share-based payments 59 89 102
Presented in the income statement:
• cost of sales 14 20 25
• administrative and selling expenses 26 40 47
• research and development costs 17 25 27
• restructuring costs 1 4 3
Of which equity settled 58 88 102
Of which cash settled (1) 1 1 -
(1) French taxes paid at the grant date by Alcatel-Lucent for stock-options, restricted stock units and performance shares granted from January 1, 2008 onwards.
Characteristics of subscription stock option plans or stock purchase plans recognized in compliance with IFRS 2
Vesting conditions:
The following rules are applicable to all plans granted by historical Alcatel in 2005 and 2006 and by Alcatel-Lucent in 2007, 2008 and 2009 except for the March 2009 all employees plan and for options granted after May 2008 to Management Committee members:
• Vesting is gradual: options vest in successive portions over 4 years, for which 25% of the options are vested if the employee remains employed after 12 months and, for each month after the first year, 1/48 of the options are vested if the employee remains employed by the Group;
• Exercise period depends on country: in some countries, stock options can be exercised as soon as they are vested; in other countries, stock options cannot be exercised during a four-year vesting period. Whatever the beginning of the exercise period is, stock options terminate 8 years after the grant date.
Vesting conditions for the March 2009 all employees plan:
On March 18, 2009, our Board of Directors authorized the grant of 400 stock options to all of our employees, subject to compliance with the relevant laws of the countries where the beneficiaries work. The following rules are applicable:
• These options will vest, subject to the service conditions, in two successive tranches, at 50% per year over two years;
• Exercise period depends on country: in some countries, stock options can be exercised as soon as they vest; in other countries, stock options cannot be exercised during a four-year vesting period. Whatever the begin-ning of the exercise period is, stock options terminate 8 years after the grant date.
Vesting conditions for options granted after May 2008 to Management Committee members:
The following rules are applicable to all plans granted after May 2008 by Alcatel-Lucent to Management Committee members:
• Vesting is gradual: options vest linearly over 4 years (25% per year); • Exercise period depends on country: in some countries, stock options can be exercised as soon as they vest;
in other countries, stock options cannot be exercised during a four-year vesting period. Whatever the begin-ning of the exercise period is, stock options terminate 8 years after the grant date.
• Performance conditions for option grants applicable to members of our Management Committee: Options granted to members of our Management Committee are subject to the same conditions as those governing all other beneficiaries, as well as the following conditions. In compliance with the commitment made by our Board of Directors at the Annual Shareholders’ Meeting held on May 30, 2008, 50% of options granted after this date to Management Committee members are also subject to an additional exercisability condition linked to the performance of Alcatel-Lucent shares. The share price of Alcatel-Lucent shares will be measured yearly in relation to a representative sample of 14 peer group companies that are solution and service pro-viders in the telecommunications equipment sector (this figure may be revised in line with market changes). The number of vested stock options that will be exercisable will be measured annually in proportion to our stock price’s performance as compared to our peer group. This annual measurement will occur over a four-

68
year period, beginning from the grant date. At the Board meeting closest to the end of each twelve month period, our Board, after consultation with the Compensation Committee, will determine whether or not the stock performance target has been met for the prior year, based on an annual study conducted by a third party consulting firm.
Certain plans that existed at companies acquired in business combinations were converted into historical Alcatel or Alcatel-Lucent subscription stock option plans or stock purchase plans. For plans of companies acquired, the vesting conditions and the option lives of the original plans remain in place.
For former Lucent stock options, vesting rules remain unchanged. Stock options usually vest linearly over a 4-year period (25% per year) and can be exercised as soon as they vest.
Conditions of settlement:
All stock options granted by historical Alcatel, Lucent (prior to the business combination) or Alcatel-Lucent are exclusively settled in shares.
Number of options granted and changes in number of options
As indicated in Note 1w, only options issued by historical Alcatel after November 7, 2002 and not fully vested at January 1, 2005 and those issued after January 1, 2005 by historical Alcatel or Alcatel-Lucent are accounted for according to IFRS 2. In the case of a business combination, outstanding stock options at the acquisition date of a company acquired by historical Alcatel or Alcatel-Lucent are usually converted into options to purchase Alcatel-Lucent shares using the same exchange ratio as for the acquired shares of the target company. Unvested options at the acquisition date are accounted for at their fair value as deferred compensation in shareholders’ equity (included in additional paid-in capital) and are considered as being in the scope of IFRS 2 if the business combination occurred after November 7, 2002.

69
Stock option plans covered by IFRS 2 (excluding all Lucent plans) and the change in number of stock options generating compensation expense are:
(in number of options) 2005 Plans 2006 Plans 2007 Plans
Exercise price € 10.00 € 8.80 to
11.41 € 11.70 € 9.30 to
12.00 € 9.10 € 6.30 to
10.0
Exercise period
From 10/03/06 10/03/09
03/01/06 01/09/09
08/03/07 08/03/10
15/05/07 08/11/10
28/03/08 28/03/11
01/03/08 15/11/11
To 09/03/13 09/03/13
02/01/13 31/08/13
07/03/14 07/03/14
14/05/14 07/11/14
27/03/15 27/03/15
28/02/15 14/11/15
Outstanding at December 31, 2004
Granted 16,756,690 848,250 - - - -
Exercised - - - - - -
Forfeited (707,210) (26,200) - - - -
Expired - - - - - -
Outstanding at December 31, 2005 16,049,480 822,050 - - - -
Granted - - 17,009,320 581,150 - -
Exercised (158,438) (9,773) - - - -
Forfeited (654,528) (103,780) (482,130) (7,100) - -
Expired - - - - - -
Outstanding at December 31, 2006 15,236,514 708,497 16,527,190 574,050 - -
Granted - - - - 40,078,421 838,454
Exercised (133,932) (6,611) - - - -
Forfeited (1,080,029) (83,407) (1,272,052) (72,968) (1,349,135) (17,500)
Expired - - - - - -
Outstanding at December 31, 2007 14,022,553 618,479 15,255,138 501,082 38,729,286 820,954
Granted - - - - - -
Exercised - - - - - -
Forfeited (912,558) (31,029) (1,083,347) (17,238) (3,822,248) (139,790)
Expired - - - - - -
Outstanding at December 31, 2008 13,109,995 587,450 14,171,791 483,844 34,907,038 681,164
Exercised - - - - - -
Forfeited (966,029) (65,192) (837,631) (22,916) (2,309,056) (34,358)
Expired - - - - - -
OUTSTANDING AT DECEMBER 31, 2009 12,143,966 522,258 13,334,160 460,928 32,597,982 646,806
Of which could be exercised 12,143,966 522,258 12,738,513 382,151 23,446,637 389,428
Average share price at exercise during the period - - - - - -

70
(in number of options) 2008 Plans 2009 Plans
Total 2005 plans to 2009
plans
Exercise price € 3.80 € 2.00 to
4.40 € 2.00 € 2.00 € 2.00 to
2.90
Exercise period
From 25/03/09 25/03/12
04/04/0931/12/12
18/03/1018/03/13
18/03/10 18/03/13
01/07/10 01/12/13
To 24/03/16 24/03/16
03/04/1630/12/16
17/03/1717/03/17
17/03/17 17/03/17
30/06/17 30/11/17
Outstanding at December 31, 2004 - - - - -
Granted - - - - - 17,604,940
Exercised - - - - - 0
Forfeited - - - - - -733,410
Expired - - - - - 0
Outstanding at December 31, 2005 - - - - - 16,871,530
Granted - - - - - 17,590,470
Exercised - - - - - -168,211
Forfeited - - - - - -1,247,538
Expired - - - - - 0
Outstanding at December 31, 2006 - - - - - 33,046,251
Granted - - 40,916,875
Exercised - - - - - -140,543
Forfeited - - - - - -3,875,091
Expired - - - - - 0
Outstanding at December 31, 2007 - - - - - 69,947,492
Granted 47,987,716 3,326,100 - - - 51,313,816
Exercised (5,000) - - - - -5,000
Forfeited (2,543,315) - - - - -8,549,525
Expired - - - - - 0
Outstanding at December 31, 2008 45,439,401 3,326,100 - - - 112,706,783
Granted - - 30,656,400 21,731,110 834,400 53,221,910
Exercised - - (2,000) - - (2,000)
Forfeited (2,228,953) (350,634) (1,971,000) - - (8,785,769)
Expired - - - - - -
OUTSTANDING AT DECEMBER 31, 2009 43,210,448 2,975,46628,683,400 21,731,110 834,400 157,140,924
Of which could be exercised 9,086,018 627,903 10,400 - - 59,347,274
Average share price at exercise during the period - - € 2.67 - - € 2.67

71
For Lucent stock option plans covered by IFRS 2, the changes in number of stock options generating compensation expense are:
(in number of options) Lucent plans Total
Exercise price € 9.35 € 10.89 € 0.28 to
10.00 € 10.01 to
20.00
Exercise period
From 11/01/07 12/01/06 12/01/06 12/01/06
To 10/31/13 11/30/12 12/03/06 12/01/06
05/03/14 02/01/14
Outstanding at December 1, 2006 6,088,483 4,569,566 283,121 606,827 11,547,997
Granted - - - - 0
Exercised - - - - 0
Expired/Forfeited (73,030) (21,860) - (185) (95,075)
Outstanding at December 31, 2006 6,015,453 4,547,706 283,121 606,642 11,452,922
Granted - - - - 0
Exercised (11,636) (9,724) (95,532) - (116,892)
Expired/Forfeited (1,195,101) (418,321) (59,667) (350,903) (2,023,992)
Outstanding at December 31, 2007 4,808,716 4,119,661 127,922 255,739 9,312,038
Granted - - - - 0
Exercised - - (143) - (143)
Expired/Forfeited (1,098,706) (669,879) (58,726) (169,054) (1,996,365)
Outstanding at December 31, 2008 3,710,010 3,449,782 69,053 86,685 7,315,530
Granted - - - - -
Exercised - - (67) - (67)
Expired/Forfeited (427,337) (400,814) (60,582) (66,007) (954,740)
OUTSTANDING AT DECEMBER 31, 2009 3,282,673 3,048,968 8,404 20,678 6,360,723
Of which could be exercised 2,570,330 3,048,968 8,245 19,659 5,647,202
Average share price at exercise during the period - - € 2.59 - € 2.59
Restricted Cash Units (RCUs)
The Board decided at its meeting held on April 4, 2008 to award up to 366,300 Restricted Cash Units (RCUs) to Patricia Russo if certain criteria were met over the two-year period following the Board’s decision. They were cancelled when Patricia Russo left the Group. These restricted cash units had therefore no impact on the net result for 2009.
Restricted Stock Units (RSUs) or Performance shares
Fair value of Performance shares granted by Alcatel-Lucent
The fair value of performance shares is measured at granting date as being the Alcatel-Lucent share price discounted by the assumed distribution rate on future income, set at 0.8% per year.
Based on this assumption, the fair values of Alcatel-Lucent performance shares used in the calculation of compensation expense for share-based payments are as follows:
September 17, 2008 plan: fair value of € 3.05; October 29, 2008 plan: fair value of € 1.63; March 2009 plan: fair value of € 1.19;
Vesting conditions:
The following rules are applicable to all performance share plans granted by Alcatel-Lucent:
• Service condition: For a beneficiary who is an employee and/or Executive Officer of a company within the Group with its registered office in France, his/her performance shares will vest at the end of a two-year vest-ing period. Such performance shares will be available following the expiration of a two-year holding period. For a beneficiary who is an employee and/or Executive Officer of a company within the Group with its regis-tered office outside of France, the vesting period is four years, with no additional holding period;
• Performance condition: Evaluation of the Group’s performance must be based on the same criteria as those used for the Global Annual Incentive Plan. For each of the criteria, quantified targets will be fixed at the

72
start of each year for the current fiscal year. At the end of the two or four-year vesting periods, so long as the beneficiary has been an employee of the Group for two years (with limited exceptions) the number of performance shares that will vest will depend on the achievement, based on an average, of the annual Group performance targets set by our Board for the two or four-year periods.
Conditions of settlement:
All performance shares granted by Alcatel-Lucent are exclusively settled in shares.
Number of performance shares granted and changes in number of performance shares
Performance shares covered by IFRS 2 and the change in number of performance shares generating compensation expense are: (In number of performance shares) Grant date 17/09/2008 29/10/2008 18/03/2009 Outstanding at December 31, 2007 - - - Granted 100,000 250,000 - Acquired - - - Forfeited - - - Outstanding at December 31, 2008 100,000 250,000 - Granted - - 6,982,956 Acquired - - - Forfeited - - - OUTSTANDING AT DECEMBER 31, 2009 100,000 250,000 6,982,956
f/ Treasury stock
Alcatel-Lucent established a buy-back program for the ordinary shares, authorized at the shareholders’ ordinary annual general meetings held on September 7, 2006 and June 1, 2007, for the purpose of allocating those shares to employees of the Group under the terms provided by law, of honoring obligations arising from the issuance of securities conferring a right to the capital of the company or for use in an exchange or as payment for acquisitions. The purchases are limited to a maximum of 10% of the capital stock, and authorization expires 18 months from the most recent shareholders’ general meeting at which authorization was given. As part of this program, no shares were purchased through December 31, 2009 (no shares were purchased in 2008 or 2007).
The carrying value of Alcatel-Lucent shares owned by Group consolidated subsidiaries was € 1,567 million at December 31, 2009 (€ 1,566 million at December 31, 2008 and € 1,567 million at December 31, 2007). They are deducted at cost from retained earnings.
g/ Non-controlling interests
(in millions of euros)
Balance at December 31, 2006 495
Other changes (1) (21)
Non-controlling interests in 2007 income 41
Balance at December 31, 2007 515
Other changes (1) 34
Non-controlling interests in 2008 income 42
Balance at December 31, 2008 591
Other changes (1) (42)
Non-controlling interests in 2009 income 20
BALANCE AT DECEMBER 31, 2009 569
(1) This amount primarily relates to dividends distributed to owners of non-controlling interests in certain Group subsidiaries and to net gains (losses) recognized directly in equity attributable to non-controlling interests.

73
NOTE 24 COMPOUND FINANCIAL INSTRUMENTS
Compound financial instruments (convertible bonds)
OCEANE - 2015 OCEANE - 2011
December 31 December 31
(in millions of euros) 2009 2008 2007 2009 2008 2007
Statement of financial position
Equity component 211 - - 23 56 81
Equity 211 - - 23 56 81
Convertible bonds – due after one year 789 - - 815 1,002 941
Convertible bonds – due within one year and interest paid and payable 16 - - 39 49 48
Financial debt 805 - - 854 1,051 989
Income statement - -
Finance costs relating to gross debt (25) - - (53) (74) (72)
7.75% Lucent 2.875% A, Lucent 2.875% B, Lucent
December 31 December 31 December 31 (in millions of euros)
2009 2008 2007 2009 2008 2007 2009 2008 2007
Statement of financial position
Equity component 87 109 119 7 208 205 254 272 266
Equity 87 109 119 7 208 205 254 272 266
Convertible bonds – due after one year 578 654 655 0 345 319 381 386 357
Convertible bonds – due within one year and interest paid and payable 2 3 3 362 1 1 1 1 1
Financial debt 580 657 658 362 346 320 382 387 358
Income statement
Finance costs relating to gross debt (58) (64) (69) (31) (22) (23) (27) (24) (26)
a/ OCEANE (Obligations à option de conversion et/ou d’échange en actions nouvelles ou existantes) issued by Alcatel before the business combination
On June 12, 2003, historical Alcatel issued 63,192,019 bonds having a nominal value of € 16.18 each, convertible into new or existing ordinary shares (OCEANE) for a total value of € 1,022 million. These bonds mature on January 1, 2011 and bear interest at a rate of 4.75% per annum.
These bonds have a buy-back option that Alcatel-Lucent can exercise in the period from June 12, 2008 to December 31, 2010.
The OCEANE bonds are considered a compound financial instrument containing an equity component and a debt component. Early application of the buy-back option does not require any separate accounting, as the repurchase price is at nominal value and the buy-back option is a derivative closely linked to the debt issuance. The buy-back option is therefore included in the debt component of this compound financial instrument. At the time of issuance, the debt component was valued at € 861 million, which corresponded to the present value of a similar bond issue but without any equity component. The equity component included in shareholders’ equity was valued at € 161 million at the date of issuance.
The costs that relate to the issue of a compound financial instrument are allocated to the component parts in proportion to the allocation of proceeds. The costs to be allocated to the debt component were valued at € 13 million. Thus the carrying value of the debt component at the date of issuance is equal to € 848 million. The difference between the nominal value and the carrying value of the debt component at the date of issuance, that means € 174 million, is amortized to finance costs over the life of the debt.
The OCEANE bonds, which were hedged as of December 31, 2008 using interest rate swaps, were then measured at fair value. The interest rate swaps were sold in the first quarter 2009 and, as a result, the fair value hedge

74
accounting ceased. As prescribed by IAS 39 (paragraphs 91 and 92), when fair value accounting ceases, the fair value adjustment to the carrying amount of the bonds is amortized to profit or loss over the life of the debt.
Thus the amount to be amortized to finance costs decreased by € 44 million and the effective rate of interest of the debt component dropped from 7.83% as of December 31, 2008 to 5.19% as of December 31, 2009.
The amortizations described above increased the interest cost of the OCEANE bonds by € 7 million in 2009, 25 million in 2008 and by € 23 million in 2007.
Some of these bonds were repurchased during the third and the fourth quarters of 2009 (see note 26).
At December 31, 2009, the fair value of the debt component of the remaining OCEANE bonds was € 883 million (see Note 26h) and the market value of the remaining OCEANE bonds was € 883 million (€ 849 million and € 859 million repectively as of December 31, 2008 and € 1,012 million and € 1,030 million respectively as of December 31, 2007).
b/ OCEANE issued by Alcatel-Lucent
On September 10, 2009, Alcatel-Lucent issued 309,597,523 bonds having a nominal value of € 3.23 each, convertible into new or existing ordinary shares (OCEANE) for a total value of € 1,000 million. These bonds mature on January 1, 2015 and bear interest at a rate of 5.00% per annum.
The bond holders may request that the bonds are converted and/or exchanged into new and/or existing shares of the Company at any time from October 20, 2009 and until the seventh business day preceding the maturity date or the relevant early redemption date.
Moreover, these bonds have a buy-back option that Alcatel-Lucent can exercise in the period from January 1, 2014 until the maturity date of the Bonds, if the quoted price of the Company’s shares exceeds 130% of the par value of the Bonds.
The OCEANE bonds are considered as a compound financial instrument containing an equity component and a debt component. Early application of the buy-back option does not require any separate accounting, as the repurchase price is at nominal value and the buy-back option is a derivative closely linked to the debt issuance. The buy-back option is therefore included in the debt component of this compound financial instrument. At the time of issuance, the debt component was valued at € 800 million, which corresponded to the present value of a similar bond issue but without any equity component. The equity component included in shareholders’ equity was valued at € 200 million at the date of issuance.
The costs to be allocated to the debt component were valued at € 21 million. Thus the carrying value of the debt component at the date of issuance was equal to € 779 million. The difference between the nominal value and the carrying value of the debt component at the date of issuance, that means € 221 million, is amortized to finance costs over the life of the debt.
The amortization described above increased the interest cost of the OCEANE bonds by € 10 million in 2009.
The effective rate of interest of the debt component is 10.54% including debt issuance costs.
At December 31, 2009, the fair value of the debt component of the OCEANE bonds was € 829 million (see Note 26h) and the market value of the OCEANE bonds was € 1,108 million.
c/ Compound financial instruments issued by Lucent before the business combination
2.875% Series A and B Convertible Debentures
Alcatel-Lucent launched a joint solicitation of consent from holders of record as of December 14, 2006, of Lucent’s 2.75% Series A Convertible Senior Debentures due 2023 and 2.75% Series B Convertible Senior Debentures due 2025 (collectively, the “Debentures”) to amend the Indenture for the Debentures, in return for a full and unconditional guaranty from Alcatel-Lucent, which is unsecured and subordinated to its senior debt, a one time adjustment to the conversion ratio, a further adjustment to the conversion ratios upon cash dividends or distributions on Alcatel-Lucent ordinary shares in excess of € 0.08 per share annually and a change of the interest rate to 2.875% from 2.75%.
The amendment allows Alcatel-Lucent to provide such information, documents and other reports that are required to be filed by Alcatel-Lucent pursuant to Sections 13 and 15(d) of the U.S. Securities Exchange Act of 1934, to holders of the Debentures, instead of having to produce separate statements for Lucent after the completion of the business combination. The consent solicitation was completed on December 29, 2006. As a result, the terms of Lucent’s 2.75% convertible senior debentures were modified as follows:

75
Series A Series B
Old Terms New Terms Old Terms New Terms
Coupon rate 2.75% 2.875% 2.75% 2.875%
Conversion ratio 58.4431 59.7015 62.5641 65.1465
The benefit granted to the bondholders corresponding to the adjustment of the conversion ratio amounted to € 18 million and was accounted for in “Other financial loss” in 2006.
The debentures rank equal in priority with all of the existing and future unsecured and unsubordinated indebtedness and senior in right of payment to all of Lucent’s existing and future subordinated indebtedness. The terms governing the debentures limit the ability to create liens, secure certain indebtedness and merge with or sell substantially all of its assets to another entity.
As a result of the acquisition, the debentures are convertible into Alcatel-Lucent ADSs (American Depository Shares) and cash in lieu of fractional ADSs. The debentures are convertible into ADSs only if (1) the sale price of the ADSs for at least twenty trading days during the period of thirty consecutive trading days ending on the last trading day of the previous calendar quarter is greater than or equal to 120% of the applicable conversion price, (2) the trading price of the debentures is less than 97% of the product of the sale price of the ADSs and the conversion rate during any five consecutive trading-day periods, (3) the debentures have been called for redemption by Lucent or (4) certain specified corporate actions occur.
At Lucent’s option, the debentures are redeemable for cash after certain dates (optional redemption periods) at 100% of the principal amount plus any accrued and unpaid interest. In addition, at Lucent’s option, the debentures are redeemable earlier (provisional redemption periods) if the sale price of the ADSs exceeds 130% of the applicable conversion price. Under these circumstances, the redemption price would also include a make-whole payment equal to the present value of all remaining scheduled interest payments through the end of the optional redemption periods.
At the option of the holder, the debentures are redeemable on certain dates at 100% of the principal amount plus any accrued and unpaid interest. In these circumstances, Lucent may pay the purchase price with cash, ADSs (with the ADSs to be valued at a 5% discount from the then current market price) or a combination of both.
The following table summarizes the specific terms of these securities.
Series A Series B
Amount outstanding as at December 31, 2009 $ 530,000,000 $ 880,500,000
Conversion ratio 59.7015 65.1465
Conversion price $ 16.75 $ 15.35
Redemption periods at the option of the issuer:
Provisional redemption periods June 20, 2008 through June 19, 2010
June 20, 2009 through June 19, 2013
Optional redemption periods After June 19, 2010 After June 19, 2013
Redemption dates at the option of the holder June 15, 2010, 2015 and 2020 June 15, 2013 and 2019
Maturity dates June 15, 2023 June 15, 2025
We re-assessed during the closing of the second quarter’s financial results the reliability of the future estimated cash flows from Lucent’s 2.875 % Series A convertible debentures. Based upon the remaining period until the next optional redemption date (i.e. June 15, 2010), the current and recent share price and other market data, we considered as a reliable estimate that bond holders will redeem the bonds on the optional redemption date. Therefore, the estimated future cash flows associated with this convertible debenture were changed and the accounting presentation was amended in accordance with IAS 39 requirements. This change in estimates represented an “other financial loss” of US$ 233 million (€ 175 million-see Note 8) and a corresponding increase in the carrying value of this financial debt compared to December 31, 2008 (see Note 26).
The effective rate of interest of the debt component is 6.78% for Series A and 6.82% for Series B.
Some of the Series A were repurchased during the third and the fourth quarters of 2009 (see note 26).
At December 31, 2009, the fair value of the debt component of the remaining convertible bonds (see Note 26h) was € 350 million for Series A and € 450 million for Series B (€ 375 million and € 220 million respectively as of December 31, 2008 and € 331 million and € 282 million respectively as of December 31, 2007) and the market value of the remaining convertible bonds was € 350 million for Series A and € 524 million for Series B (€ 437 million and € 296 million respectively as of December 31, 2008 and € 467 million and € 473 million respectively as of December 31, 2007).

76
7.75% Convertible Securities (Liability to Subsidiary Trust Issuing Preferred Securities)
During fiscal 2002, Lucent Technologies Capital Trust I (the “Trust”) sold 7.75% cumulative convertible trust preferred securities for an aggregate amount of $1.75 billion. The Trust used the proceeds to purchase Lucent Technologies Inc. 7.75% convertible subordinated debentures due March 15, 2017, which represent all of the Trust’s assets. The terms of the trust preferred securities are substantially the same as the terms of the debentures. Lucent Technologies Inc. (now known as Alcatel-Lucent USA Inc.) owns all of the common securities of the Trust and as a result consolidates the Trust.
Lucent may redeem the debentures, in whole or in part, for cash at premiums ranging from 103.88% beginning March 20, 2007, to 100.00% on March 20, 2012 and thereafter. To the extent Lucent redeems debentures, the Trust is required to redeem a corresponding amount of trust preferred securities. Lucent has irrevocably and unconditionally guaranteed, on a subordinated basis, the payments due on the trust preferred securities to the extent Lucent makes payments on the debentures to the Trust.
The ability of the Trust to pay dividends depends on the receipt of interest payments on the debentures. Lucent has the right to defer payments of interest on the debentures for up to 20 consecutive quarters. If payment of interest on the debentures is deferred, the Trust will defer the quarterly distributions on the trust preferred securities for a corresponding period. Deferred interest accrues at an annual rate of 9.25%. At the option of the holder, each trust preferred security is convertible into Alcatel-Lucent ADSs, subject to an additional adjustment under certain circumstances. The following table summarizes the terms of this security.
Conversion ratio 40.3306
Conversion price $ 24.80
Redemption period at Lucent's option After March 19, 2007
Maturity date March 15, 2017
The effective rate of interest of the debt component is 9.81%.
Some of these bonds were repurchased during the fourth quarter of 2008 and during the first quarter of 2009 (see Note 26).
At December 31, 2009, the fair value of the debt component of the remaining convertible bonds (see Note 26h) was € 490 million and the market value of the remaining convertible bonds was € 502 million ((€ 198 million and € 241 million respectively as of December 31, 2008 and € 478 million and € 549 million respectively as of December 31, 2007).
NOTE 25 PENSIONS, RETIREMENT INDEMNITIES AND OTHER POST-RETIREMENT BENEFITS
In accordance with the laws and customs of each country, the Group provides to its employees pension plans, certain medical insurance and reimbursement of medical expenses. In France, Group employees benefit from a retirement indemnity plan. In other countries, the plans depend upon local legislation, the business and the historical practice of the subsidiary concerned.
In addition to state pension plans, the plans can be defined contribution plans or defined benefit plans. In the latter case, such plans are wholly or partially funded by assets solely to support these plans (listed shares, bonds, insurance contracts or other types of dedicated investments).
State plans
In certain countries, and more particularly in France and Italy, the Group participates in mandatory social security plans organized at state or industry level, for which contributions expensed correspond to the contributions due to such state or equivalent organizations. Such plans are considered to be defined contribution plans. However, in certain countries, the element of social security contributions paid that relates to pension plans is not clearly identifiable.
Other defined contribution plans
The benefits paid out depend solely on the amount of contributions paid into the plan and the investment returns arising from the contributions. The Group’s obligation is limited to the amount of contributions that are expensed.
Contributions made to defined contribution plans (excluding mandatory social security plans organized at state or industry level) were € 84 million for 2009 (€ 78 million for 2008 and € 79 million for 2007).

77
Defined benefit plans
These plans have differing characteristics:
• life annuity: the retirees benefit from receiving a pension during their retirement. These plans are to be found primarily in Germany, United Kingdom and the United States;
• lump-sum payment on the employee’s retirement or departure. These plans are to be found primarily in France, Belgium and Italy;
• post-employment medical care during retirement. In the United States, Alcatel-Lucent reimburses medical expenses of certain retired employees and provides to retired employees with group life benefits.
Pensions and retirement obligations are determined in accordance with the accounting policies presented in Note 1k.
For former Lucent activities, Alcatel-Lucent maintains defined benefit pension plans covering employees and retirees, a majority of which are located in the U.S., as well as other post-retirement benefit plans for U.S. retirees that include health care, dental benefits and life insurance coverage. The U.S. pension plans feature a traditional service-based program, as well as a cash balance program. The cash balance program was added to the defined benefit pension plan for U.S. management employees hired after December 31, 1998. No employees were transitioned from the traditional program to the cash balance program. Additionally, employees covered by the cash balance program are not eligible to receive company-paid post-retirement health and Group life coverage. U.S. management employees with less than 15 years of service as of June 30, 2001 are not eligible to receive post-retirement Group life and health care benefits. As of January 1, 2008, there are no new entrants into the defined benefit plan for management retirees. On October 21, 2009, Alcatel-Lucent USA Inc. froze the US defined benefit management pension plan and the US Supplemental pension plan effective January 1, 2010. No additional benefits will accrue in these plans after December 31, 2009.
a/ Actuarial assumptions
To determine actuarial valuations, actuaries have determined general assumptions on a country-by-country basis and specific assumptions (rate of employee turnover, salary increases) company by company. The assumptions for 2009, 2008 and 2007 are as follows (the rates indicated are weighted average rates):
2009 2008 2007
Discount rate 5.41% 6.08% 6.04%
Future salary increases 3.52% 3.91% 3.83%
Expected long-term return on assets 6.69% 7.04% 7.39%
Post-retirement cost trend rate 6.40% to 5.90% 6.90% to 5.90% 7.70% to 5.90%

78
The above rates are broken down by geographical segment as follows for 2009, 2008 and 2007:
Discount rate Future salary
increases
Estimated long-term return
on assets
2009
France 5.00% 3.50% 5.40%
Belgium 5.00% 3.50% 4.00%
United Kingdom 5.75% 4.95% 5.93%
Germany 5.00% 3.00% 3.00%
Rest of Europe 4.45% 2.87% 4.19%
United States of America 5.48% 3.73% 6.96%
Other 5.24% 4.46% 3.96%
2008
France 5.25% 3.42% 5.40%
Belgium 5.25% 4.00% 5.30%
United Kingdom 6.00% 4.97% 6.67%
Germany 5.25% 3.00% 4.95%
Rest of Europe 4.77% 3.44% 5.10%
United States of America 6.21% 3.99% 7.25%
Other 5.19% 5.32% 4.30%
2007
France 5.20% 3.36% 5.40%
Belgium 5.20% 3.80% 5.30%
United Kingdom 5.50% 4.49% 6.75%
Germany 5.20% 2.75% 4.33%
Rest of Europe 4.71% 3.01% 4.96%
United States of America 6.19% 3.97% 7.62%
Other 4.69% 4.28% 4.21%
The discount rates are obtained by reference to market yields on high quality bonds (government and prime-rated corporations – AA or AAA) in each country having maturity dates equivalent to those of the plans.
For the euro Zone and United Kingdom the discount rates used are the Bloomberg Corporate AA yields and for the U.S. the Original CitiGroup pension discount yield curve was used. These references comply with IAS 19 requirements and have been retained consistently by us for years.
The returns on plan assets are determined plan by plan and depend upon the asset allocation of the investment portfolio and the expected future performance.
b/ Components of net periodic cost of post-employment benefit
(in millions of euros) 2009 2008 2007
Service cost (126) (126) (158)
Interest cost (1,510) (1,503) (1,575)
Expected return on plan assets 1,615 1,852 2,119
Amortization of prior service cost (3) (1) (4)
Effect of curtailments and settlements (79) (41) (12)
Management pension and Non represented healthcare plan amendment 253 65 258
NET PERIODIC BENEFIT (COST) 150 246 628
Of which:
• Recognized in Income (loss) from operating activities before restructuring costs, impairment of intangible assets, gain/(loss) on disposal of consolidated entities and post-retirement benefit plan amendments (129) (127) (162)
• Recognized in restructuring costs (79) (41) (12)
• Management pension and Non-represented healthcare plan amendment 253 65 258
• Recognized in other financial income (loss) 105 349 544

79
c/ Change in the obligation recorded in the statement of financial position
(in millions of euros) 2009 2008 2007
Change in benefit obligation
Benefit obligation at January 1 (25,498) (25,425) (30,230)
Service cost (126) (126) (158)
Interest cost (1,510) (1,503) (1,575)
Plan participants’ contributions (131) (133) (165)
Amendments 253 66 249
Business combinations (9) (4) (8)
Disposals - - -
Curtailments (13) (27) 27
Settlements 7 3 21
Special termination benefits (65) (14) (32)
Actuarial gains and (losses) (1,990) 365 1,135
Benefits paid 2,456 2,401 2,645
Medical Part D Subsidy (16) (30) (33)
Foreign currency translation and other 732 (1,071) 2,699
Benefit obligation at December 31 (25,910) (25,498) (25,425)
Benefit obligation excluding effect of future salary increases (25,639) (25,004) (24,927)
Effect of future salary increases (271) (494) (498)
Benefit obligation (25,910) (25,498) (25,425)
Pertaining to retirement plans (22,846) (22,310) (22,029)
Pertaining to post-employment medical care plans (3,064) (3,188) (3,396)
Change in plan assets
Fair value of plan assets at January 1 25,069 28,231 30,197
Expected return on plan assets 1,615 1,852 2,119
Actuarial gains and (losses) 1,033 (4,119) 1,072
Employers’ contributions 171 192 257
Plan participants’ contributions 131 133 165
Amendments - - (15)
Business combinations 27 2 -
Disposals - - -
Curtailments - - -
Settlements (4) (1) (16)
Benefits paid/Special termination benefits (2,388) (2,334) (2,580)
Foreign currency translation and other (729) 1,113 (2,968)
Fair value of plan assets at December 31 24,925 25,069 28,231
Present value of defined benefit obligations that are wholly or partly funded (24,379) (23,875) (23,635)
Fair value of plan assets 24,925 25,069 28,231
Funded status of defined benefit obligations that are wholly or partly funded 546 1,194 4,596
Present value of defined benefit obligations that are wholly unfunded (1,531) (1,623) (1,790)
Funded status (985) (429) 2,806
Unrecognized prior service cost - 1
Unrecognized surplus (due to application of asset ceiling and IFRIC14) (1,658) (2,080) (3,782)
NET AMOUNT RECOGNIZED (2,643) (2,509) (975)
Of which:
• prepaid pension costs 2,400 2,298 3,472
• pensions, retirement indemnities and other post-retirement benefit obligations (5,043) (4,807) (4,447)
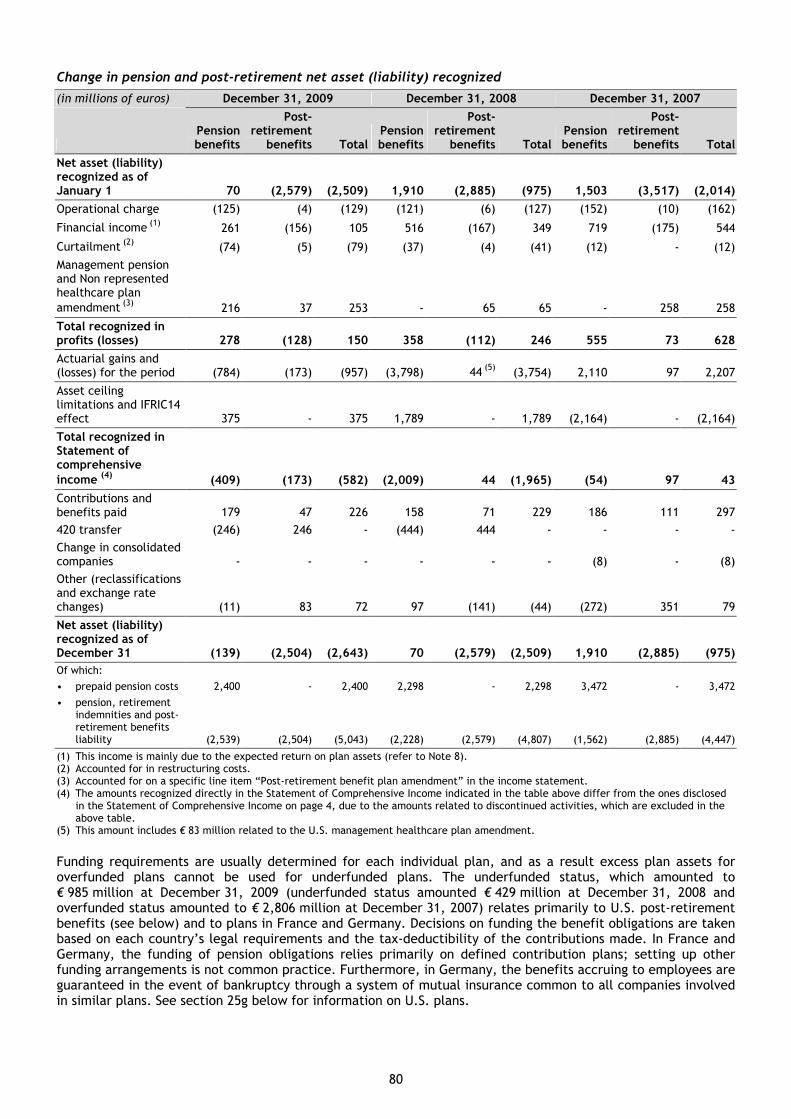
80
Change in pension and post-retirement net asset (liability) recognized
(in millions of euros) December 31, 2009 December 31, 2008 December 31, 2007
Pension benefits
Post-retirement
benefits Total Pension benefits
Post-retirement
benefits Total Pension benefits
Post-retirement
benefits Total
Net asset (liability) recognized as of January 1 70 (2,579) (2,509) 1,910 (2,885) (975) 1,503 (3,517) (2,014)
Operational charge (125) (4) (129) (121) (6) (127) (152) (10) (162)
Financial income (1) 261 (156) 105 516 (167) 349 719 (175) 544
Curtailment (2) (74) (5) (79) (37) (4) (41) (12) - (12)
Management pension and Non represented healthcare plan amendment (3) 216 37 253 - 65 65 - 258 258
Total recognized in profits (losses) 278 (128) 150 358 (112) 246 555 73 628
Actuarial gains and (losses) for the period (784) (173) (957) (3,798) 44 (5) (3,754) 2,110 97 2,207
Asset ceiling limitations and IFRIC14 effect 375 - 375 1,789 - 1,789 (2,164) - (2,164)
Total recognized in Statement of comprehensive income (4) (409) (173) (582) (2,009) 44 (1,965) (54) 97 43
Contributions and benefits paid 179 47 226 158 71 229 186 111 297
420 transfer (246) 246 - (444) 444 - - - -
Change in consolidated companies - - - - - - (8) - (8)
Other (reclassifications and exchange rate changes) (11) 83 72 97 (141) (44) (272) 351 79
Net asset (liability) recognized as of December 31 (139) (2,504) (2,643) 70 (2,579) (2,509) 1,910 (2,885) (975)
Of which:
• prepaid pension costs 2,400 - 2,400 2,298 - 2,298 3,472 - 3,472
• pension, retirement indemnities and post-retirement benefits liability (2,539) (2,504) (5,043) (2,228) (2,579) (4,807) (1,562) (2,885) (4,447)
(1) This income is mainly due to the expected return on plan assets (refer to Note 8). (2) Accounted for in restructuring costs. (3) Accounted for on a specific line item “Post-retirement benefit plan amendment” in the income statement. (4) The amounts recognized directly in the Statement of Comprehensive Income indicated in the table above differ from the ones disclosed
in the Statement of Comprehensive Income on page 4, due to the amounts related to discontinued activities, which are excluded in the above table.
(5) This amount includes € 83 million related to the U.S. management healthcare plan amendment.
Funding requirements are usually determined for each individual plan, and as a result excess plan assets for overfunded plans cannot be used for underfunded plans. The underfunded status, which amounted to € 985 million at December 31, 2009 (underfunded status amounted € 429 million at December 31, 2008 and overfunded status amounted to € 2,806 million at December 31, 2007) relates primarily to U.S. post-retirement benefits (see below) and to plans in France and Germany. Decisions on funding the benefit obligations are taken based on each country’s legal requirements and the tax-deductibility of the contributions made. In France and Germany, the funding of pension obligations relies primarily on defined contribution plans; setting up other funding arrangements is not common practice. Furthermore, in Germany, the benefits accruing to employees are guaranteed in the event of bankruptcy through a system of mutual insurance common to all companies involved in similar plans. See section 25g below for information on U.S. plans.

81
The benefit obligation, the fair value of the plan assets and the actuarial gains (losses) generated for the current year and the previous years are as follows:
Experience adjustments generated on the benefit
obligation
Experience adjustments generated on the plan
assets
(in millions of euros) Benefit
obligation Plan assets
Funded (unfunded)
status Amount
In percentage of the benefit
obligation Amount
In percentage of the plan
assets
2009 (25,910) 24,925 (985) (142) 0.55% 1,033 4.14%
2008 (25,498) 25,069 (429) 290 1.14% (4,119) 16.43%
2007 (25,425) 28,231 2,806 (166) 0.65% 1,072 3.80%
2006 (30,230) 30,197 (33) 21 0.07% 57 0.19%
2005 (3,503) 2,286 (1,217) 72 2.06% 111 4.86%
In respect of the medical care plans, a change of one percentage point in the assumed medical costs has the following impact:
(in millions of euros) Increase of 1% Decrease of 1%
Impact on the current service cost and interest costs (6) 5
Impact on the benefit obligation (92) 83
The plan assets of retirement plans are invested as follows:
(in millions of euros and percentage) Bonds Equity
securities
Private equity and
other Real estate Total
16,391 3,828 3,045 1,661 24,925 2009
66% 15% 12% 7% 100%
15,682 4,169 3,128 2,090 25,069 2008
63% 17% 12% 8% 100%
17,154 5,628 3,139 2,310 28,231 2007
61% 20% 11% 8% 100%
14,382 10,966 2,537 2,312 30,197 2006
48% 36% 8% 8% 100%
As part of the prudent management of its funds relative to the corresponding obligations, the Group reduced the exposure of its defined benefit pension plans to equity markets in November 2007. As of December 31, 2009, the global asset allocation of the Group’s plans was as follows: 15% in equity securities, 66% in bonds and 19% in alternatives (i.e., real estate, private equity and hedge funds). This compares to respectively 17%, 63% and 20% as of December 31, 2008 and respectively 20%, 61% and 19% as of December 31, 2007.
For historical Alcatel companies, the investment policy relating to plan assets within the Group depends upon local practices. In all cases, the proportion of equity securities cannot exceed 80% of plan assets and no individual equity security may represent more than 5% of total equity securities within the plan. The equity securities held by the plan must be listed on a recognized exchange. The bonds held by the plan must have a minimum “A” rating according to Standard & Poor’s or Moody’s rating criteria.
The contributions and benefits paid directly by the Group to retirees that are expected to be paid for 2010 are € 206 million for the pension and other post-retirement benefit plans.
Expected benefit payments made for beneficiaries from defined benefit plans through 2019 are as follows:
Total (in millions of euros)
Expected benefit
payments
2010 2,248
2011 2,149
2012 2,196
2013 2,041
2014 1,992
2015 - 2019 9,383

82
d/ Cumulative amounts for actuarial differences (before taxes) booked against the Consolidated Statements of Comprehensive income
(in millions of euros) 2009 2008 2007
Balance at January 1 (781) 2,973 766
Net actuarial (losses)/gains during the period (957) (3,754) 2,207
BALANCE AT DECEMBER 31 (1,738) (781) 2,973
e/ Funded status
(in millions of euros) December 31, 2009
December 31, 2008
December 31, 2007
Benefit obligation (25,910) (25,498) (25,425)
Fair value of plan assets 24,925 25,069 28,231
Funded status (985) (429) 2,806
Unrecognized prior service cost and surplus (due to application of asset ceiling and IFRIC14) (1,658) (2,080) (3,781)
NET AMOUNT RECOGNIZED (2,643) (2,509) (975)
f/ U.S. pension and healthcare plan amendments
2009 U.S. management pension plan amendment
On October 21, 2009, Alcatel-Lucent USA Inc. froze the US defined benefit management pension plan and the US Supplemental pension plan effective January 1, 2010. No additional benefits will accrue in these plans after December 31, 2009 for their 11,500 active U.S. – based participants who are not union-represented employees. As a result, a credit of € 216 million before tax is booked during the fourth quarter of 2009 in the “Post-retirement benefit plan amendments” line item of the income statement. Also effective on January 1, 2010, the company changed its defined contribution 401(k) savings plan to provide for the company to make the same level of matching contributions for all of its 15,000 U.S. – based employees who are not union-represented employees, which is expected to increase the company’s annual cash contributions by about € 22 million.
This amendment had no impact on deferred tax.
2009 U.S. management healthcare plan amendment
Following the 2008 Medicare Private Fee-For-Service election, Alcatel-Lucent USA Inc. amended the plan in the third quarter to increase the out-of-pocket maximums paid by Medicare eligible management participants and their Medicare eligible dependants beginning in 2010, which reduced the benefit obligation by about € 37 million. This impact is accounted for in the “Post-retirement benefit plan amendments” line item of the income statement.
This amendment had no impact on deferred tax.
In 2009, a € 6 million additional expense was recognized in the specific line item “Post-retirement benefit plan amendments” concerning the Raetsch case (see Note 34e).
Beginning of 2008 U.S. management healthcare plan amendment
On July 30, 2008, certain changes to Lucent’s management retiree healthcare benefits were approved by the board of Directors of Lucent Technologies Inc (now known as Alcatel-Lucent USA Inc.) and announced to retirees between August and the beginning of October. Effective January 1, 2009, postretirement medical benefits for Medicare eligible Management participants are provided through a fully insured Medicare Advantage Private Fee-For-Service (PFFS) Plan. Under this plan, the PFFS plan contracts directly with the Centers for Medicare & Medicaid Services to provide all Medicare Parts A and B benefits for Medicare eligible management retirees. These changes imply a € 148 million benefit obligation decrease for the management retiree healthcare plan. € 83 million of this decrease, which related to management employees who retired before March 1, 1990, was considered as a change of actuarial assumptions and was recognized in the statement of Comprehensive Income. € 65 million of this decrease, which related to management employees who retired on or after March 1, 1990 and who are subject to defined caps, was considered as a plan amendment and was recognized in the 2008 income statement in the specific line item "Post-retirement benefit plan amendments".

83
(In millions of euros)
Before amendment
Amendment effect for pre
March 1, 1990 retirees (1)
Amendment effect for post March 1, 1990
retirees (2) After
amendment Projected benefit obligation (529) 83 65 (381) Deferred taxes (33) (25) Net impact after deferred taxes 50 40
(1) Recognized in the statement of comprehensive income. (2) Recognized in the income statement.
In addition to the € 65 million income recognized in the specific line item “Post-retirement benefit plan amendments”, and € 18 million expense related to the Raetsch case (see Note 34e) was recognized in 2008, representing a net income of € 47 million.
2007 plan amendment
During June 2007, certain changes to Lucent’s management retiree healthcare benefits were approved. Effective January 1, 2008, prescription drug coverage offered to former Lucent management retirees was changed to a drug plan design similar to the Medicare Part D program. The impact of this change resulted in additional net income of € 77 million as summarized in the following table.
(in millions of euros) Before
amendment Amendment
effect After
amendment
Gross Projected Benefit Obligation (PBO) (1,106) 463 (643)
Part D subsidy (tax free) 205 (205) -
Net PBO (901) 258 (1) (643)
Deferred taxes (2) (181)
NET IMPACT AFTER DEFERRED TAXES 77
(1) Accounted for on a specific line item “Post-retirement benefit plan amendments” in the income statement. (2) Refer to Note 9.
g/ Alcatel-Lucent’s U.S. pension and post-retirement obligations
The following tables summarize changes in the benefit obligation, the plan assets and the funded status of Alcatel-Lucent’s U.S. pension and post-retirement benefit plans as well as the components of net periodic benefit costs, including key assumptions. The measurement dates for plan assets and obligations were December 31, 2009 and December 31, 2008. In addition, interim measurements were made to the major plans as of March 31, June 30, and September 30, to reflect the funded status of those plans in the financial statements at the end of those periods. These interim measurements impact the pension and post-retirement cost for the immediately succeeding period. All these data are included in the figures presented on a consolidated basis in Notes 25b, c, d and e).
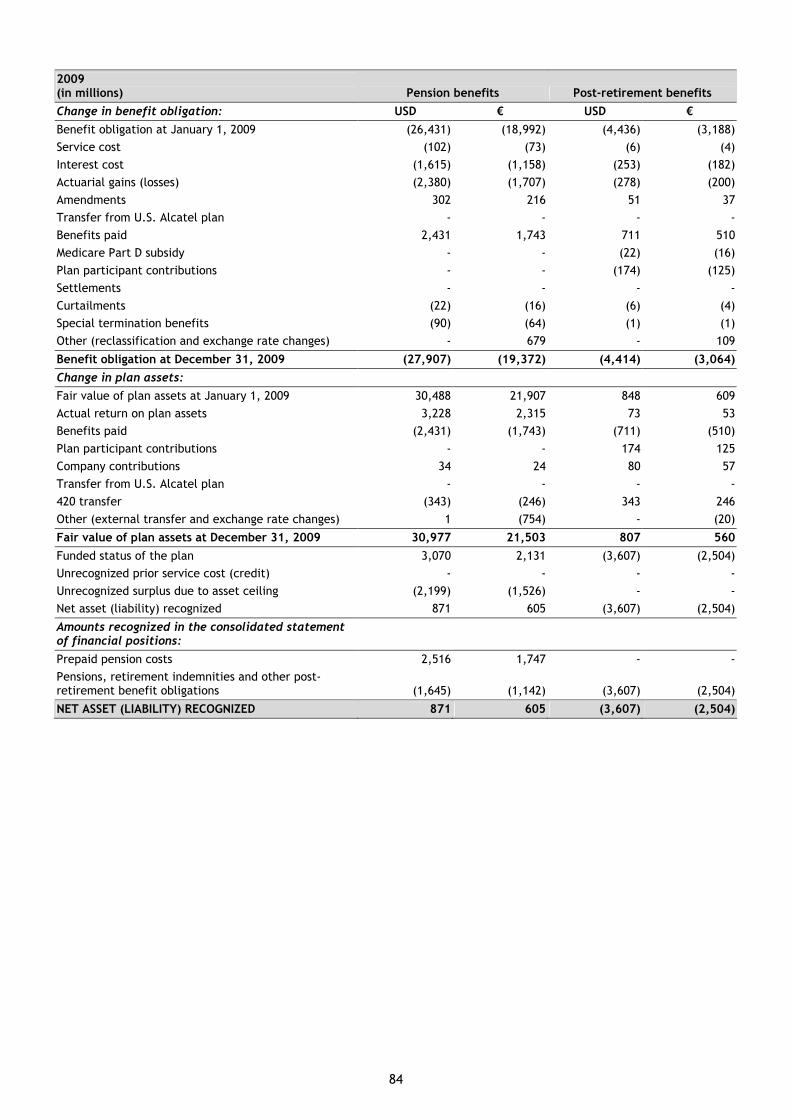
84
2009 (in millions) Pension benefits Post-retirement benefits
Change in benefit obligation: USD € USD €
Benefit obligation at January 1, 2009 (26,431) (18,992) (4,436) (3,188)
Service cost (102) (73) (6) (4)
Interest cost (1,615) (1,158) (253) (182)
Actuarial gains (losses) (2,380) (1,707) (278) (200)
Amendments 302 216 51 37
Transfer from U.S. Alcatel plan - - - -
Benefits paid 2,431 1,743 711 510
Medicare Part D subsidy - - (22) (16)
Plan participant contributions - - (174) (125)
Settlements - - - -
Curtailments (22) (16) (6) (4)
Special termination benefits (90) (64) (1) (1)
Other (reclassification and exchange rate changes) - 679 - 109
Benefit obligation at December 31, 2009 (27,907) (19,372) (4,414) (3,064)
Change in plan assets:
Fair value of plan assets at January 1, 2009 30,488 21,907 848 609
Actual return on plan assets 3,228 2,315 73 53
Benefits paid (2,431) (1,743) (711) (510)
Plan participant contributions - - 174 125
Company contributions 34 24 80 57
Transfer from U.S. Alcatel plan - - - -
420 transfer (343) (246) 343 246
Other (external transfer and exchange rate changes) 1 (754) - (20)
Fair value of plan assets at December 31, 2009 30,977 21,503 807 560
Funded status of the plan 3,070 2,131 (3,607) (2,504)
Unrecognized prior service cost (credit) - - - -
Unrecognized surplus due to asset ceiling (2,199) (1,526) - -
Net asset (liability) recognized 871 605 (3,607) (2,504)
Amounts recognized in the consolidated statement of financial positions:
Prepaid pension costs 2,516 1,747 - -
Pensions, retirement indemnities and other post-retirement benefit obligations (1,645) (1,142) (3,607) (2,504)
NET ASSET (LIABILITY) RECOGNIZED 871 605 (3,607) (2,504)

85
2008 (in millions) Pension benefits Post-retirement benefits
Change in benefit obligation: USD € USD €
Benefit obligation at January 1, 2008 (27,296) (18,542) (4,981) (3,384)
Service cost (101) (69) (8) (5)
Interest cost (1,673) (1,137) (289) (196)
Actuarial gains (losses) 278 189 209 142
Amendments - - 96 65
Transfer from U.S. Alcatel plan (21) (14) (17) (12)
Benefits paid 2,451 1,666 791 538
Medicare Part D subsidy - - (45) (31)
Plan participant contributions - - (186) (126)
Settlements - - - -
Curtailments (49) (33) (5) (3)
Special termination benefits (20) (14) (1) (1)
Other (reclassification and exchange rate changes) - (1,038) - (175)
Benefit obligation at December 31, 2008 (26,431) (18,992) (4,436) (3,188)
Change in plan assets:
Fair value of plan assets at January 1, 2008 36,275 24,642 753 511
Actual return on plan assets (2,720) (1,849) (102) (69)
Benefits paid (2,451) (1,666) (791) (538)
Plan participant contributions - - 186 126
Company contributions 36 24 149 101
Transfer from U.S. Alcatel plan 4 3 - -
420 transfer (653) (444) 653 444
Other (external transfer and exchange rate changes) (3) 1,197 - 34
Fair value of plan assets at December 31, 2008 30,488 21,907 848 609
Funded status of the plan 4,057 2,915 (3,588) (2,579)
Unrecognized prior service cost (credit) - - - -
Unrecognized surplus due to asset ceiling (2,724) (1,957) - -
Net asset (liability) recognized 1,333 958 (3,588) (2,579)
Amounts recognized in the consolidated statement of financial positions:
Prepaid pension costs 2,494 1,792 - -
Pensions, retirement indemnities and other post-retirement benefit obligations (1,161) (834) (3,588) (2,579)
NET ASSET (LIABILITY) RECOGNIZED 1,333 958 (3,588) (2,579)
Additional Information
December 31, 2009 (in millions) Pension benefits Post-retirement benefits
Benefit obligation by major plans: USD € USD €
U.S. management (17,044) (11,831) - -
U.S. occupational (10,446) (7,251) - -
Supplemental (395) (274) - -
Non-represented health - - (458) (318)
Formerly represented health - - (2,508) (1,741)
Group life and other (22) (16) (1,448) (1,005)
Benefit obligation at end of year (27,907) (19,372) (4,414) (3,064)
Plan assets by major plans:
U.S. management 15,812 10,976 - -
U.S. occupational 15,161 10,524 - -
Supplemental - - - -
Formerly represented health - - 338 235
Group life and other 4 3 469 325
Fair value of plan assets at end of year 30,977 21,503 807 560

86
December 31, 2008 (in millions) Pension benefits Post-retirement benefits
Benefit obligation by major plans: USD € USD €
U.S. management (16,130) (11,590) -, -
U.S. occupational (9,903) (7,116) - -
Supplemental (378) (272) - -
Non-represented health - - (558) (401)
Formerly represented health - - (2,437) (1,752)
Group life and other (20) (14) (1,441) (1,035)
Benefit obligation at end of year (26,431) (18,992) (4,436) (3,188)
Plan assets by major plans:
U.S. management 15,363 11,039 - -
U.S. occupational 15,122 10,866 - -
Supplemental - - - -
Formerly represented health - - 379 272
Group life and other 3 2 469 337
Fair value of plan assets at end of year 30,488 21,907 848 609
Components of Net Periodic Benefit (Cost)
2009 (in millions) Pension benefits Post-retirement benefits
Pension credit/post-retirement benefit (cost): USD € USD €
Service cost (102) (73) (6) (4)
Interest cost on benefit obligation (1,614) (1,158) (254) (182)
Expected return on plan assets 2,058 1,476 36 26
Amortization of unrecognized prior service costs (1) (1) - -
Subtotal 341 244 (224) (160)
Special termination benefits (90) (64) (1) (1)
Curtailments (22) (16) (5) (4)
Settlements - - - -
Pension credit/post-retirement benefit (cost) 229 164 (230) (165)
U.S. Pension/healthcare plan amendment 302 217 51 37
PENSION CREDIT/POST-RETIREMENT BENEFIT (COST) 531 381 (179) (128)
2008 (in millions) Pension benefits Post-retirement benefits
Pension credit/post-retirement benefit (cost): USD € USD €
Service cost (101) (69) (8) (5)
Interest cost on benefit obligation (1,673) (1,137) (289) (197)
Expected return on plan assets 2,442 1,660 43 29
Amortization of unrecognized prior service costs - - - -
Subtotal 668 454 (254) (173)
Special termination benefits (20) (14) (1) (1)
Curtailments (49) (33) (5) (3)
Settlements - - - -
Pension credit/post-retirement benefit (cost) 599 407 (260) (177)
U.S. healthcare plan amendment - - 96 65
PENSION CREDIT/POST-RETIREMENT BENEFIT (COST) 599 407 (164) (112)

87
Key assumptions
Assumptions used to determine: December 2009 December 2008
Benefit obligations – discount rate
Pension 5.54% 6.22%
Post-retirement health care and other 4.93% 6.16%
Post-retirement life 5.75% 6.16%
Rate of compensation increase 3.84% 3.96%
Net benefit cost or credit – discount rate
Pension 6.14% 6.71%
Post-retirement health care and other 5.80% 6.41%
Post- retirement life 6.20% 6.79%
Expected return on plan assets
Pension 7.00% 7.27%
Post-retirement health care and other 2.39% 4.20%
Post-retirement life 6.67% 6.95%
The weighted average expected rate of return on plan assets that will be used to determine the calendar 2010 net periodic benefit cost is 6.88% for pensions, 2.68% for post-retirement health care benefits and 6.23% for post-retirement life insurance benefits.
December 31, 2009
December 31, 2008
Assumed health care cost trend rates
Health care cost trend rate assumed for next year 6.40% 6.90%
Health care cost trend rate assumed for next year (excluding post-retirement dental benefits) 6.50% 7.00%
Rate that the cost trend rate gradually declines to 5.90% 5.90%
Year that the rate reaches the rate it is assumed to remain at 2013 2012
The assumed health care cost trend rate has a significant effect on the amounts reported. A one-percentage-point change in the assumed health care cost trend rate would have the following effects:
(in millions of U.S. dollars) 1 percentage point
Increase Decrease
Effect on total of service and interest cost components (8) 7
Effect on post-retirement benefit obligation (133) 120
Alcatel-Lucent uses the Original CitiGroup Pension Discount Curve to develop discount rates. The benefit obligation cash flows are matched with the corresponding Original CitiGroup Pension Discount Curve duration to develop a single discount rate which produces the same present value as produced by the Original CitiGroup yield curve. Rates are developed distinctly for each major plan; some very small plans are grouped for this process. The average duration of Alcatel-Lucent major pension obligations and post-retirement health care obligations were 9.59 years and 6.07 years, respectively, as of December 31, 2009 (9.31 years and 5.92 years, respectively, as of December 31, 2008).
Alcatel-Lucent considered several factors in developing its expected rate of return on plan assets, including its historical returns and input from its external advisors. Individual asset class return forecasts were developed based upon current market conditions, for example, price-earnings levels and yields and long-term growth expectations. The expected long-term rate of return is the weighted average of the target asset allocation of each individual asset class. Alcatel-Lucent’s long-term expected rate of return on plan assets included an anticipated premium over projected market returns received from its external advisors of 7.47% for its management plan and 5.75 % for its occupational plan as of December 31, 2009 (7.63% for its management plan and 6.04% for its occupational plan as of December 31, 2008). Its actual 10-year annual rate of return on pension plan assets was 5.64 % for the year ending December 31, 2009 (6.57% for the year ending December 31, 2008).
The mortality assumption for Alcatel-Lucent’s U.S. plans is based on actual recent experience of the participants in our management pension plan and our occupational pension plans. For the 2009 year-end valuation, we updated the mortality assumptions, again based on the actual experience of the two plans. This update had a $ 464 million negative effect on the benefit obligation of the Management Pension Plan and a $ 100 million negative effect on the benefit obligation of the Occupational Pension Plans. This effect is recognized in the comprehensive income.

88
Plan Assets
The following table summarizes the target asset allocation ranges and our actual allocation of our pension and post-retirement trusts by asset category.
Pension target
allocation range Percentage of
pension plan assets Post-retirement target allocation
Percentage of post-retirement plan
assets
December 31, 2009
Asset category
Equity securities 12%-19% 15% 28% 28%
Fixed income securities 59%-80% 68% 40% 40%
Real estate 4%-8% 6% - -
Private equity and other 6%-12% 11% - -
Cash - - 32% 32%
TOTAL 100% 100%
December 31, 2008
Asset category
Equity securities 16%-30% 17% 27% 24%
Fixed income securities 54%-70% 64% 41% 44%
Real estate 4%-8% 8%
Private equity and other 6%-12% 11%
Cash - 32% 32%
TOTAL 100% 100%
The majority of Alcatel-Lucent’s U.S. pension plan assets are held in a master pension trust. Alcatel-Lucent’s U.S. post-retirement plan assets are held in two separate trusts in addition to the amount set aside in the master pension trust for retiree healthcare. Plan assets are managed by independent investment advisors with the objective of maximizing surplus returns with a prudent level of surplus risk. Alcatel-Lucent periodically completes asset-liability studies to assure that the optimal asset allocation is maintained in order to meet future benefit obligations. The Board of Directors formally approves the target allocation ranges every two to three years upon completion of a study by the external advisors and internal investment management. During the fourth quarter of 2007, the allocation of the U.S. pension plan assets was changed as part of a routine periodic review. The overall pension plan asset portfolio now reflects a balance of investments split about 37.5/62.5 between equity (which includes alternative investments for this purpose) and fixed income securities compared to the previous split of about 50/50 between equity and fixed income. Alcatel-Lucent believes this action was prudent given the demographics, funded status and future obligations for its pension plans. Investment advisors managing plan assets may use derivative financial instruments including futures contracts, forward contracts, options and interest rate swaps to manage market risk.
Pension plan assets included $ 0.2 million of Alcatel-Lucent ADSs (American Depository Shares) as of December 31, 2009 ($ 0.0 million and $ 0.4 million of Alcatel-Lucent ADSs as of December 31, 2008 and December 31, 2007, respectively).
Contributions
Alcatel-Lucent contributes to its pension and post-retirement benefit plans to make benefit payments to plan participants and to pre-fund some benefits by means of trust funds. For Alcatel-Lucent’s U.S. pension plans, the funding policy is to contribute amounts to the trusts sufficient to meet minimum funding requirements as set forth in employee benefit and tax laws plus such additional amounts as Alcatel-Lucent may determine to be appropriate. Contributions are made to benefit plans for the sole benefit of plan participants.
On December 27, 2006, Alcatel-Lucent made a Section 420 “collectively bargained transfer” of excess pension assets from the occupational pension plan in the amount of $ 504 million to fund healthcare benefits for formerly represented retirees for the period beginning October 1, 2006 through December 31, 2007. On December 29, 2008, Alcatel-Lucent made a Section 420 “collectively bargained transfer” of excess pension assets from the occupational pension plan in the amount of $ 653 million to fund healthcare benefits for formerly represented retirees for the period beginning January 1, 2008 through about September 30, 2009. On November 2, 2009, made a Section 420 “collectively bargained transfer” of excess pension assets from the occupational pension plan in the amount of $ 343 million to fund healthcare benefits for formerly represented retirees for the period beginning October 1, 2009 through about September 30, 2010. Alcatel-Lucent expects to make another “collectively bargained” transfer during 2010 to fund healthcare benefits for formerly represented retirees for the remainder of 2010 through the first nine months of 2011.

89
The following table summarizes expected contributions (net of Medicare Part D subsidies) to its various pension and post-retirement plans through calendar 2019. Alcatel-Lucent does not have to make contributions to its qualified U.S. pension plans during calendar 2010, and does not expect to make any during 2011. Alcatel-Lucent is unable to estimate the expected contributions to its qualified U.S. pension plans beyond calendar 2011. Actual contributions may differ from expected contributions, due to various factors, including performance of plan assets, interest rates and potential legislative changes. The table below reflects the use of excess pension assets to fund 2010 healthcare costs for formerly represented retirees.
(in millions of U.S. dollars) Pension Post-retirement
Non-qualified pension plans
Formerly represented
retiree health plans
Non-represented
retiree health plans
Other benefit plans
2010 33 (8) 59 8
2011 32 321 56 7
2012 32 457 52 7
2013 32 233 48 37
2014 32 224 43 52
2015 - 19 154 882 172 258
Benefit Payments
The following table summarizes expected benefit payments from Lucent’s various pension and post-retirement plans through calendar 2019. Actual benefit payments may differ from expected benefit payments. These amounts are reflected net of expected plan participant contributions and the annual Medicare Part D subsidy of approximately $ 35 million.
(in millions of U.S. dollars) Pension Post-retirement
Qualified U.S.
management pension
plans
Qualified U.S.
occupational pension
plans
Non-qualified pension
plans
Formerly represented
retiree health plans
Non-represented
retiree health plans
Other benefit
plans
2010 1,360 1,092 33 330 59 88
2011 1,342 979 32 321 56 90
2012 1,329 953 32 457 52 92
2013 1,315 927 32 233 48 94
2014 1,300 899 32 224 43 95
2015 - 19 6,239 4,040 154 882 172 496
The actuarial assumptions used to determine if pension plan funding is required are specified by the Pension Protection Act of 2006 (PPA) as modified by the Worker, Retiree and Employer Recovery Act of 2008 (WRER). These bills allow a pension plan sponsor to choose among a limited set of options for ascertaining the plan asset and obligation values used to determine funding requirements. Certain of these actuarial assumptions differ from those used for accounting purposes in a way that becomes significant in volatile markets. While the basis of developing discount rates in both cases are corporate bond yields, for accounting purposes we use a yield curve developed by CitiGroup as of the close of the last business day of December, whereas the PPA allows either a daily average yield curve for the month of December or a two-year average yield curve. Also, available fair value of assets as of the close of the last business day of December must be used for accounting purposes, but the PPA and the WRER provide for “asset smoothing” options that average fair values over periods as long as two years with limited expected returns being included in the averaging. Both of these sets of options minimize the impact of sharp changes in asset values and corporate bond yields in volatile markets. Corporate bond yields dropped sharply during the last two weeks of December 2008, which resulted in a financial reporting discount rate that is significantly (more than 70 basis points) lower than the one used for regulatory funding valuation. A preliminary evaluation of the funded status of the U.S. Management Pension Plan for regulatory funding valuation purposes indicates that this plan is over 100% funded at year end. On the other hand, this plan was underfunded by U.S. $ 1,232 million on December 31, 2009 for accounting purposes (refer to Note 25 g). In addition, under the PPA transition target rules, we would only need to fund this plan if the funded ratio were to decline below 96%. We see little probability of contributions being required for that plan through 2010. Although certain data such as the December 31, 2009 private equity and real estate values and the January 1, 2010 census data will not be final until the second quarter of 2010, we do not expect any contributions being required though 2010.

90
NOTE 26 FINANCIAL DEBT
a/ Analysis of financial debt, net
(in millions of euros) 2009 2008 2007
Marketable securities – short term, net 1,993 906 894
Cash and cash equivalents 3,577 3,687 4,377
Cash, cash equivalents and marketable securities 5,570 4,593 5,271
(Convertible and other bonds – long-term portion) (4,084) (3,931) (4,517)
(Other long-term debt) (95) (67) (48)
(Current portion of long-term debt and short-term debt) (576) (1,097) (483)
(Financial debt, gross) (4,755) (5,095) (5,048)
Derivative interest rate instruments – other current and non-current assets 44 72 19
Derivative interest rate instruments – other current and non-current liabilities (1) (1) (16)
Loan to joint venture - Financial assets (loan to co-venturer and receivable on disposal of Dunker Motoren) 28 42 45
CASH (FINANCIAL DEBT), NET 886 (389) 271
b/ Analysis of financial debt, gross - by type
(in millions of euros) 2009 2008 2007
Convertible bonds 2,924 2,387 2,273
Other bonds 1,521 2,320 2,381
Bank loans, overdrafts and other financial debt 145 254 237
Commercial paper 0 - 18
Finance lease obligations 58 - -
Accrued interest 107 134 139
FINANCIAL DEBT, GROSS 4,755 5,095 5,048

91
c/ Bonds
Balances at December 31, 2008 and at December 31, 2009:
Remaining amounts to be reimbursed (in millions of euros)
December 31, 2008
Currency translation
impact Other changes
during 2009 December 31, 2009
Issued by Alcatel-Lucent:
OCEANE 5.00% - € 1,000 million (5) due January 2015 (2) - - 1,000 1,000
4.375% – € 777 million due February 2009 (1) 777 - (777) -
OCEANE 4,75% – € 818 million (5) due January 2011 (1) 1,022 - (204) 818
6.375% – € 462 million (5) due April 2014 (1) 462 - - 462
Issued by Lucent:
7.75% – U.S. $ 931 million (5) due March 2017 (2) 768 (24) (73) 671
2.875% – U.S. $ 530 million (5) Series A due
June 2023 (2) (3) (4) 555 (19) (167) 369
2.875% – U.S. $ 881 million (5) Series B due
June 2025 (2) (3) 661 (23) - 638
6.50% – U.S. $ 300 million (5) due January 2028 194 (7) - 187
6.45% – U.S. $ 1,360 million (5) due March 2029 879 (29) - 850
SUBTOTAL 5,318 (102) (221) 4,995
Equity component and issuing fees of Oceane 2015 issued by Alcatel-Lucent - - (211) (211)
Equity component and issuing fees of Oceane 2011 issued by Alcatel (56) - 33 (23)
Equity component of Lucent’s 2.875% Series A convertible debentures (4) (208) 7 194 (7)
Equity component of convertible bonds issued by Lucent (382) 12 29 (341)
Fair value of interest rate instruments relating to bonds and expenses included in the calculation of the effective interest rate 35 - (3) 32
CARRYING AMOUNT OF BONDS 4,707 (83) (179) 4,445
(1) Benefit from a full and unconditional subordinated guaranty from Lucent Technologies Inc. (now known as Alcatel-Lucent USA Inc.). (2) See Note 24 for details of put and call conditions. (3) Benefit from a full and unconditional subordinated guaranty from Alcatel-Lucent SA. (4) Due to the change of estimated cash flows related to the 2.875 % Series A debentures, the carrying value of this bond was increased by
US$ 233 million with a corresponding “other financial loss” as disclosed in Note 8. Refer to additional comments in Notes 2j and 24. (5) Face amounts outstanding as at December 31, 2009.
Changes in 2009:
• Issuance of new debt:
Alcatel-Lucent issued a 5.00% bond convertible into/or exchangeable for new or existing Alcatel-Lucent shares due January 1, 2015 for a nominal value of €1,000 million.
The carrying value of the debt component at the date of issuance was valued at € 779 million. The difference between the nominal value and the carrying value of the debt component at the date of issuance, that means € 221 million, is amortized in finance costs over the life of the debt. • Repurchases (redemption before maturity date):
Lucent convertible bond 7.75% US$ due March 2017 was subject to partial buy-back and cancellation in Q1 2009, using US$ 28 million in cash, corresponding to a nominal value of US$ 99 million.
Lucent convertible bond 2.875% US$ Series A was subject to partial buy-back and cancellation in the third quarter of 2009, using US$ 25 million in cash excluding accrued interests, corresponding to a nominal value of US$ 25 million and in the fourth quarter of 2009, using US$ 193 million in cash excluding accrued interests, corresponding to a nominal value of US$ 195 million.
Alcatel Oceane 4.75 % due January 2011 was subject to partial buy-back and cancellation in the third quarter of 2009, using € 167 million in cash excluding accrued interests, corresponding to a nominal value of € 167 million

92
and in the fourth quarter of 2009, using € 37 million in cash excluding accrued interests, corresponding to a nominal value of € 37 million.
Nominal value repurchased:
Lucent convertible bond 7.75% US$ due March 2017: US$ 99,000,000
Lucent convertible bond 2.875% US$ Series A: US$ 220,000,000
Alcatel Oceane 4.75 % due January 2011: € 204,308,743
The consideration paid in connection with an early redemption of a convertible bond is allocated at the date of redemption between the liability and the equity components with an allocation method consistent with the method used initially. The amount of gain or loss relating to the liability component is recognized in “other financial income (loss)” and the amount of consideration relating to the equity component is recognized in equity.
A gain of € 50 million related to these repurchases was recorded in other financial income (loss) in Q1 2009, a loss of € 1 million in Q3 2009 and a loss of € 2 million during the fourth quarter 2009 (see Note 8).
• Repayments:
Alcatel-Lucent’s 4.375% EUR bond due February 2009 was repaid in February 2009 for a nominal value of € 777 million.
Changes in 2008:
• Repurchases (redemption before maturity date):
Certain bonds were subject to buy-back and cancellation in 2008, using € 27 million and US$ 23 million in cash, corresponding to a nominal value of € 28 million and US$ 72 million, detailed as follows:
Nominal value repurchased:
Lucent convertible bond 7.75% USD due March 2017: U.S. $ 72,229,000.
Alcatel-Lucent 4.375% EUR due February 2009: € 27,801,000.
The consideration paid in connection with an early redemption of a convertible bond is allocated at the date of redemption between the liability and the equity components with an allocation method consistent with the method used initially. The amount of gain or loss relating to the liability component is recognized in “other financial income (loss)” and the amount of consideration relating to the equity component is recognized in shareholders’ equity.
For straight bonds, the difference between the repurchased amount and the nominal value is included in financial income (loss) in other financial income (loss), net.
The gains related to these repurchases were respectively € 1 million and € 30 million for the Alcatel-Lucent 4.375% bond and the Lucent 7.75% bond representing a total gain of € 31 million in other financial income (loss), net (see Note 8).
• Repayments:
Lucent’s 5.50% USD bond was repaid in November 2008 for a nominal value of € 137 million.
Changes in 2007:
• Repurchases (redemption before maturity date):
Lucent’s 8% convertible debentures were redeemed in March 2007, for an aggregate amount of U.S. $ 486.5 million corresponding to the nominal value:
Nominal value repurchased:
Lucent’s 8% convertible: U.S. $ 486,545,000.
A financial loss of € 12 million was accounted for in connection with this early redemption.
For more information on the accounting treatment, refer to Note 8.
• Repayments:
Historical Alcatel’s 5.625% EUR bond was repaid in March 2007 for a residual nominal value of € 154 million.
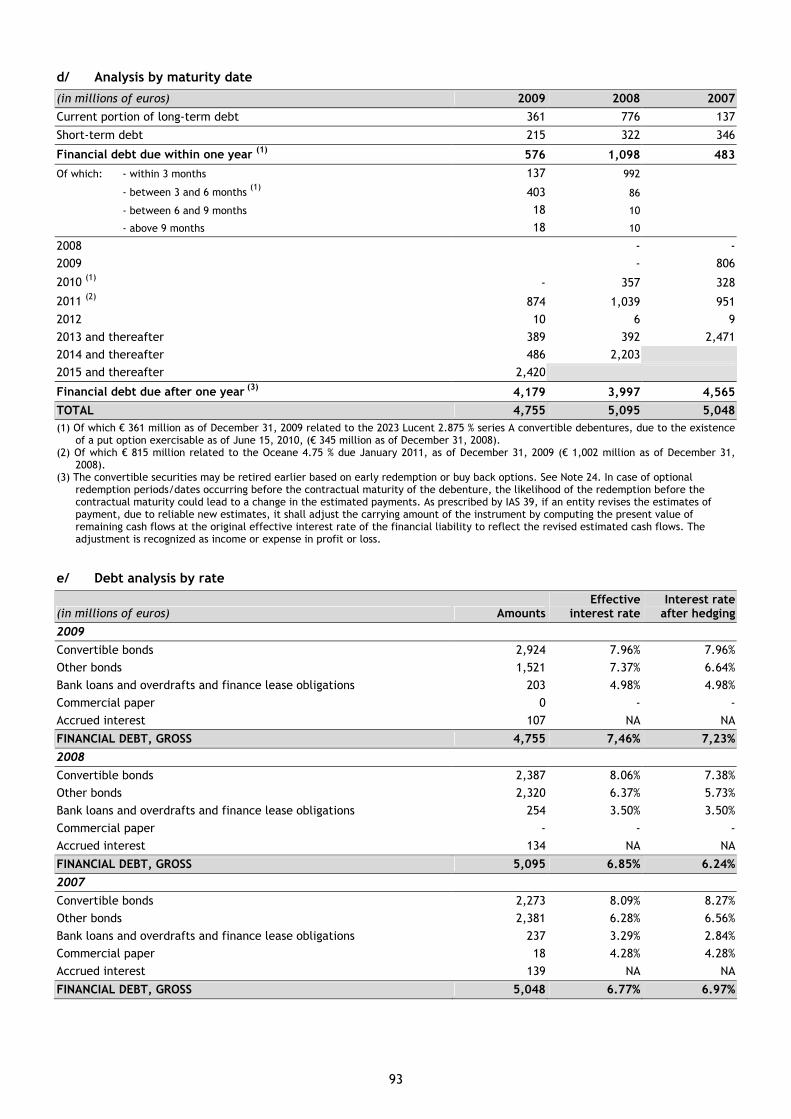
93
d/ Analysis by maturity date
(in millions of euros) 2009 2008 2007
Current portion of long-term debt 361 776 137
Short-term debt 215 322 346
Financial debt due within one year (1) 576 1,098 483
Of which: - within 3 months 137 992
- between 3 and 6 months (1)
403 86
- between 6 and 9 months 18 10
- above 9 months 18 10
2008 - -
2009 - 806
2010 (1) - 357 328
2011 (2) 874 1,039 951
2012 10 6 9
2013 and thereafter 389 392 2,471
2014 and thereafter 486 2,203
2015 and thereafter 2,420
Financial debt due after one year (3) 4,179 3,997 4,565
TOTAL 4,755 5,095 5,048
(1) Of which € 361 million as of December 31, 2009 related to the 2023 Lucent 2.875 % series A convertible debentures, due to the existence of a put option exercisable as of June 15, 2010, (€ 345 million as of December 31, 2008).
(2) Of which € 815 million related to the Oceane 4.75 % due January 2011, as of December 31, 2009 (€ 1,002 million as of December 31, 2008).
(3) The convertible securities may be retired earlier based on early redemption or buy back options. See Note 24. In case of optional redemption periods/dates occurring before the contractual maturity of the debenture, the likelihood of the redemption before the contractual maturity could lead to a change in the estimated payments. As prescribed by IAS 39, if an entity revises the estimates of payment, due to reliable new estimates, it shall adjust the carrying amount of the instrument by computing the present value of remaining cash flows at the original effective interest rate of the financial liability to reflect the revised estimated cash flows. The adjustment is recognized as income or expense in profit or loss.
e/ Debt analysis by rate
(in millions of euros) Amounts Effective
interest rate Interest rate
after hedging
2009
Convertible bonds 2,924 7.96% 7.96%
Other bonds 1,521 7.37% 6.64%
Bank loans and overdrafts and finance lease obligations 203 4.98% 4.98%
Commercial paper 0 - -
Accrued interest 107 NA NA
FINANCIAL DEBT, GROSS 4,755 7,46% 7,23%
2008
Convertible bonds 2,387 8.06% 7.38%
Other bonds 2,320 6.37% 5.73%
Bank loans and overdrafts and finance lease obligations 254 3.50% 3.50%
Commercial paper - - -
Accrued interest 134 NA NA
FINANCIAL DEBT, GROSS 5,095 6.85% 6.24%
2007
Convertible bonds 2,273 8.09% 8.27%
Other bonds 2,381 6.28% 6.56%
Bank loans and overdrafts and finance lease obligations 237 3.29% 2.84%
Commercial paper 18 4.28% 4.28%
Accrued interest 139 NA NA
FINANCIAL DEBT, GROSS 5,048 6.77% 6.97%
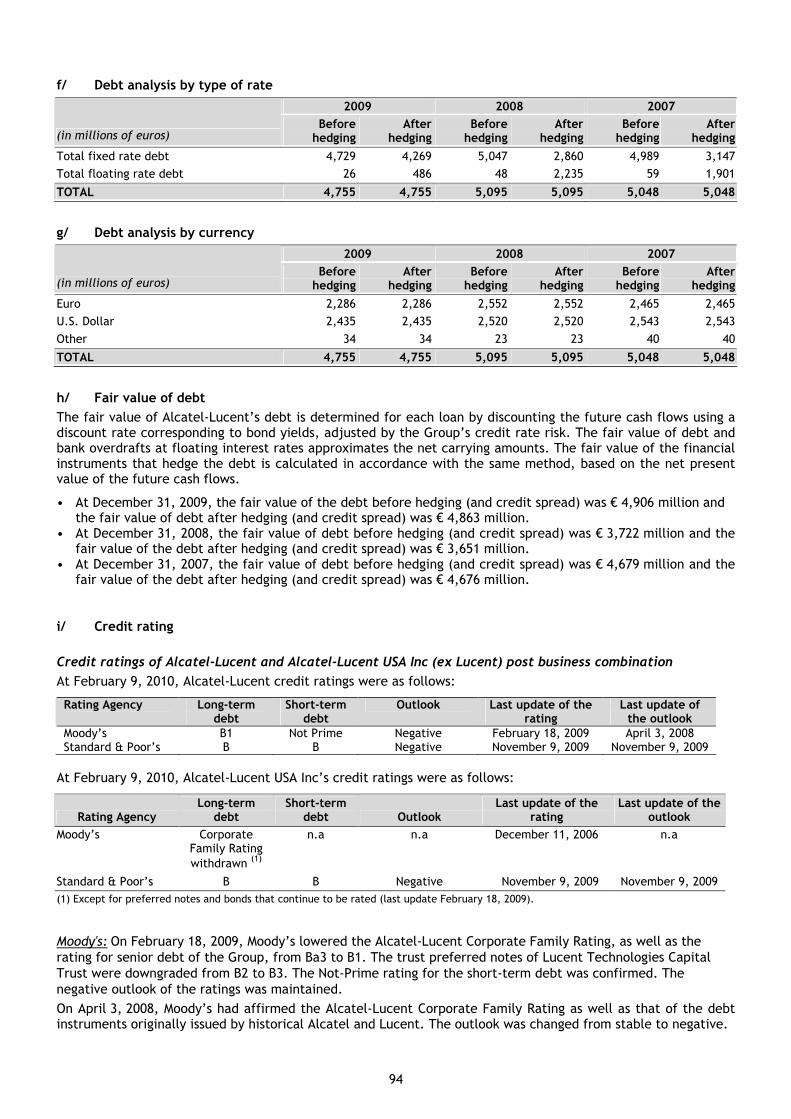
94
f/ Debt analysis by type of rate
2009 2008 2007
(in millions of euros) Before
hedging After
hedging Before
hedging After
hedging Before
hedging After
hedging
Total fixed rate debt 4,729 4,269 5,047 2,860 4,989 3,147
Total floating rate debt 26 486 48 2,235 59 1,901
TOTAL 4,755 4,755 5,095 5,095 5,048 5,048
g/ Debt analysis by currency
2009 2008 2007
(in millions of euros) Before
hedging After
hedging Before
hedging After
hedging Before
hedging After
hedging
Euro 2,286 2,286 2,552 2,552 2,465 2,465
U.S. Dollar 2,435 2,435 2,520 2,520 2,543 2,543
Other 34 34 23 23 40 40
TOTAL 4,755 4,755 5,095 5,095 5,048 5,048
h/ Fair value of debt
The fair value of Alcatel-Lucent’s debt is determined for each loan by discounting the future cash flows using a discount rate corresponding to bond yields, adjusted by the Group’s credit rate risk. The fair value of debt and bank overdrafts at floating interest rates approximates the net carrying amounts. The fair value of the financial instruments that hedge the debt is calculated in accordance with the same method, based on the net present value of the future cash flows.
• At December 31, 2009, the fair value of the debt before hedging (and credit spread) was € 4,906 million and the fair value of debt after hedging (and credit spread) was € 4,863 million.
• At December 31, 2008, the fair value of debt before hedging (and credit spread) was € 3,722 million and the fair value of the debt after hedging (and credit spread) was € 3,651 million.
• At December 31, 2007, the fair value of debt before hedging (and credit spread) was € 4,679 million and the fair value of the debt after hedging (and credit spread) was € 4,676 million.
i/ Credit rating
Credit ratings of Alcatel-Lucent and Alcatel-Lucent USA Inc (ex Lucent) post business combination
At February 9, 2010, Alcatel-Lucent credit ratings were as follows:
Rating Agency Long-term debt
Short-term debt
Outlook Last update of the rating
Last update of the outlook
Moody’s B1 Not Prime Negative February 18, 2009 April 3, 2008 Standard & Poor’s B B Negative November 9, 2009 November 9, 2009
At February 9, 2010, Alcatel-Lucent USA Inc’s credit ratings were as follows:
Rating Agency Long-term
debt Short-term
debt Outlook Last update of the
rating Last update of the
outlook
Moody’s Corporate Family Rating withdrawn (1)
n.a n.a December 11, 2006 n.a
Standard & Poor’s B B Negative November 9, 2009 November 9, 2009
(1) Except for preferred notes and bonds that continue to be rated (last update February 18, 2009).
Moody's: On February 18, 2009, Moody’s lowered the Alcatel-Lucent Corporate Family Rating, as well as the rating for senior debt of the Group, from Ba3 to B1. The trust preferred notes of Lucent Technologies Capital Trust were downgraded from B2 to B3. The Not-Prime rating for the short-term debt was confirmed. The negative outlook of the ratings was maintained.
On April 3, 2008, Moody’s had affirmed the Alcatel-Lucent Corporate Family Rating as well as that of the debt instruments originally issued by historical Alcatel and Lucent. The outlook was changed from stable to negative.

95
The rating grid of Moody’s ranges from AAA to C, which is the lowest rated class. Our B1 rating is in the B category, which also includes B2 and B3 ratings. Moody’s gives the following definition of its B1 category: “obligations rated B are considered speculative and are subject to high credit risk.”
Standard & Poor's: on November 9, 2009, Standard & Poor's lowered to B from B+ its long-term corporate credit ratings and senior unsecured ratings on Alcatel-Lucent and on Alcatel-Lucent USA Inc. The B short–term credit ratings of Alcatel-Lucent and of Alcatel-Lucent USA Inc. were affirmed. The rating on the Preferred Stock of Alcatel-Lucent USA Inc. was lowered from CCC+ to CCC. The outlook remains negative.
On March 3, 2009, Standard & Poor’s lowered to B+ from BB- its long-term corporate credit ratings and senior unsecured ratings on Alcatel-Lucent and on Lucent. The ratings on the trust preferred notes of Lucent Technologies Capital Trust were lowered to CCC+. The B short-term rating on Alcatel-Lucent was affirmed. The B 1 rating on Lucent was withdrawn. The outlook is negative.
On December 12, 2008, Standard & Poor’s placed on Credit Watch with negative implications the long-term corporate credit ratings of Alcatel-Lucent and Lucent, as well as all issue ratings on both companies. At the same time, the long-term credit ratings were affirmed.
On July 31, 2008, Standard & Poor’s revised to negative from stable its outlook on Alcatel-Lucent and Lucent long-term corporate credit ratings. At the same time, the long and short-term debt ratings of Alcatel-Lucent and of Lucent were affirmed.
On March 19, 2008, the remainder of Lucent’s senior unsecured debt was raised to BB-. The trust preferred notes of Lucent Technologies Capital Trust were rated B-.
The rating grid of Standard & Poor’s ranges from AAA (the strongest rating) to D (the weakest rating). Our B rating is in the B category, which also includes B+ and B- ratings. Standard & Poor’s gives the following definition to the B category: “An obligation rated “B” is more vulnerable to non-payment than obligations rated “BB” but the obligor currently has the capacity to meet its financial commitment on the obligation. Adverse business, financial or economic conditions likely will impair the obligator’s capacity or willingness to meet its financial commitment on the obligation.”
Rating clauses affecting Alcatel-Lucent and Lucent debt at December 31, 2009
Alcatel-Lucent’s short-term debt rating allows a limited access to the French commercial paper market for short periods of time.
Alcatel-Lucent's and Lucent’s outstanding bonds do not contain clauses that could trigger an accelerated repayment in the event of a lowering of their respective credit ratings.
j/ Bank credit agreements
Alcatel-Lucent syndicated bank credit facility
On April 5, 2007, Alcatel-Lucent obtained a € 1.4 billion multi-currency syndicated five-year revolving bank credit facility (with two one-year extension options). On March 21, 2008, € 837 million of availability under the facility was extended until April 5, 2013.
The availability of this syndicated credit facility of € 1.4 billion is not dependent upon Alcatel-Lucent’s credit ratings. Alcatel-Lucent’s ability to draw on this facility is conditioned upon its compliance with a financial covenant linked to the capacity of Alcatel-Lucent to generate sufficient cash to repay its net debt and compliance is tested quarterly when we release our consolidated financial statements. Since the € 1.4 billion facility was established, Alcatel-lucent has complied every quarter with the financial covenant that is included in the facility. The facility was undrawn at the date of approval by Alcatel-Lucent’s Board of Directors of these 2009 financial statements.
k/ Liquidity risk on the financial debt
The Group considers that its available cash, cash equivalents and marketable securities, and the available syndicated bank credit facility (refer to Note 26j) are sufficient to cover its operating expenses and capital expenditures and its debt requirements for the next twelve months.

96
NOTE 27 PROVISIONS
a/ Balance at closing
(in millions of euros) 2009 2008 2007
Provisions for product sales 482 575 557
Provisions for restructuring 459 595 698
Provisions for litigation 142 392 366
Other provisions 925 862 945
TOTAL (1) 2,008 2,424 2,566
(1) Of which: – portion expected to be used within one year 1,189 1,630 1,421
– portion expected to be used after one year 819 794 1,145
b/ Change during 2009
(in millions of euros) December 31, 2008 Appropriation Utilization Reversals
Change in consolidated
companies Other December 31, 2009
Provisions for product sales (1) 575 323 (261) (162) 4 3 482
Provisions for restructuring 595 533 (561) (34) - (74) 459
Provisions for litigation (2) 392 33 (35) (36) - (212) 142
Other provisions 862 198 (46) (85) 1 (5) 925
TOTAL 2,424 1,087 (903) (317) 5 (288) 2,008
Effect on the income statement:
• income (loss) from operating activities before restructuring, impairment of assets, capital gain on disposal of consolidated entities and post-retirement benefit plan amendments (396) 244 (151)
• restructuring costs (521) 34 (487)
• litigations (3) (111) 2 (109)
• post-retirement benefit plan amendments (4) (6) - (6)
• other financial income (loss) (7) - (7)
• income taxes (46) 34 (12)
• income (loss) from discontinued operations and gain/(loss) on disposal of consolidated shares - 3 3
TOTAL (1,087) 317 (806)
(1) Excluding provisions for product sales on construction contracts, which are accounted for in amounts due to/from customers on construction contracts (see Note 18).
(2) € 1 million for interest accrued, a reversal for the difference between the initially estimated amount of the risk and the definitive amount of € 15 million and a reclassification against restricted cash for an amount of € 223 million (see note 17) due to the settlement of the Win-star litigation that occurred during the first quarter of 2009.
(3) Related to the FCPA litigation disclosed in notes 34a (for an amount of € 93 million representing the net present value of U.S.$ 137,4
million) and the Fox River litigation disclosed in note 31 (Lucent's separation agreements for an amount of € 16 million or U.S.$ 22 million). (4) Accounted for on a specific line item “Post-retirement benefit plan amendments” in the income statement related to the litigation
disclosed in Note 34 (Lucent’s employment and benefits related cases) that concerns a previous healthcare plan amendment has been posted in this specific line item.

97
c/ Analysis of restructuring provisions
(in millions of euros) 2009 2008 2007
Opening balance 595 698 413
Utilization during the period (561) (588) (530)
Charge during the period (1) 499 533 815
Effect of acquisition (disposal) of consolidated subsidiaries - - -
Cumulative translation adjustments and other changes (74) (48) -
CLOSING BALANCE 459 595 698
(1) For 2009, total restructuring costs were € 605 million, representing € 149 million of costs, valuation allowances or write-offs of assets of € 88 million and € 368 million for new restructuring plans and adjustments to previous plans. In addition, a finance cost of € 12 million, related to the reversal of the discount element included in certain restructuring provisions, was recorded in other financial income (loss).
For 2008, total restructuring costs were € 562 million, representing € 38 million of costs, valuation allowance on assets of € 35 million and € 489 million for new restructuring plans and adjustments to previous plans. In addition, a finance cost of € 6 million, related to the reversal of the discount element included in certain restructuring provisions, was recorded in other financial income (loss).
For 2007, total restructuring costs were € 856 million (see d/ below), representing € 186 million of costs, a valuation allowance of assets of € 47 million and € 623 million of new restructuring plans and adjustments to previous plans. In addition, a finance cost of € 6 million, related to reversing the discount element included in provisions, was recorded in other financial income (loss).
New restructuring plans were announced in July 2009 in various European countries. In accordance with IAS 37, reserves related to some of these new plans were accounted for as of December 31, 2009. For those new plans not yet reserved, the reserves will be accounted for when the IAS 37 provision recognition criteria apply.
d/ Restructuring costs
(in millions of euros) 2009 2008 2007
Social costs (368) (489) (623)
Valuation allowances or write-offs of assets (88) (35) (47)
Other monetary costs (149) (38) (186)
TOTAL RESTRUCTURING COSTS (605) (562) (856)
NOTE 28 MARKET-RELATED EXPOSURES
The Group has a centralized treasury management in order to minimize the Group’s exposure to market risks, including interest rate risk, foreign exchange risk, and counterparty risk. The Group uses derivative financial instruments to manage and reduce its exposure to fluctuations in interest rates and foreign exchange rates. These instruments are not complex and the determination of their fair values does not represent any particular difficulties.
Alcatel-Lucent’s debt is issued in euros and in U.S. dollars. Interest rate derivatives are used primarily to convert fixed rate debt into floating rate debt.
Estimated future cash flows (for example firm commercial contracts or commercial bids) are hedged by forward foreign exchange transactions or currency options.
a/ Interest rate risk
Derivative financial instruments held at December 31, 2009 are intended to reduce the cost of debt and to hedge interest rate risk. At December 31, 2009, 2008 and 2007, outstanding interest rate derivatives have the following characteristics:

98
i. Outstanding interest rate derivatives at December 31
Analysis by type and maturity date
2009 2008 2007
(in millions of euros) Contract notional amounts
Maturity date
Less than one year
1 to 5 years
After 5 years Total
Market value Total
Market value Total
Market value
Interest rate swaps
Pay fixed rate 5,791 775 18 6,584 (240) 10,990 (383) 11,151 (174)
Pay floating rate 5,743 1,215 6,958 281 13,611 452 13,104 178
Caps
Buy 68 0
Sell 68 0
Options on interest rate swaps USD Libor
Buy - -
Sell - -
TOTAL MARKET VALUE 41 69 4
Analysis by accounting category
Market value
(in millions of euros) 2009 2008 2007
Fair value hedges 43 71 3
Cash flow hedges - - -
Instruments not qualifying for hedge accounting (2) (2) 1
TOTAL 41 69 4
Analysis by market value and maturity date
Maturity date
(in millions of euros) Less than 1
year 1 to 5 years After 5 years Total
Market Value of derivatives as assets
Fair value hedges - 44 - 44
Cash flow hedges - - - -
Instruments not qualifying for hedge accounting 197 38 - 235
TOTAL 197 82 - 279
Maturity date
(in millions of euros) Less than 1
year 1 to 5 years After 5 years Total
Market Value of derivatives as liabilities
Fair value hedges - (1) - (1)
Cash flow hedges - - - -
Instruments not qualifying for hedge accounting (198) (39) - (237)
TOTAL (198) (40) - (238)
ii. Interest rate sensitivity
Interest rate sensitivity in terms of financial cost
An immediate increase in interest rates of 1%, applied to financial liabilities of which the impact is accounted for in the income statement after taking into account the hedging instruments, would increase interest expense by € 5 million for 2009 (€ 22 million for 2008 and € 19 million for 2007).

99
An immediate increase in interest rates of 1%, applied to financial assets of which the impact is accounted for in the income statement after taking into account the hedging instruments, would decrease interest expense by € 49 million for 2009 (€ 42 million for 2008 and € 47 million in 2007).
Financial assets are mainly short-term, and we assume that they are reinvested in assets of the same nature.
An immediate increase in interest rates of 1%, applied to marketable securities of which the impact is accounted for in equity after taking into account the hedging instruments, would decrease shareholders’ equity by € 6 million.
Interest rate sensitivity in terms of mark-to-market
An increase of 1% of the interest rate curve, applied to interest rate derivatives qualified as a fair value hedge would have a negative impact of € 19 million in 2009 (€ 37 million in 2008 and € 32 million in 2007).
An increase of 1% of the interest rate curve, applied to the hedged debt qualified as a fair value hedge would have a corresponding positive impact of € 19 million in 2009 (of € 37 million in 2008 and € 32 million in 2007).
The impact on income statement would be zero.
An increase of 1% of the interest rate curve, applied to interest rate derivatives that do not qualify for hedge accounting, would not have a significant impact on the income statement.
An increase of 1% of the interest rate curve, applied to financial debt after taking into account hedging instruments, would have a positive impact of € 213 million on its market value for 2009 (€ 49 million in 2008 and € 209 million for 2007). However, this impact would not be accounted for, as the debt is reassessed to its fair value only when it is hedged. As a result, it would have an impact neither on the income statement nor on shareholders’ equity.
2009 2008 2007
(in millions of
euros) Booked
value Fair
value
Fair value
change if rates fall
by 1% (1)
Fair value
change if rates rise
by 1% Booked
value Fair
value
Fair value
change if rates fall
by 1%
Fair value
change if rates rise
by 1% Booked
value Fair
value
Fair value
change if rates fall
by 1%
Fair value
change if rates rise
by 1%
Assets
Marketable securities 1,993 1,993 10 (10) 906 906 7 (7) 894 894 10 (10)
Cash 3,577 3,577 - - 3,687 3,687 - - 4,377 4,377 - -
Subtotal 5,570 5,570 10 (10) 4,593 4,593 7 (7) 5,271 5,271 10 (10)
Liabilities
Convertible bonds (2,924) (3,309) (150) 143 (2,387) (1,779) (47) 44 (2,273) (2,051) (136) 123
Non convertible bonds (1,521) (1,287) (98) 89 (2,320) (1,555) (42) 42 (2,381) (2,234) (134) 118
Other financial debt (310) (310) - - (388) (388) - - (394) (394) - -
Subtotal (4,755) (4,906) (248) 232 (5,095) (3,722) (89) 86 (5,048) (4,679) (270) 241
Interest rate derivative 43 43 19 (19) 71 71 40 (37) 3 3 34 (32)
Loan to co-venturer-financial asset 28 28 - - 42 42 - - 45 45 - -
DEBT/CASH POSITION 886 735 (219) 203 (389) 984 (42) 42 271 640 (226) 199
(1) If the interest rate is negative after the decrease of 1%, the sensitivity is calculated with an interest rate equal to 0%.

100
b/ Currency risk
i. Outstanding currency derivatives at December 31
Analysis by type and currency
2009 2008 2007
(in millions of euros) U.S.
dollar British pound Other Total
Market value Total
Market value Total
Market value
Buy/Lend foreign currency
Forward exchange contracts 421 146 90 657 4 2,686 (77) 2,735 (52)
Short-term exchange swaps 1,276 250 137 1,663 23 681 (61) 500 (5)
Cross currency swaps - - - -
Currency option contracts:
• Buy call 217 16 1,697 29
• Sell put 3,986 38 3,081 (34)
TOTAL 1,697 396 227 2,320 27 7,570 (84) 8,013 (62)
2009 2008 2007
(in millions of euros) U.S.
dollar British pound Other Total
Market value Total
Market value Total
Market value
Sell/Borrow foreign currency
Forward exchange contracts 521 101 78 700 (10) 1,599 (11) 2,466 74
Short-term exchange swaps 1,175 24 253 1,452 (33) 1,765 (6) 915 15
Cross currency swaps - - - -
Currency option contracts:
• Sell call 272 (17) 1,553 (23)
• Buy put 3,651 (36) 3,870 71
TOTAL 1,696 125 331 2,152 (43) 7,287 (70) 8,804 137
Total market value (16) (154) 75
Analysis by type and maturity
Maturity date
(in millions of euros) Less than 1
year 1 to 5 years After 5 years Total
Buy/Lend
Forward exchange contracts 657 - - 657
Short-term exchange swaps 1,663 - - 1,663
Cross currency swaps - - - -
Currency option contracts:
• Buy call - - - -
• Sell put - - - -
TOTAL 2,320 - - 2,320
Maturity date
(in millions of euros) Less than 1
year 1 to 5 years After 5 years Total
Sell/Borrow
Forward exchange contracts 700 - - 700
Short-term exchange swaps 1,452 - - 1,452
Cross currency swaps - - - -
Currency option contracts:
• Buy call - - - -
• Sell put - - - -
TOTAL 2,152 - - 2,152

101
Analysis by market value and maturity date
Maturity date
(in millions of euros) Less than 1
year 1 to 5 years After 5 years Total
TOTAL MARKET VALUE OF DERIVATIVES AS ASSETS 35 - - 35
Maturity date
(in millions of euros) Less than 1
year 1 to 5 years After 5 years Total
TOTAL MARKET VALUE OF DERIVATIVES AS LIABILITIES (51) - - (51)
Analysis by accounting category
Market value
(in millions of euros) 2009 2008 2007
Fair value hedges (20) (117) 34
Cash flow hedges 4 (6) (10)
Instruments not qualifying for hedge accounting - (31) 51
TOTAL (16) (154) 75
ii. Exchange rate sensitivity
The most used cross currencies in the Group are USD against EUR, GBP against USD and USD against CNY. The sensitivity is calculated by increasing or decreasing the value of the USD by 6% against other currencies.
An increase of foreign currency exchange rates versus euro of 6%, applied to foreign exchange derivatives, would have a negative impact of € 18 million in 2009 (against € 42 million in 2008 and € 50 million in 2007). This impact would affect the income statement only for foreign exchange derivatives, which do not qualify for hedge accounting.
For foreign exchange derivatives qualified as a fair value hedge, an increase of 6% in the foreign currency exchange rate would have a negative impact of € 32 million in 2009 (against € 39 million in 2008 and € 37 million in 2007). However, this negative effect would be offset by a positive impact due to the re-evaluation of the underlying items. The impact on income statement would therefore be zero.
For foreign exchange derivatives qualified as a cash flow hedge, a 6% increase in the foreign currency exchange rate would have a positive impact of € 15 million on shareholders’ equity in 2009 (against a positive impact of € 12 million in 2008 and a positive impact of € 17 million in 2007).

102
2009 2008 2007
(in millions of euros) Fair
value
Fair value change if USD falls
by 6%
Fair value change if USD rises
by 6% Fair
value
Fair value change if USD falls
by 6%
Fair value change if USD rises
by 6% Fair
value
Fair value change if USD falls
by 6%
Fair value change if USD rises
by 6%
Outstanding foreign exchange derivatives
Fair value hedges (20) 32 (32) (117) 34 (39) 34 37 (37)
Cash flow hedges 4 (15) 15 (6) (12) 12 (10) (16) 17
Derivatives not qualifying for hedge accounting - 1 (1) (31) 17 (15) 51 47 (30)
TOTAL OUTSTANDING DERIVATIVES (16) 18 (18) (154) 39 (42) 75 68 (50)
Impact of outstanding derivatives on financial result - 1 (1) (10) 16 (14) 10 8 (7)
Impact of outstanding derivatives on income (loss) from operating activities - - - (21) 1 (1) 41 39 (23)
Impact of outstanding derivatives on shareholders’ equity 4 (15) 15 (6) (12) 12 (10) (16) 17
iii. Reclassification to income statement of gains or losses on hedging transactions that were originally recognized in equity
(in millions of euros)
Cash flow hedges accounted for in shareholders’ equity at December 31, 2006 (5)
Changes in fair value (7)
Reclassification of gains or losses to income statement (1) 2
Cash flow hedges accounted for in shareholders’ equity at December 31, 2007 (10)
Changes in fair value (9)
Reclassification of gains or losses to income statement (1) 19
Cash flow hedges accounted for in shareholders’ equity at December 31, 2008 0
Changes in fair value (9)
Reclassification of gains or losses to income statement (1) 15
CASH FLOW HEDGES ACCOUNTED FOR IN SHAREHOLDERS’ EQUITY AT DECEMBER 31, 2009 6
(1) The amounts recognized directly in the shareholders’ equity indicated in this schedule differ from those disclosed in the Statement Of Comprehensive Income, due to the amounts related to discontinued activities and commodities derivatives, which are excluded in the above schedule.
c/ Fair value hierarchy
The amendment to IFRS 7 “Financial Instruments: Disclosures” – Improving Disclosures about Financial Instruments concerns assets and liabilities measured at fair value and requires to classify the fair value measures into three levels. The levels of the fair value hierarchy depend on the type of input used for the valuation of the instruments:
Level 1: quoted prices (unadjusted) in active markets for identical assets or liabilities
Level 2: inputs other than quoted prices included under Level 1 that are observable for the asset or liability, either directly (i.e. as prices) or indirectly (i.e. derived from prices)
Level 3: inputs for the asset or liability that are not based on observable market data (unobservable input)

103
2009
(in millions of euros) Level 1 Level 2 Level 3 Total
Assets
Financial assets available for sale at fair value (1) 3 223 48 274
Financial assets at fair value through profit or loss (1) - 1 722 - 1 722
Currency derivatives (2) - 35 - 35
Interest-rate derivatives – hedging (2) - 44 - 44
Interest-rate derivatives – other (2) - 235 - 235
TOTAL 3 2 259 48 2 310
Liabilities
Currency derivatives (2) - (51) - (51)
Interest-rate derivatives – hedging (2) - (1) - (1)
Interest-rate derivatives – other (2) - (237) - (237)
TOTAL - (289) - (289)
(1) See Note 17. (2) See Note 21.
d/ Stock market risk
Alcatel-Lucent and its subsidiaries are not engaged in speculative trading in the stock markets. Subject to approval by Alcatel-Lucent, subsidiaries may make equity investments in selected companies.
e/ Credit risk
i. Maximum exposure to credit risk
The Group considers that its exposure is as follows:
(in millions of euros) 2009 2008 2007
Trade receivables and other receivables 3,221 4,330 4,163
Marketable securities 1,993 906 894
Cash and cash equivalents 3,577 3,687 4,377
Other financial assets 392 696 704
Foreign exchange derivative assets (1) 35 185 203
Interest rate derivative assets (1) 279 451 217
Other assets (1) 960 1,409 1,086
Financial guarantees and off balance sheet commitments (2) 318 501 547
MAXIMUM EXPOSURE TO CREDIT RISK 10,775 12,165 12,191
(1) See Note 21. (2) See Note 31.
ii. Credit risk concentration
Due to the diversification of its customers and their geographical dispersion, management considers that there is no significant credit risk concentration. The credit risk for the top five customers does not exceed 30% of trade receivables.

104
iii. Outstanding financial assets not impaired
Of which amounts not impaired but overdue at closing date
(in millions of euros)
Carrying value at
December 31, 2009
Of which amounts neither
overdue nor impaired < 1 month
From 1 to 6 months
From 6 months to 1 year > 1 year Total
Trade receivables and other receivables
Interest-bearing receivables 316 316
Other trade receivables 3,073 2,479 161 170 57 38 426
Gross value 3,389
Valuation allowance (168)
NET VALUE 3,221 2,795 161 170 57 38 426
Of which amounts not impaired but overdue at closing date
(in millions of euros)
Carrying value at
December 31, 2008
Of which amounts neither
overdue nor impaired < 1 month
From 1 to 6 months
From 6 months to 1 year > 1 year Total
Trade receivables and other receivables
Interest-bearing receivables 202 202 - - - - -
Other trade receivables 4,335 3,523 227 277 60 41 605
Gross value 4,537
Valuation allowance (207)
NET VALUE 4,330 3,725 227 277 60 41 605
Of which amounts not impaired but overdue at closing date
(in millions of euros)
Carrying value at
December 31, 2007
Of which amounts neither
overdue nor impaired < 1 month
From 1 to 6 months
From 6 months to 1 year > 1 year Total
Trade receivables and other receivables
Interest-bearing receivables 263 263 - - - - -
Other trade receivables 4,087 3,067 223 205 94 54 576
Gross value 4,350
Valuation allowance (187)
NET VALUE 4,163 3,363 223 205 94 54 576
Other overdue financial assets not impaired are not material.

105
iv. Changes to trade receivable valuation allowances
(in millions of euros) Amounts
Valuation allowance at December 31, 2006 (192)
Net result impact (3)
Write-offs 38
Translation adjustments 4
Other changes (34)
Valuation allowance at December 31, 2007 (187)
Net result impact (17)
Write-offs 22
Translation adjustments (4)
Other changes (21)
Valuation allowance at December 31, 2008 (207)
Net result impact (23)
Write-offs 34
Translation adjustments -
Other changes 28
Valuation allowance at December 31, 2009 (168)
v. Credit Risk on marketable securities, cash, cash equivalents and financial derivative instruments
The Group is exposed to credit risk on its marketable securities, cash, cash equivalents and financial derivative instruments if counterparty defaults on its commitments. The Group diversifies the counterparties in order to dilute the credit risk. This risk is followed daily, with strict limits based on the counterparties’ rating. All counterparties are classified in the investment grade category as of December 31, 2009. The exposure with regard to each counterparty is calculated by taking into account the fair value of the marketable securities, cash, cash equivalents and financial derivative instruments.
f/ Liquidity risk
i. Liquidity risk on the financial debt
The Group considers that its available treasury and the available syndicated bank credit facility are sufficient to cover its operating expenses and capital expenditures and its financial debt requirements for the next twelve months.
See Note 31 Contractual obligations and disclosures related to off balance sheet commitments.
ii. Liquidity risk on foreign exchange derivatives
The mark-to-market of foreign exchange derivatives (see part b/, paragraph i. Outstanding currency derivatives at December 31) appropriately conveys the liquidity risk.
Assets and liabilities related to foreign exchange derivatives are given in Note 21 Other assets and liabilities.
iii. Liquidity risk on guarantees and off balance sheet commitments
See Note 31 Contractual obligations and disclosures related to off balance sheet commitments.

106
NOTE 29 CUSTOMERS’ DEPOSITS AND ADVANCES
(in millions of euros) 2009 2008 2007
Advance payments received on construction contracts (1) 173 333 403
Other deposits and advances received from customers 466 660 668
TOTAL CUSTOMERS’ DEPOSITS AND ADVANCES 639 993 1,071
Of which:
• portion due within one year 622 930 1,025
• portion due after one year 17 63 46
(1) Including amounts reported in the statement of financial position captions “amounts due to/from customers on construction contracts” (€ 0 million in 2009, € 64 million in 2008 and € 224 million for 2007).
NOTE 30 NET CASH PROVIDED (USED) BY OPERATING ACTIVITIES BEFORE CHANGES IN WORKING CAPITAL, INTEREST AND TAXES
(in millions of euros) Q4 2009 2009 2008 2007
Net income (loss) attributable to the owners of the parent 46 (524) (5,215) (3,518)
Non-controlling interests 49 20 42 41
Adjustments:
Depreciation and amortization of tangible and intangible assets 241 969 1,241 1,456
Of which impact of capitalized development costs 72 280 308 261
Impairment of assets - - 4,725 2,944
Post-retirement benefit plan amendment (210) (247) (47) (258)
Changes in pension and other post-retirement benefit obligations, net (95) (202) (452) (679)
Provisions, other impairment losses and fair value changes 150 (91) 71 641
Repurchase of bonds and change of estimates related to Lucent 2.875% Series A convertible debenture (1) - 124
Net (gain) loss on disposal of assets (115) (401) (74) (129)
Share in net income (losses) of equity affiliates (net of dividends received) (4) 16 (55) (66)
(Income) loss from discontinued operations (2) (131) (33) (610)
Finance costs 70 254 212 173
Share-based payments 12 58 85 102
Taxes and related reduction of goodwill 41 (60) 153 316
Sub-total of adjustments 88 289 5,826 3,890
NET CASH PROVIDED (USED) BY OPERATING ACTIVITIES BEFORE CHANGES IN WORKING CAPITAL, INTEREST AND TAXES 183 (215) 653 413
(1) See Notes 8, 24 and 26.
NOTE 31 CONTRACTUAL OBLIGATIONS AND DISCLOSURES RELATED TO OFF BALANCE SHEET COMMITMENTS
a/ Contractual obligations
The following table presents minimum payments that the Group will have to make in the future under contracts and firm commitments as of December 31, 2009. Amounts related to financial debt, finance lease obligations and the equity component of Alcatel-Lucent’s convertible bonds are fully reflected in the consolidated statement of financial position.

107
(in millions of euros) Maturity date Total
Contractual payment obligations Less than one
year 2011-2012 2013-2014 2015 and after
Financial debt (excluding finance leases) 534 869 874 2,420 4,697
Finance lease obligations 42 16 - - 58
Equity component of convertible bonds 7 23 254 299 583
Sub-total – included in statement of financial position 583 908 1,128 2,719 5,338
Finance costs on financial debt (1) 262 426 382 1,154 2,224
Operating leases 229 412 264 249 1,154
Commitments to purchase fixed assets 37 - - - 37
Unconditional purchase obligations (2) 311 453 290 513 1,567
Sub total – commitments not included in statement of financial position 839 1,291 936 1,916 4,982
TOTAL – CONTRACTUAL OBLIGATIONS (3) 1,422 2,199 2,064 4,635 10,320
(1) To compute finance costs on financial debt, all put dates have been considered as redemption dates. For debentures with calls but no puts, call dates have not been considered as redemption dates. Further details on put and call dates are given in Note 24. If all outstanding debentures at December 31, 2009 were not redeemed at their respective put dates, an additional finance cost of approximately € 348 million (of which € 21 million would be incurred in 2011-2012 and the remaining part in 2013 or later) would be incurred until redemption at their respective contractual maturities.
(2) Other unconditional purchase obligations result mainly from obligations under multi-year supply contracts linked to the sale of businesses to third parties or outsourcing agreements.
(3) Obligations related to pensions, post-retirement health and welfare benefits and postemployment benefit obligations are excluded from the table (refer to note 25).
b/ Off balance sheet commitments
Off balance sheet commitments of the Group were primarily as follows:
• certain guarantees given to the Group’s customers for contract execution (performance bonds, guarantees on advances received issued by financial institutions);
• guarantee relating to the maximum intraday bank overdraft allowed for Group subsidiaries under the Group’s cash pooling agreement with certain banks;
• guarantees given under securitization programs or on sale of receivables (see description below).
Alcatel-Lucent does not rely on special purpose entities to deconsolidate these risks.
Guarantees given in the normal course of the Group’s business are presented below.
For guarantees given for contract performance, only those granted by financial institutions are presented below:
(in millions of euros) 2009 2008 2007
Guarantees given on contracts made by entities within the Group and by non-consolidated subsidiaries 1,096 1,232 1,172
Discounted notes receivables 2 5 3
Other contingent commitments 675 770 797
Sub-total - contingent commitments 1,773 2,007 1,972
Secured borrowings (1) 22 24 25
Cash pooling guarantee 296 473 522
TOTAL – CONTINUING ACTIVITIES 2,091 2,504 2,519
Commitments of discontinued activities (2) - - 54
TOTAL – INCLUDING DISCONTINUED ACTIVITIES 2,091 2,504 2,573
(1) Excluding the subordinated guaranties described below on certain bonds. (2) Commitments related to businesses sold or contributed to Thales in 2007. Commitments that were still in the process of being
transferred to Thales as of December 31, 2007, are counter-guaranteed by Thales (Thales agreed to indemnify Alcatel-Lucent for and against any payment that any Alcatel-Lucent entity is required to make pursuant to any obligation under any guarantees related to the businesses sold or contributed to Thales).

108
Contingent commitments at December 31, 2009
(in millions of euros) Maturity date
Contingent commitments Less than one
year 2 to 3 years 4 to 5 years After
5 years
Total
Guarantees on Group contracts (1) 774 134 14 3 925
Guarantees on third-party contracts 108 22 21 20 171
Discounted notes receivable and other - - - - -
Other contingent commitments 363 181 96 35 675
TOTAL 1,245 337 131 58 1,771
Counter guarantees received 123 39 28 47 237
(1) Reflected in statement of financial position : € 193 million.
The amounts reflected in the preceding tables represent the maximum potential amounts of future payments (undiscounted) that the Group could be required to make under current guarantees granted by the Group. These amounts are not reduced by any amounts that may be recovered under recourse, collateralization provisions in the guarantees or guarantees given by customers for the Group’s benefit, which are included in the “counter-guarantees received” line.
Commitments related to product warranties, pension, retirement indemnities and other post-retirement benefits are not included in the preceding table. These commitments are fully reflected in the financial statements. Contingent liabilities arising out of litigation, arbitration or regulatory actions are not included in the preceding table with the exception of those linked to Group construction contracts. For more information concerning contingencies, see Note 34.
Guarantees given on Group construction contracts consist of performance bonds issued by financial institutions to customers and bank guarantees given to secure advance payments received from customers (excluding security interests and restricted cash which are included in the table below “Guarantees granted on debt, advance payments received, contingencies and security interests granted at December 31, 2009” of this note). Alcatel-Lucent gives guarantees related to advances and payments received from customers, or commits to indemnify the customer, if the contractor does not perform the contract in compliance with the terms of the contract. In the event that, due to occurrences, such as delay in delivery or litigation related to failure in performance on the underlying contracts, it becomes likely that Alcatel-Lucent will become liable for such guarantees, the estimated risk is reserved for on the consolidated statement of financial position under the caption “provisions” (see Note 27) or in inventory reserve. The amounts concerned are given in the preceding table in the specific caption “(1) Reflected in statement of financial position”.
Commitments, which are related to contracts that have been cancelled or interrupted due to the default or bankruptcy of the customer are included in the above-mentioned “Guarantees on Group contracts” as long as the legal release of the guarantee has not been obtained.
Additionally, most of the performance guarantees given to Group customers are insured. The evaluation of risk related to guarantees takes into account the insurance proceeds that may be received in case of a claim.
Guarantees given on third-party construction contracts could require the Group to make payments to the guaranteed party based on a non-consolidated company’s failure to perform under an agreement. The fair value of these contingent liabilities, corresponding to the premiums received by the guarantor for issuing the guarantees, was € 2 million at December 31, 2009 (€ 2 million at December 31, 2008 and € 2 million at December 31, 2007).
Alcatel-Lucent licenses to its customers software and rights to use intellectual property that might provide the licensees with an indemnification against any liability arising from third-party claims of patent, copyright or trademark infringement. Alcatel-Lucent cannot determine the maximum amount of losses that Alcatel-Lucent could incur under this type of indemnification, because Alcatel-Lucent often may not have enough information about the nature and scope of an infringement claim until it has been submitted.
Alcatel-Lucent indemnifies its directors and certain of its current and former officers for third-party claims alleging certain breaches of their fiduciary duties as directors or officers. Certain costs incurred for providing such indemnification may be recovered under various insurance policies. Alcatel-Lucent is unable to reasonably estimate the maximum amount that could be payable under these arrangements since these exposures are not capped and due to the conditional nature of its obligations and the unique facts and circumstances involved in each agreement. Historically, payments made under these agreements have not had a material effect on Alcatel-Lucent’s business, financial condition, results of operations or cash flows.

109
Guarantees granted on debt, advance payments received, contingencies and security interests granted at December 31, 2009
(in millions of euros) Maturity date
Guarantees on borrowings and advance payments received
Less than one year
2 to 3 years
4 to 5 years
After 5 years
Total
Total of the statement of
financial position caption
% of the statement of
financial position caption
Security interests granted - - - 1 1 - -
Other guarantees given 3 11- - 7 21 - -
TOTAL 3 11 - 8 22
Net book value of assets given in guarantee:
• intangible assets - - - - - 2,214 0.00%
• tangible assets - - - - - 1,260 0.00%
• financial assets - - - 1 1 450 0.22%
• inventories and work in progress - - - - - 1,624 0.00%
TOTAL - - - 1 1
Guarantee on cash pooling
The cash pooling guarantee is granted to the banks operating the Group’s cash pooling. This guarantee covers the risk involved in any overdrawn position that could remain outstanding after the many daily transfers between Alcatel-Lucent’s Central Treasury accounts and those of its subsidiaries. As of December 31, 2009, this guarantee was € 0.3 billion (€ 0.5 billion as of December 31, 2008 and € 0.5 billion as of December 31, 2007).
Outsourcing transactions
During 2009, Alcatel-Lucent entered into a major IT outsourcing transaction with Hewlett Packard Company (“HP”) and is also finalizing other outsourcing transactions with other service providers concerning payroll and certain R&D and Business Process activities. The IT outsourcing transaction, which has an effective date of December 1, 2009, was signed with HP on October 20, 2009, at the same time as the ten-year joint go-to-market sales cooperation agreement with HP.
The IT outsourcing transaction provides for HP to transform and manage a large part of Alcatel-Lucent’s IT infrastructure. As part of an initial 18-month transition and transformation phase, HP will invest to transform Alcatel-Lucent’s global IT/IS platforms. As a result, Alcatel-Lucent is committed to restructuring its IT/IS operations, which is estimated to cost € 200 million. These restructuring costs, which include severance costs and the costs of transferring certain legal entities and resources to HP, will be recognized as incurred, starting in 2010. As part of the transfer of resources, Alcatel-Lucent has sold to HP IT infrastructure assets under a sale and finance leaseback arrangement, the payment obligations for which are included in “finance lease obligations” in the above table representing a total amount of € 57 million of finance lease obligation.
As part of the overall arrangement with HP, Alcatel-Lucent has committed to purchase, for resale or for internal use, € 202.5 million of additional HP goods and services over a four-year period until October 31, 2013.
The finance lease obligations and the unconditional purchase commitments related to this agreement are included in the contractual payment obligations schedule, presented above under the headings “Finance lease obligations” and “Unconditional purchase obligations”.
Also included in the HP agreements were the two following commitments:
• A minimum value commitment regarding the amount of IT Managed services to be purchased or procured by Alcatel-Lucent to HP or service providers over ten years, for a total amount of €845 million and
• A minimum sales investment commitment related to the go to market sales cooperation agreement representing a minimum amount over ten years of €298 million.
These two commitments are included in the contractual payment obligations schedule presented above under the heading “Unconditional purchase obligations”.
Specific commitments formerly of Lucent (now Alcatel-Lucent USA Inc)
Alcatel-Lucent (formerly Lucent)’s Separation Agreements. Lucent is party to various agreements that were entered into in connection with the separation of Lucent and former affiliates, including AT&T, Avaya, LSI Corporation (formerly Agere Systems, before its merger with LSI corporation in April 2007) and NCR Corporation. Pursuant to these agreements, Lucent and the former affiliates have agreed to allocate certain liabilities related

110
to each other’s business, and have agreed to share liabilities based on certain allocations and thresholds. In the fourth quarter, Lucent recorded an additional provision of U.S.$ 22 million for one such claim asserted by NCR Corporation relating to NCR Corporation's liabilities for the environmental clean up of the Fox River in Wisconsin, USA. Future developments in connection with the Fox River claim may warrant additional adjustments of existing provisions. We are not aware of any material liabilities to Lucent’s former affiliates as a result of the separation agreements that are not otherwise reflected in our unaudited condensed interim consolidated financial statements included elsewhere in this document. Nevertheless, it is possible that potential liabilities for which the former affiliates bear primary responsibility may lead to contributions by Lucent.
Alcatel-Lucent (formerly Lucent)’s Other Commitments – Contract Manufacturers. Lucent outsources most of its manufacturing operation to electronic manufacturing service (EMS) providers. Until 2008, two EMS providers, Celestica and Solectron (acquired by Flextronics in October 2007), had exclusive arrangements with Lucent to supply most of Lucent-designed wireless and wireline products. Although no longer exclusive suppliers, Celestica continues to manufacture most of Lucent’s existing wireless products and Solectron continues to consolidate the outsourced manufacturing of Lucent’s portfolio of wireline products. Lucent generally does not have minimum purchase obligations in its contract-manufacturing relationships with EMS providers and therefore the contractual payment obligations schedule, presented above under the heading “Contractual Obligations”, does not include any commitments related to contract manufacturers.
Alcatel-Lucent (formerly Lucent)’s Guarantees and Indemnification Agreements. Lucent divested certain businesses and assets through sales to third-party purchasers and spin-offs to the other common shareowners of the businesses spun-off. In connection with these transactions, certain direct or indirect indemnifications were provided to the buyers or other third parties doing business with the divested entities. These indemnifications include secondary liability for certain leases of real property and equipment assigned to the divested entity and specific indemnifications for certain legal and environmental contingencies, as well as vendor supply commitments. The durations of such indemnifications vary but are standard for transactions of this nature.
Lucent remains secondarily liable for approximately U.S.$ 67 million of lease obligations as of December 31, 2009 (U.S.$ 105 million of lease obligations as of December 31, 2008 and U.S.$ 131 million of lease obligations as of December 31, 2007), that were assigned to Avaya, LSI Corporation (formerly Agere) and purchasers of other businesses that were divested. The remaining terms of these assigned leases and the corresponding guarantees range from one month to 10 years. The primary obligor under assigned of the assigned leases may terminate or restructure the lease before its original maturity and thereby relieve Lucent of its secondary liability. Lucent generally has the right to receive indemnity or reimbursement from the assignees and we have not reserved for losses on this form of guarantee.
Lucent is party to a tax-sharing agreement to indemnify AT&T and is liable for tax adjustments that are attributable to its lines of business, as well as a portion of certain other shared tax adjustments during the years prior to its separation from AT&T. Lucent has similar agreements with Avaya and LSI Corporation. Certain proposed or assessed tax adjustments are subject to these tax-sharing agreements. We do not expect that the outcome of these other matters will have a material adverse effect on our consolidated results of operations, consolidated financial position or near-term liquidity.
Alcatel-Lucent USA Inc (formerly Lucent)'s guaranty of Alcatel-Lucent public bonds. On March 27, 2007, Lucent issued full and unconditional guaranties of our 6.375% notes due 2014 (the principal amount of which was € 462 million on December 31, 2009) and our 4.750% Convertible and/or Exchangeable Bonds due 2011 (the remaining principal amount of which was € 818 million on December 31, 2009). Each guaranty is unsecured and is subordinated to the prior payment in full of Lucent’s senior debt and is pari passu with Lucent’s other general unsecured obligations, other than those that expressly provide that they are senior to the guaranty obligations.
NOTE 32 RELATED PARTY TRANSACTIONS
Related parties are mainly:
• shareholders of Alcatel-Lucent;
• jointly controlled entities (consolidated using proportionate consolidation);
• investments in associates (accounted for using equity method);
• non-consolidated entities;
• key management personnel.
To the Group’s knowledge, shareholders holding 5% or more of the parent company’s share capital are:
• Brandes Investment Partners; and
• T. Rowe Price Group. Inc.

111
Transactions with related parties (as defined by IAS 24 “Related Party Disclosures”) during 2009, 2008 and 2007 were as follows:
(in millions of euros) 2009 2008 2007
Revenues
Non-consolidated affiliates 30 37 35
Joint ventures - - -
Equity affiliates 2 15 18
Cost of sales
Non-consolidated affiliates (37) (42) (24)
Joint ventures (28) (25) (39)
Equity affiliates (1) (10) (10)
Research and development costs
Non-consolidated affiliates (6) (6) (4)
Joint ventures - - -
Equity affiliates (5) (5) (53)
Outstanding balances arising from related party transactions at December 31, 2009, 2008 and 2007 were as follows:
(in millions of euros) 2009 2008 2007
Other assets
Non-consolidated affiliates 24 26 23
Joint ventures - 5 2
Equity affiliates 3 11 16
Valuation allowances - - -
Other liabilities
Non-consolidated affiliates (4) (17) (4)
Joint ventures - - -
Equity affiliates (1) (20) (35)
Cash (financial debt), net
Non-consolidated affiliates (4) - -
Joint ventures (28) (1) (42) (1) (45) (1)
Equity affiliates - (27) (21)
(1) Loan to a co-venturer (refer to Note 26).
Members of the Board of Directors and members of the Group’s executive committee are those present during the year and listed in the Corporate Governance section of the Annual Report. In 2009, 2008 and 2007, compensation, benefits and social security contributions attributable to members of the Board of Directors and to the executive committee members (“Key management personnel”) were as follows:
Recorded expense in respect of compensation and related benefits attributable to Key management personnel during the year
(in millions of euros) 2009 2008 2007
Short-term benefits
Fixed remuneration 8 5 4
Variable remuneration (1) 4 4 4
Directors’ fees 1 1 1
Employer’s social security contributions 2 3 2
Termination benefits and retirement indemnities 3 8 7
Other benefits
Post-employment benefits 2 2 4
Share-based payments (stock option plans) 4 8 6
TOTAL 24 31 28
(1) Variable remuneration and retention bonuses.

112
NOTE 33 EMPLOYEE BENEFIT EXPENSES, STAFF TRAINING RIGHTS AND AUDIT FEES
a/ Employee benefit expenses and staff training rights
(in millions of euros) 2009 2008 2007
Wages and salaries (1) 5,360 5,266 5,494
Restructuring costs (2) 368 489 623
Post-retirement benefit plan amendment (3) (253) (65) (258)
Financial component of pension and post-retirement benefit costs (4) (105) (349) (544)
NET EMPLOYEE BENEFIT EXPENSES 5,370 5,341 5,315
(1) Including social security expenses and operational pension costs. This is reported in Income (loss) from operating activities before restructuring costs, impairment of assets, gain/(loss) on disposal of consolidated entities, litigations and post-retirement benefit plan amendments.
(2) See Note 27d. (3) See Note 25f. (4) See Note 8.
The law of May 4, 2004 in France provides French company employees with the right to receive individual training of at least 20 hours per year that can be accumulated over six years. Rights which are related to terminated or dismissed employees exercised during the notice period and rights, which are exercised by employees considered as not adapted to the needs of their employer or not professional in nature, are assimilated to short and long-term employee benefits as defined in IAS 19 and are provided for accordingly. All other rights are accounted for as incurred, as Alcatel-Lucent expects to receive economic benefits from the future training to be taken that will exceed the costs to be incurred to settle the present obligation.
Accumulated individual staff training rights represented 1,085,798 hours at December 31, 2009 (953,570 hours at December 31, 2008 and 844,515 hours at December 31, 2007). Rights exercised so far are not material.
b/ Audit fees
The unaudited amount of audit fees is disclosed in section 11.4 of the 20-F, which is available on the Internet (http://alcatel-lucent.com).
NOTE 34 CONTINGENCIES
In addition to legal proceedings incidental to the conduct of its business (including employment-related collective actions in France and the United States) which management believes are adequately reserved against in the financial statements or will not result in any significant costs to the Group, Alcatel-Lucent is involved in the following legal proceedings.
a/ Costa Rica
Beginning in early October 2004, Alcatel-Lucent learned that investigations had been launched in Costa Rica by the Costa Rican prosecutors and the National Congress, regarding payments alleged to have been made by consultants on behalf of Alcatel CIT, a French subsidiary now called Alcatel-Lucent France (“CIT”), or other Alcatel subsidiaries to various public officials in Costa Rica, two political parties in Costa Rica and representatives of ICE, the state-owned telephone company, in connection with the procurement by CIT of several contracts for network equipment and services from ICE. Upon learning of these allegations, Alcatel commenced an investigation into this matter.
Alcatel terminated the employment of the then-president of Alcatel de Costa Rica in October 2004 and of a vice president Latin America of CIT. CIT is also pursuing criminal actions in France against the latter and in Costa Rica against these two former employees and certain local consultants, based on their complicity in a bribery scheme and misappropriation of funds. The United States Securities and Exchange Commission (“SEC”) and the United States Department of Justice (“DOJ”) are aware of the allegations and Alcatel-Lucent stated it would cooperate fully in any inquiry or investigation into these matters. The SEC and the DOJ are conducting an investigation into possible violations of the Foreign Corrupt Practices Act (“FCPA”) and the federal securities laws. In connection with that investigation, the DOJ and the SEC also requested information regarding Alcatel’s operations in other countries.
In connection with these allegations, on December 19, 2006, the DOJ indicted one of the two former employees on charges of violations of the FCPA, money laundering, and conspiracy. On March 20, 2007, a grand jury returned a superseding indictment against the same former employee and the former president of Alcatel de Costa Rica, based on the same allegations contained in the previous indictment. On June 11, 2007, the former CIT employee entered into a plea agreement in the U.S. District Court for the Southern District of Florida and pleaded guilty to violations of the FCPA. On September 23, 2008, the former CIT employee was sentenced to 30

113
months’ imprisonment, three years’ supervised release, the forfeiture of U.S. $ 261,500, and a U.S. $ 200 special assessment.
French authorities are also conducting an investigation of CIT’s payments to consultants in the Costa Rica matter.
Alcatel-Lucent is cooperating with the U.S., French and Costa Rican authorities in the respective investigations described above. Alcatel-Lucent reiterates that its policy is to conduct its business with transparency, and in compliance with all laws and regulations, both locally and internationally. Alcatel-Lucent will cooperate with all governmental authorities in connection with the investigation of any violation of those laws and regulations.
In connection with the Costa Rica allegations, on July 27, 2007, the Costa Rican Prosecutor’s Office indicted eleven individuals, including the former president of Alcatel de Costa Rica, on charges of aggravated corruption, unlawful enrichment, simulation, fraud and others. Three of those individuals have since pled guilty. Shortly thereafter, the Costa Rican Attorney General’s Office and ICE, acting as victims of this criminal case, each filed amended civil claims against the eleven criminal defendants, as well as five additional civil defendants (one individual and four corporations, including CIT) seeking compensation for damages in the amounts of U.S. $ 52 million (in the case of the Attorney General’s Office) and U.S. $ 20 million (in the case of ICE). The Attorney General’s claim supersedes two prior claims, of November 25, 2004 and August 31, 2006. On November 25, 2004, the Costa Rican Attorney General’s Office commenced a civil lawsuit against CIT to seek pecuniary compensation for the damage caused by the alleged payments described above to the people and the Treasury of Costa Rica, and for the loss of prestige suffered by the Nation of Costa Rica (social damages). The ICE claim, which supersedes its prior claim of February 1, 2005, seeks pecuniary compensation for the damage caused by the alleged payments described above to ICE and its customers, for the harm to the reputation of ICE resulting from these events (moral damages), and for damages resulting from an alleged overpricing it was forced to pay under its contract with CIT. During preliminary court hearings held in San José during September 2008, ICE filed a report in which the damages allegedly caused by CIT are valued at U.S. $ 71.6 million. No formal notice of a revised civil claim has so far been received by CIT.
Alcatel-Lucent recently entered into discussions with the Attorney General’s Office directed to a negotiated resolution of the Attorney General’s social damages claims and the moral damages claims of ICE. Those discussions have resulted in a signed written agreement entered into January 20, 2010 under which the Attorney General’s social damages claims would be dismissed in return for a payment by Alcatel-Lucent France (as successor to CIT) of approximately U.S. $ 10 million. That agreement must be approved by the Court having jurisdiction over the Attorney General’s claims before it can become effective. We understand that the Court has scheduled a hearing for the approval of this agreement on February 11, 2010. At present, no assurance can be given that the agreement with the Attorney General’s Office will be approved and implemented. ICE’s claims are not included in the agreement with the Attorney General and it has been reported in the Costa Rican press that the Board of ICE has decided not to participate in the settlement negotiated with the Attorney General at this time. To the extent that any of these claims are not resolved by agreement, Alcatel-Lucent intends to defend against them vigorously and to deny any liability or wrongdoing with respect to such claims.
Additionally, in August 2007, ICE notified CIT of the commencement of an administrative proceeding to terminate the 2001 contract for CIT to install 400,000 GSM cellular telephone lines (the “400KL GSM Contract”), in connection with which ICE is claiming compensation of U.S. $ 59.8 million for damages and loss of income. By March 2008, CIT and ICE concluded negotiations of a draft settlement agreement for the implementation of a “Get Well Plan,” in full and final settlement of the above-mentioned claim. This settlement agreement was not approved by ICE’s Board of Directors that resolved, instead, to resume the aforementioned administrative proceedings to terminate the operations and maintenance portion of the 400KL GSM Contract, claim penalties and damages in the amount of U.S. $ 59.8 million and call the performance bond. CIT was notified of this ICE resolution on June 23, 2008. ICE has made additional damages claims and penalty assessments related to the 400KL GSM Contract that bring the overall exposure under the contract to U.S. $ 78.1 million in the aggregate, of which ICE has collected U.S.$ 5.9 million.
In June 2008, CIT filed an administrative appeal against the resolution mentioned above. ICE called the performance bond in August 2008, and on September 16, 2008 CIT was served notice of ICE’s request for payment of the remainder amount of damages claimed, U.S. $ 44.7 million. On September 17, 2008, the Costa Rican Supreme Court ruled on the appeal filed by CIT stating that: (i) the U.S. $ 15.1 million performance bond amount is to be reimbursed to CIT and (ii) the U.S. $ 44.7 million claim is to remain suspended until final resolution by the competent court of the case. Following a clarification request filed by ICE, the Court finally decided that the U.S. $ 15.1 million performance bond amount is to remain deposited in an escrow account held by the Court, until final resolution of the case. On October 8, 2008, CIT filed a claim against ICE requesting the court to overrule ICE’s contractual resolution regarding the 400KL GSM Contract and claiming compensation for the damages caused to CIT. In January 2009, ICE filed its response to CIT’s claim. At a court hearing on March 25, 2009, ICE ruled out entering into settlement discussions with CIT. On April 20, 2009, CIT filed a petition to the Court to recover the U.S. $ 15.1 million performance bond amount and offered the replacement of such bond with a new bond that will guarantee the results of the final decision of the Court. A hearing originally
114
scheduled for June 1, 2009 was suspended due to ICE’s decision not to present to the Court the complete administrative file wherein ICE decided the contractual resolution of the 400KL GSM Contract. The preliminary court hearing commenced on October 6, 2009, and is expected to conclude in February 2010.
On October 14, 2008, the Costa Rican authorities notified CIT of the commencement of an administrative proceeding to ban CIT from government procurement contracts in Costa Rica for up to 5 years. The administrative proceeding was suspended on December 8, 2009 pending the resolution of the criminal case mentioned above.
If the Costa Rican authorities conclude criminal violations have occurred, CIT may be banned from participating in government procurement contracts within Costa Rica for a certain period. Alcatel-Lucent expects to generate approximately € 6 million in revenue from Costa Rican contracts in 2010. Based on the amount of revenue expected from these contracts, Alcatel-Lucent does not believe a loss of business in Costa Rica would have a material adverse effect on the Alcatel-Lucent group as a whole. However, these events may have a negative impact on the reputation of Alcatel-Lucent in Latin America.
Alcatel-Lucent has recognized a provision in connection with the various ongoing proceedings in Costa Rica when reliable estimates of the probable future outflow were available.
As previously disclosed in its public filings, Alcatel-Lucent has engaged in settlement discussions with the DOJ and the SEC with regard to the ongoing FCPA investigations. These discussions have resulted in December 2009 in agreements in principle with the staffs of each of the agencies. There can be no assurances, however, that final agreements will be reached with the agencies or accepted in court. If finalized, the agreements would relate to alleged violations of the FCPA involving several countries, including Costa Rica, Taiwan, and Kenya. Under the agreement in principle with the SEC, Alcatel-Lucent would enter into a consent decree under which Alcatel-Lucent would neither admit nor deny violations of the antibribery, internal controls and books and records provisions of the FCPA and would be enjoined from future violations of U.S. securities laws, pay U.S. $45.4 million in disgorgement of profits and prejudgment interest and agree to a three-year French anticorruption compliance monitor to evaluate in accordance with the provisions of the consent decree (unless any specific provision therein is expressly determined by the French Ministry of Justice to violate French law) the effectiveness of Alcatel-Lucent's internal controls, record-keeping and financial reporting policies and procedures. Under the agreement in principle with the DOJ, Alcatel-Lucent would enter into a three-year deferred prosecution agreement (DPA), charging Alcatel-Lucent with violations of the internal controls and books and records provisions of the FCPA, and Alcatel-Lucent would pay a total criminal fine of U.S. $ 92 million—payable in four installments over the course of three years. In addition, three Alcatel-Lucent subsidiaries—Alcatel-Lucent France, Alcatel-Lucent Trade and Alcatel Centroamerica—would each plead guilty to violations of the FCPA’s antibribery, books and records and internal accounting controls provisions. The agreement with the DOJ would also contain provisions relating to a three-year French anticorruption compliance monitor. If Alcatel-Lucent fully complies with the terms of the DPA, the DOJ would dismiss the charges upon conclusion of the three-year term.
Alcatel-Lucent has recognized a provision of € 93 million in connection with these FCPA investigations, which is equivalent to the sum of U.S. $ 45.4 million as agreed upon in the agreement in principle with the SEC and U.S. $ 92 million as agreed upon in the agreement in principle with the DOJ, discounted back to net present value and converted into Euros.
b/ Taiwan
Certain employees of Taisel, a Taiwanese affiliate of Alcatel-Lucent, and Siemens’s Taiwanese distributor, along with a few suppliers and a legislative aide, have been the subject of an investigation by the Taipei Investigator’s Office of the Ministry of Justice relating to an axle counter supply contract awarded to Taisel by Taiwan Railways in 2003. It has been alleged that persons in Taisel, Alcatel-Lucent Deutschland AG (a German subsidiary of Alcatel-Lucent involved in the Taiwan Railway contract), Siemens Taiwan, and subcontractors hired by them were involved in a bid-rigging and illicit payment arrangement for the Taiwan Railways contract.
Upon learning of these allegations, Alcatel commenced an investigation into this matter. As a result of the investigation, Alcatel terminated the former president of Taisel. A director of international sales and marketing development of the German subsidiary resigned during the investigation.
On February 21, 2005, Taisel, the former president of Taisel, and others were indicted in Taiwan for violation of the Taiwanese Government Procurement Act.
On November 15, 2005, the Taipei criminal district court found Taisel not guilty of the alleged violation of the Government Procurement Act. The former President of Taisel was not judged because he was not present or represented at the proceedings. The court found two Taiwanese businessmen involved in the matter guilty of violations of the Business Accounting Act. The not guilty verdict for Taisel was upheld by the Taiwan High Court and is now final. On December 9, 2009, the Supreme Court denied the appeal filed by the Taiwan Prosecutor Office against the High Court’s ruling with respect to the individual defendants.

115
Other allegations made in connection with this matter may still be under ongoing investigation by the Taiwanese authorities.
c/ Kenya; Nigeria
The SEC and the DOJ asked Alcatel-Lucent to look into payments made in 2000 by CIT to a consultant arising out of a supply contract between CIT and a privately-owned company in Kenya. Alcatel-Lucent understands that the French authorities are also conducting an investigation to ascertain whether inappropriate payments were received by foreign public officials in connection with such project. Alcatel-Lucent is cooperating with the U.S. and French authorities and has submitted to these authorities its findings regarding those payments.
Following information voluntarily disclosed by Alcatel-Lucent to the US and French authorities, the French authorities have recently requested Alcatel-Lucent to produce further documents related to payments made by its subsidiaries to certain consultants in Nigeria. Alcatel-Lucent is cooperating with the French authorities and will submit the requested documents.
d/ French Polynesia
The French authorities have initiated an investigation of the submarine cable subsidiary of Alcatel-Lucent, Alcatel-Lucent Submarine Networks (“ALSN”), and certain former or current employees, relating to a project for a submarine cable between Tahiti and Hawaii awarded to ALSN in 2007 by the state-owned telecom agency of French Polynesia (“OPT”). On September 23, 2009, four of those employees were charged (“mis en examen”) with aiding and abetting favoritism in connection with the award by OPT of a public procurement project. On November 23, 2009, ALSN was charged with benefitting from favoritism (“recel de favoritisme”) in connection with the same alleged favoritism. Alcatel-Lucent commenced, and is continuing, an investigation into this matter.
Alcatel-Lucent is unable to predict the outcome of this investigation and its effect on ALSN’s business. If ALSN were convicted of a criminal violation, the French courts could, among other things, fine ALSN and/or ban it from participating in French public procurement contracts for a certain period. ALSN expects to generate approximately € 20 million of revenue from French public procurement contracts in 2010. Accordingly, Alcatel-Lucent does not believe that a loss of business as a result of such a ban would have a material effect on the Alcatel-Lucent group as a whole.
e/ Lucent’s employment and benefits related cases
In October 2005, a purported class action was filed by Peter A. Raetsch, Geraldine Raetsch and Curtis Shiflett, on behalf of themselves and all others similarly situated, in the U.S. District Court for the District of New Jersey. The plaintiffs alleged that Lucent failed to maintain health care benefits for retired management employees for each year from 2001 through 2006 as required by the Internal Revenue Code, the Employee Retirement Income Security Act, and the Lucent pension and medical plans. Upon motion by Lucent, the court remanded the claims to Lucent’s claims review process. A Special Committee was appointed and reviewed the claims of the plaintiffs and Lucent filed a report with the Court on December 28, 2006. The Special Committee denied the plaintiffs’ claims and the case returned to the court, where limited discovery was completed.
By Opinion and Order, each dated June 11, 2008, the court granted in part and denied in part plaintiffs’ motion for summary judgment (as to liability) and denied Lucent’s cross-motion for summary judgment (also as to liability). Specifically, the court found that Lucent had violated the Plan’s maintenance of benefits requirement with respect to the 2003 plan year but that the record before the court contained insufficient facts from which to conclude whether those provisions were violated for years prior to 2003. The court also “tentatively” ruled that defendants had not violated the Plan’s maintenance of cost provisions for the years 2004 through 2006. The court ordered the parties to engage in further discovery proceedings. Finally, the court denied, without prejudice, plaintiff’s motion for class certification. On June 26, 2008, Lucent requested the court to certify the case for appeal to the Third Circuit Court of Appeals in its discretion. This request was denied.
As a result of the court’s findings for 2003, Lucent established a provision for U.S. $ 27 million during the second quarter of 2008. As a result of the ongoing discovery and analysis, this reserve was adjusted from time to time, most recently to U.S. $ 28 million as of September 30, 2009. On January 21, 2010, the parties agreed to settle the lawsuit for the sum of U.S. $ 36 million. The settlement is memorialized in a binding and executed Settlement Term Sheet, which contemplates execution of a formal settlement agreement. The settlement is subject to court approval, including approval of the settlement amount and the amount of class counsel’s fees to be deducted therefrom, approval of a plan of allocation of the net settlement proceeds to class members, and certification of a settlement class by the court.
Lucent implemented various actions to address the rising costs of providing retiree health care benefits and the funding of Lucent pension plans. These actions led to the filing of cases against Lucent (now closed) and may lead to the filing of additional cases.

116
f/ Intellectual property cases
Each of Alcatel-Lucent, Lucent and certain other entities of the Group is a defendant in various cases in which third parties claim infringement of their patents, including certain cases where infringement claims have been made against its customers in connection with products the applicable Alcatel-Lucent entity has provided to them, or challenging the validity of certain patents.
Microsoft
Lucent, Microsoft and Dell have been involved in a number of patent lawsuits in various jurisdictions. In the summer of 2003, certain Dell and Microsoft lawsuits in San Diego, California, were consolidated in federal court in the Southern District of California. The court scheduled a number of trials for groups of the Lucent patents, including two trials held in 2008. In one of these trials, on April 4, 2008, a jury awarded Alcatel-Lucent approximately U.S. $ 357 million in damages for Microsoft’s infringement of the “Day” patent, which relates to a computerized form entry system. On June 19, 2008, the Court entered judgment on the verdict and also awarded prejudgment interest exceeding U.S. $ 140 million. The total amount awarded Alcatel-Lucent relating to the Day patent exceeds U.S. $ 497 million.
On December 15, 2008, Microsoft and Alcatel-Lucent executed a settlement and license agreement whereby the parties agreed to settle the majority of their outstanding litigations. This settlement included dismissing all pending patent claims in which Alcatel-Lucent is a defendant and provided Alcatel-Lucent with licenses to all Microsoft patents-in-suit in these cases. Also, on May 13, 2009, Alcatel-Lucent and Dell agreed to a settlement and dismissal of the appeal issues relating to Dell from the April 2008 trial. Only the appeal relating to the Day patent against Microsoft filed by it, and the appeal filed by Lucent relating to the district court’s decision to dismiss certain additional claims with respect to the Day patent, remain currently pending in the Court of Appeals for the Federal Circuit. Oral Argument was held at the Federal Circuit in Washington, D.C. on June 2, 2009.
On September 11, 2009, the Federal Circuit issued its opinion affirming that the Day patent is both a valid patent and infringed by Microsoft in Microsoft Outlook, Microsoft Money, and Windows Mobile products. However, the Federal Circuit vacated the jury’s damages award and ordered a new trial in the District Court in San Diego to re-calculate the amount of damages owed to Alcatel-Lucent for Microsoft’s infringement. On November 23, 2009, the Federal Circuit denied Microsoft’s en banc petition for a rehearing on the validity of the Day patent. A date has not been set for the new trial on damages.
In a parallel proceeding, Dell filed a re-examination of the Day patent with the United States Patent and Trademark Office (“Patent Office”) in May of 2007 alleging that prior art existed that was not previously considered in the original examination and the Day patent should therefore be re-examined for patentability. On June 22, 2009, the Patent Office issued its latest advisory opinion rejecting the two claims of the Day patent at issue in the April 2008 trial in view of the prior art. Alcatel-Lucent appealed that decision and, in response to Alcatel-Lucent’s opening Appeal Brief to the Board of Patent Appeals and Interferences, the Patent Office has withdrawn its rejection of the Day patent and has confirmed that the Day patent is a valid patent.
g/ Effect of the Various Proceedings
Governmental investigations and legal proceedings are subject to uncertainties and the outcomes thereof are difficult to predict. Consequently, Alcatel-Lucent is unable to estimate the ultimate aggregate amount of monetary liability or financial impact with respect to these matters. Because of the uncertainties of government investigations and legal proceedings, one or more of these matters could ultimately result in material monetary payments by Alcatel-Lucent beyond those to be made by reason of the various settlement agreements described in this Note 34.
NOTE 35 EVENTS AFTER THE STATEMENT OF FINANCIAL POSITION DATE
There were no events that have a material impact on financial status that occurred between the statement of financial position date and February 9, 2010, the date when the Board of Directors authorized the consolidated financial statements for issue.

117
NOTE 36 MAIN CONSOLIDATED COMPANIES
Company Country %
control %
interest Consolidation
method
Alcatel-Lucent (2) (3) France Parent company
Operating companies (1)
Alcatel-Lucent Australia Limited Australia Full consolidation
Alcatel-Lucent Austria AG Austria Full consolidation
Alcatel-Lucent Bell NV Belgium Full consolidation
Alcatel-Lucent Brasil S/A Brazil Full consolidation
Alcatel-Lucent Canada Inc. Canada Full consolidation
Alcatel-Lucent Deutschland AG Germany Full consolidation
Alcatel-Lucent Enterprise France Full consolidation
Alcatel-Lucent España S.A. Spain Full consolidation
Alcatel-Lucent France France Full consolidation
Alcatel-Lucent India Limited India Full consolidation
Alcatel-Lucent Italia S.p.A. Italy Full consolidation
Alcatel-Lucent Mexico S.A. de C.V. Mexico Full consolidation
Alcatel-Lucent Nederland B.V. The Netherlands Full consolidation
Alcatel-Lucent Portugal SA Portugal Full consolidation
Alcatel-Lucent Schweiz AG Switzerland Full consolidation
Alcatel-Lucent Shanghai Bell Co, Ltd China 50 50 Full consolidation (4)
Alcatel-Lucent Submarine Networks France Full consolidation
Alcatel-Lucent Telecom Limited U.K. Full consolidation
Alcatel-Lucent Teletas Telekomunikasyon A.S. Turkey Full consolidation
Alcatel-Lucent USA Inc. U.S.A. Full consolidation
Alda Marine France 51 51 Proportionate (5)
Genesys Telecommunications Laboratories, Inc. U.S.A. Full consolidation
LGS Innovations LLC U.S.A. Full consolidation
Holdings
Financial Holdings
Alcatel-Lucent Holdings Inc. U.S.A. Full consolidation
Alcatel-Lucent NV The Netherlands Full consolidation
Alcatel-Lucent Participations France Full consolidation
Compagnie Financière Alcatel-Lucent France Full consolidation
Coralec France Full consolidation
Florelec France Full consolidation
Financial Services
Electro Banque France Full consolidation
Electro Ré Luxemburg Full consolidation
(1) Percentages of control and interest equal 100% unless otherwise specified. (2) Publicly traded. (3) The activities of Alcatel-Lucent, as the parent company, are included under the business segment “Other”. (4) Entity controlled by the Group holding 50% plus one share. (5) Entity jointly controlled with Louis Dreyfus & associés holding the 49% remaining shares.

118
NOTE 37 QUARTERLY INFORMATION (UNAUDITED)
Consolidated income statements
2009 (in millions of euros - except per share information) Q1 Q2 Q3 Q4 Total
Revenues 3,598 3,905 3,687 3,967 15,157
Cost of sales (2,465) (2,612) (2,455) (2,514) (10,046)
Gross profit 1,133 1,293 1,232 1,453 5,111
Administrative and selling expenses (768) (769) (699) (677) (2,913)
Research and development expenses before capitalization of development expenses (691) (655) (610) (571) (2,527)
Impact of capitalization of development expenses - 1 1 2 4
Research and development costs (691) (654) (609) (569) (2,523)
Income (loss) from operating activities before restructuring costs, impairment of assets, gain/(loss) on disposal of consolidated entities, litigations and post-retirement benefit plan amendments (326) (130) (76) 207 (325)
Restructuring costs (78) (123) (136) (268) (605)
Litigations - - - (109) (109)
Impairment of assets - - - - -
Gain/(loss) on disposal of consolidated entities - - - 99 99
Post-retirement benefit plan amendments (2) 1 38 211 248
Income (loss) from operating activities (406) (252) (174) 140 (692)
Interest relative to gross financial debt (84) (74) (72) (83) (313)
Interest relative to cash and cash equivalents 22 16 8 13 59
Finance costs (62) (58) (64) (70) (254)
Other financial income (loss) 49 93 49 58 249
Share in net income (losses) of equity affiliates (9) 3 2 5 1
Income (loss) before income tax, related reduction of goodwill and discontinued operations (428) (214) (187) 133 (696)
Reduction of goodwill related to deferred tax assets initially unrecognized - - - -
Income tax, (charge) benefit 6 87 8 (41) 60
Income (loss) from continuing operations (422) (127) (179) 92 (636)
Income (loss) from discontinued operations - 129 - 3 132
NET INCOME (LOSS) (422) 2 (179) 95 (504)
Attributable to:
• Equity owners of the parent (402) 14 (182) 46 (524)
• Non-controlling interests (20) (12) 3 49 20
Net income (loss) attributable to the equity owners of the parent per share (in euros/U.S. dollars)
• Basic earnings per share (0.18) 0.01 (0.08) 0.02 (0.23)
• Diluted earnings per share (0.18) 0.01 (0.08) 0.02 (0.23)
Net income (loss) (before discontinued operations) attributable to the equity owners of the parent per share (in euros/U.S. dollars)
• Basic earnings per share (0.18) (0.05) (0.08) 0.02 (0.29)
• Diluted earnings per share (0.18) (0.05) (0.08) 0.02 0.29)
Net income (loss) of discontinued operations per share (in euros/U.S. dollars)
• Basic earnings per share 0.00 0.06 0.00 0.00 0.06
• Diluted earnings per share 0.00 0.05 0.00 0.00 0.06

119
2008 (in millions of euros) Q1 Q2 Q3 Q4 Total
Revenues 3,864 4,101 4,065 4,954 16,984
Cost of sales (2,467) (2,669) (2,746) (3,308) (11,190)
Gross profit 1,397 1,432 1,319 1,646 5,794
Administrative and selling expenses (795) (751) (740) (807) (3,093)
Research and development expenses before capitalization of development expenses (741) (726) (685) (706) (2,858)
Impact of capitalization of development expenses 33 24 21 23 101
Research and development costs (708) (702) (664) (683) (2,757)
Income (loss) from operating activities before restructuring costs, impairment of assets, gain/(loss) on disposal of consolidated entities and post-retirement benefit plan amendments (106) (21) (85) 156 (56)
Restructuring costs (122) (265) (94) (81) (562)
Impairment of assets - (810) (5) (3,910) (4,725)
Gain/(loss) on disposal of consolidated entities (1) - - (6) (7)
Post-retirement benefit plan amendments - (18) 63 2 47
Income (loss) from operating activities (229) (1,114) (121) (3,839) (5,303)
Interest relative to gross financial debt (96) (95) (97) (103) (391)
Interest relative to cash, cash equivalents 48 45 45 41 179
Finance costs (48) (50) (52) (62) (212)
Other financial income (loss) 93 100 119 54 366
Share in net income (losses) of equity affiliates 28 28 28 12 96
Income(loss) before income tax, related reduction of goodwill and discontinued operations (156) (1,036) (26) (3,835) (5,053)
Reduction of goodwill related to deferred tax assets initially unrecognized - - - - -
Income tax (19) (50) (10) (74) (153)
Income (loss) from continuing operations (175) (1,086) (36) (3,909) (5,206)
Income (loss) from discontinued operations - - (2) 35 33
NET INCOME (LOSS) (175) (1,086) (38) (3,874) (5,173)
attributable to:
• Equity owners of the parent (181) (1,102) (40) (3,892) (5,215)
• Non-controlling interests 6 16 2 18 42
Net income (loss) attributable to the equity owners of the parent per share (in euros)
• Basic earnings per share (0.08) (0.49) (0.02) (1.72) (2.31)
• Diluted earnings per share (0.08) (0.49) (0.02) (1.72) (2.31)
Net income (loss) before discontinued operations attributable to the equity owners of the parent per share F(in euros)
• Basic earnings per share (0.08) (0.49) (0.02) (1.73) (2.32)
• Diluted earnings per share (0.08) (0.49) (0.02) (1.73) (2.32)
Net income (loss) of discontinued operations per shareF (in euros)
• Basic earnings per share 0.00 0.00 0.00 0.01 0.01
• Diluted earnings per share 0.00 0.00 0.00 0.01 0.01
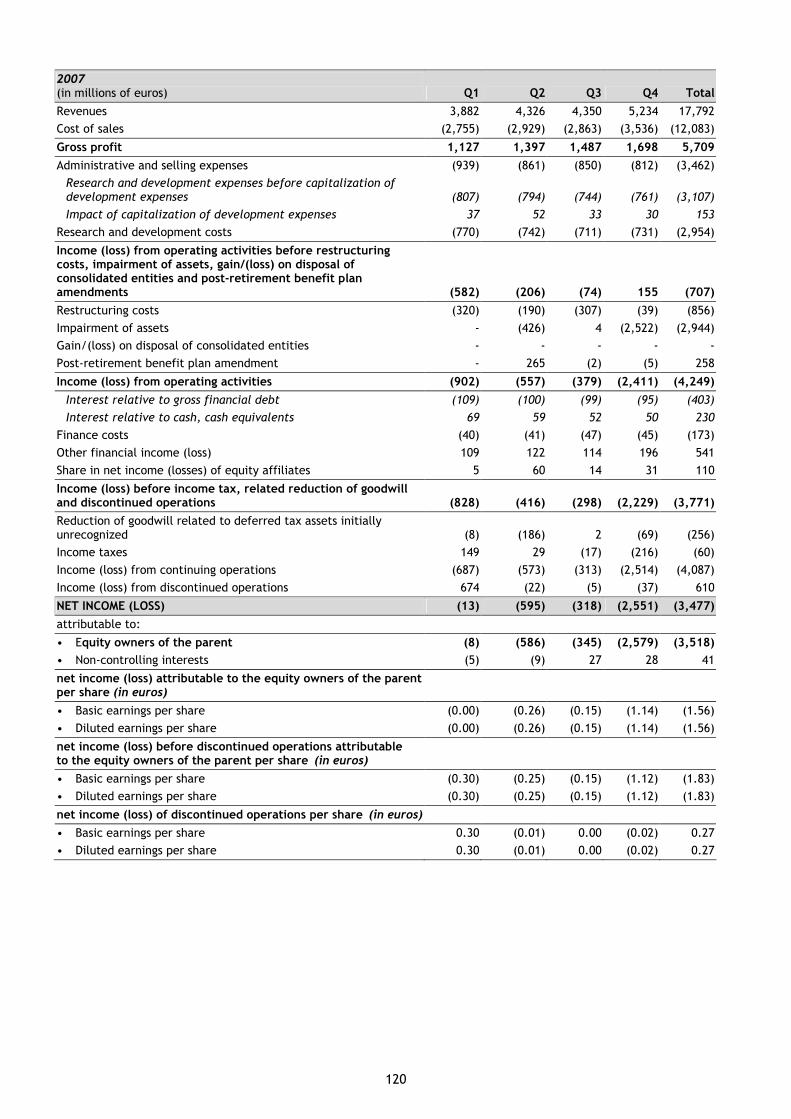
120
2007 (in millions of euros) Q1 Q2 Q3 Q4 Total
Revenues 3,882 4,326 4,350 5,234 17,792
Cost of sales (2,755) (2,929) (2,863) (3,536) (12,083)
Gross profit 1,127 1,397 1,487 1,698 5,709
Administrative and selling expenses (939) (861) (850) (812) (3,462)
Research and development expenses before capitalization of development expenses (807) (794) (744) (761) (3,107)
Impact of capitalization of development expenses 37 52 33 30 153
Research and development costs (770) (742) (711) (731) (2,954)
Income (loss) from operating activities before restructuring costs, impairment of assets, gain/(loss) on disposal of consolidated entities and post-retirement benefit plan amendments (582) (206) (74) 155 (707)
Restructuring costs (320) (190) (307) (39) (856)
Impairment of assets - (426) 4 (2,522) (2,944)
Gain/(loss) on disposal of consolidated entities - - - - -
Post-retirement benefit plan amendment - 265 (2) (5) 258
Income (loss) from operating activities (902) (557) (379) (2,411) (4,249)
Interest relative to gross financial debt (109) (100) (99) (95) (403)
Interest relative to cash, cash equivalents 69 59 52 50 230
Finance costs (40) (41) (47) (45) (173)
Other financial income (loss) 109 122 114 196 541
Share in net income (losses) of equity affiliates 5 60 14 31 110
Income (loss) before income tax, related reduction of goodwill and discontinued operations (828) (416) (298) (2,229) (3,771)
Reduction of goodwill related to deferred tax assets initially unrecognized (8) (186) 2 (69) (256)
Income taxes 149 29 (17) (216) (60)
Income (loss) from continuing operations (687) (573) (313) (2,514) (4,087)
Income (loss) from discontinued operations 674 (22) (5) (37) 610
NET INCOME (LOSS) (13) (595) (318) (2,551) (3,477)
attributable to:
• Equity owners of the parent (8) (586) (345) (2,579) (3,518)
• Non-controlling interests (5) (9) 27 28 41
net income (loss) attributable to the equity owners of the parent per share (in euros)
• Basic earnings per share (0.00) (0.26) (0.15) (1.14) (1.56)
• Diluted earnings per share (0.00) (0.26) (0.15) (1.14) (1.56)
net income (loss) before discontinued operations attributable to the equity owners of the parent per shareF(in euros)
• Basic earnings per share (0.30) (0.25) (0.15) (1.12) (1.83)
• Diluted earnings per share (0.30) (0.25) (0.15) (1.12) (1.83)
net income (loss) of discontinued operations per shareF(in euros)
• Basic earnings per share 0.30 (0.01) 0.00 (0.02) 0.27
• Diluted earnings per share 0.30 (0.01) 0.00 (0.02) 0.27