Embed Size (px)
Citation preview

The Australian Level Crossing Assessment Model
ALCAM in Detail
An Introduction to the new ALCAM models (2014)
30th August 2016
Page 2 of 31 Updated 30/08/2016
Contents 1. Summary ....................................................................................................................................... 3
2. Introduction .................................................................................................................................. 5
3. Risk ................................................................................................................................................ 6
4. ALCAM process ............................................................................................................................. 7
5. Structure of the ALCAM road model ............................................................................................ 9
5.1. Infrastructure Model ....................................................................................................... 9
5.2. Exposure Model ............................................................................................................. 12
5.3. Consequence Model ...................................................................................................... 13
5.4. ALCAM Risk Score .......................................................................................................... 15
6. Interpreting ALCAM output ........................................................................................................ 16
6.1. Relative ranking bands ................................................................................................... 16
6.2. Metrics used .................................................................................................................. 16
6.3. Flags ............................................................................................................................... 17
7. Treatment ................................................................................................................................... 18
8. Data management and LXM ....................................................................................................... 19
9. History of ALCAM ........................................................................................................................ 20
10. The future of ALCAM .................................................................................................................. 23
Appendix A: References ..................................................................................................................... 24
Appendix B: Road level crossing – Model inputs and outputs ........................................................... 26
Appendix C: Pedestrian level crossing – Model inputs and outputs .................................................. 28
Appendix D: ALCAM definitions and acronyms.................................................................................. 30
Page 3 of 31 Updated 30/08/2016
1. Summary The Australian Level Crossing Assessment Model (ALCAM) is an assessment tool used to identify key potential risks at level crossings and to assist in the prioritisation of crossings for upgrades. The risk model is used to support a decision making process for both road and pedestrian level crossings and to help determine the most cost effective treatments. At the May 2003 Australian Transport Council (ATC) meeting all state and territory transport ministers agreed to adopt this innovative method of risk assessment. ALCAM is currently applied across all Australian States and in New Zealand. The model is overseen by a committee of representatives from the various jurisdictions of these countries to ensure its consistency of development and application. The ALCAM road model comprises of three separate components: the Infrastructure model, the Exposure model and the Consequence model. When combined, these three components produce a unique risk score for each level crossing. The ALCAM pedestrian model is somewhat simpler and has a less sophisticated Exposure model. It does not include a Consequence model. This document concentrates primarily on the ALCAM road model. The weightings of the Infrastructure and Consequence Models within the ALCAM road model have been determined through both accident analysis and through a series of workshops by an expert group. This group has included representatives from each mainland state of Australia. In excess of 100 individuals, primarily from Australia’s road and rail jurisdictions, have been involved in the development of ALCAM from its conception in 1999 through to the present. All three components of the ALCAM model have been validated against a combined dataset of 10 years of Australian and New Zealand level crossing collision data. ALCAM can be used to:
highlight where specific risks or deficiencies exist
quantify the expected consequences of an accident
quantify the probability of an accident
compare the relative risk between crossings within a region or jurisdiction
model the effect of treatments to address these risks. An integrated data management system (the Level Crossing Management System – LXM) is used to provide for the effective management of ALCAM data as well as other important information. LXM contains a number of additional reporting and modelling tools to assist with the overall decision-making process. The model should be applied by road and railway engineers trained in the use of ALCAM. Although it is a comprehensive tool for the assessment of level crossing hazards, ALCAM cannot be applied in isolation and does not preclude the need for sound engineering judgement. Any risk assessment and treatment also needs to consider other factors, including:
Collision and near-collision history
Engineering experience (both rail and road)
Local knowledge of driver or pedestrian behaviour
Social and economic assessment
Standards and international best practice

Page 4 of 31 Updated 30/08/2016
ALCAM does not provide warrants for upgrades or attempt to define a ‘safe’ or acceptable level of risk. This is a decision for each jurisdiction and will depend on the standard of existing crossings, upgrade budgets and the level of risk that they are prepared to tolerate. It is also very important to ensure that all stakeholders associated with the particular level crossing are involved with the determination of the final recommended treatment.
NOTE: In October 2012 work commenced to redesign, upgrade and improve LXM/ALCAM. The LXM/ALCAM system is made up of three components, the Infrastructure Model, the Exposure Model and the Consequence Model, as described in the following text. The new version of LXM/ALCAM was released as a web-based facility in November 2014.

Page 5 of 31 Updated 30/08/2016
2. Introduction Each state and territory in Australia and New Zealand is responsible for road and rail transport regulation within its jurisdiction. Each jurisdiction has a level crossing safety strategy committee comprising high-level management representation from both road and rail authorities. These committees are chartered with the continuing improvement of safety at level crossings within their jurisdiction. The major difficulty in addressing risks at level crossings is the determination of how to achieve the optimal results with the available resources. Various methods of level crossing analysis were utilised involving basic risk allocation combined with the accident history at the site. These methods were often subjective and were not robust enough to adequately address some of the more complex safety hazards or compare different risks. A tool which consistently assessed the characteristics at each level crossing was required to effectively determine priorities when addressing safety hazards at these level crossings. A project team was formed to establish such a tool. This was known as ALCAM and the model has undergone a variety of improvements to reach the stage it is at today. The main benefits of ALCAM and the LXM system include:
The provision of a level crossing asset management database
Best practice risk assessment methods that include site conditions, exposure, consequence and total risk
The identification of specific risk characteristics
The ability to objectively rank level crossings within a jurisdiction or region
Assessment of the overall effects of proposed treatments
The capacity to measure the reduction or elimination of road-rail interface risk as defined by the National Transport Commission (NTC) Model Rail Safety Bill 2006 and the various jurisdictions rail safety legislation
A means by which road and rail authorities can liaise with each other in respect of their individual and joint legislative and public risk reduction responsibilities
Model output in common quantitative terms (probability and expected fatalities), enabling cost-benefit analysis and integration into road funding models
The capacity for each railway crossing safety dollar to be spent where it can best generate the greatest safety improvement.
Through the Australian Transport Council of Ministers (ATC) and the Standing Committee of Transport (SCOT – now SCOTI) all state and territory transport ministers agreed to adopt the Australian Level Crossing Assessment Model. ALCAM is overseen by a committee (the National ALCAM Group) of representatives from these states and territories and New Zealand to ensure its consistency of development and application.

Page 6 of 31 Updated 30/08/2016
3. Risk Risk (effect of uncertainty on objectives) is widely known and accepted as the combination of both the likelihood (probability or frequency) of the occurrence of an event and the resulting consequence (outcome or impact) of that event once it has taken place. The risk management process follows the series of steps outlined in the International Standard ISO 31000:2009 (Figure 1).
Figure 1 - ISO31000 risk management process
The risk evaluation process should consider all elements outlined in ISO 31000. It involves communication and consultation with a wide range of technical experts as well as the local stakeholders at individual level crossings. ALCAM is used to identify, analyse and evaluate the risks inherent at level crossings as well as giving a determination of the adequacy of proposed treatments for the risks. The model and the results produced from the model are regularly monitored and under a process of continual review and improvement. ALCAM has a scope that is limited to the likelihood and immediate consequences of a collision at a level crossing. In accordance with the principles in ISO 31000, the user needs to appreciate the limitations of ALCAM and understand the wider external context in which the risks will be managed. This context could include a high accident record at the site, key drivers of stakeholders and the wider consequences of an accident (i.e. risk to reputation, economic loss, and consequential delay on the road or rail network). In line with safety risk modelling principles, ALCAM looks at risk from the viewpoint of consideration of loss (negative consequence) only as opposed to risk and reward (loss and gain). The model considers both qualitative and quantitative characteristics as well as assessing the impact of physical properties (characteristics and controls) including consideration of the related common human behaviours. The model allocates weightings to each characteristic in relation to how it would contribute to a collision and assesses what impact the existing controls would have on these characteristics.

Page 7 of 31 Updated 30/08/2016
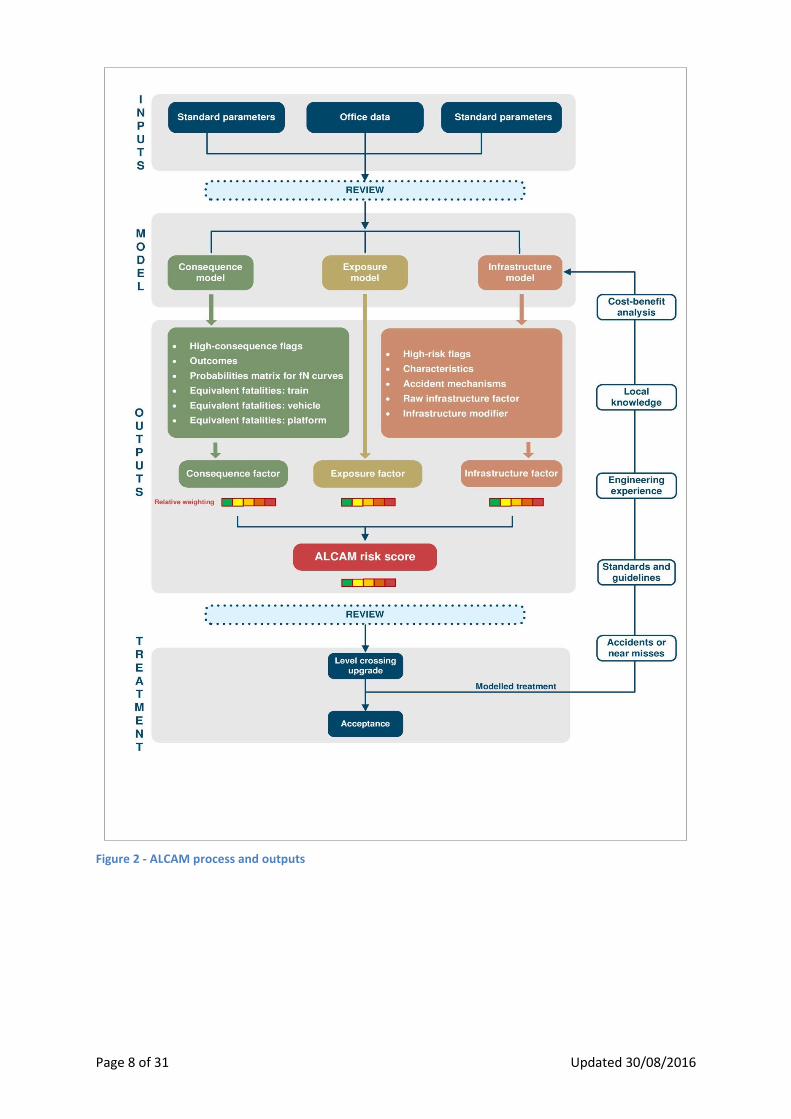
4. ALCAM process The ALCAM process involves the collection of data through a combination of level crossing surveys and train and vehicle information from the respective rail and road authorities. Each level crossing is assessed uniformly using a standardised procedure to gather and interpret level crossing data. Once the data is collected and entered into ALCAM, reports can be run to produce a priority listing, which can be used as the basis for determining safety improvement programs. The user can then enter potential treatment options into ALCAM as “proposals”. ALCAM then models the relative reductions in risk and produces a treatment report. The proposals as outlined in this report are then discussed at a stakeholder meeting, where the highlighted hazards and proposed treatments are combined with any site specific hazards and treatments. This process ensures that level crossings are addressed on a consistent priority basis, appropriate and cost-effective treatments are chosen and that all safety hazards have been addressed. The ALCAM process is represented graphically in Figure 2. This shows the flow of information through from data collection to model output, and illustrates how these feed into the stakeholder review and physical safety improvements. Depending on the ALCAM Risk Score, Infrastructure Factor, stakeholder analysis of site specific features and any other influencing factors, decisions can then be made on the need for treatment or for the type of treatment. This may be in the form of state-wide upgrade programs or through a local review between road and rail stakeholders.
Page 8 of 31 Updated 30/08/2016
Figure 2 - ALCAM process and outputs

Page 9 of 31 Updated 30/08/2016
5. Structure of the ALCAM road model The ALCAM road model comprises of three separate components: the Infrastructure Model, the Exposure Model and the Consequence Model. Each of these models has a single ‘factor’ as an output that, when combined, produces a risk score for each level crossing:
ALCAM Risk Score = Infrastructure Factor x Exposure Factor x Consequence Factor
The Infrastructure Factor is the output of a complex scoring algorithm that considers how physical properties at each site will affect human behaviours. This factor modifies the accident probability per year to reflect unique site conditions. The Exposure Factor is a function of control type, vehicle (or pedestrian) volumes and train volumes. This is expressed as an accident probability per year. Multiplying the Infrastructure Factor by the Exposure Factor will give the actual annual probability of an accident at a particular level crossing. The Consequence Factor is the expected outcome in the event of a collision and includes deaths and injuries on both the train and vehicle. This is expressed in terms of equivalent fatalities per collision. For pedestrian level crossings the Consequence Factor is fixed. The ALCAM Risk Score is expressed in terms of an expected number of equivalent fatalities per year. An equivalent fatality is a combination of all types of harm using the ratio:
1 fatality = 10 serious injuries = 200 minor injuries The mechanics of the ALCAM model have been illustrated graphically in Figure 3.
Figure 3 - Structure of the ALCAM model
5.1. Infrastructure Model
ALCAM Risk Score = Infrastructure Factor x Exposure Factor x Consequence Factor
Page 10 of 31 Updated 30/08/2016
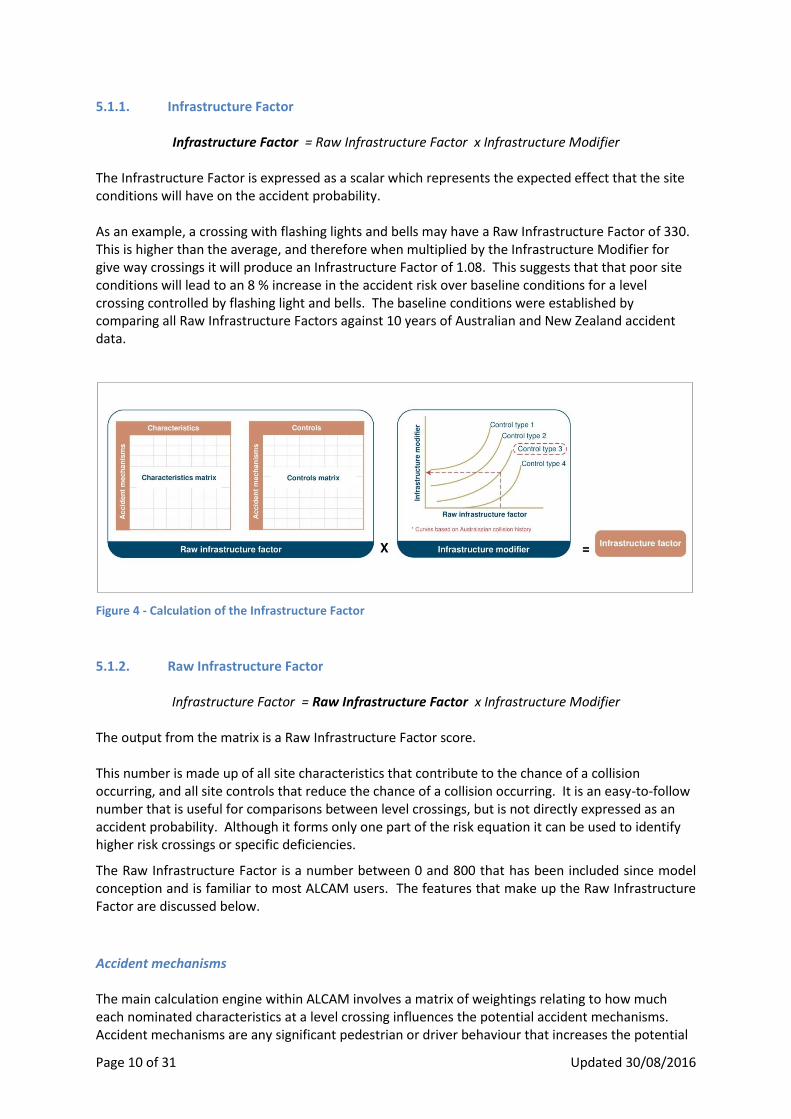
5.1.1. Infrastructure Factor
Infrastructure Factor = Raw Infrastructure Factor x Infrastructure Modifier The Infrastructure Factor is expressed as a scalar which represents the expected effect that the site conditions will have on the accident probability. As an example, a crossing with flashing lights and bells may have a Raw Infrastructure Factor of 330. This is higher than the average, and therefore when multiplied by the Infrastructure Modifier for give way crossings it will produce an Infrastructure Factor of 1.08. This suggests that that poor site conditions will lead to an 8 % increase in the accident risk over baseline conditions for a level crossing controlled by flashing light and bells. The baseline conditions were established by comparing all Raw Infrastructure Factors against 10 years of Australian and New Zealand accident data.
Figure 4 - Calculation of the Infrastructure Factor
5.1.2. Raw Infrastructure Factor
Infrastructure Factor = Raw Infrastructure Factor x Infrastructure Modifier The output from the matrix is a Raw Infrastructure Factor score. This number is made up of all site characteristics that contribute to the chance of a collision occurring, and all site controls that reduce the chance of a collision occurring. It is an easy-to-follow number that is useful for comparisons between level crossings, but is not directly expressed as an accident probability. Although it forms only one part of the risk equation it can be used to identify higher risk crossings or specific deficiencies.
The Raw Infrastructure Factor is a number between 0 and 800 that has been included since model conception and is familiar to most ALCAM users. The features that make up the Raw Infrastructure Factor are discussed below.
Accident mechanisms The main calculation engine within ALCAM involves a matrix of weightings relating to how much each nominated characteristics at a level crossing influences the potential accident mechanisms. Accident mechanisms are any significant pedestrian or driver behaviour that increases the potential

Page 11 of 31 Updated 30/08/2016
for a collision with a train to occur. The model also determines the impact the existing controls would have on these accident mechanisms. Significant and practical accident mechanisms, characteristics and controls have been considered and included through a process of seeking expert opinion through a series of workshops and interviews. The full listing of characteristics, controls and accident mechanisms for both road and pedestrian level crossings can be found in Appendix C and D respectively. Accident mechanisms have been grouped into the following categories:
where the level crossing user is unaware of the dangerous situation.
where the level crossing user is unable to avoid the dangerous situation.
where the level crossing user is unwilling to recognise the dangerous situation.
Each of these mechanisms is then weighted based on a six by six probability matrix. A mechanism’s weighting is calculated as the product of the occurrence and collision probability rating (weighting score between 1 and 36). The “occurrence probability” is a measure of how often the accident mechanism is likely to occur. The “collision probability” is a measure of the likelihood of an incident if the accident mechanism does occur.
Characteristics and controls A characteristic is defined as any feature of a roadway or railway which may have an influence on pedestrian or driver behaviour (accident mechanisms). Characteristics include items such as sighting distance, speed of trains, stacking distance, or the distance to adjacent intersections. Controls are devices that reduce the risk of an accident by changing pedestrian or driver behaviour. These include measures such as flashing warning lights, boom gates, signage, or improved road alignment. A control could also include education and law enforcement campaigns.
Weightings matrix A matrix has been constructed to represent the effect each characteristic would have on each accident mechanism. Some characteristics may have no causal effect on a particular accident mechanism, whilst some may have a partial effect. If a characteristic is the only contributor to a given mechanism then the percentage weighting will be 100%. The total percentage effect for each mechanism must total 100%. A similar matrix exists to determine the effect that controls will have on reducing the likelihood of an accident mechanism occurring. Since the development of the original matrix, several workshops have been held to both add and remove accident mechanisms, characteristics and controls. The need for these changes has generally risen from concerns and recommendations that have been raised by users of the model. The current version of the matrix produces results, which have been shown to accurately reflect the current hazard profile at each site. This has been determined through a detailed analysis and comparison of the results of a number of sample sites across each of the major Australian States in combination with a review of model outputs against collision data.

Page 12 of 31 Updated 30/08/2016
Sensitivity In the Infrastructure Model there are particular characteristics which have a greater influence on the overall risk profile at each level crossing. These characteristics include limited sighting of trains (at passive sites), limited approach sighting, queuing and short stacking, proximity to shunting yards and stations, high percentage of heavy vehicles and a hump or dip across the tracks. It is these highly sensitive characteristics that have the greatest influence on whether or not a level crossing will be prioritised for safety improvement works. These highly sensitive characteristics are also flagged in the model output. The high sensitivity characteristics have all been validated against 10 years of Australian and New Zealand accident data (~2000-2009) using correlation techniques (ARRB (2011)) and multi-linear regression (ITSR, NSW (2011)). Some of the less sensitive characteristics do not appear to have a statistical influence in the collision records, and so have been down-weighted but still included in ALCAM.
5.1.3. Infrastructure Modifier
Infrastructure Factor = Raw Infrastructure Factor x Infrastructure Modifier To turn the Raw Infrastructure Factor into a scale factor to modify accident probability for site infrastructure properties (the Infrastructure Factor) it is necessary to multiply it by an Infrastructure Modifier. The modifier is a linear equation that was determined by correlating 10 years of accident data against the Raw Infrastructure Factors for all jurisdictions (normalised by vehicle and train volumes). There is a separate Infrastructure Modifier for each type of level crossing control and each Infrastructure Modifier is distributed around 1.
5.2. Exposure Model
ALCAM Risk Score = Infrastructure Factor x Exposure Factor x Consequence Factor
The Exposure Factor is a function of control type, vehicle volumes and train volumes. It represents the baseline likelihood of an accident at a level crossing, excluding site-specific conditions that are captured in the Infrastructure Model. The Exposure Factor is expressed as an accident probability per year. In 2011, the ALCAM Committee commissioned a study to assess the relationship between vehicle (V) and train (T) volumes in respect to the risk of an accident (ITSR, NSW (2011)). To do this, the study used 10 years of Australian and New Zealand accident data. Different exposure modelling approaches from Australia, UK, and USA were investigated and a ‘logit’ analysis of the combined accident data was carried out. The report found that conventional ‘linear’ approach (VxT) that was historically used in ALCAM did not best replicate the observed collision record. In addition, the type of control at the crossing was a critical factor in determining the expected collision rate. The report recommended that ALCAM adopt the Peabody-Dimmick Formula, an exposure modelling approach that was first developed in 1941 and has been subsequently used in the US. Since 1941 road accident rates in general have decreased considerably. As a result the actual collision rates predicted by the Peabody Dimmick formulation are an order of magnitude too high. This can be
Page 13 of 31 Updated 30/08/2016
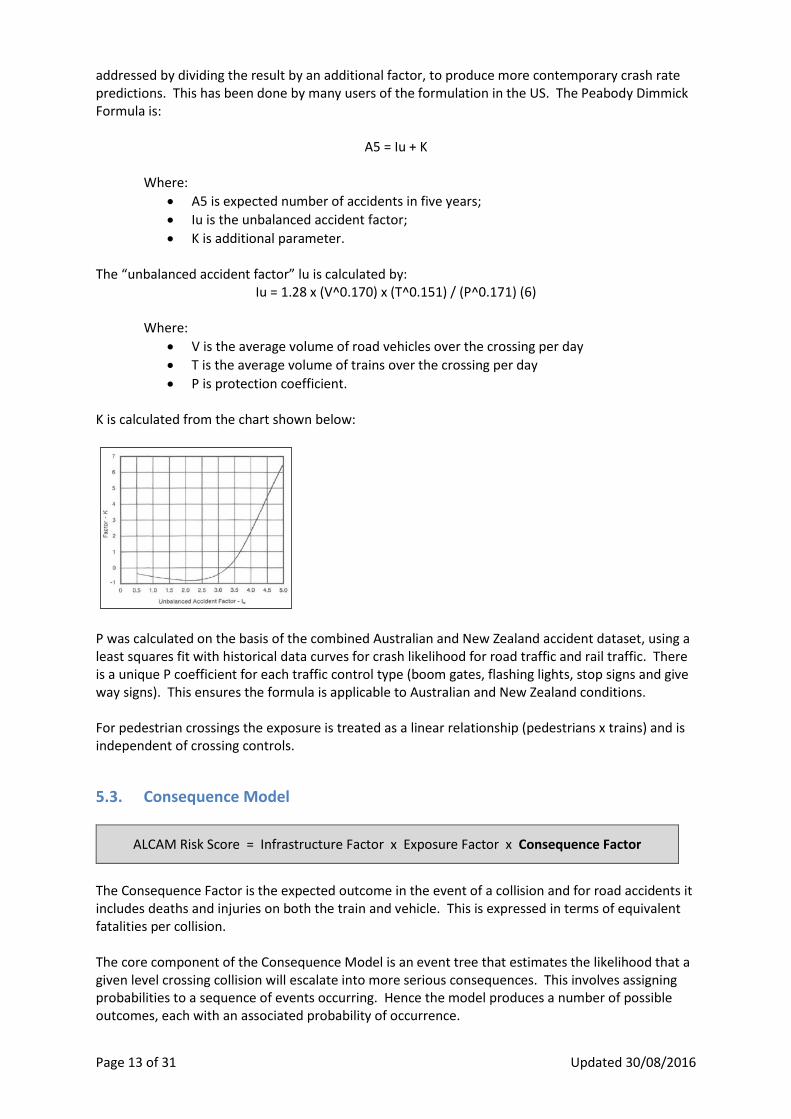
addressed by dividing the result by an additional factor, to produce more contemporary crash rate predictions. This has been done by many users of the formulation in the US. The Peabody Dimmick Formula is:
A5 = Iu + K
Where:
A5 is expected number of accidents in five years;
Iu is the unbalanced accident factor;
K is additional parameter. The “unbalanced accident factor” lu is calculated by:
Iu = 1.28 x (V^0.170) x (T^0.151) / (P^0.171) (6)
Where:
V is the average volume of road vehicles over the crossing per day
T is the average volume of trains over the crossing per day
P is protection coefficient. K is calculated from the chart shown below:
P was calculated on the basis of the combined Australian and New Zealand accident dataset, using a least squares fit with historical data curves for crash likelihood for road traffic and rail traffic. There is a unique P coefficient for each traffic control type (boom gates, flashing lights, stop signs and give way signs). This ensures the formula is applicable to Australian and New Zealand conditions. For pedestrian crossings the exposure is treated as a linear relationship (pedestrians x trains) and is independent of crossing controls.
5.3. Consequence Model
ALCAM Risk Score = Infrastructure Factor x Exposure Factor x Consequence Factor
The Consequence Factor is the expected outcome in the event of a collision and for road accidents it includes deaths and injuries on both the train and vehicle. This is expressed in terms of equivalent fatalities per collision. The core component of the Consequence Model is an event tree that estimates the likelihood that a given level crossing collision will escalate into more serious consequences. This involves assigning probabilities to a sequence of events occurring. Hence the model produces a number of possible outcomes, each with an associated probability of occurrence.

Page 14 of 31 Updated 30/08/2016
Each outcome at the end of the ‘branch’ has an associated number of fatalities, serious injuries, and minor injuries. Using common Australian ratios, these are combined and expressed as ‘equivalent fatalities’. The event probabilities and outcomes are based on site conditions, overseas experience and historic derailment history. These have been compared against Australian and New Zealand accident data to help ensure that the model is realistic. The model takes account of the whole range of possible occurrences to produce a single Consequence Factor. This represents the expected loss if a collision occurs. Note that the expected loss is not a worst-case scenario, but is instead a combination of the lower-probability-higher-consequence and the higher-probability-lower-consequence events. The Consequence Model records the full range of possible outcomes and the associated probabilities. If required, this can be used to produce F-N diagrams for an individual level crossing. F-N curves are a common risk assessment tool used in industries where an accident outcome can vary significantly (i.e. aviation). They are not commonly used by road authorities, but are used far more widely in the rail industry. There are a number of considerations in the event tree, including the:
type of train including passenger and dangerous goods
type of road vehicle including dangerous goods and buses
probability of the train derailing
probability of the train colliding with infrastructure following a collision
probability of the train colliding with another train
headway between trains and time to secure the line
speed of the train
train loading or the number of passengers
emergency services response time
positions of station platforms, points, over-bridges, tunnels, line-side structures and embankments
curvature of the track
possibility of release of dangerous goods
possibility of fire Because of the size of the event tree it is split into one main tree with three sub-trees:
Off-line derailment
Secondary collision
Dangerous goods involvement. Each of the sub-trees is calculated multiple times via a macro and the results transferred to the main event tree. This enables the sub-trees to be calculated for a range of different inputs (ie different train speeds, dangerous goods involved, different train types, urban or rural). For pedestrian level crossings the Consequence Factor is fixed at 1 effective fatality.
Page 15 of 31 Updated 30/08/2016
5.4. ALCAM Risk Score
ALCAM Risk Score = Infrastructure Factor x Exposure Factor x Consequence Factor
The overall comparative score which is produced by ALCAM is called the “ALCAM Risk Score”. This number is a product of the Infrastructure Factor, Exposure Factor and Consequence Factor, and is expressed in terms of an expected number of equivalent fatalities per year. It is this figure that allows comparison of level crossings against each other within a given jurisdiction based on the level of risk. By sorting level crossings in relation to their ALCAM Risk Score, a priority listing can be created which can then be used to assist in the development of safety improvement programs.

Page 16 of 31 Updated 30/08/2016
6. Interpreting ALCAM output
6.1. Relative ranking bands To assist the user, the LXM system provides a number of tools to rank a level crossing against other level crossings in a given jurisdiction, or against all crossings in Australia and New Zealand. The ranking is expressed in a percentile and grouped in one of five categories (from bottom 20 % to top 20%). The ranking is simply a tool to assist ALCAM users in understanding the relative risk of a particular crossing. It is not a warrant for upgrades and does not indicate a “safe” standard. The relative rankings paint a picture about a particular level crossing. Take for example, a crossing with a give way control that is ranked in the following bands:
Infrastructure factor: 80 - 100 % (high)
Exposure factor: 0 - 20 % (low)
Consequence factor: 20 - 40 % (low-medium)
ALCAM risk score: 0 - 20 % (low) These would highlight to the user that the crossing has very poor infrastructure. However, the low exposure ranking suggests that very few trains and cars use the crossing. The low-medium consequence ranking suggests if an accident were to occur it is not likely to be a multiple-fatalities, indicting the crossing is likely to have lower train speeds and unlikely to be used by buses or passenger trains. Viewed in combination, the low ALCAM risk score would suggest that the authority would be better off focusing funds on other crossings with higher level of risk. However, the relative high infrastructure factor should be a prompt to check if the crossing meets standards and if there are some improvements that can be made. The modelling capacity of ALCAM allows the user to test various scenarios. In the example above, an extension of a passenger metro line over the crossing would significantly increase relative rankings of both the exposure and consequence factors. Hence the total ALCAM risk score would increase significantly. This may be a prompt for an authority to consider an upgrade to active controls.
6.2. Metrics used Used in conjunction with each other, the Infrastructure Factor and Exposure Factor give a probability of a collision at a particular crossing. The probability at a crossing could be referenced in a number of ways, including collisions per movement, collisions per year, or collisions per 10 years. The ALCAM Consequence Factor is expressed as expected equivalent fatalities per collision. This is a single number that is made up of the average of a number of different accident scenarios (each with a different probability of occurrence). LXM has the functionality to provide the user with output from the event tree analysis, allowing them to produce an F-N curve for more site-specific risk analysis. The ALCAM Risk Score includes consequence and hence is expressed as expected fatalities per year (ie expected loss). The benefit of this is that this allows the user to build a quantitative business case for upgrades. This is typically required for most funding programs. The ALCAM user still needs to be careful when treating level crossings in the same manner as road accidents. The risk profile of level crossings always contains the potential for lower-probability-higher-consequence events (particularly where passenger trains are involved). In this sense, the rail

Page 17 of 31 Updated 30/08/2016
risk profile could be argued to have more in common with the aviation industry and a strict reliance on historical accident records may not manage the risk appropriately. The Consequence Model includes low-probability-high-consequence events, however the model focuses on fatalities and injuries only. It doesn’t include consequences such as reputational risk, infrastructure and rolling stock damage, legal liability, the risk of increased regulation and the costs of line closure. Hence a pure cost-benefit application of the ALCAM output may not be appropriate. A rail authority may determine that potential for low-probability but high-consequence events may warrant some crossings being provided with a higher standard of control. This would particularly be the case in urban areas and on busy rural lines that carry high-value freight.
6.3. Flags There are particular hazards at level crossings which are identified for consideration regardless of the overall Infrastructure Factor or ALCAM Risk Score at the crossing. Flags are used to highlight specific characteristics or risks that may result in an unacceptable situation (ie queuing, sighting and short stacking). ALCAM flags such areas of concern to allow further assessment to ensure they are not left unconsidered. A compliance flag is also included in relation to the requirements of the relevant Australian Standard (AS1742.7).

Page 18 of 31 Updated 30/08/2016
7. Treatment Once the profile of a level crossing has been established, suitable safety improvements can be considered. ALCAM allows the user to run various proposed mitigation measures and examine the impact based on the theoretical reduction in overall and specific ALCAM risk scores. It must be understood that active controls (flashing lights and boom barriers) are not always the best or most cost-effective answer and the proposed mitigation should address the specific hazards at each level crossing. For example, at a level crossing where short-stacking has been identified as the main hazard, the introduction of active controls such as boom gates may have little impact on the risk profile. A more suitable solution may involve changes to road infrastructure on the departure side of the level crossing or interfacing with adjacent road traffic controls. It is also very important to ensure that all stakeholders associated with the particular level crossing are involved with the determination of the final recommended treatment. Although it is a comprehensive tool for the assessment of level crossing hazards, ALCAM cannot be applied in isolation. Any risk assessment and treatment also needs to consider other factors, including:
Collision and near miss history
Engineering experience (both rail and road)
Local knowledge of driver or pedestrian behaviour
Standards and international best practice
Page 19 of 31 Updated 30/08/2016
8. Data management and LXM The ALCAM model sits inside an integrated data management system known as LXM (Level Crossing Management system). This system is a web based application operating from a single national database which allows stakeholders to access their crossing data within or across state jurisdiction boundaries. The LXM system contains a number of tools to assist users in the management of level crossings, including the ability to generate summary reports, model the effect of proposed upgrades and provide summary lists of level crossing deficiencies. Should jurisdictions choose to use it, LXM can act a data repository for other information such as incident history and digital photographs. An add-on package has been developed by Victoria to support Interface Agreements between rail and road organisations.
Page 20 of 31 Updated 30/08/2016
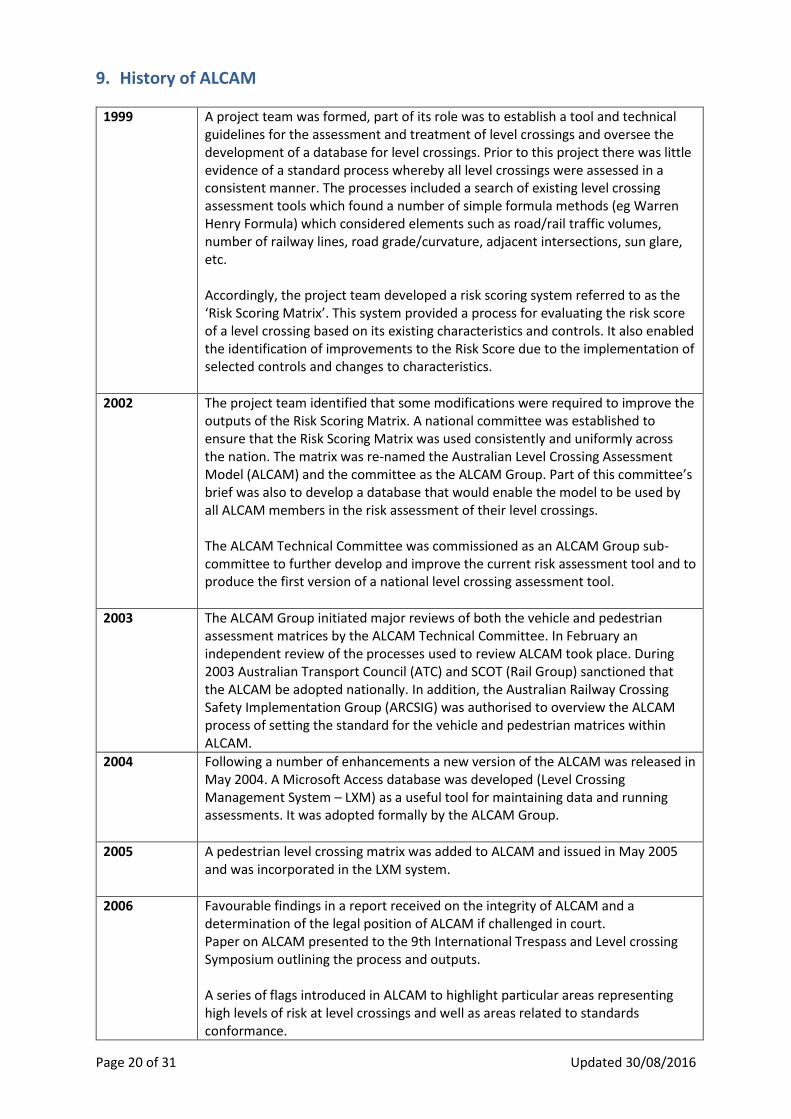
9. History of ALCAM
1999 A project team was formed, part of its role was to establish a tool and technical guidelines for the assessment and treatment of level crossings and oversee the development of a database for level crossings. Prior to this project there was little evidence of a standard process whereby all level crossings were assessed in a consistent manner. The processes included a search of existing level crossing assessment tools which found a number of simple formula methods (eg Warren Henry Formula) which considered elements such as road/rail traffic volumes, number of railway lines, road grade/curvature, adjacent intersections, sun glare, etc. Accordingly, the project team developed a risk scoring system referred to as the ‘Risk Scoring Matrix’. This system provided a process for evaluating the risk score of a level crossing based on its existing characteristics and controls. It also enabled the identification of improvements to the Risk Score due to the implementation of selected controls and changes to characteristics.
2002 The project team identified that some modifications were required to improve the outputs of the Risk Scoring Matrix. A national committee was established to ensure that the Risk Scoring Matrix was used consistently and uniformly across the nation. The matrix was re-named the Australian Level Crossing Assessment Model (ALCAM) and the committee as the ALCAM Group. Part of this committee’s brief was also to develop a database that would enable the model to be used by all ALCAM members in the risk assessment of their level crossings. The ALCAM Technical Committee was commissioned as an ALCAM Group sub-committee to further develop and improve the current risk assessment tool and to produce the first version of a national level crossing assessment tool.
2003 The ALCAM Group initiated major reviews of both the vehicle and pedestrian assessment matrices by the ALCAM Technical Committee. In February an independent review of the processes used to review ALCAM took place. During 2003 Australian Transport Council (ATC) and SCOT (Rail Group) sanctioned that the ALCAM be adopted nationally. In addition, the Australian Railway Crossing Safety Implementation Group (ARCSIG) was authorised to overview the ALCAM process of setting the standard for the vehicle and pedestrian matrices within ALCAM.
2004 Following a number of enhancements a new version of the ALCAM was released in May 2004. A Microsoft Access database was developed (Level Crossing Management System – LXM) as a useful tool for maintaining data and running assessments. It was adopted formally by the ALCAM Group.
2005 A pedestrian level crossing matrix was added to ALCAM and issued in May 2005 and was incorporated in the LXM system.
2006 Favourable findings in a report received on the integrity of ALCAM and a determination of the legal position of ALCAM if challenged in court. Paper on ALCAM presented to the 9th International Trespass and Level crossing Symposium outlining the process and outputs. A series of flags introduced in ALCAM to highlight particular areas representing high levels of risk at level crossings and well as areas related to standards conformance.

Page 21 of 31 Updated 30/08/2016
2007 Changes made in ALCAM (especially in relation to sighting distance requirements) to align with the 2007 version of AS1742.7. New Zealand invited to join the National ALCAM Group and commence collection data to use ALCAM. Work commenced on the development of a Consequence event tree to replace the current simple Consequence factor used in ALCAM.
2008 Structure changes made within ALCAM to ensure alignment with AS/NZ4360 the risk management standard The ARRB Transport Group was commissioned to carry out several projects including:
A comparison between ALCAM and the UK model the All Level Crossing Risk Model (ALCRM)
An analysis of the relationship between ALCAM outputs and actual incident information
A review of the structure of ALCAM in consideration of its alignment with general risk principles.
2009 Significant changes made to the terminology used in ALCAM to address issues raised by the National ALCAM Group and reports commissioned into the models robustness and alignment with general risk principles. ALCAM documentation and training material developed and training courses made more readily available to level crossing practitioners including contractors. Significant changes made to the LXM to incorporate requirements of ARTC to use ALCAM across multiple states and as a higher security level. An ALCAM Weightings Workshop was held in Sydney to fine tune the matrix and to incorporate changes recommend above.
2010 Collection of accident data from Australia and NZ to validate the model and/or modify aspects as required. Agreed to redevelop the LXM system and move toward a single implementation accessed by each jurisdiction using a web interface. Development of consequence model using event trees
2011 Project to correlate accident data against ALCAM output. Minor modifications to road weightings proposed for the Infrastructure Model. Project to assess relationship between vehicles and trains in respect to the risk of an accident assess different exposure calculations. Proposed changes to use the Peabody-Dimmick Formula in the Exposure Model. Development of system specifications for the single implantation of the LXM system. New features added and opportunity taken to improve usability. Further development and verification of Consequence Model using event trees.
2012 Acceptance of new road weightings in the Infrastructure Model

Page 22 of 31 Updated 30/08/2016
Acceptance of Peabody-Dimmick Formula in the Exposure Model Acceptance of the event tree analysis for the Consequence Model Adoption of new naming conventions for the model components Work commences redesigning LXM/ALCAM to incorporate the new models and convert to a web based, single instance entity.
2014 Release of ‘new’ LXM/ALCAM November 2014.

Page 23 of 31 Updated 30/08/2016
10. The future of ALCAM ALCAM continues to be developed with fine-tuning of weightings, introduction of new level crossing control technology and modifications to the supporting LXM platform. All changes are approved by the National ALCAM Group.

Page 24 of 31 Updated 30/08/2016
Appendix A: References ALCAM (2007), Australian Level Crossing Assessment Model (ALCAM) technical manual, v1.01,
National ALCAM Committee ALCAM (2007), Australian Level Crossing Assessment Model (ALCAM) assessment manual, v1.01,
National ALCAM Committee ALCAM (2009), Level Crossing Management System (LXM) technical manual, National ALCAM
Committee ALCAM (2009), ALCAM on a page, National ALCAM Committee ALCAM (2010), ALCAM in detail, National ALCAM Committee ALCAM (2011), National ALCAM Committee charter, National ALCAM Committee ALCAM (2012), Policy on access to ALCAM, National ALCAM Committee AS1742.7 (2007), Manual of Uniform Traffic Control Devices – Part 7: Railway crossings, Standards
Australia Baker, Ross and Kieran Helm (2011), Measurement of sight distances at level crossings, for National
ALCAM Committee ARRB Transport Group (2011), Comparison of ALCAM and ALCRM models for rail level crossing risk
assessment, Peter Croft and Blair Turner, Project VC74188, for National ALCAM Committee ARRB Transport Group (2009), Risk advice on ALCAM, Philip Roper, Blair Turner, Dimitris Tsolakis,
and Chris Jurewicz, Project VC74188-1, for National ALCAM Committee ARRB Transport Group (2010), Correlation between ALCAM, crash factors and locations, Michael
Levasseur, and Ben Mitchell, Project 002826, for National ALCAM Committee Creber and Associates (2004), Review of Level Crossing Assessment Model Improvement Process, for
Rail Infrastructure Corporation (NSW) Creber and Associates (2003), Review of Rail Infrastructure Corporation Level Crossing Assessment
Model Process, for Rail Infrastructure Corporation (NSW) Hughes, Peter (2002), A risk assessment system for passive level crossings, Seventh International
Symposium of Railroad-Highway Grade Crossing Research and Safety, 20-21 February 2002, Melbourne, Australia
Independent Transport Safety Regulator NSW (2008), Review of processes for prioritising resources
for the level crossing improvement program (LCIP), March 2008 Independent Transport Safety Regulator NSW (2011), Traffic flow and collision likelihood at
Australian & New Zealand level crossings, Meiers, Simon and Hai Guo Meiers, Simon (2012), Proposal for incorporation of ALCAM likelihood factor into risk score, for
National ALCAM Committee

Page 25 of 31 Updated 30/08/2016
Queensland Level Crossing Safety Project Team (1999), Level crossing safety volume 1: Guidelines, Parts 1-9, for the Queensland Level Crossing Safety Steering Group
Queensland Level Crossing Safety Project Team (1999), Level crossing safety volume 2:
Implementation, Parts 1-6, for the Queensland Level Crossing Safety Steering Group Queensland (2002), Level crossing risk scoring matrix (VEH RSM5), precursor to ALCAM Risk and Reliability Associates (R2A) (2006), Due diligence review of the ALCAM road and pedestrian
model, Report 173-26, for Department of Transport (Victoria) Sotera Risk Solutions (2011), ALCAM consequence model development, David Harris and Peter Dray,
J1161/Doc001, for National ALCAM Committee
Page 26 of 31 Updated 30/08/2016
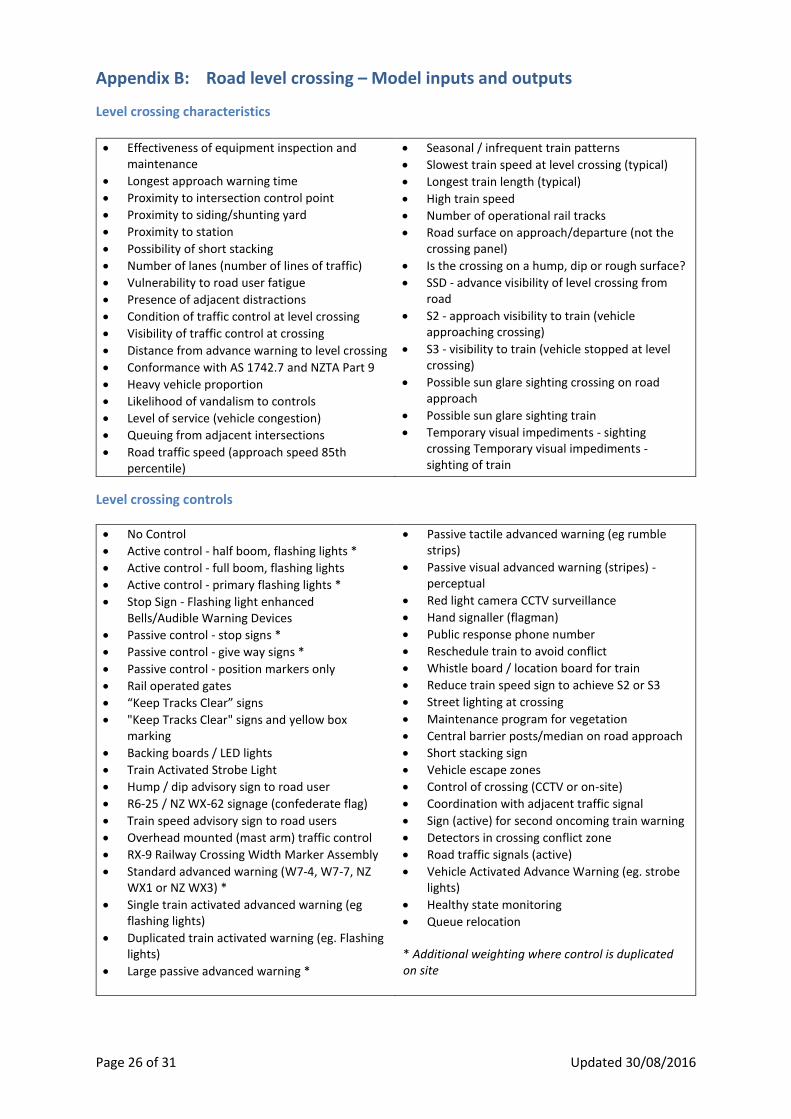
Appendix B: Road level crossing – Model inputs and outputs
Level crossing characteristics Effectiveness of equipment inspection and
maintenance
Longest approach warning time
Proximity to intersection control point
Proximity to siding/shunting yard
Proximity to station
Possibility of short stacking
Number of lanes (number of lines of traffic)
Vulnerability to road user fatigue
Presence of adjacent distractions
Condition of traffic control at level crossing
Visibility of traffic control at crossing
Distance from advance warning to level crossing
Conformance with AS 1742.7 and NZTA Part 9
Heavy vehicle proportion
Likelihood of vandalism to controls
Level of service (vehicle congestion)
Queuing from adjacent intersections
Road traffic speed (approach speed 85th percentile)
Seasonal / infrequent train patterns
Slowest train speed at level crossing (typical)
Longest train length (typical)
High train speed
Number of operational rail tracks
Road surface on approach/departure (not the crossing panel)
Is the crossing on a hump, dip or rough surface?
SSD - advance visibility of level crossing from road
S2 - approach visibility to train (vehicle approaching crossing)
S3 - visibility to train (vehicle stopped at level crossing)
Possible sun glare sighting crossing on road approach
Possible sun glare sighting train
Temporary visual impediments - sighting crossing Temporary visual impediments - sighting of train
Level crossing controls
No Control
Active control - half boom, flashing lights *
Active control - full boom, flashing lights
Active control - primary flashing lights *
Stop Sign - Flashing light enhanced Bells/Audible Warning Devices
Passive control - stop signs *
Passive control - give way signs *
Passive control - position markers only
Rail operated gates
“Keep Tracks Clear” signs
"Keep Tracks Clear" signs and yellow box marking
Backing boards / LED lights
Train Activated Strobe Light
Hump / dip advisory sign to road user
R6-25 / NZ WX-62 signage (confederate flag)
Train speed advisory sign to road users
Overhead mounted (mast arm) traffic control
RX-9 Railway Crossing Width Marker Assembly
Standard advanced warning (W7-4, W7-7, NZ WX1 or NZ WX3) *
Single train activated advanced warning (eg flashing lights)
Duplicated train activated warning (eg. Flashing lights)
Large passive advanced warning *
Passive tactile advanced warning (eg rumble strips)
Passive visual advanced warning (stripes) - perceptual
Red light camera CCTV surveillance
Hand signaller (flagman)
Public response phone number
Reschedule train to avoid conflict
Whistle board / location board for train
Reduce train speed sign to achieve S2 or S3
Street lighting at crossing
Maintenance program for vegetation
Central barrier posts/median on road approach
Short stacking sign
Vehicle escape zones
Control of crossing (CCTV or on-site)
Coordination with adjacent traffic signal
Sign (active) for second oncoming train warning
Detectors in crossing conflict zone
Road traffic signals (active)
Vehicle Activated Advance Warning (eg. strobe lights)
Healthy state monitoring
Queue relocation * Additional weighting where control is duplicated on site

Page 27 of 31 Updated 30/08/2016
Accident mechanisms
The road user: UNABLE TO AVOID
is unable to stop in time
is stuck on tracks
is stopped on tracks
UNAWARE
is distracted
cannot see control
cannot see train from road approach (S2)
cannot see train from at crossing (S3)
assumes train would stop
does not expect second train
finds crossing control is ambiguous
is fatigued
is misled by controls
UNWILLING TO RECOGNISE
is queued on tracks
overhangs on tracks
is racing train or misjudged train speed
drives through passive warning without looking
drives through flashing lights
drives around boom gates
Consequence model considerations Frequency of passenger trains
Frequency of freight trains
Frequency of freight trains (dangerous goods)
Speed of passenger trains
Speed of freight trains
Speed of freight trains (dangerous goods)
Percentage of buses
Percentage of light vehicles
Percentage of HGV vehicles
Percentage of HGV vehicles (dangerous goods)
Percentage of loco-hauled passengers trains
Average bus occupancy;
Average passenger train occupancy;
Average freight train cab occupancy;
Average number of wagons per freight train;
Number of tracks;
Track straight or curved;
Distance to points or crossing;
Distance to platform;
Distance to underbridge;
Distance to steep embankment;
Distance to medium embankment;
Distance to overbridge or tunnel.
Time taken to protect fouled track;
Potential for derailment in a collision;
Potential for derailment offline in a collision;
Potential for secondary collision with another train.
Page 28 of 31 Updated 30/08/2016
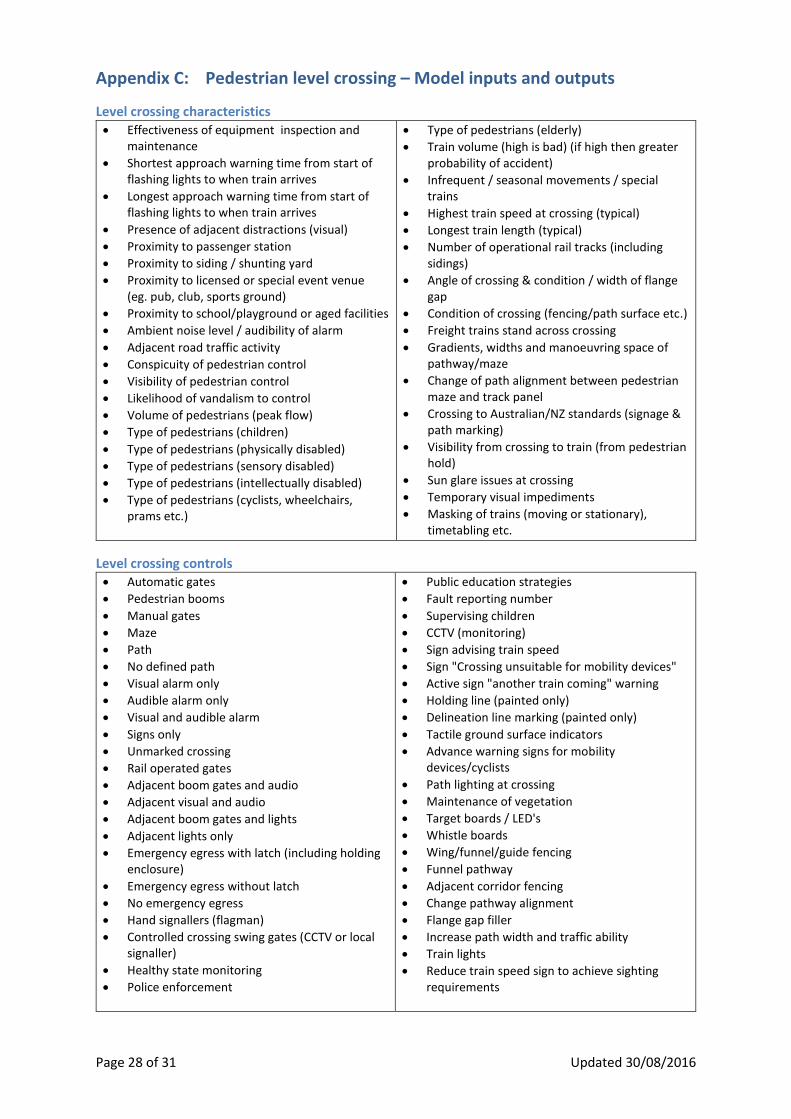
Appendix C: Pedestrian level crossing – Model inputs and outputs
Level crossing characteristics Effectiveness of equipment inspection and
maintenance
Shortest approach warning time from start of flashing lights to when train arrives
Longest approach warning time from start of flashing lights to when train arrives
Presence of adjacent distractions (visual)
Proximity to passenger station
Proximity to siding / shunting yard
Proximity to licensed or special event venue (eg. pub, club, sports ground)
Proximity to school/playground or aged facilities
Ambient noise level / audibility of alarm
Adjacent road traffic activity
Conspicuity of pedestrian control
Visibility of pedestrian control
Likelihood of vandalism to control
Volume of pedestrians (peak flow)
Type of pedestrians (children)
Type of pedestrians (physically disabled)
Type of pedestrians (sensory disabled)
Type of pedestrians (intellectually disabled)
Type of pedestrians (cyclists, wheelchairs, prams etc.)
Type of pedestrians (elderly)
Train volume (high is bad) (if high then greater probability of accident)
Infrequent / seasonal movements / special trains
Highest train speed at crossing (typical)
Longest train length (typical)
Number of operational rail tracks (including sidings)
Angle of crossing & condition / width of flange gap
Condition of crossing (fencing/path surface etc.)
Freight trains stand across crossing
Gradients, widths and manoeuvring space of pathway/maze
Change of path alignment between pedestrian maze and track panel
Crossing to Australian/NZ standards (signage & path marking)
Visibility from crossing to train (from pedestrian hold)
Sun glare issues at crossing
Temporary visual impediments
Masking of trains (moving or stationary), timetabling etc.
Level crossing controls Automatic gates
Pedestrian booms
Manual gates
Maze
Path
No defined path
Visual alarm only
Audible alarm only
Visual and audible alarm
Signs only
Unmarked crossing
Rail operated gates
Adjacent boom gates and audio
Adjacent visual and audio
Adjacent boom gates and lights
Adjacent lights only
Emergency egress with latch (including holding enclosure)
Emergency egress without latch
No emergency egress
Hand signallers (flagman)
Controlled crossing swing gates (CCTV or local signaller)
Healthy state monitoring
Police enforcement
Public education strategies
Fault reporting number
Supervising children
CCTV (monitoring)
Sign advising train speed
Sign "Crossing unsuitable for mobility devices"
Active sign "another train coming" warning
Holding line (painted only)
Delineation line marking (painted only)
Tactile ground surface indicators
Advance warning signs for mobility devices/cyclists
Path lighting at crossing
Maintenance of vegetation
Target boards / LED's
Whistle boards
Wing/funnel/guide fencing
Funnel pathway
Adjacent corridor fencing
Change pathway alignment
Flange gap filler
Increase path width and traffic ability
Train lights
Reduce train speed sign to achieve sighting requirements
Page 29 of 31 Updated 30/08/2016
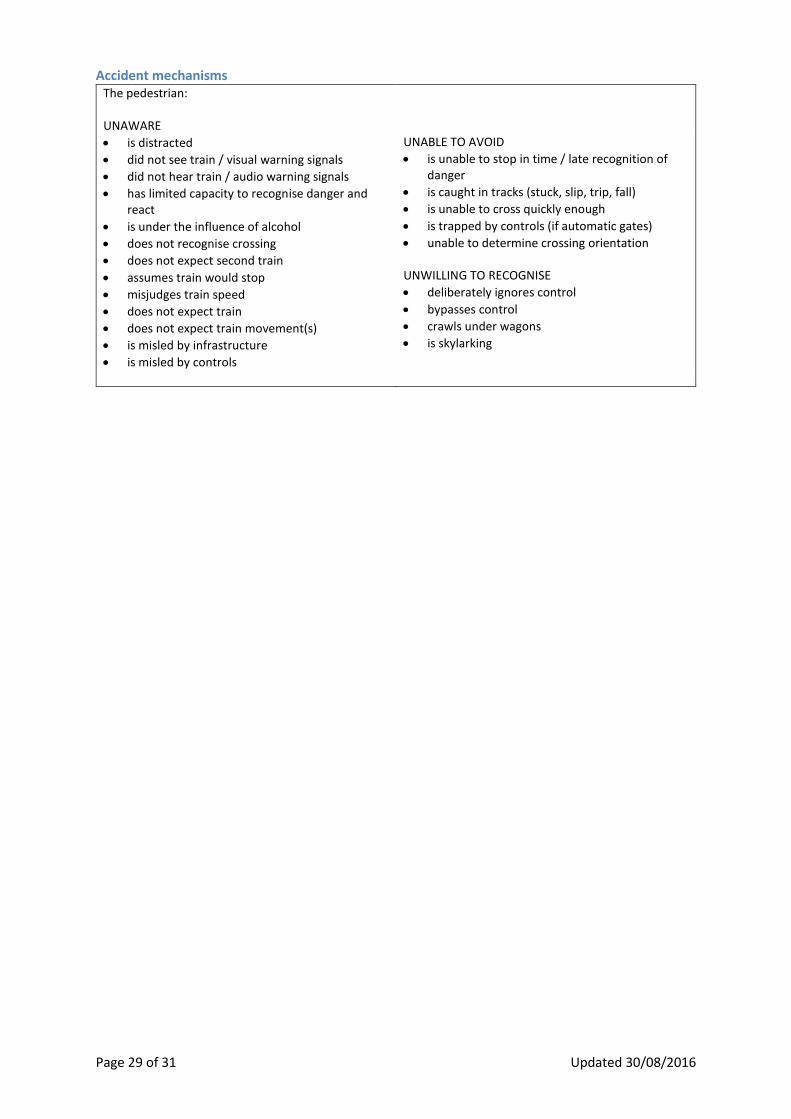
Accident mechanisms The pedestrian: UNAWARE
is distracted
did not see train / visual warning signals
did not hear train / audio warning signals
has limited capacity to recognise danger and react
is under the influence of alcohol
does not recognise crossing
does not expect second train
assumes train would stop
misjudges train speed
does not expect train
does not expect train movement(s)
is misled by infrastructure
is misled by controls
UNABLE TO AVOID
is unable to stop in time / late recognition of danger
is caught in tracks (stuck, slip, trip, fall)
is unable to cross quickly enough
is trapped by controls (if automatic gates)
unable to determine crossing orientation
UNWILLING TO RECOGNISE
deliberately ignores control
bypasses control
crawls under wagons
is skylarking

Page 30 of 31 Updated 30/08/2016
Appendix D: ALCAM definitions and acronyms
General terms
ALCAM The Australian Level Crossing Assessment Model
LXM The Level Crossing Management system (platform for ALCAM, database and analysis tool).
Organisations
ATC The Australian Transport Council which is a Ministerial forum for Commonwealth, State and Territory consultations and provides advice to governments on the coordination and integration of all transport and road policy issues at a national level
NTC National Transport Commission – Lead transport regulatory reform nationally to meet the needs of transport users and the broader community for safe, efficient land transport policies, laws and practices.
RLCG Rail Level Crossing Group – Australian strategic group with an objective to reduce the likelihood of crashes and near misses at Australian rail level crossings.
SCOT Standing Committee on Transport under the Australian House of Representatives which oversees transport issues across NSW including those issues associated with railway level crossings.
Components of the ALCAM model
Found in Description
ALCAM Matrix Infrastructure Model The matrix which represents the effect each characteristic & control has on each accident mechanism.
Accident Mechanism Infrastructure Model An accident mechanism is any significant pedestrian or driver behaviour that increases the potential for a collision with a train to occur.
Characteristics Infrastructure Model A characteristic is defined as any feature of a roadway or railway which may influence on pedestrian or driver behaviour (accident mechanisms). Characteristics include items such as sighting distance, speed of trains, stacking distance or the distance to adjacent intersections.
Consequence Factor Consequence Model The expected outcome in the event of a collision. This is expressed in terms of equivalent fatalities per collision.
Consequence Model Consequence Model An event tree model used to produce a range of outcomes (and associated probabilities) if a collision

Page 31 of 31 Updated 30/08/2016
were to occur. The average output of this model is the Consequence Factor.
Controls Infrastructure Model Equipment or tools that reduce the risk of an accident by changing pedestrian or driver behaviour. These include measures such as boom gates, signage, or improved road alignment. A control could also include education and law enforcement campaigns.
Exposure Factor Exposure Model The annual accident probability for an average level crossing with a specified control type, vehicle/pedestrian volumes and train volumes.
Exposure Model Exposure Model Non-linear calculations used to produce the Exposure Factor. The output of this model is the Infrastructure Factor.
Flags Infrastructure Model Particular hazards at level crossings which are identified for consideration (e.g. queuing and short stacking).
Infrastructure Factor Infrastructure Model A scalar to reflect how site conditions will increase or decrease the annual accident probability.
Infrastructure Model Infrastructure Model An algorithm that considers how physical properties at each level crossing will affect human behaviours. The model includes characteristics, controls and accident mechanisms. The output of this model is the Infrastructure Factor.
Infrastructure Modifier
Infrastructure Model A number used to turn the Raw Infrastructure Factor from an arbitrary number into a scalar that represents a change in the annual accident probability. This number comes from a calculation based on 10 years of Australasian accident records.
Likelihood Infrastructure Model x Exposure Model
The annual probability of an accident at a particular level crossing. This is obtained by multiplying the Infrastructure Factor by the Exposure Factor.
Raw Infrastructure Factor
Infrastructure Model A number between 0 and 800 that reflects site conditions at a level crossing. The number is made up of all site characteristics that increase the chance of a collision, and all site controls that reduce the chance of a collision. Historically this was referred to as the “ALCAM Likelihood Factor”.