Embed Size (px)
Citation preview
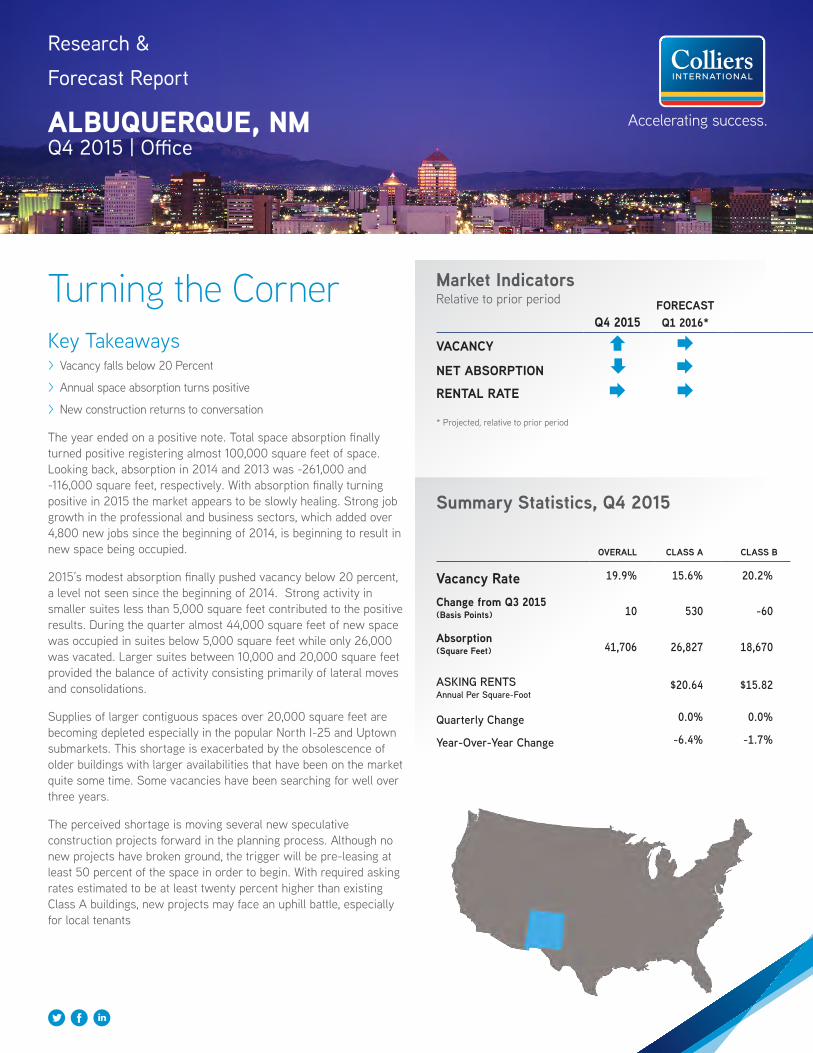
Research & Forecast Report
ALBUQUERQUE, NMQ4 2015 | Office
Key Takeaways > Vacancy falls below 20 Percent
> Annual space absorption turns positive
> New construction returns to conversation
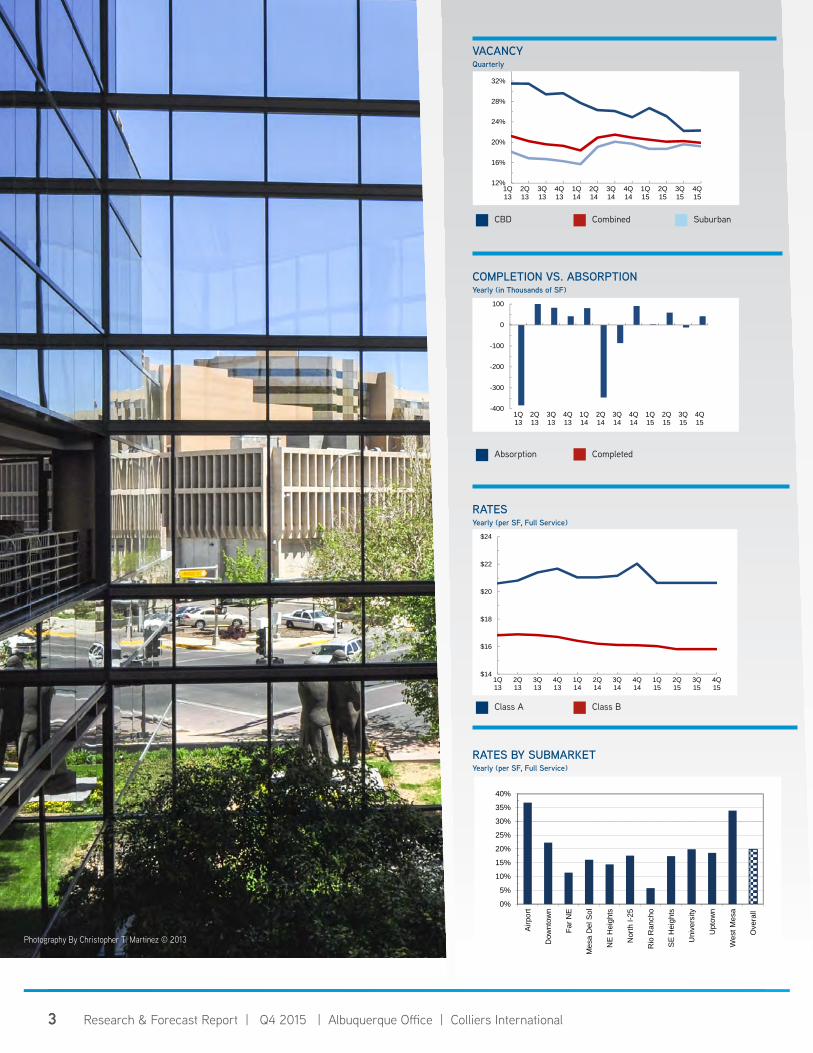
The year ended on a positive note. Total space absorption finally turned positive registering almost 100,000 square feet of space. Looking back, absorption in 2014 and 2013 was -261,000 and -116,000 square feet, respectively. With absorption finally turning positive in 2015 the market appears to be slowly healing. Strong job growth in the professional and business sectors, which added over 4,800 new jobs since the beginning of 2014, is beginning to result in new space being occupied.
2015’s modest absorption finally pushed vacancy below 20 percent, a level not seen since the beginning of 2014. Strong activity in smaller suites less than 5,000 square feet contributed to the positive results. During the quarter almost 44,000 square feet of new space was occupied in suites below 5,000 square feet while only 26,000 was vacated. Larger suites between 10,000 and 20,000 square feet provided the balance of activity consisting primarily of lateral moves and consolidations.
Supplies of larger contiguous spaces over 20,000 square feet are becoming depleted especially in the popular North I-25 and Uptown submarkets. This shortage is exacerbated by the obsolescence of older buildings with larger availabilities that have been on the market quite some time. Some vacancies have been searching for well over three years.
The perceived shortage is moving several new speculative construction projects forward in the planning process. Although no new projects have broken ground, the trigger will be pre-leasing at least 50 percent of the space in order to begin. With required asking rates estimated to be at least twenty percent higher than existing Class A buildings, new projects may face an uphill battle, especially for local tenants
Turning the Corner
Summary Statistics, Q4 2015
OVERALL CLASS A CLASS B
Vacancy Rate 19.9% 15.6% 20.2%
Change from Q3 2015 (Basis Points) 10 530 -60
Absorption(Square Feet) 41,706 26,827 18,670
ASKING RENTS Annual Per Square-Foot
$20.64 $15.82
Quarterly Change 0.0% 0.0%
Year-Over-Year Change -6.4% -1.7%
Market IndicatorsRelative to prior period
Q4 2015FORECASTQ1 2016*
VACANCY
NET ABSORPTIONRENTAL RATE
* Projected, relative to prior period
2 Research & Forecast Report | Q4 2015 | Albuquerque Office | Colliers International2
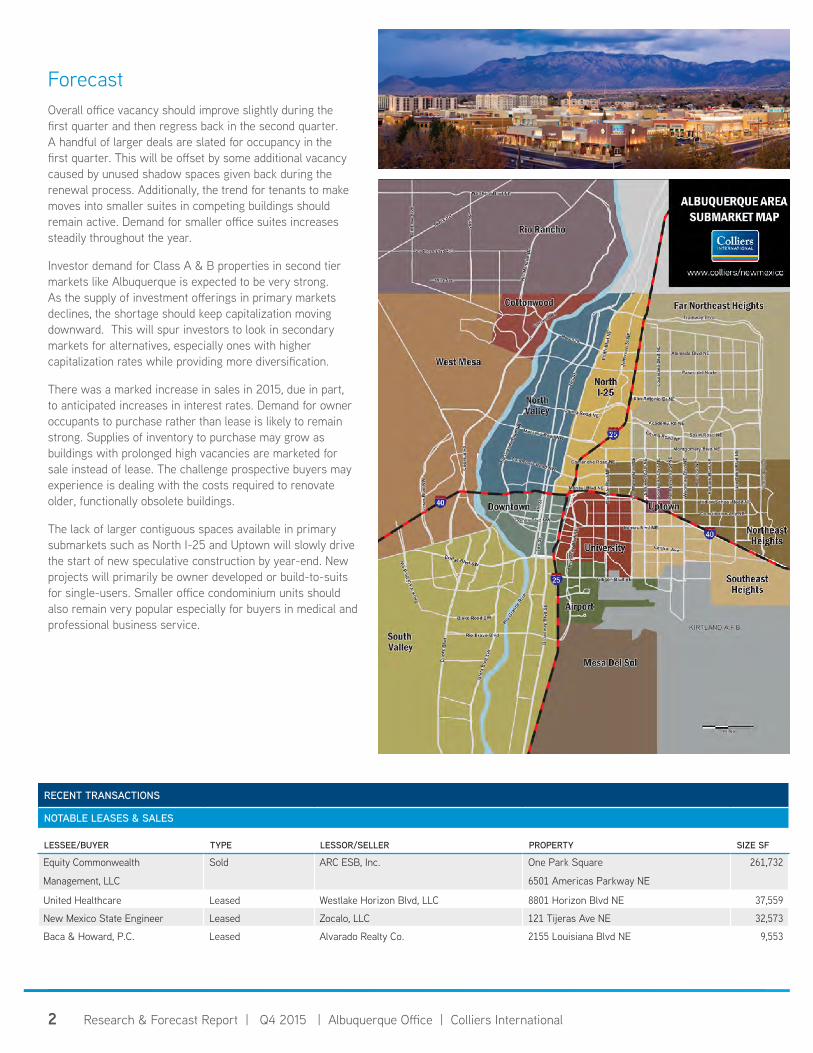
Forecast Overall office vacancy should improve slightly during the first quarter and then regress back in the second quarter. A handful of larger deals are slated for occupancy in the first quarter. This will be offset by some additional vacancy caused by unused shadow spaces given back during the renewal process. Additionally, the trend for tenants to make moves into smaller suites in competing buildings should remain active. Demand for smaller office suites increases steadily throughout the year.
Investor demand for Class A & B properties in second tier markets like Albuquerque is expected to be very strong. As the supply of investment offerings in primary markets declines, the shortage should keep capitalization moving downward. This will spur investors to look in secondary markets for alternatives, especially ones with higher capitalization rates while providing more diversification.
There was a marked increase in sales in 2015, due in part, to anticipated increases in interest rates. Demand for owner occupants to purchase rather than lease is likely to remain strong. Supplies of inventory to purchase may grow as buildings with prolonged high vacancies are marketed for sale instead of lease. The challenge prospective buyers may experience is dealing with the costs required to renovate older, functionally obsolete buildings.
The lack of larger contiguous spaces available in primary submarkets such as North I-25 and Uptown will slowly drive the start of new speculative construction by year-end. New projects will primarily be owner developed or build-to-suits for single-users. Smaller office condominium units should also remain very popular especially for buyers in medical and professional business service.
RECENT TRANSACTIONS
NOTABLE LEASES & SALES
LESSEE/BUYER TYPE LESSOR/SELLER PROPERTY SIZE SF
Equity Commonwealth
Management, LLC
Sold ARC ESB, Inc. One Park Square
6501 Americas Parkway NE
261,732
United Healthcare Leased Westlake Horizon Blvd, LLC 8801 Horizon Blvd NE 37,559
New Mexico State Engineer Leased Zocalo, LLC 121 Tijeras Ave NE 32,573
Baca & Howard, P.C. Leased Alvarado Realty Co. 2155 Louisiana Blvd NE 9,553
*** - Q3-14 data displayed.
3 Research & Forecast Report | Q4 2015 | Albuquerque Office | Colliers International3
VACANCYQuarterly Office Graphs Template
12%
16%
20%
24%
28%
32%
1Q13
2Q13
3Q13
4Q13
1Q14
2Q14
3Q14
4Q14
1Q15
2Q15
3Q15
4Q15
$14
$16
$18
$20
$22
$24
1Q13
2Q13
3Q13
4Q13
1Q14
2Q14
3Q14
4Q14
1Q15
2Q15
3Q15
4Q15
-400
-300
-200
-100
0
100
1Q13
2Q13
3Q13
4Q13
1Q14
2Q14
3Q14
4Q14
1Q15
2Q15
3Q15
4Q15
0%
5%
10%
15%
20%
25%
30%
35%
40%
Airp
ort
Dow
ntow
n
Far N
E
Mes
a D
el S
ol
NE
Hei
ghts
Nor
th I-
25
Rio
Ran
cho
SE
Hei
ghts
Uni
vers
ity
Upt
own
Wes
t Mes
a
Ove
rall
|
Page 1
CBD Combined Suburban
COMPLETION VS. ABSORPTIONYearly (in Thousands of SF)
Absorption Completed
RATESYearly (per SF, Full Service)
RATES BY SUBMARKETYearly (per SF, Full Service)
Office Graphs Template
12%
16%
20%
24%
28%
32%
1Q13
2Q13
3Q13
4Q13
1Q14
2Q14
3Q14
4Q14
1Q15
2Q15
3Q15
4Q15
$14
$16
$18
$20
$22
$24
1Q13
2Q13
3Q13
4Q13
1Q14
2Q14
3Q14
4Q14
1Q15
2Q15
3Q15
4Q15
-400
-300
-200
-100
0
100
1Q13
2Q13
3Q13
4Q13
1Q14
2Q14
3Q14
4Q14
1Q15
2Q15
3Q15
4Q15
0%
5%
10%
15%
20%
25%
30%
35%
40%
Airp
ort
Dow
ntow
n
Far N
E
Mes
a D
el S
ol
NE
Hei
ghts
Nor
th I-
25
Rio
Ran
cho
SE
Hei
ghts
Uni
vers
ity
Upt
own
Wes
t Mes
a
Ove
rall
|
Page 1
Class A Class B
Office Graphs Template
12%
16%
20%
24%
28%
32%
1Q13
2Q13
3Q13
4Q13
1Q14
2Q14
3Q14
4Q14
1Q15
2Q15
3Q15
4Q15
$14
$16
$18
$20
$22
$24
1Q13
2Q13
3Q13
4Q13
1Q14
2Q14
3Q14
4Q14
1Q15
2Q15
3Q15
4Q15
-400
-300
-200
-100
0
100
1Q13
2Q13
3Q13
4Q13
1Q14
2Q14
3Q14
4Q14
1Q15
2Q15
3Q15
4Q15
0%
5%
10%
15%
20%
25%
30%
35%
40%
Airp
ort
Dow
ntow
n
Far N
E
Mes
a D
el S
ol
NE
Hei
ghts
Nor
th I-
25
Rio
Ran
cho
SE
Hei
ghts
Uni
vers
ity
Upt
own
Wes
t Mes
a
Ove
rall
|
Page 1
4 Research & Forecast Report | Q4 2015 | Albuquerque Office | Colliers International4
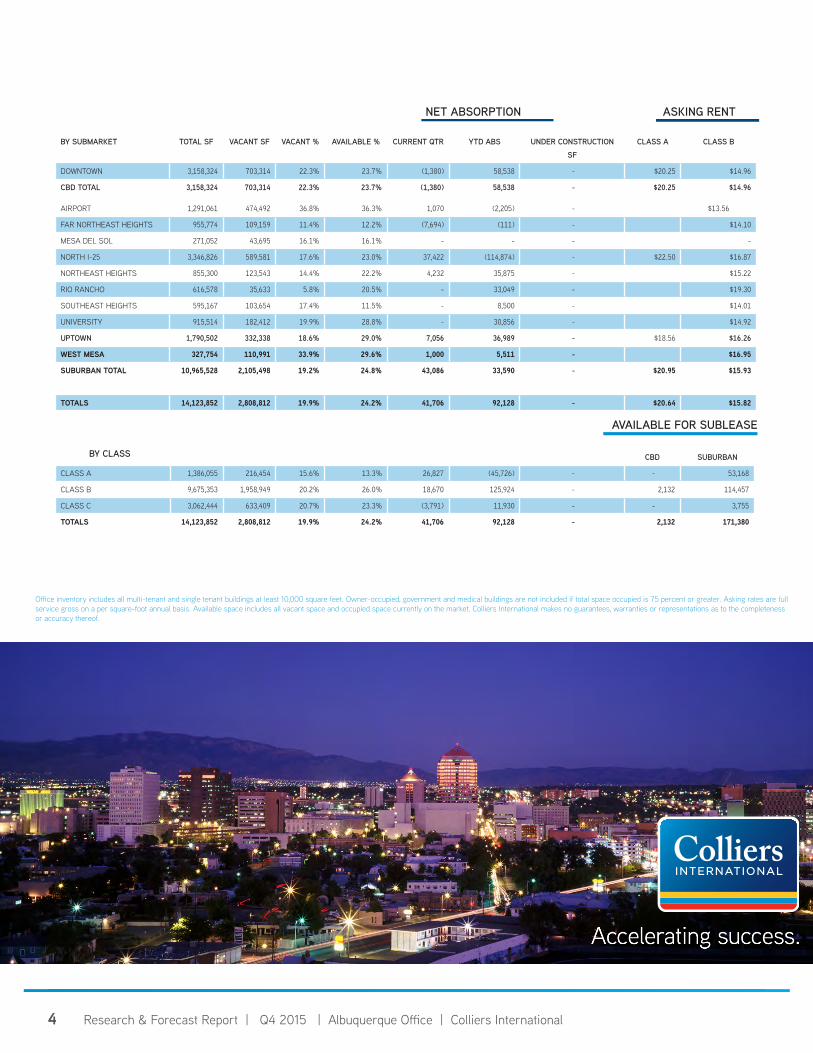
Office inventory includes all multi-tenant and single tenant buildings at least 10,000 square feet. Owner-occupied, government and medical buildings are not included if total space occupied is 75 percent or greater. Asking rates are full service gross on a per square-foot annual basis. Available space includes all vacant space and occupied space currently on the market. Colliers International makes no guarantees, warranties or representations as to the completeness or accuracy thereof.
AVAILABLE FOR SUBLEASE
BY CLASS
NET ABSORPTION ASKING RENT
BY SUBMARKET TOTAL SF VACANT SF VACANT % AVAILABLE % CURRENT QTR YTD ABS UNDER CONSTRUCTION SF
CLASS A CLASS B
DOWNTOWN 3,158,324 703,314 22.3% 23.7% (1,380) 58,538 - $20.25 $14.96
CBD TOTAL 3,158,324 703,314 22.3% 23.7% (1,380) 58,538 - $20.25 $14.96
AIRPORT 1,291,061 474,492 36.8% 36.3% 1,070 (2,205) - $13.56
FAR NORTHEAST HEIGHTS 955,774 109,159 11.4% 12.2% (7,694) (111) - $14.10
MESA DEL SOL 271,052 43,695 16.1% 16.1% - - - -
NORTH I-25 3,346,826 589,581 17.6% 23.0% 37,422 (114,874) - $22.50 $16.87
NORTHEAST HEIGHTS 855,300 123,543 14.4% 22.2% 4,232 35,875 - $15.22
RIO RANCHO 616,578 35,633 5.8% 20.5% - 33,049 - $19.30
SOUTHEAST HEIGHTS 595,167 103,654 17.4% 11.5% - 8,500 - $14.01
UNIVERSITY 915,514 182,412 19.9% 28.8% - 30,856 - $14.92
UPTOWN 1,790,502 332,338 18.6% 29.0% 7,056 36,989 - $18.56 $16.26
WEST MESA 327,754 110,991 33.9% 29.6% 1,000 5,511 - $16.95
SUBURBAN TOTAL 10,965,528 2,105,498 19.2% 24.8% 43,086 33,590 - $20.95 $15.93
TOTALS 14,123,852 2,808,812 19.9% 24.2% 41,706 92,128 - $20.64 $15.82
CBD SUBURBAN
CLASS A 1,386,055 216,454 15.6% 13.3% 26,827 (45,726) - - 53,168
CLASS B 9,675,353 1,958,949 20.2% 26.0% 18,670 125,924 - 2,132 114,457
CLASS C 3,062,444 633,409 20.7% 23.3% (3,791) 11,930 - - 3,755
TOTALS 14,123,852 2,808,812 19.9% 24.2% 41,706 92,128 - 2,132 171,380
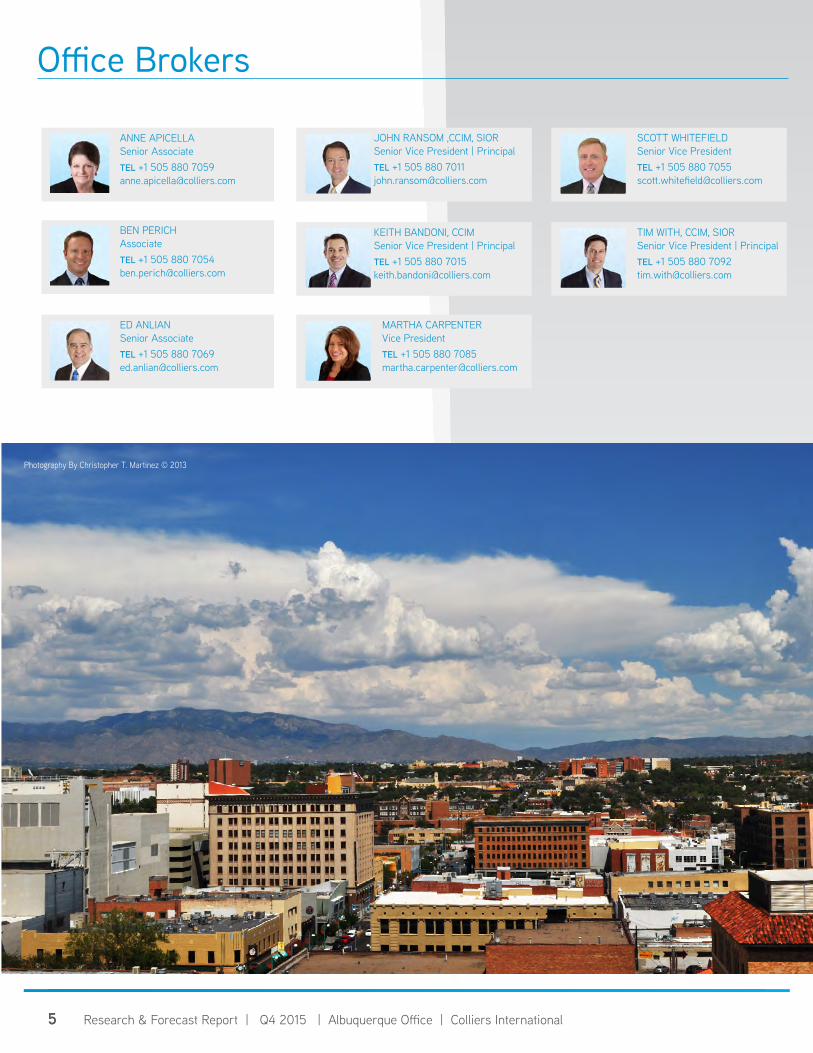
ANNE APICELLASenior Associate TEL +1 505 880 [email protected]
MARTHA CARPENTERVice PresidentTEL +1 505 880 [email protected]
JOHN RANSOM ,CCIM, SIORSenior Vice President | Principal TEL +1 505 880 [email protected]
ED ANLIANSenior Associate TEL +1 505 880 [email protected]
BEN PERICHAssociate TEL +1 505 880 [email protected]
KEITH BANDONI, CCIMSenior Vice President | Principal TEL +1 505 880 [email protected]
SCOTT WHITEFIELDSenior Vice PresidentTEL +1 505 880 [email protected]
TIM WITH, CCIM, SIORSenior Vice President | Principal TEL +1 505 880 [email protected]
Office Brokers
5 Research & Forecast Report | Q4 2015 | Albuquerque Office | Colliers International5
6 Research & Forecast Report | Q4 2015 | Albuquerque Office | Colliers International6
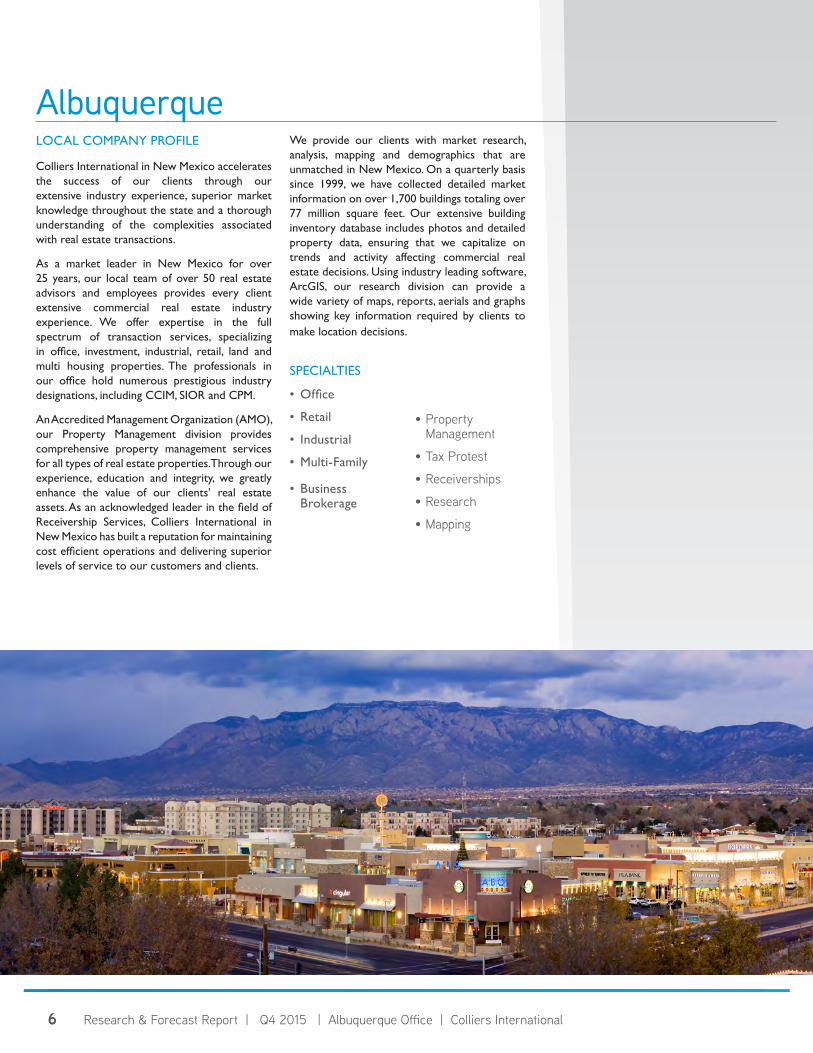
LOCAL COMPANY PROFILE
Colliers International in New Mexico accelerates the success of our clients through our extensive industry experience, superior market knowledge throughout the state and a thorough understanding of the complexities associated with real estate transactions.
As a market leader in New Mexico for over 25 years, our local team of over 50 real estate advisors and employees provides every client extensive commercial real estate industry experience. We offer expertise in the full spectrum of transaction services, specializing in office, investment, industrial, retail, land and multi housing properties. The professionals in our office hold numerous prestigious industry designations, including CCIM, SIOR and CPM.
An Accredited Management Organization (AMO), our Property Management division provides comprehensive property management services for all types of real estate properties. Through our experience, education and integrity, we greatly enhance the value of our clients’ real estate assets. As an acknowledged leader in the field of Receivership Services, Colliers International in New Mexico has built a reputation for maintaining cost efficient operations and delivering superior levels of service to our customers and clients.
We provide our clients with market research, analysis, mapping and demographics that are unmatched in New Mexico. On a quarterly basis since 1999, we have collected detailed market information on over 1,700 buildings totaling over 77 million square feet. Our extensive building inventory database includes photos and detailed property data, ensuring that we capitalize on trends and activity affecting commercial real estate decisions. Using industry leading software, ArcGIS, our research division can provide a wide variety of maps, reports, aerials and graphs showing key information required by clients to make location decisions.
SPECIALTIES
• Office
• Retail
• Industrial
• Multi-Family
• Business Brokerage
Albuquerque
• Property Management
• Tax Protest
• Receiverships
• Research
• Mapping
Copyright © 2015 Colliers International.The information contained herein has been obtained from sources deemed reliable. While every reasonable effort has been made to ensure its accuracy, we cannot guarantee it. No responsibility is assumed for any inaccuracies. Readers are encouraged to consult their professional advisors prior to acting on any of the material contained in this report.
Colliers International2424 Louisiana Blvd. NESuite 300+1 505 883 7676colliers.com
AlbuquerqueKen Schaefer
Director of Research
2424 Louisiana Blvd NE Albuquerque, NM 87110
TEL +1 505 880 7012FAX +1 505 923 3812