Embed Size (px)
Citation preview

Albertarsquos Bow RiverClimate Change and Human Impacts
The Bow River is a crucial artery through the heartland of Alberta Flowing from headwaters in the Rocky Mountains through downtown Calgary and on to the rich agricultural lands to the southeast the Bow provides a host of critical functions clean drinking water irrigation for agriculture hydroelectric power sanitation recreation tourism hunting fishing and habitat for wildlife The Bow Valley is already home to 12 million people ndash a third of the provincersquos population ndash and that number is expected to double in the next few decades[1] In addition the Bow is also a microcosm of a global phenomenon The twin pressures of human development and climate change are affecting river ecosystems worldwide Almost any water-related issue ndash water scarcity water quality dangers of floods and droughts ecosystem integrity ndash is reflected in some way along the Bow This makes it a fascinating case study for understanding the natural systems that support and nurture us but more importantly a critical test of our ability to live within the limits imposed by those systems
Natural features
Melt water from glaciers accounts for less than three per cent of the Bowrsquos total flow The vast majority of the water ndash around 80 per cent ndash comes from the snow that collects in the mountains and on the prairies over the winter[2] When the weather becomes warm enough to melt that snow typically in June the riverrsquos average flow at Calgary is about 300 cubic metres per second fast enough to drain an Olympic-sized swimming pool in less than nine seconds[3]
Water from spring and summer snowmelt also recharges natural holding tanks like the groundwater aquifers and wetlands that line the banks of the Bow and its numerous tributaries These natural holding tanks are the major source of the riverrsquos water during the following dry months The total annual precipitation at Calgary is 450 to 550 millimetres per year an estimated five to 50 millimetres of which (between one and 10 per cent) goes to recharge the wetlands and aquifers in the Prairie portion of the basin[4] By December the flow of the Bow river is less than a fifth of that in summer and almost entirely sustained by groundwater This extreme variation sets the stage for everything else that happens on the river from floods to water shortages Groundwater wetlands and sloughs also play an important role in controlling the water chemistry in the Bow ecosystem In the foothills wetlands are lined with deep layers of decayed vegetation known as peat and are strongly interconnected to the groundwater system Nutrients from the soil and peat support forests and other vegetation Wetlands on the prairie known as sloughs tend to be more isolated from each other but they still act as filters helping remove excess nutrients and other dissolved chemicals However they cannot fulfill this role if they overflow their banks during periods of extreme wet or if they are drained by humans to make room for development
Weather climate and climate change Alberta and the Prairie provinces have one of the most variable climates in North America Both floods and droughts are frequent but they should not be thought of as opposites Floods are short-term events that cause massive river flow whereas droughts are chronic long-term deficiencies in water supply and can be difficult to identify until after theyrsquore over The Prairies have experienced a number of multi-year droughts most recently from 1999-2005 Floods hit southern Alberta in 2013 2005 1997 and 1995 While the 2013 flood was larger than any since 1932
Bow Falls Banff Alberta Credit Tim Redpath via Flickr
Rafting is a popular activity in the Bow River even within the city limits of Calgary Credit Mike Murray Bow River Basin Council
there is evidence that more severe floods have occurred in the past [5] The relative lack of severe floods from 1932 to 2005 may seem significant in human terms but the extremely variable local climate makes it hard to say if the frequency or severity of floods is increasing or decreasing Climatic cycles ndash some on the order of decades some even longer ndash affect the relative dryness or wetness of the region One example is the Pacific Decadal Oscillation (PDO) which is comparable to the El NintildeoLa Nintildea cycle but it fluctuates over a longer time scale (decades versus years) and operates in the north Pacific rather than the south In the lsquopositiversquo phase of PDO ocean temperatures in the west-central North Pacific become cool while those off the British Columbia coast become warm This tends to lead to warmer drier weather in Western Canada particularly in the winter which reduces winter snow accumulation and consequently the amount of water flowing into the river The lsquonegativersquo phase tends to have cooler wetter weather and may increase the probability of floods [6] Scientists believe we are now in a lsquonegativersquo phase which could last another 10 to 20 years There are other longer-term cycles that are still not well understood by climate scientists Super-imposed on all this are the effects of climate change While annual average temperatures across southern Canada have increased between 05 and 15 C over the past century[7] some local effects are even stronger Weather stations in the foothills of the Rocky Mountains show evidence of milder winters during October to March daily average temperatures have increased by about 2 degrees C and daily minimum temperatures by 3 to 4 degrees C since 1962 [8] Although these same stations show no trend in total precipitation the warmer winter temperatures mean lower snow accumulation They also mean earlier springs and when plants soak up moisture from soil and transpire it into the air less water is available to get into the river The result is lower summer flows raising issues of water scarcity Marmot Creek a well-studied tributary of the Kananaskis River which in turn flows into the Bow has lost a quarter of its flow over the last 50 years [8] the average flow of the Bow River at Banff has decreased by about 12 per cent over the last century[9] Itrsquos important to note that while the effects of climate change are important the reduction in flows is small compared to the amount that is taken out of the river by humans whether for drinking water in cities and towns or to irrigate crops On average humans withdraw about 22 per cent of the Bow Riverrsquos water in a dry year it can be even more[10]
Impacts of human development With access to easy water for drinking and
The Flood The 2013 Alberta floods were caused by a low-pressure system carrying warm moist air from the Gulf of Mexico which developed over Montana and started to move north toward the foothills in late June Blocked to the west by the Rocky Mountains and to the north by an Arctic high-pressure system the storm dumped more than 200 millimetres of rain ndash about half the average annual total for the area ndash in only two days The rain alone would have caused a flood but the warm humid air and rain falling on snow also melted the mountain snowpacks and the still-frozen ground was unable to absorb any of the extra water Apart from its localized nature and the fact that it remained stationary for so long (features still being studied by meteorologists) this weather system was not very different from other well-documented storms that have occurred in the area[11] Starting in the 1970s the Alberta government embarked on an extensive program of mapping flood hazard areas along the Bow these maps are available online They are based on the height of the land surrounding the river and the maximum river flow determined by scientists to have a one per cent chance of being equaled or exceeded in any year this is often called the ldquo100-year floodrdquo but in fact a flood of any magnitude can occur at any time Engineering reports[12] show that the estimated peak flow for a ldquo100-year floodrdquo is higher than the maximum observed in June 2013 in other words it was likely only a 50- to 70-year flood In Calgary and other communities many homes and businesses were located within the flood hazard areas that had been mapped out decades before Total damage was estimated at $3 billion to 5 billion Preventing development in flood plains would significantly reduce damage from future floods
This map produced by Alberta Environment (wwwenvinfogovabcaFloodHazard) shows the location of floodways (dark red) and flood fringes (light red) in downtown Calgary
transportation not to mention rich soils fertilized by periodic floods river valleys are always attractive for human settlement But a large and growing population is affecting the riverrsquos health on a variety of fronts
Water scarcity Besides providing drinking water for major communities like Canmore Cochrane and Calgary the Bow supports farmers who grow spring wheat durum wheat canola barley and alfalfa as well as those rearing cattle and other livestock In all the region produces roughly $2 billion worth of agricultural products each year more than 17 per cent of Albertarsquos total Unfortunately much of the water used to grow these crops is transpired through their leaves into the atmosphere and can be lost to the watershed That which does get returned can be contaminated with fertilizers pesticides or animal waste Until 2006 the provincial government issued permits called allocations to withdraw water from the Bow River for municipal agricultural or other use The current total that can be withdrawn under the allocation system is about 28 billion cubic metres per year nearly 60 per cent of the total flow of the river although not all permit holders withdraw their maximum entitlement Of the water withdrawn 71 per cent is used for agriculture while 18 per cent is for municipal drinking water[13] In 2006 responding to concerns over water scarcity Alberta Environment placed a moratorium on new allocations and imposed conditions on the transfer of existing allocations eg holding back 10 per cent of each transferred allocation to encourage conservation [14] A more comprehensive water allocation management system
is under review [15][16] The population of the Bow River basin is expected to double within the next few decades [17] further increasing pressure on this limited resource Dams and water management The Bow River already has 13 dams that control the levels of eight reservoirs All of these dams are relatively small and all were built for the purpose of generating hydroelectric power rather than conserving water supply in times of drought The 2013 flood event showed that the system of dams is too small to absorb storm surges furthermore if reservoir levels are kept high in order to see the human population through a drought there is less reserve capacity to absorb the waters from any potential flood Maintaining the integrity of wetlands can help buffer the effects of small increases in flow but as with human dams these natural systems are too small to protect against all major floods
Nutrient loading and chemical pollutants Nutrients like nitrogen and phosphorus are important for plant growth but if they reach the river at high concentrations they can cause explosive growth of
The colours of these illuminated balloons which floated down the Bow River during a 2010 festival reflect data from reports on water quality blue represents excess nutrients like nitrogen and phosophorus while turquoise indicates pesticides Credit Kim Faires via Flickr More information is available from the creators wwwriveroflightorg and wwwcreatmospherecom
Beaver wetlands in the Kananaskis All wetlands buffer river flow by holding water during wet periods and releasing it during dry ones In the Kananaskis beaver dams enhance this ef-fect by holding even more water than the wetlands could do on their own Although they can be ndash and in 2013 were ndash destroyed by flood waters beaver ponds nonetheless remain an import-ant part of the ecosystem and provide habitat for other ani-mals
Scientists have used aerial
photography to document the extent of beaver within the Kananaskis In provincial parks national parks or improvement districts (inhabited areas within parks) the proportion of wetlands with beaver dams was about 60 per cent However this drops to 40 per cent on First Nations territory and 20 per cent in municipal districts [18] Given the influence beaver have on stream flows and groundwater interfaces the loss of beaver dams could reduce the resiliency of rivers like the Bow [19]
Beaver-felled tree Credit Gary Scott via stockxchng
algae This algal bloom uses up all the dissolved oxygen leading to lsquodead zonesrsquo that kill fish and other aquatic life a phenomenon known as eutrophication As well some algal species also produce their own natural toxins which make the water unsafe for drinking Excess nutrients come primarily from agricultural runoff but they can also come from municipal wastewater Treatment plants designed to remove such nutrients can be overwhelmed during high flows The outflows from such facilities can also still contain pharmaceutical compounds and other chemicals in the original wastewater that may not easily be degraded evidence from nearby watersheds shows that these compounds could potentially damage the health of fish[20] Emerging nutrient management techniques such as slow-release fertilizers and variable-rate application can reduce nutrient loads and potentially save money in the long term [21][22][23] Natural or artificial wetlands can corral algae blooms before they reach the larger watershed Wastewater treatment plants can be upgraded but such upgrades have a high upfront capital cost
Conclusion From the First Nations who once made their bows from the dogwoods and shrubs that grew along the riverrsquos banks to todayrsquos farmers and city-dwellers who depend on
it for drinking water electric power irrigation and sanitation the Bow remains a crucial lifeline Climate change and population increase are key challenges that will make it more difficult for the river to fulfill these roles in the future
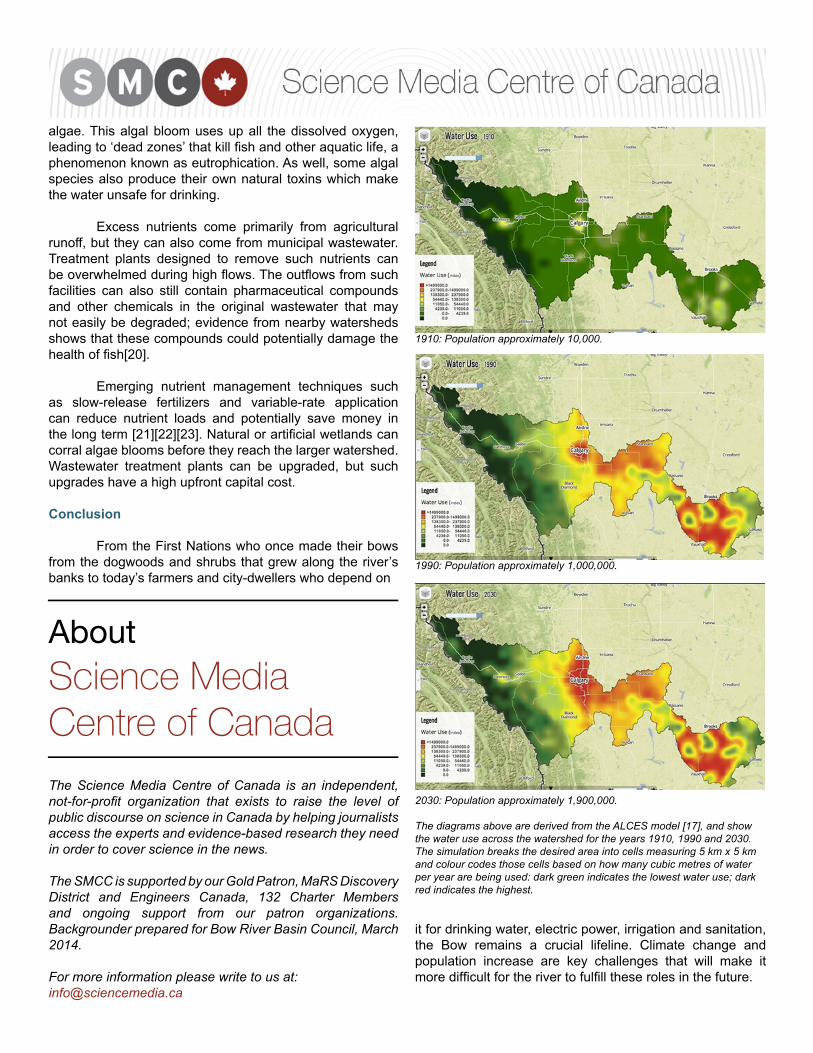
2030 Population approximately 1900000
The diagrams above are derived from the ALCES model [17] and show the water use across the watershed for the years 1910 1990 and 2030 The simulation breaks the desired area into cells measuring 5 km x 5 km and colour codes those cells based on how many cubic metres of water per year are being used dark green indicates the lowest water use dark red indicates the highest
AboutScience MediaCentre of CanadaThe Science Media Centre of Canada is an independent not-for-profit organization that exists to raise the level of public discourse on science in Canada by helping journalists access the experts and evidence-based research they need in order to cover science in the news
The SMCC is supported by our Gold Patron MaRS Discovery District and Engineers Canada 132 Charter Members and ongoing support from our patron organizations Backgrounder prepared for Bow River Basin Council March 2014
For more information please write to us at infosciencemediaca
1910 Population approximately 10000
1990 Population approximately 1000000
Expert Reviewers1 Barrie Bonsal Research Scientist Watershed Hydrology and Ecology Research Division Environment Canada2 Masaki Hayashi Professor Department of Geoscience University of Calgary3 Ronald Stewart Professor Department of Environment and Geography University of Manitoba4 Brad Stelfox Landscape Ecologist ALCES Landscape and Land Use Ltd5 Phillip Harder PhD Candidate Centre for Hydrology University of Saskatchewan
Bibliography1 Calgary Regional Partnership (2009) Calgary Metropolitan Plan Prepared by Calgary Regional Partnership pp292 Bow River Basin Council (2010) Bow River Basin State of the Watershed Summary Retrieved February 18 2014 URL httpwsowbrbcabca reportsBRBCWSOWBookletV2-Dec28pdf3 Data from Water Survey of Canada published by Environment Canada Retrieved February 18 2014 URL httpswwwecgccarhc-wscdefaultasplang=Enampn=894E91BE-14 Utting N (2004) Groundwater Surface Water Interaction West Nose Creek Thesis submission for BASc degree University of Calgary Calgary AB5 Neill CR and Watt EW (2001) Report on Six Case Studies of Flood Frequency Analyses Prepared for Alberta Transportation Civil Projects Branch (httpwwwinfratransgovabcaINFTRA_Contentdoctype30Productionffasixcasepdf)6 Whitfield P H Moore R D Fleming S W amp Zawadzki A (2010) Pacific Decadal Oscillation and the Hydroclimatology of Western CanadamdashReview and Prospects Canadian Water Resources Journal 35(1) 1ndash28 doi104296cwrj35010017 Zhang X Vincent LA Hoff WD Niitsoo A (2000) Temperature and Precipitation Trends in Canada During the 20th Century Atmosphere-Ocean 38 (3) 395-4298 Harder P Pomeroy J (2013 February 21-22) The Impact of Climate Change and Forest Management on the Hydrometeorology of Marmot Creek Research Basin Paper presented at Marmot Creek Research Basin Workshop University of Calgary Biogeoscience Institute Barrier Lake Field Station Kananaskis Country AB URL httpwwwusaskcahydrologyMarmotCrkWshop2013PDFsHarderpdf9 Analysis of data from the Water Survey of Canada by P Harder and J Pomeroy presented to the Partnership Group on Science and Engineering in Ottawa ON May 27 201010 Martz L Bruneau J and Rolfe JT (2007) Climate Change and Water South Saskatchewan River Basin Final Technical Report URL httpwww parccapdfresearch_publicationsssrb-final2007pdf11 Szeto K Henson W Stewart R Gascon G (2011) The Catastrophic June 2002 Prairie Rainstorm Atmosphere-Ocean 49 (4) 380-39512 Montreal Engineering Co Ltd (1973) City of Calgary flood study13 Bow River Basin Council (2010) Bow River Basin State of the Watershed Summary Retrieved February 18 2014 URL httpwsowbrbcabca reportsBRBCWSOWBookletV2-Dec28pdf14 Alberta Environment (2006) Approved Water Management Plan for the South Saskatchewan River Basin (Alberta) Retrieved March 5 2014 URL httpenvironmentalbertacadocumentsSSrb_Plan_Phase2pdf15 Ministerrsquos Advisory Group on Water Management and Allocation (2009) Recommendations for Improving Albertarsquos Water Management and Allocation Retrieved March 5 2014 URL httpenvironmentgovabcainfolibrary8239pdf16 Alberta Water Council (2009) Recommendations for Improving Albertarsquos Water Allocation Transfer System Retrieved March 5 2014 URL http wwwalbertawatercouncilcaPortals0pdfsWATSUP_web_FINALpdf17 Antoniuk T and Yarmoloy C (2011) Upper Bow River Basin Cumulative Effects Study ALCES Landscape and Land-Use Ltd18 Morrison A and Westbrook CJ (2013 May 26-30) Inventory of beaver dammed peatlands in the Canadian Rockies Paper presented at joint CGU-CWRA-CMOS Congress Saskatoon19 Westbrook CJ Cooper DJ Butler DR (2013) Beaver hydrology and geomorphology In Treatise on Geomorphology - Ecogeomorphology (Butler D and Hupp C eds) chapter 23 Academic Press San Diego pp 293-30620 Jeffries KM Jackson1 LJ Ikonomou MG Habibi HR (2010) Presence of natural and anthropogenic organic contaminants and potential fish health impacts along two river gradients in Alberta Canada Environmental Toxicology and Chemistry 29 (10) 2379 - 238721 Koch B Khosla R Frasier WM Westfall DG Inman D (2004) Economic feasibility of variable-rate nitrogen application utilizing site-specific management zones Agronomy Journal 96 (6) 1572-1580 22 Matson PA Naylor R Ortiz-Monasterio I (1998) Integration of Environmental Agronomic and Economic Fertilizer Management Science 280 (5360) 112-11523 Noellsch A J Motavalli PP Nelson KA Kitchen NR (2009) Corn Response to Conventional and Slow-Release Nitrogen Fertilizers across a Claypan Landscape Agronomy Journal 101 (3) 607-614

there is evidence that more severe floods have occurred in the past [5] The relative lack of severe floods from 1932 to 2005 may seem significant in human terms but the extremely variable local climate makes it hard to say if the frequency or severity of floods is increasing or decreasing Climatic cycles ndash some on the order of decades some even longer ndash affect the relative dryness or wetness of the region One example is the Pacific Decadal Oscillation (PDO) which is comparable to the El NintildeoLa Nintildea cycle but it fluctuates over a longer time scale (decades versus years) and operates in the north Pacific rather than the south In the lsquopositiversquo phase of PDO ocean temperatures in the west-central North Pacific become cool while those off the British Columbia coast become warm This tends to lead to warmer drier weather in Western Canada particularly in the winter which reduces winter snow accumulation and consequently the amount of water flowing into the river The lsquonegativersquo phase tends to have cooler wetter weather and may increase the probability of floods [6] Scientists believe we are now in a lsquonegativersquo phase which could last another 10 to 20 years There are other longer-term cycles that are still not well understood by climate scientists Super-imposed on all this are the effects of climate change While annual average temperatures across southern Canada have increased between 05 and 15 C over the past century[7] some local effects are even stronger Weather stations in the foothills of the Rocky Mountains show evidence of milder winters during October to March daily average temperatures have increased by about 2 degrees C and daily minimum temperatures by 3 to 4 degrees C since 1962 [8] Although these same stations show no trend in total precipitation the warmer winter temperatures mean lower snow accumulation They also mean earlier springs and when plants soak up moisture from soil and transpire it into the air less water is available to get into the river The result is lower summer flows raising issues of water scarcity Marmot Creek a well-studied tributary of the Kananaskis River which in turn flows into the Bow has lost a quarter of its flow over the last 50 years [8] the average flow of the Bow River at Banff has decreased by about 12 per cent over the last century[9] Itrsquos important to note that while the effects of climate change are important the reduction in flows is small compared to the amount that is taken out of the river by humans whether for drinking water in cities and towns or to irrigate crops On average humans withdraw about 22 per cent of the Bow Riverrsquos water in a dry year it can be even more[10]
Impacts of human development With access to easy water for drinking and
The Flood The 2013 Alberta floods were caused by a low-pressure system carrying warm moist air from the Gulf of Mexico which developed over Montana and started to move north toward the foothills in late June Blocked to the west by the Rocky Mountains and to the north by an Arctic high-pressure system the storm dumped more than 200 millimetres of rain ndash about half the average annual total for the area ndash in only two days The rain alone would have caused a flood but the warm humid air and rain falling on snow also melted the mountain snowpacks and the still-frozen ground was unable to absorb any of the extra water Apart from its localized nature and the fact that it remained stationary for so long (features still being studied by meteorologists) this weather system was not very different from other well-documented storms that have occurred in the area[11] Starting in the 1970s the Alberta government embarked on an extensive program of mapping flood hazard areas along the Bow these maps are available online They are based on the height of the land surrounding the river and the maximum river flow determined by scientists to have a one per cent chance of being equaled or exceeded in any year this is often called the ldquo100-year floodrdquo but in fact a flood of any magnitude can occur at any time Engineering reports[12] show that the estimated peak flow for a ldquo100-year floodrdquo is higher than the maximum observed in June 2013 in other words it was likely only a 50- to 70-year flood In Calgary and other communities many homes and businesses were located within the flood hazard areas that had been mapped out decades before Total damage was estimated at $3 billion to 5 billion Preventing development in flood plains would significantly reduce damage from future floods
This map produced by Alberta Environment (wwwenvinfogovabcaFloodHazard) shows the location of floodways (dark red) and flood fringes (light red) in downtown Calgary
transportation not to mention rich soils fertilized by periodic floods river valleys are always attractive for human settlement But a large and growing population is affecting the riverrsquos health on a variety of fronts
Water scarcity Besides providing drinking water for major communities like Canmore Cochrane and Calgary the Bow supports farmers who grow spring wheat durum wheat canola barley and alfalfa as well as those rearing cattle and other livestock In all the region produces roughly $2 billion worth of agricultural products each year more than 17 per cent of Albertarsquos total Unfortunately much of the water used to grow these crops is transpired through their leaves into the atmosphere and can be lost to the watershed That which does get returned can be contaminated with fertilizers pesticides or animal waste Until 2006 the provincial government issued permits called allocations to withdraw water from the Bow River for municipal agricultural or other use The current total that can be withdrawn under the allocation system is about 28 billion cubic metres per year nearly 60 per cent of the total flow of the river although not all permit holders withdraw their maximum entitlement Of the water withdrawn 71 per cent is used for agriculture while 18 per cent is for municipal drinking water[13] In 2006 responding to concerns over water scarcity Alberta Environment placed a moratorium on new allocations and imposed conditions on the transfer of existing allocations eg holding back 10 per cent of each transferred allocation to encourage conservation [14] A more comprehensive water allocation management system
is under review [15][16] The population of the Bow River basin is expected to double within the next few decades [17] further increasing pressure on this limited resource Dams and water management The Bow River already has 13 dams that control the levels of eight reservoirs All of these dams are relatively small and all were built for the purpose of generating hydroelectric power rather than conserving water supply in times of drought The 2013 flood event showed that the system of dams is too small to absorb storm surges furthermore if reservoir levels are kept high in order to see the human population through a drought there is less reserve capacity to absorb the waters from any potential flood Maintaining the integrity of wetlands can help buffer the effects of small increases in flow but as with human dams these natural systems are too small to protect against all major floods
Nutrient loading and chemical pollutants Nutrients like nitrogen and phosphorus are important for plant growth but if they reach the river at high concentrations they can cause explosive growth of
The colours of these illuminated balloons which floated down the Bow River during a 2010 festival reflect data from reports on water quality blue represents excess nutrients like nitrogen and phosophorus while turquoise indicates pesticides Credit Kim Faires via Flickr More information is available from the creators wwwriveroflightorg and wwwcreatmospherecom
Beaver wetlands in the Kananaskis All wetlands buffer river flow by holding water during wet periods and releasing it during dry ones In the Kananaskis beaver dams enhance this ef-fect by holding even more water than the wetlands could do on their own Although they can be ndash and in 2013 were ndash destroyed by flood waters beaver ponds nonetheless remain an import-ant part of the ecosystem and provide habitat for other ani-mals
Scientists have used aerial
photography to document the extent of beaver within the Kananaskis In provincial parks national parks or improvement districts (inhabited areas within parks) the proportion of wetlands with beaver dams was about 60 per cent However this drops to 40 per cent on First Nations territory and 20 per cent in municipal districts [18] Given the influence beaver have on stream flows and groundwater interfaces the loss of beaver dams could reduce the resiliency of rivers like the Bow [19]
Beaver-felled tree Credit Gary Scott via stockxchng
algae This algal bloom uses up all the dissolved oxygen leading to lsquodead zonesrsquo that kill fish and other aquatic life a phenomenon known as eutrophication As well some algal species also produce their own natural toxins which make the water unsafe for drinking Excess nutrients come primarily from agricultural runoff but they can also come from municipal wastewater Treatment plants designed to remove such nutrients can be overwhelmed during high flows The outflows from such facilities can also still contain pharmaceutical compounds and other chemicals in the original wastewater that may not easily be degraded evidence from nearby watersheds shows that these compounds could potentially damage the health of fish[20] Emerging nutrient management techniques such as slow-release fertilizers and variable-rate application can reduce nutrient loads and potentially save money in the long term [21][22][23] Natural or artificial wetlands can corral algae blooms before they reach the larger watershed Wastewater treatment plants can be upgraded but such upgrades have a high upfront capital cost
Conclusion From the First Nations who once made their bows from the dogwoods and shrubs that grew along the riverrsquos banks to todayrsquos farmers and city-dwellers who depend on
it for drinking water electric power irrigation and sanitation the Bow remains a crucial lifeline Climate change and population increase are key challenges that will make it more difficult for the river to fulfill these roles in the future
2030 Population approximately 1900000
The diagrams above are derived from the ALCES model [17] and show the water use across the watershed for the years 1910 1990 and 2030 The simulation breaks the desired area into cells measuring 5 km x 5 km and colour codes those cells based on how many cubic metres of water per year are being used dark green indicates the lowest water use dark red indicates the highest
AboutScience MediaCentre of CanadaThe Science Media Centre of Canada is an independent not-for-profit organization that exists to raise the level of public discourse on science in Canada by helping journalists access the experts and evidence-based research they need in order to cover science in the news
The SMCC is supported by our Gold Patron MaRS Discovery District and Engineers Canada 132 Charter Members and ongoing support from our patron organizations Backgrounder prepared for Bow River Basin Council March 2014
For more information please write to us at infosciencemediaca
1910 Population approximately 10000
1990 Population approximately 1000000
Expert Reviewers1 Barrie Bonsal Research Scientist Watershed Hydrology and Ecology Research Division Environment Canada2 Masaki Hayashi Professor Department of Geoscience University of Calgary3 Ronald Stewart Professor Department of Environment and Geography University of Manitoba4 Brad Stelfox Landscape Ecologist ALCES Landscape and Land Use Ltd5 Phillip Harder PhD Candidate Centre for Hydrology University of Saskatchewan
Bibliography1 Calgary Regional Partnership (2009) Calgary Metropolitan Plan Prepared by Calgary Regional Partnership pp292 Bow River Basin Council (2010) Bow River Basin State of the Watershed Summary Retrieved February 18 2014 URL httpwsowbrbcabca reportsBRBCWSOWBookletV2-Dec28pdf3 Data from Water Survey of Canada published by Environment Canada Retrieved February 18 2014 URL httpswwwecgccarhc-wscdefaultasplang=Enampn=894E91BE-14 Utting N (2004) Groundwater Surface Water Interaction West Nose Creek Thesis submission for BASc degree University of Calgary Calgary AB5 Neill CR and Watt EW (2001) Report on Six Case Studies of Flood Frequency Analyses Prepared for Alberta Transportation Civil Projects Branch (httpwwwinfratransgovabcaINFTRA_Contentdoctype30Productionffasixcasepdf)6 Whitfield P H Moore R D Fleming S W amp Zawadzki A (2010) Pacific Decadal Oscillation and the Hydroclimatology of Western CanadamdashReview and Prospects Canadian Water Resources Journal 35(1) 1ndash28 doi104296cwrj35010017 Zhang X Vincent LA Hoff WD Niitsoo A (2000) Temperature and Precipitation Trends in Canada During the 20th Century Atmosphere-Ocean 38 (3) 395-4298 Harder P Pomeroy J (2013 February 21-22) The Impact of Climate Change and Forest Management on the Hydrometeorology of Marmot Creek Research Basin Paper presented at Marmot Creek Research Basin Workshop University of Calgary Biogeoscience Institute Barrier Lake Field Station Kananaskis Country AB URL httpwwwusaskcahydrologyMarmotCrkWshop2013PDFsHarderpdf9 Analysis of data from the Water Survey of Canada by P Harder and J Pomeroy presented to the Partnership Group on Science and Engineering in Ottawa ON May 27 201010 Martz L Bruneau J and Rolfe JT (2007) Climate Change and Water South Saskatchewan River Basin Final Technical Report URL httpwww parccapdfresearch_publicationsssrb-final2007pdf11 Szeto K Henson W Stewart R Gascon G (2011) The Catastrophic June 2002 Prairie Rainstorm Atmosphere-Ocean 49 (4) 380-39512 Montreal Engineering Co Ltd (1973) City of Calgary flood study13 Bow River Basin Council (2010) Bow River Basin State of the Watershed Summary Retrieved February 18 2014 URL httpwsowbrbcabca reportsBRBCWSOWBookletV2-Dec28pdf14 Alberta Environment (2006) Approved Water Management Plan for the South Saskatchewan River Basin (Alberta) Retrieved March 5 2014 URL httpenvironmentalbertacadocumentsSSrb_Plan_Phase2pdf15 Ministerrsquos Advisory Group on Water Management and Allocation (2009) Recommendations for Improving Albertarsquos Water Management and Allocation Retrieved March 5 2014 URL httpenvironmentgovabcainfolibrary8239pdf16 Alberta Water Council (2009) Recommendations for Improving Albertarsquos Water Allocation Transfer System Retrieved March 5 2014 URL http wwwalbertawatercouncilcaPortals0pdfsWATSUP_web_FINALpdf17 Antoniuk T and Yarmoloy C (2011) Upper Bow River Basin Cumulative Effects Study ALCES Landscape and Land-Use Ltd18 Morrison A and Westbrook CJ (2013 May 26-30) Inventory of beaver dammed peatlands in the Canadian Rockies Paper presented at joint CGU-CWRA-CMOS Congress Saskatoon19 Westbrook CJ Cooper DJ Butler DR (2013) Beaver hydrology and geomorphology In Treatise on Geomorphology - Ecogeomorphology (Butler D and Hupp C eds) chapter 23 Academic Press San Diego pp 293-30620 Jeffries KM Jackson1 LJ Ikonomou MG Habibi HR (2010) Presence of natural and anthropogenic organic contaminants and potential fish health impacts along two river gradients in Alberta Canada Environmental Toxicology and Chemistry 29 (10) 2379 - 238721 Koch B Khosla R Frasier WM Westfall DG Inman D (2004) Economic feasibility of variable-rate nitrogen application utilizing site-specific management zones Agronomy Journal 96 (6) 1572-1580 22 Matson PA Naylor R Ortiz-Monasterio I (1998) Integration of Environmental Agronomic and Economic Fertilizer Management Science 280 (5360) 112-11523 Noellsch A J Motavalli PP Nelson KA Kitchen NR (2009) Corn Response to Conventional and Slow-Release Nitrogen Fertilizers across a Claypan Landscape Agronomy Journal 101 (3) 607-614