Embed Size (px)
Citation preview

Alberta’s “New Math”
St. Albert Chamber
of Commerce
January 13, 2016
Presented by:
Angus Watt Advisory Group

National Bank Financial is an indirect wholly-owned subsidiary of National Bank of Canada. TheNational Bank of Canada is a public company listed on the Toronto Stock Exchange (NA: TSX).** The securities or sectors mentioned herein are not suitable for all types of investors. Pleaseconsult your investment advisor to verify whether the securities or sectors suit your investor’sprofile as well as to obtain complete information, including the main risk factors, regardingthose securities or sectors.*** The information contained herein has been prepared by Angus Watt, an InvestmentAdvisor with National Bank Financial; the opinions expressed do not necessarily reflect those ofNational Bank Financial.**** While opinions expressed are based on analysis and interpretation of historical databelieved to be accurate the underlying data is not necessarily guaranteed as to accuracy.
Disclaimer
Alberta's "New Math"Alberta's "New Math"

Challenges
Alberta's "New Math"Alberta's "New Math"
New Provincial Government
New Federal Government
Lower commodity prices
Currency volatility
Low inflation
Instability of global growth
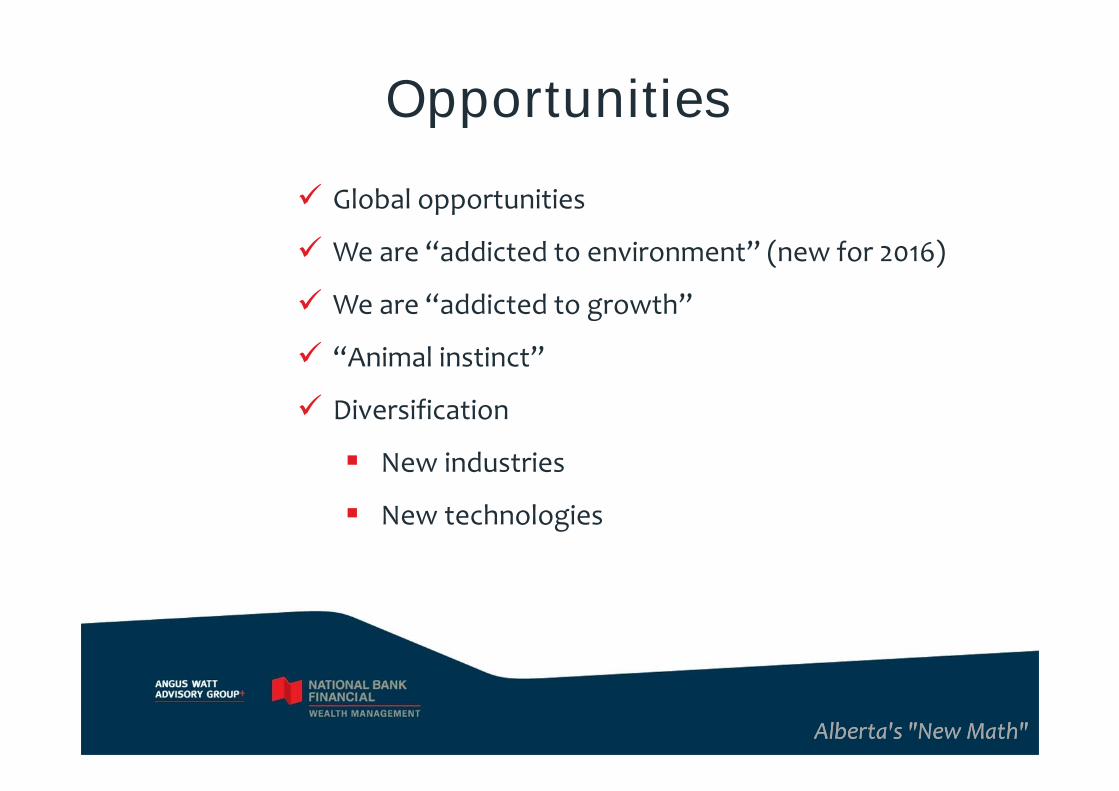
Opportunities
Alberta's "New Math"Alberta's "New Math"
Global opportunities
We are “addicted to environment” (new for 2016)
We are “addicted to growth”
“Animal instinct”
Diversification
New industries
New technologies

Messages over the Years
Alberta’s “New Math”Alberta’s “New Math”
Dr. Allard
Top 3 Principles whenInvesting in Real Estate.
True in business as well.
We are “addicted”to oil
We are “afraidof volatility”
We are “addicted”to low interest
rates
We are “addicted”to growth
“Animal Instinct”
“Stability leads toinstability”
We are“addicted” to
theenvironment
United States
Alberta's "New Math"Alberta's "New Math"

Alberta's "New Math"Alberta's "New Math"
Source: NBF Economics and Strategy (data via Datastream and Federal Reserve)
US: Key condition for Fed rate hike nowfulfilled
Fed funds rate vs. full-time employment

Alberta's "New Math"Alberta's "New Math"
Source: NBF Economics and Strategy (data via Datastream)
US: The Fed’s Dilemna
Core inflation vs unemployment rate
0
1
2
3
4
5
6
7
8
9
10
11
2
3
4
5
6
7
8
9
10
11
12
13
1960 1965 1970 1975 1980 1985 1990 1995 2000 2005 2010 2015
% (y/y)
Jobless rate(right)
%
Core PCE(left)

Alberta's "New Math"Alberta's "New Math"
Source: NBF Economics and Strategy (data via Federal Reserve of Atlanta)
US: Weak wage growth for 55+
Median wage growth by age group
Alberta's "New Math"Alberta's "New Math"
Source: NBF Economics and Strategy (data via Datastream)
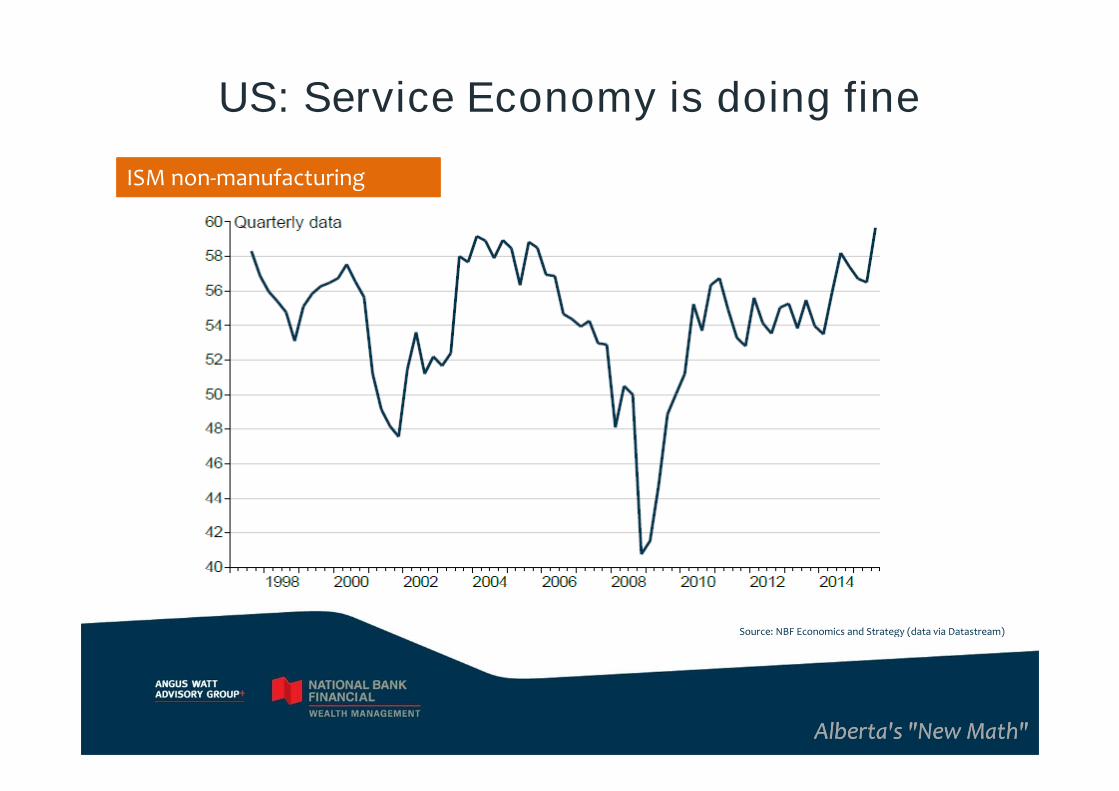
US: Service Economy is doing fine
ISM non-manufacturing

Alberta's "New Math"Alberta's "New Math"
Source: NBF Economics and Strategy (data via Datastream)
US: Manufacturing output hits new cyclicalhigh in July
Volume output

Alberta's "New Math"Alberta's "New Math"
Source: NBF Economics and Strategy (data via New York Fed)
US: Household re-leveraging a boon toauto industry
Share of household debit increase: 2013Q3 to 2015Q3

The Dynamics of Oil
Alberta's "New Math"Alberta's "New Math"

Source: NBF Economics and Strategy
Alberta's "New Math"Alberta's "New Math"
US: Early Winter Weather Forecast
MDA EarthStat ActualizedMDA EarthStat Forecast
Blues and purples are cold and bullish, yellows and reds are warm and bearishProjecting a drop in YOY heating degree day count of 17% for NovemberIf correct, it will reduce US gas demand by about 200 Bcf November 2015 vs
November 2014

Alberta's "New Math"Alberta's "New Math"
Brent oil vs current account breakeven price for Saudi Arabia
Source: NBF Economics and Strategy (data via IMF)
World: What should we aim for as a“fair” price?

Alberta's "New Math"Alberta's "New Math"
Evolution of geopolitical risks since 2008
Geopolitical tensions: Does“Obamacare”?
The worldin 2015 Q2
The worldin 2008
Alberta's "New Math"Alberta's "New Math"
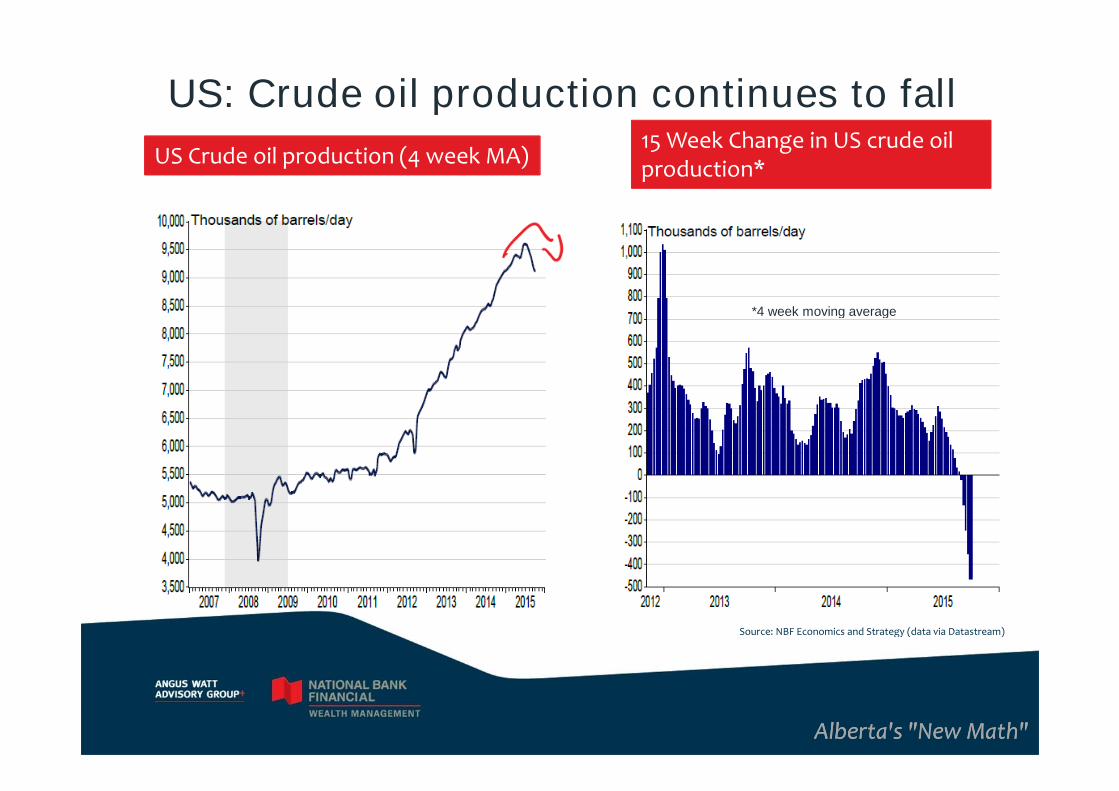
US: Crude oil production continues to fall
US Crude oil production (4 week MA)
Source: NBF Economics and Strategy (data via Datastream)
15 Week Change in US crude oilproduction*
*4 week moving average

Alberta's "New Math"Alberta's "New Math"
Source: NBF Economics and Strategy (data via Datastream)
World: Supply and Demand DynamicsGlobal oil demand and supply Global oil demand accounted by
OECD and non-OECD economies

Alberta's "New Math"Alberta's "New Math"
Source: NBF Economics and Strategy (data via EIA)
US: Exports of Crude Oil to Canada

Alberta's "New Math"Alberta's "New Math"
Source: The Canadian Press
Transcanada Energy East Pipeline

Canada: Recession or not?
Alberta's "New Math"Alberta's "New Math"
Alberta's "New Math"Alberta's "New Math"
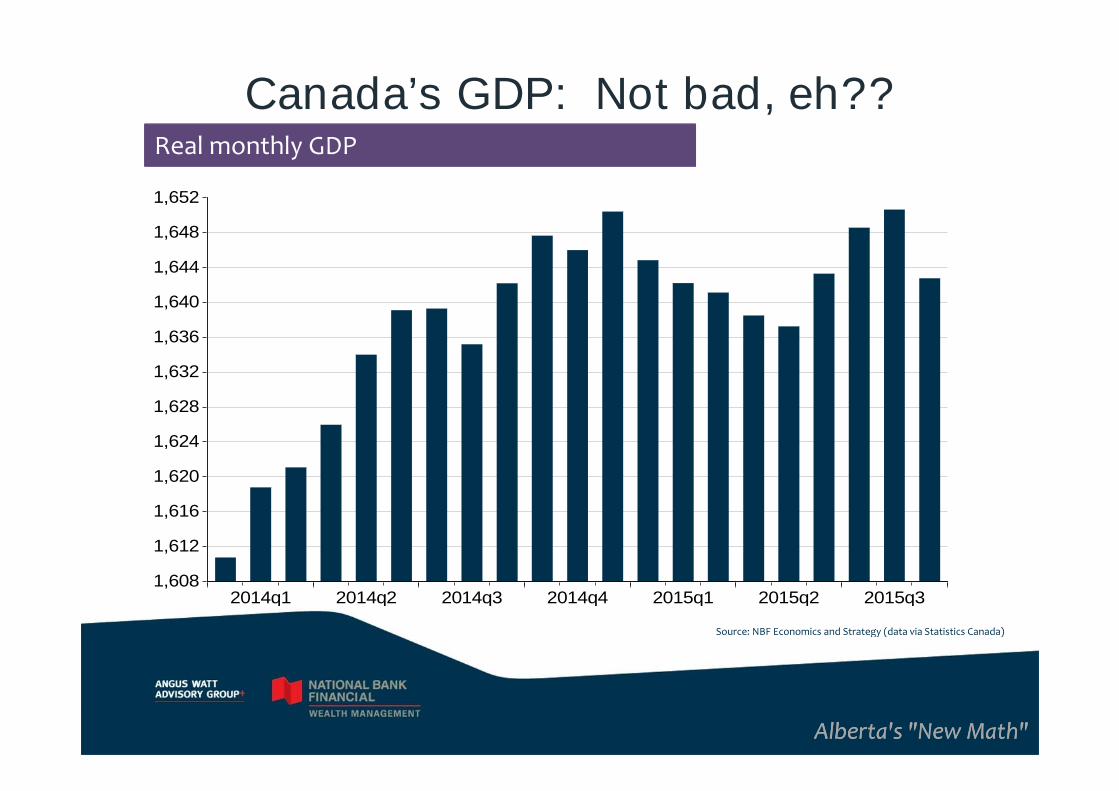
Real monthly GDP
Source: NBF Economics and Strategy (data via Statistics Canada)
Canada’s GDP: Not bad, eh??
1,608
1,612
1,616
1,620
1,624
1,628
1,632
1,636
1,640
1,644
1,648
1,652
2014q1 2014q2 2014q3 2014q4 2015q1 2015q2 2015q3
Alberta's "New Math"Alberta's "New Math"
YTD full-time employment by province
Source: NBF Economics and Strategy (data via Statistics Canada)
Perspective on labour markets
-1.6
-1.2
-0.8
-0.4
0.0
0.4
0.8
1.2
1.6
2.0
ON QC NB NS BC MB AB SK PE NF
BARFULLEMPPROVS
% change
Alberta's "New Math"Alberta's "New Math"
Source: NBF Economics and Strategy, (data via Statistics Canada and Datastream)
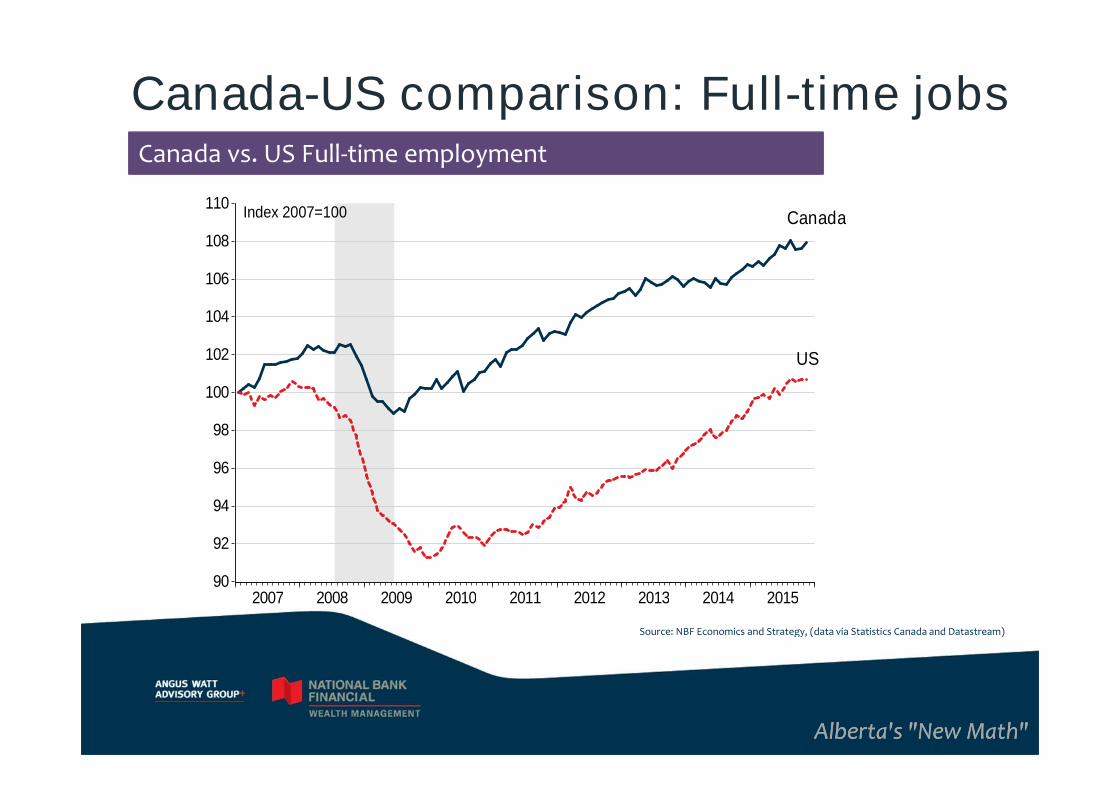
Canada-US comparison: Full-time jobsCanada vs. US Full-time employment
90
92
94
96
98
100
102
104
106
108
110
2007 2008 2009 2010 2011 2012 2013 2014 2015
Index 2007=100
US
Canada

Alberta's "New Math"Alberta's "New Math"
Source: NBF Economics and Strategy, (data via Desrosiers)
Canada: 2015 Record Year for Auto SalesNew motor vehicle sales inCanada (quarterly average)
1,350
1,400
1,450
1,500
1,550
1,600
1,650
1,700
1,750
1,800
1,850
1,900
1,950
2,000
2005 2006 2007 2008 2009 2010 2011 2012 2013 2014 2015
-15.0
-10.0
-5.0
0.0
5.0
10.0
BC ON QC Canada AB
Thousands (saar)* % change (as of Sep)
New motor vehicle sales in thefour largest provinces

Alberta's "New Math"Alberta's "New Math"
Real potential GDP growth: Canada vs the US
Source: NBF Economics and Strategy (data via OECD and Datastream)
Canada: BoC slashes potential GDP growth
1.0
1.2
1.4
1.6
1.8
2.0
2.2
2.4
2.6
2.8
3.0
3.2
3.4
3.6
3.8
4.0
1980 1985 1990 1995 2000 2005 2010 2015
%
U.S.
Canada
Alberta's "New Math"Alberta's "New Math"
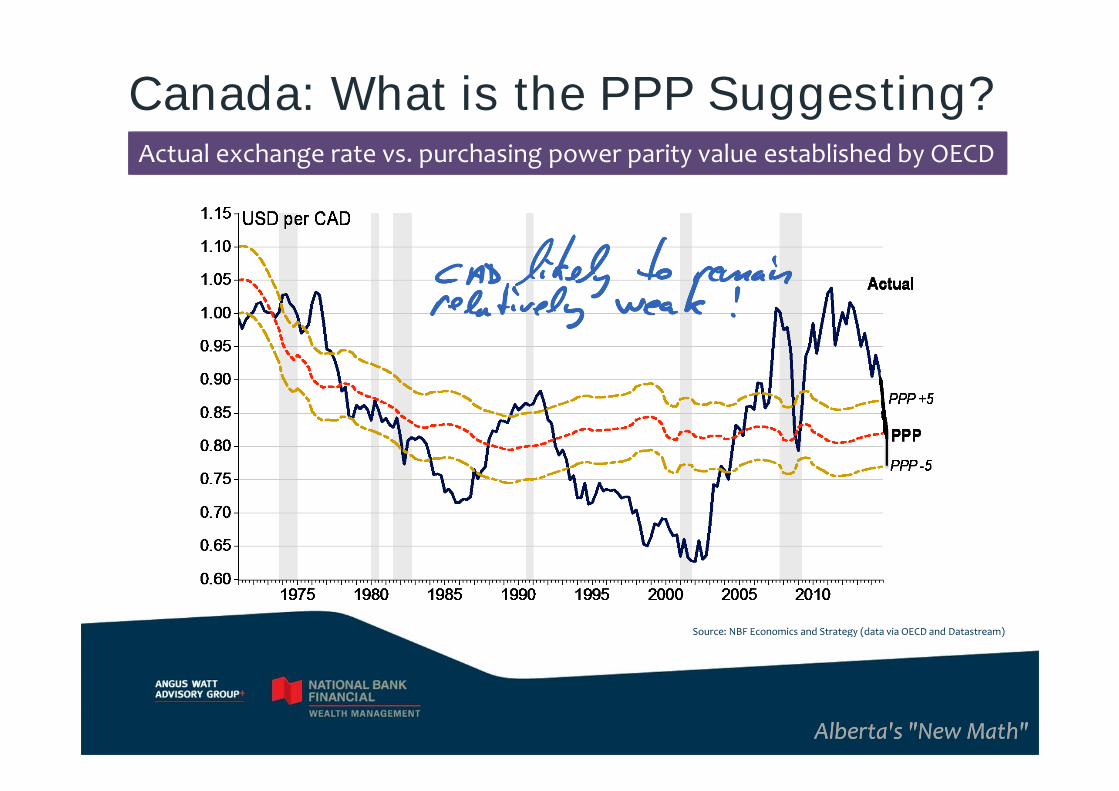
Actual exchange rate vs. purchasing power parity value established by OECD
Source: NBF Economics and Strategy (data via OECD and Datastream)
Canada: What is the PPP Suggesting?
Alberta's "New Math"Alberta's "New Math"
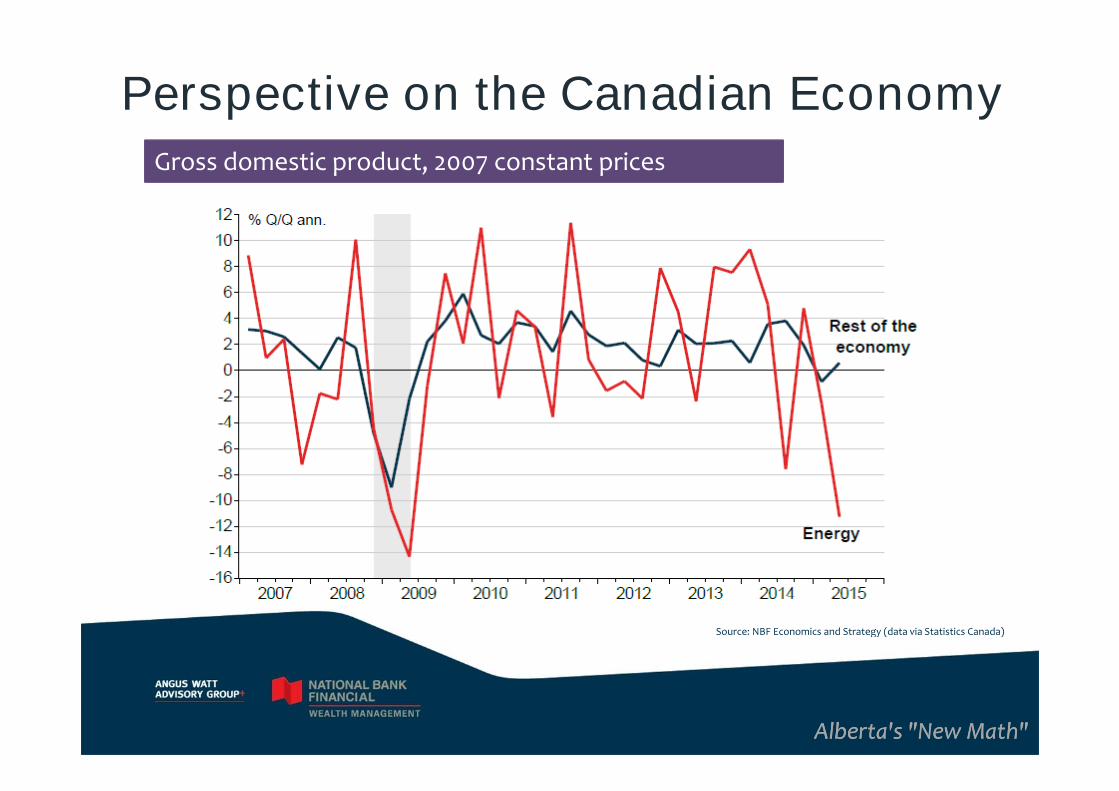
Gross domestic product, 2007 constant prices
Source: NBF Economics and Strategy (data via Statistics Canada)
Perspective on the Canadian Economy
Housing
Alberta's "New Math"Alberta's "New Math"

Source: US Bureau of Census, research.stlouisfed.org
Alberta's "New Math"Alberta's "New Math"
US Housing Starts (Annual Rate)
Nov/15:1,173 units

Alberta's "New Math"Alberta's "New Math"
US Housing Affordability
©2016 National Association of REALTORS®
*Effective rate on loans closed on existing homes - Federal Housing Finance Agency. Adjustable mortgage rates are not available since 2010.**Based on a 25% qualifying ratio for monthly housing expense to gross monthly income with a 20% down payment.
Year Month
Median PricedExisting SingleFamily Home
MortgageRate
MonthlyP & I
Payment
Paymentas % ofIncome
MedianFamilyIncome
QualifyingIncome**
AffordabilityIndex
Composite2012 177,200 3.83 663 12.7 62,527 31,824 196.52013 197,400 4.00 754 14.1 64,030 36,192 176.92014 208,900 4.31 828 15.1 65,910 39,744 165.82014 Oct 208,000 4.29 822 15.0 65,646 39,456 166.42014 Nov 207,900 4.16 809 14.8 65,803 38,832 169.52014 Dec 209,200 4.16 815 14.8 65,897 39,120 168.42015 Jan 198,600 4.04 762 13.8 66,145 36,576 180.82015 Feb 204,200 3.92 772 14.0 66,316 37,056 179.02015 Mar 212,100 3.95 805 14.4 66,993 38,640 173.42015 Apr 220,000 3.95 835 14.9 67,151 40,080 167.52015 May 230,500 3.90 870 15.5 67,322 41,760 161.22015 Jun 237,900 3.99 908 16.1 67,483 43,584 154.82015 Jul 233,400 4.19 912 16.2 67,614 43,776 154.52015 Aug 230,000 4.15 894 15.8 67,752 42,912 157.92015 Sep 223,300 4.10 863 15.3 67,802 41,424 163.72015 Oct 221,200 4.05 850 15.0 67,865 40,800 166.3

* Based on 2012 Statistics Canada data, Median total income (all census families).** National Bank of Canada 5 Year Fixed Mortgage Rate of 2.94%
*** Based on a 25% qualifying ratio for monthly housing expense to gross monthly income with a 20% down payment over 25 years.
Source: CREA, January 2016
Alberta's "New Math"Alberta's "New Math"
Canadian Housing Affordability
Nov-2015
MedianFamily
Income*
MedianPricedFamilyHome
MonthlyP & I
Payment**
Paymentas % ofIncome
QualifyingIncome***
AffordabilityIndex
Median PricedFamily Home/
Affordability IndexNov-2014
Toronto $68,810 $632,685 $2,380 41.51% $114,240 60.23 $577,936 65.94
Vancouver $67,090 $930,652 $3,564 63.75% $171,072 39.22 $804,450 43.68
Calgary $89,490 $444,959 $1,674 22.45% $80,352 111.37 $462,032 105.39
Edmonton(CMA)
$87,930 $369,559 $1,390 18.97% $66,720 131.79 $381,569 130.48
Alberta's "New Math"Alberta's "New Math"
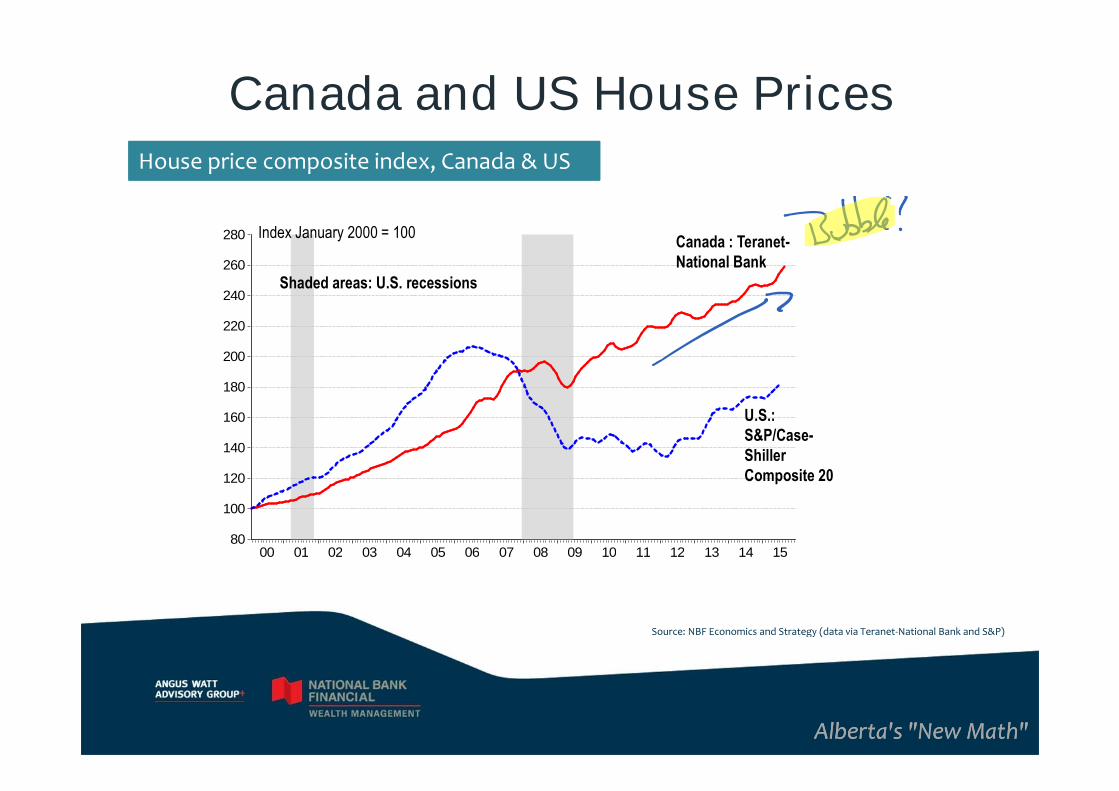
Canada and US House Prices
Source: NBF Economics and Strategy (data via Teranet-National Bank and S&P)
House price composite index, Canada & US
80
100
120
140
160
180
200
220
240
260
280
00 01 02 03 04 05 06 07 08 09 10 11 12 13 14 15
Canada : Teranet-National Bank
U.S.:S&P/Case-ShillerComposite 20
Shaded areas: U.S. recessions
Index January 2000 = 100

Alberta's "New Math"Alberta's "New Math"
Source: NBF Economics and Strategy (data from Statistics Canada and BEA)
Canada-US: Household net savings rate
Household net savings as a % of household disposable income
Market Performance
Alberta's "New Math"Alberta's "New Math"

Alberta's "New Math"Alberta's "New Math"
TSX: Officially in a Bear Market
Source: Datastream
-40
-30
-20
-10
0
10
-40
-30
-20
-10
0
10
2014 2015 2016
IndexIndex Stock market
S&PTSX ($ C) S&P 500 ($ US) S&PTSX ($ US)

Source: NBF Economics and Strategy (data via Bloomberg) 2015-12-11
Alberta's "New Math"Alberta's "New Math"
The BoA Merrill Lynch US High Yield (HY) and Investment grade (IF) Energy Index OASThe BoA Merrill Lynch US High Yield (HY) and Investment grade (IF) Energy Index OAS
US: Energy sector under significant stress
0
1
2
3
4
5
6
7
8
9
10
11
12
13
14
15
16
1998 2000 2002 2004 2006 2008 2010 2012 2014
HY
IG
%

Alberta's "New Math"Alberta's "New Math"
Corporate Yields
Source: Bank of America ML, Bloomberg
Past the Point of no Return

Alberta's "New Math"Alberta's "New Math"
Canadian Dollar Performance: 2015
Source: NBF Economics and Strategy (data via Statistics Canada, US Census, Eurostat)
Loonie Tuned

Alberta’s “New Math”
Alberta's "New Math"Alberta's "New Math"

Alberta's "New Math"Alberta's "New Math"
Alberta Statistics
Median age: 36
Median family income (2013) $97,390
Individual income (2013) $40,400
Population between 15-64 68%
Population between 0-14 20%
Population 65+ 12%

Source: The Globe and Mail (Conference Board of Canada*Information and communications technology
Data for the most recentyear available were used
Innovation Indicators CAD Nfld PEI NS NB Que ON MB SK AB BC
Public R&D B C A A+ C A A B D D C
Researchers D D- D- D- D- C C D- D- D- D
Connectivity C C B D C C B D C B B
Scientific articles B C C A D B B B B B B
Entrepreneurial ambition A B N/A B N/A B A A A+ A+ A+
Venture capital investment B C D- D D A B D- D D A
Business enterprise R&D E D- D- D- D- C D D- D- D- D-
ICT Investment* C D B C D C B C D C C
Patents D D- D- D- D- D D D- D- D D
Enterprise entry rate N/A A A D C D B B A A B
Labour productivity C B D- D D- D D D C B D
Innovation Report Card 6 Netherlands B 12 Australia C
1 Sweden A 7 Austria B 13 Belgium C
2 Denmark A 8 Norway B 14 Britain C
3 Finland A 9 Canada C 15 France C
4 United States B 10 Germany C 16 Ireland D
5 Switzerland B 11 Japan C
Canada Remains an Innovation Laggard
*Information and communications technology
Source: Conference Board of Canada, Sept 2015
Alberta's "New Math"Alberta's "New Math"
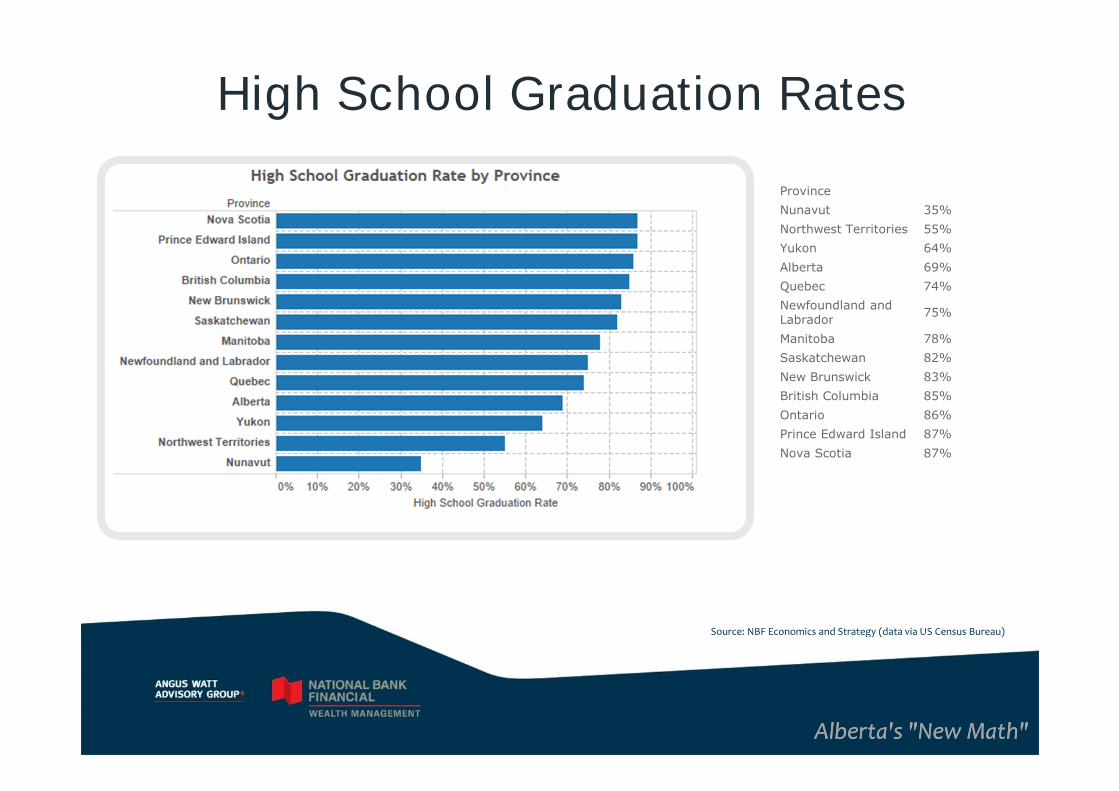
Source: NBF Economics and Strategy (data via US Census Bureau)
Province
Nunavut 35%
Northwest Territories 55%
Yukon 64%
Alberta 69%
Quebec 74%
Newfoundland andLabrador
75%
Manitoba 78%
Saskatchewan 82%
New Brunswick 83%
British Columbia 85%
Ontario 86%
Prince Edward Island 87%
Nova Scotia 87%
High School Graduation Rates

International perspective on populationgrowth
Source: NBF Economics and Strategy (data via Statistics Canada, US Census, Eurostat)
-0.5%
0.0%
0.5%
1.0%
1.5%
2.0%
2.5%
3.0%
3.5%
Alberta (2014) Canada (2014) US (2014) EURO ZONE (2013)
Natural Population growth
71%
67%42%
Alberta's "New Math"Alberta's "New Math"

Alberta's "New Math"Alberta's "New Math"
Small Business is BIG Business
SME businesses contribute more than 50% of Canada’s GDP
98.2% SMEs employ less than 100 people
More than 1.1 million SMEs
826,000 entrepreneurs
6.4 in 10 Canadians work in a SME
Financing is key to growth
Source: BDC Small Business Week 2015
Alberta's "New Math"Alberta's "New Math"
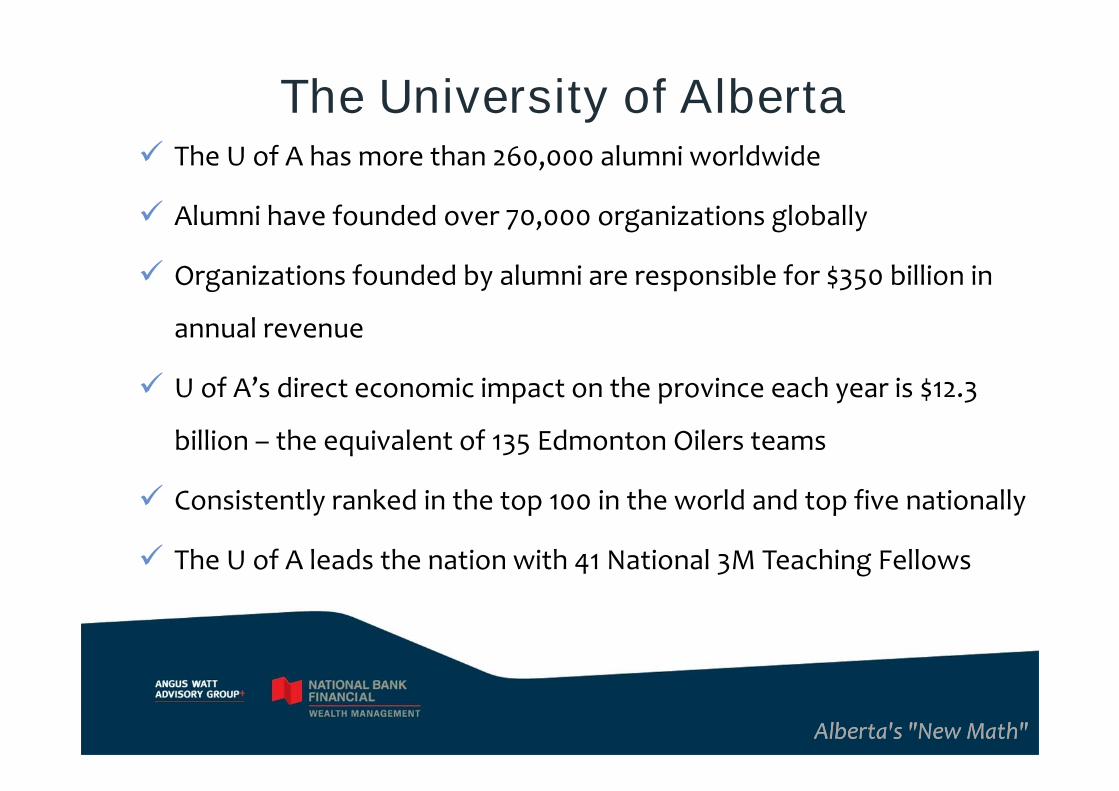
The University of Alberta The U of A has more than 260,000 alumni worldwide
Alumni have founded over 70,000 organizations globally
Organizations founded by alumni are responsible for $350 billion in
annual revenue
U of A’s direct economic impact on the province each year is $12.3
billion – the equivalent of 135 Edmonton Oilers teams
Consistently ranked in the top 100 in the world and top five nationally
The U of A leads the nation with 41 National 3M Teaching Fellows

Alberta’s Wage Hike
Alberta's "New Math"Alberta's "New Math"
HRIA (Human Resources Institute of Alberta) Survey Results:
Nearly 2/3 of companies will “adjust the wage & pay scale
across the organization”
62% said they would “raise prices for products and services”
Government and regulated agencies drive up costs
Nearly 50% said they will “reduce training” (serious health
and safety issues)
44% said they will “reduce or limit the number of entry-level
positions”
Source: Todd Hirsch, The Globe and Mail (November 5, 2015)

Alberta's "New Math"Alberta's "New Math"
Minimum Wage The Fraser Institute examined 12 Canadian studies on the relationship
between minimum wage and employment of young workers (15-24):
A 10% wage hike translates into 3-6% job loss
A 50% wage hike translates into 15-30% job loss and substantially reducesemployment opportunities for young and lower skilled Albertans
Other reductions include hours, benefits and training
Deprives gain of valuable on the job training
Evidence shows higher wages does not reduce poverty
87.5% of minimum wage workers in Canada do NOT live in lowincome households
In 2014, minimum wage workers in Alberta: 50% lived with parents
26% lived with spouse
2% were single parents
Alberta's "New Math"Alberta's "New Math"
Basic Costs: Households and Province of AB
Basic Household Costs
Mortgage
Food
Vehicle
Utilities
Insurance
Basic Alberta Costs
Health Care
Education
72% of consolidated government
expenses ($32.267 billion)
Salary costs are about 64% of
this expense ($20.680 billion)
Alberta's "New Math"Alberta's "New Math"
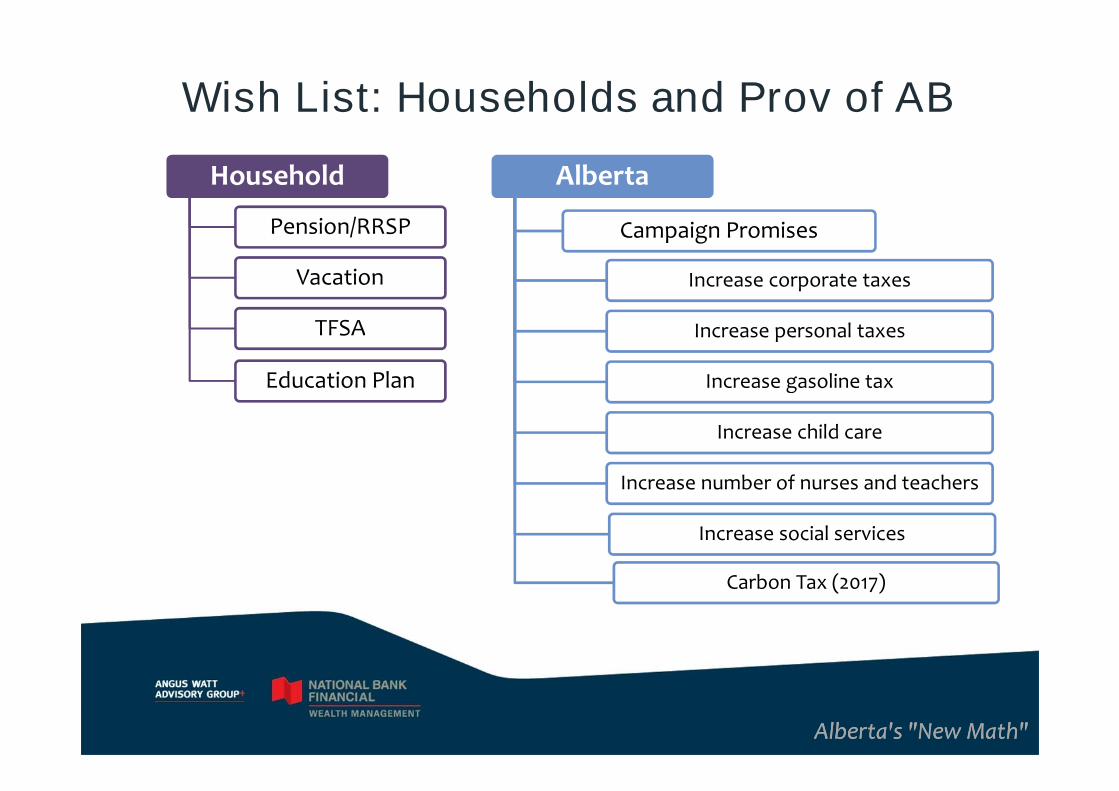
Wish List: Households and Prov of AB
Household
Pension/RRSP
Vacation
TFSA
Education Plan
Alberta
Campaign Promises
Increase corporate taxes
Increase personal taxes
Increase gasoline tax
Increase child care
Increase number of nurses and teachers
Increase social services
Carbon Tax (2017)

Alberta's "New Math"Alberta's "New Math"
Province of Alberta’s Income Supplement
Year New Debt CumulativeDebt*
2015 $6,000 $6,000
2016 $8,000 $14,000
2017 $10,000 $24,000
2018 $6,000 $30,000
2019 $6,000 $36,000* Interest not included
Personal Credit Card Debt …
What financial advice would you provide after year two?
…Bridge building versus day care

Summary
Alberta's "New Math"Alberta's "New Math"

Alberta's "New Math"Alberta's "New Math"
Summary
Global growth just above 3.0% in 2016
China continues to grow at under 7% with a different mix (consumer
driven)
Eurozone to do better (fiscal stimulus a possibility after Paris
attacks)
Geopolitical risks to remain an issue / liquidity in corporate bonds
World & US

Alberta's "New Math"Alberta's "New Math"
Summary
Growth below the U.S.: 1.6% vs 2.5% in 2016 and not much
acceleration in 2017
No rate hike before 2017 at earliest
Housing vulnerable to deterioration in labour markets and
affordability, but this is not a 2016 story
Canada

View Online Unsubscribe Subscription Settings Copyright © 2014 The Angus Watt Advisory Group
EXPECTED NORTH AMERICAN INFRASTRUCTURE SPENDING (NBF Research)
Canada 2016: expect approximately $20 billion of infrastructure spending including: Southwest Calgary Ring Road, Calgary Cancer Centre, Scarborough Subway extension and GordieHowe Bridge.
US: The $305 billion Fixing America’s Surface Transportation Act is increasing investment 17% to $12.6 billion by 2020.
ENERGY
Canadian National Energy Board approved the 1st
40 year LNG export license to a Shell facility in Kitimat, BC; past licenses have been 25 years.
Tensions between Saudi Arabia and Iran likely to put downward pressure on the price of oil due to a lower possibility of a coordinated production cut and competition market share.(source: Angelo Katsoras, National Bank Financial)
World’s biggest oil and gas producers are expected to cut investment again in 2016 and will focus on best producing wells.
December Russian oil output set another post-Soviet record up 0.4% M/M to 10.825 million boe/d.
CANADIAN ECONOMIC DATA
Canada added 23,000 jobs in December vs 10,000 expected; unemployment unchanged at 7.1%.
All jobs created were part-time and total hours worked were up 0.3%.
Ontario added 35,000 and Quebec 13,000 while BC lost 8,000, Alberta 4,000 and Sa skatchewan 5,000.
Alberta’s unemployment rate unchanged at 7%; average hours worked declined 4.3% 2015 Y/Y.
December average price of Vancouver single-family home increased 22.5% Y/Y.
RBC is increasing mortgage rates 0.10% on 2-5 year fixed term and 0.15% on 5 year variable rate.
US ECONOMIC DATA
US added 292,000 jobs in December vs 200,000 expected. November and October were both revised higher.
2015 US added an average of 221,000 jobs per month (284,000 /month Q4) vs 260,000 in 2014.
December unemployment rate was unchanged at 5% and labor participation rate is 62.6%.
December average hourly wages were unchanged M/M.
TIDBITS
Star Wars is now the highest grossing move in North American history, surpassing Avatar in just 20 days.
London failed EU limits on air pollution just 8 days into 2016. expanding restrictions on vehicle use to fight smog for the rest of winter ; drivers will be barred on alternate daysdepending on license plate numbers.
Beijing is expanding restrictions on vehicle use to fight smog for the rest of winter ; drivers will be barred on alternate days depending on license plate numbers.
China has created 3 new military units to modernize the army.
G7 will have to issue $7 trillion of debt in 2016 to refinance maturing issues.
Blackberry is building self-driving car software.
World Bank cut global growth forecast to 2.9% from 3.3% for 2016.
Opinions expressed in this document are those of The Angus Watt Advisory Group and are not necessarily those of National Bank Financial Group. National Bank Financial is an indirect wholly-owned subsidiary ofNational Bank of Canada. National Bank of Canada is a public company listed on the Toronto Stock Exchange (NA: TSX). National Bank Financial is a member of the Canadian Investor Protection Fund
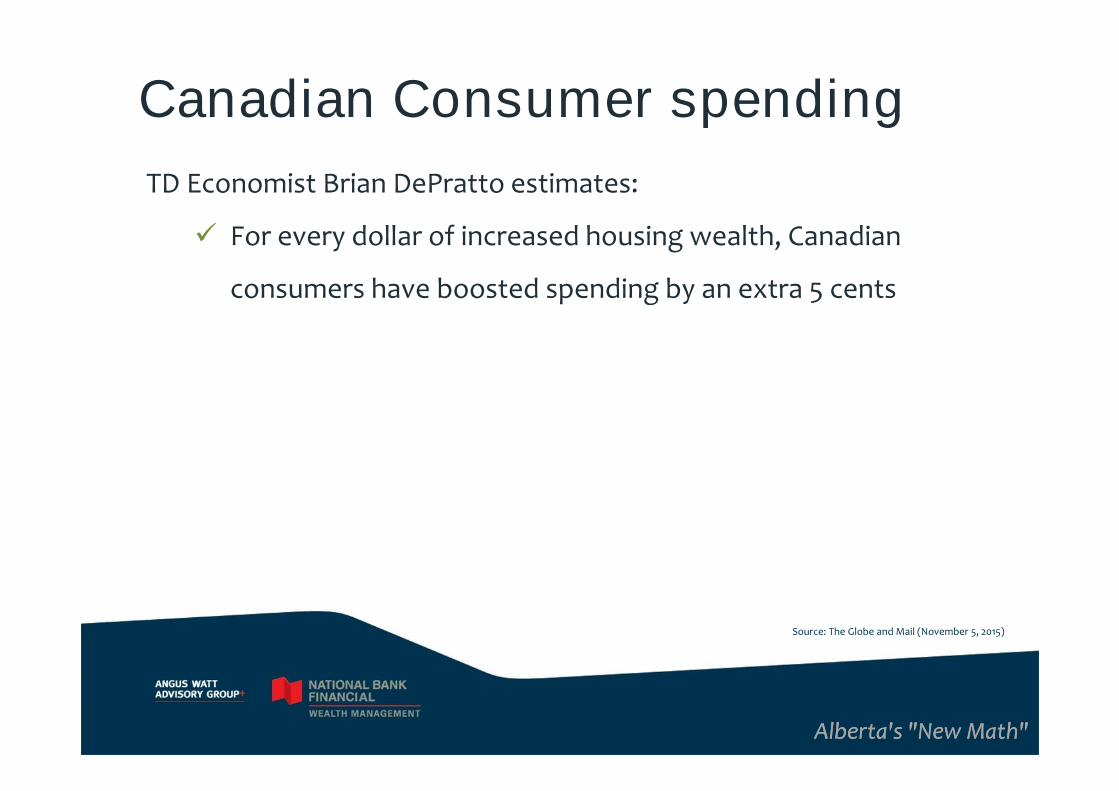
Canadian Consumer spending
Alberta's "New Math"Alberta's "New Math"
TD Economist Brian DePratto estimates:
For every dollar of increased housing wealth, Canadian
consumers have boosted spending by an extra 5 cents
Source: The Globe and Mail (November 5, 2015)