Embed Size (px)
Citation preview
Supported by:
PHYSICAL ACTIVITY
2015
ALBERTA SURVEY ON
A l b e r t a C e n t r e f o r A c t i v e L i v i n g
2015 Alberta Survey on Physical Activity 2
Report prepared by:
Christina Loitz, PhDKnowledge Translation SpecialistAlberta Centre for Active LivingFaculty of Physical Education and Recreation University of Alberta
Nora Johnston, MADirectorAlberta Centre for Active LivingFaculty of Physical Education and Recreation University of Alberta
Published by:
Alberta Centre for Active Living 3rd Floor, 11759 Groat Road Edmonton, Alberta, Canada T5M 3K6 Ph: 780.427.6949 E-mail: [email protected] Website: www.centre4activeliving.ca Facebook: /centre4activeliving Twitter: @4ActiveLiving YouTube: Centre4ActiveLiving1
© 2015 Alberta Centre for Active Living
All rights reserved. No part of this document may be reproduced, transmitted in any form or by any means, electronic, mechanical, photocopying, recording, or otherwise stored in a retrieval system, without written permission from the Alberta Centre for Active Living.

2015 Alberta Survey on Physical Activity 3
TABLE OF CONTENTSINFOGRAPHIC 4EXECUTIVE SUMMARYBackground
Key Findings• Physical Activity in Alberta• Walking in Alberta• Sedentary Behaviour Time in Alberta
Recommendations
5
FULL REPORT 8Leisure-time Physical Activity in AlbertaFactors Influencing Leisure-time Physical Activity
• Sociodemographic Factors • Psychological Factors
Predictors of Sufficient Physical Activity• Sociodemographic Predictors • Psychological Predictors • Environmental Predictors
12
Walking BehaviourSociodemographic Factors Influencing Walking Behaviour
• Age • Employment Status• Marital Status
23
Sedentary BehaviourSociodemographic Factors Associated with Sedentary Behaviour
• Age• Employment Status• Marital Status
26
Overall Summary 30References 35
Appendix 38
2015 Alberta Survey on Physical Activity 4

2015 Alberta Survey on Physical Activity 5
Background
Canadians are recommended to engage in a minimum of 150 minutes of
moderate-to-vigorous physical activity per week and minimize sedentary behaviour
(Canadian Society for Exercise Physiology, 2011). Sedentary behaviour refers to sitting or
lounging activities during waking hours (Sedentary Behaviour Research Network, 2012).
Adverse physiological outcomes associated with a sedentary lifestyle are independent and
distinct from those attributed to being physically inactive (Tremblay, Colley, Saunders, Healy, &
Owen, 2010).
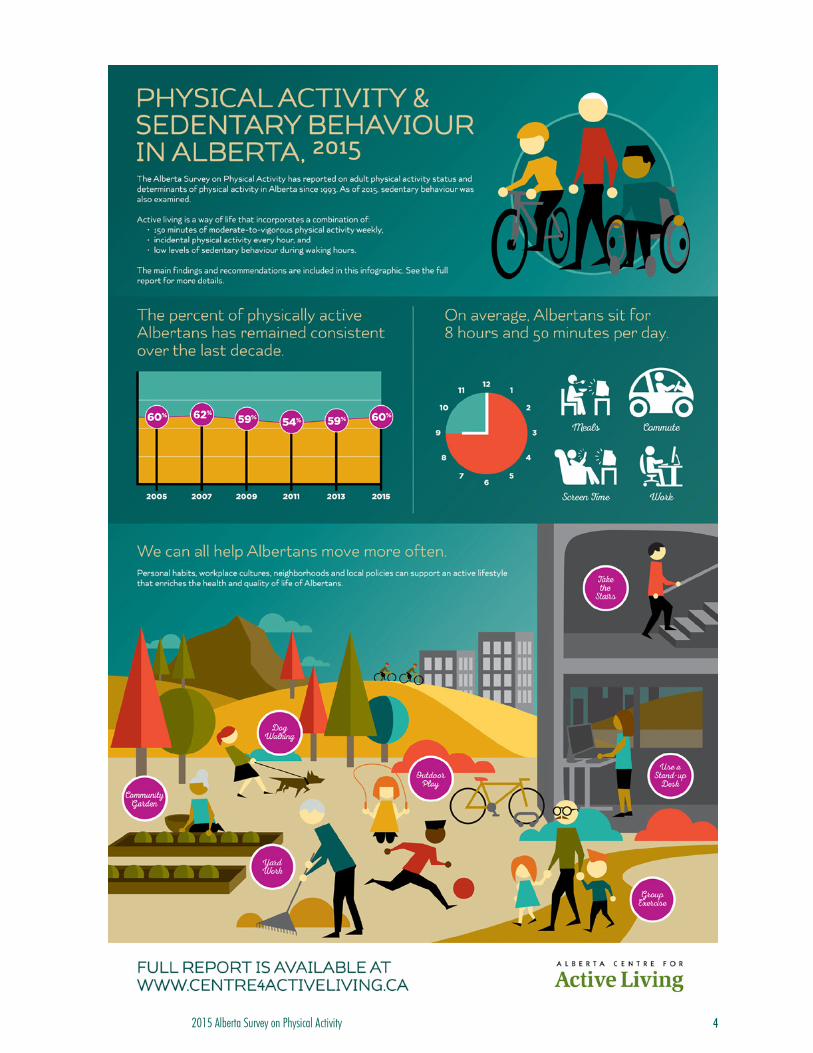
The Alberta Survey on Physical Activity has reported on the physical activity status of adult
Albertans since 1993. This is the first year that the Alberta Survey on Physical Activity has
reported on sedentary behaviour time of Albertans.
Report Highlights
Physical Activity in Alberta
Physical activity levels have remained relatively stable over the last decade.
60% of Albertans get enough physical activity
E X E C U T I V E
SUMMARY
Figure 1. Percent of physically active Albertans over the last decade.
(year)
(per
cent
)
2007 2009 2011 2013 2015
100
90
80
70
60
50
40
30
20
10
0
59%62%54%
59% 60%
2015 Alberta Survey on Physical Activity 6
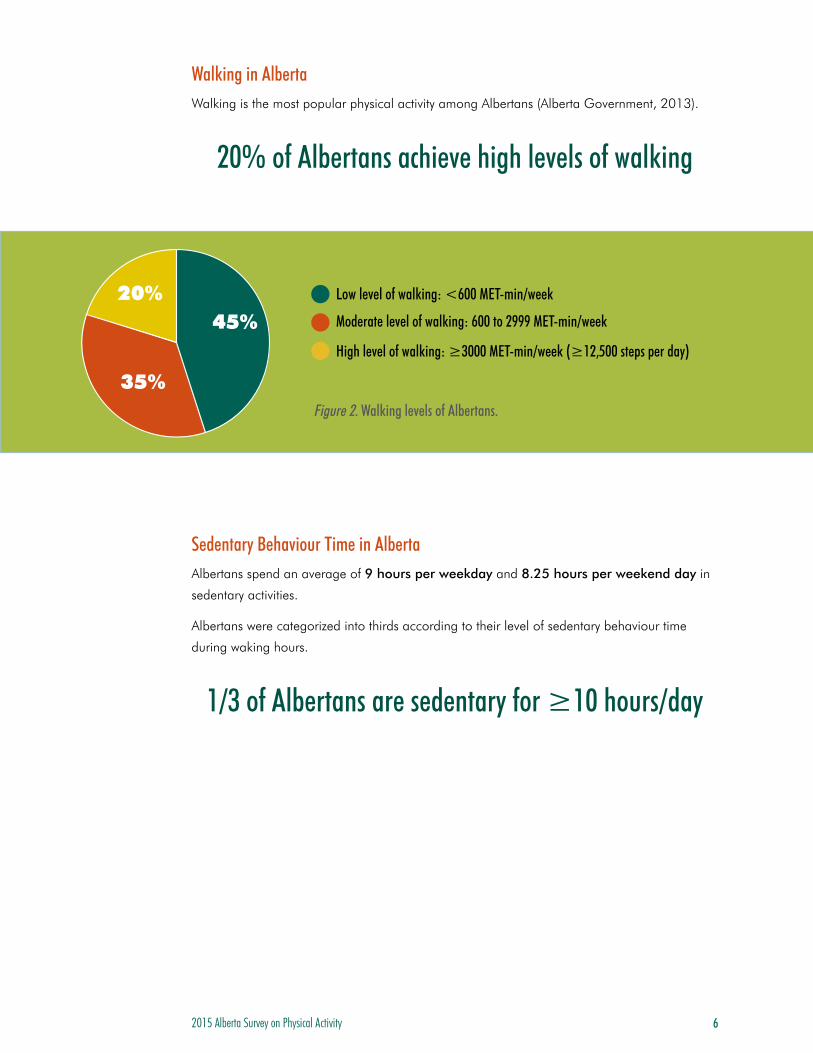
Walking in AlbertaWalking is the most popular physical activity among Albertans (Alberta Government, 2013).
20% of Albertans achieve high levels of walking
Sedentary Behaviour Time in Alberta Albertans spend an average of 9 hours per weekday and 8.25 hours per weekend day in
sedentary activities.
Albertans were categorized into thirds according to their level of sedentary behaviour time
during waking hours.
1/3 of Albertans are sedentary for ≥10 hours/day
Figure 2. Walking levels of Albertans.
35%
20%45%
Low level of walking: <600 MET-min/week
Moderate level of walking: 600 to 2999 MET-min/week
High level of walking: ≥3000 MET-min/week (≥12,500 steps per day)
2015 Alberta Survey on Physical Activity 7
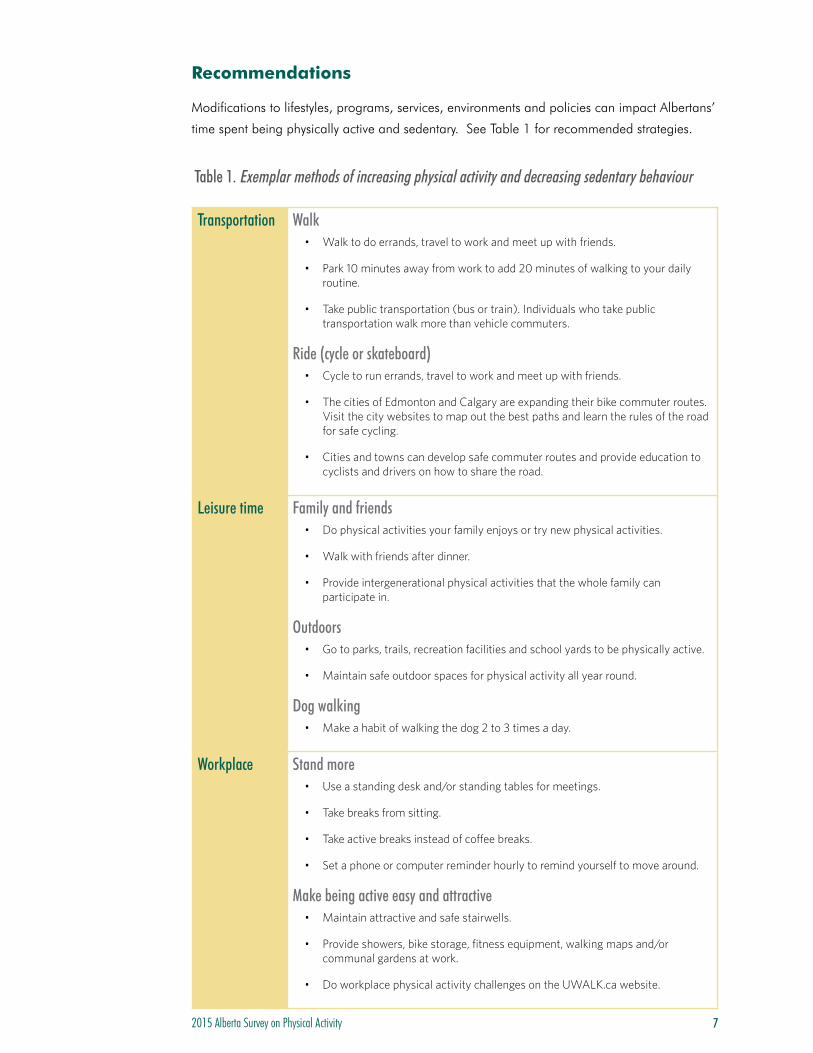
Recommendations
Modifications to lifestyles, programs, services, environments and policies can impact Albertans’
time spent being physically active and sedentary. See Table 1 for recommended strategies.
Table 1. Exemplar methods of increasing physical activity and decreasing sedentary behaviour
Transportation Walk• Walk to do errands, travel to work and meet up with friends.
• Park 10 minutes away from work to add 20 minutes of walking to your daily routine.
• Take public transportation (bus or train). Individuals who take public transportation walk more than vehicle commuters.
Ride (cycle or skateboard)• Cycle to run errands, travel to work and meet up with friends.
• The cities of Edmonton and Calgary are expanding their bike commuter routes. Visit the city websites to map out the best paths and learn the rules of the road for safe cycling.
• Cities and towns can develop safe commuter routes and provide education to cyclists and drivers on how to share the road.
Leisure time Family and friends• Do physical activities your family enjoys or try new physical activities.
• Walk with friends after dinner.
• Provide intergenerational physical activities that the whole family can participate in.
Outdoors• Go to parks, trails, recreation facilities and school yards to be physically active.
• Maintain safe outdoor spaces for physical activity all year round.
Dog walking• Make a habit of walking the dog 2 to 3 times a day.
Workplace Stand more• Use a standing desk and/or standing tables for meetings.
• Take breaks from sitting.
• Take active breaks instead of coffee breaks.
• Set a phone or computer reminder hourly to remind yourself to move around.
Make being active easy and attractive• Maintain attractive and safe stairwells.
• Provide showers, bike storage, fitness equipment, walking maps and/or communal gardens at work.
• Do workplace physical activity challenges on the UWALK.ca website.
2015 Alberta Survey on Physical Activity 8
Rationale
Physical inactivity and sedentary behaviour are risk factors for many chronic physical and
mental health conditions, such as cardiovascular disease, stroke, hypertension, colon cancers,
breast cancer, diabetes, depression and anxiety (Owen, Healy, Matthews, & Dunstan, 2010;
Warburton, Nicol, & Bredin, 2006).
The Canadian Physical Activity Guidelines recommend that adults engage in a minimum of
150 minutes of moderate-to-vigorous physical activity per week and minimize the amount
of sitting time to achieve health benefits (Canadian Society for Exercise Physiology, 2011).
Sedentary behaviour includes all sitting or lounging activities during waking hours, which
require very little energy expenditure (Sedentary Behaviour Research Network, 2012). Common
sedentary behaviours include computer work, watching television and driving or riding in a
vehicle. A sedentary lifestyle has physiological effects that are independent and distinct from
being physically inactive (Tremblay et al., 2010).
The Alberta Survey on Physical Activity has reported on the physical activity status of adult
Albertans since 1993. This survey imparts trends in physical activity status of Albertans over the
last three decades. The Alberta Survey on Physical Activity 2015 is the first provincial report to
include sedentary behaviour time of Albertans.
Background
Survey Methods The Alberta Centre for Active Living included a series of questions related to physical activity
and sedentary behaviour in the Alberta Survey, conducted by the Population Research
Laboratory at the University of Alberta.
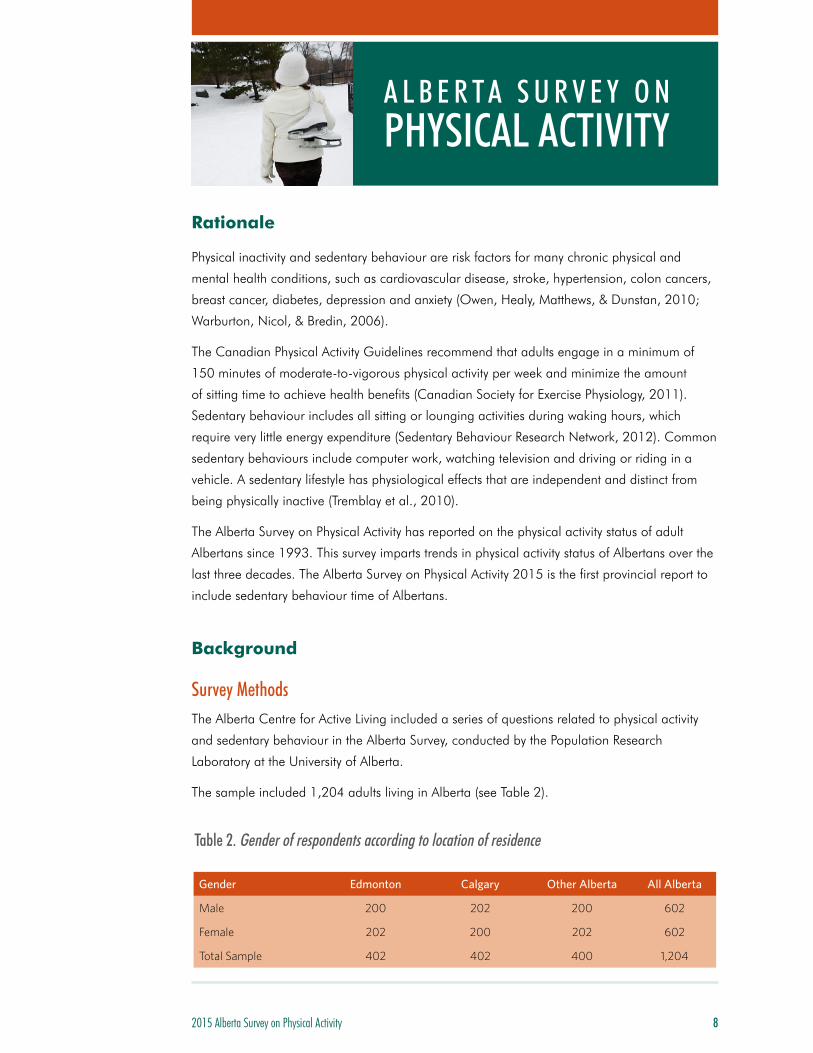
The sample included 1,204 adults living in Alberta (see Table 2).
Table 2. Gender of respondents according to location of residence
Gender Edmonton Calgary Other Alberta All Alberta
Male 200 202 200 602
Female 202 200 202 602
Total Sample 402 402 400 1,204
A L B E R T A S U R V E Y O NPHYSICAL ACTIVITY

2015 Alberta Survey on Physical Activity 9
Data collection methods included the following:
• Telephone interviews were conducted between July 23rd and September 5th, 2014.
• Respondents were 18 years of age and older at the time of the survey and were living in
households that could be contacted by direct dialing.
• A random-digit dialing approach ensured that respondents had an equal chance of being
contacted whether or not their household was listed in a telephone directory.
• Questions were asked about:
� leisure-time physical activity
� walking
� sedentary behaviour
� self-efficacy, beliefs and attitudes about physical activity
� access to physical activity
� demographics
Data QualityTwenty percent of households contacted responded to the survey.
The random sample of 1,204 is considered accurate within +/-2.8%, 19 times out of 20.
Subsamples of 400 are considered accurate within +/-5.0%, 19 times out of 20.
Please note, the subsamples of Edmonton metropolitan, Calgary metropolitan and the rest of
Alberta do not necessarily represent the age and gender of the populations in those specific
regions. Caution is advised in generalizing the findings related to these subsamples to the
overall populations in these regions.
Leisure-time Physical ActivityTo estimate the leisure-time physical activity level of each respondent, the following questions
were asked (adapted from the Godin Leisure-Time Exercise Questionnaire, Godin & Shephard,
1997): Considering a 7-day period (week), we’d like to know how many times a week, on
average, you do the following kinds of activity for more than 15 minutes during your free time:
• Strenuous activity is exhausting and typically makes you sweat and your heart beat faster
(e.g., running, hockey, soccer, aerobics, cross country skiing and vigorous swimming).
• Moderate activity is not exhausting (e.g., fast walking, easy bicycling, easy swimming and
dancing).
• Mild activity requires only minimal effort and doesn’t usually cause you to sweat (e.g.,
yoga and easy walking).
2015 Alberta Survey on Physical Activity 10
Weekly frequencies of strenuous, moderate and mild activities were multiplied by their
estimated value in METs1 (nine, five and three, respectively). Then the total weekly leisure
activity was calculated by adding the products of the three components.
Based on cut-offs determined by Bengoechea, Spence, & McGannon (2005), men were
considered sufficiently physically active if they expended 38 METs per week and women
sufficiently physically active if they expended 35 METs per week.
According to Jacobs, Ainsworth, Hartman, & Leon (1993), these measures equal 300 to 400
MET-minutes per day which equals 2,000 kilocalories per week (Elosúa et al., 2000). An
energy expenditure of 2,000 kilocalories or more per week is associated with a reduced risk of
heart disease (Paffenbarger, Wing, & Hyde, 1978).
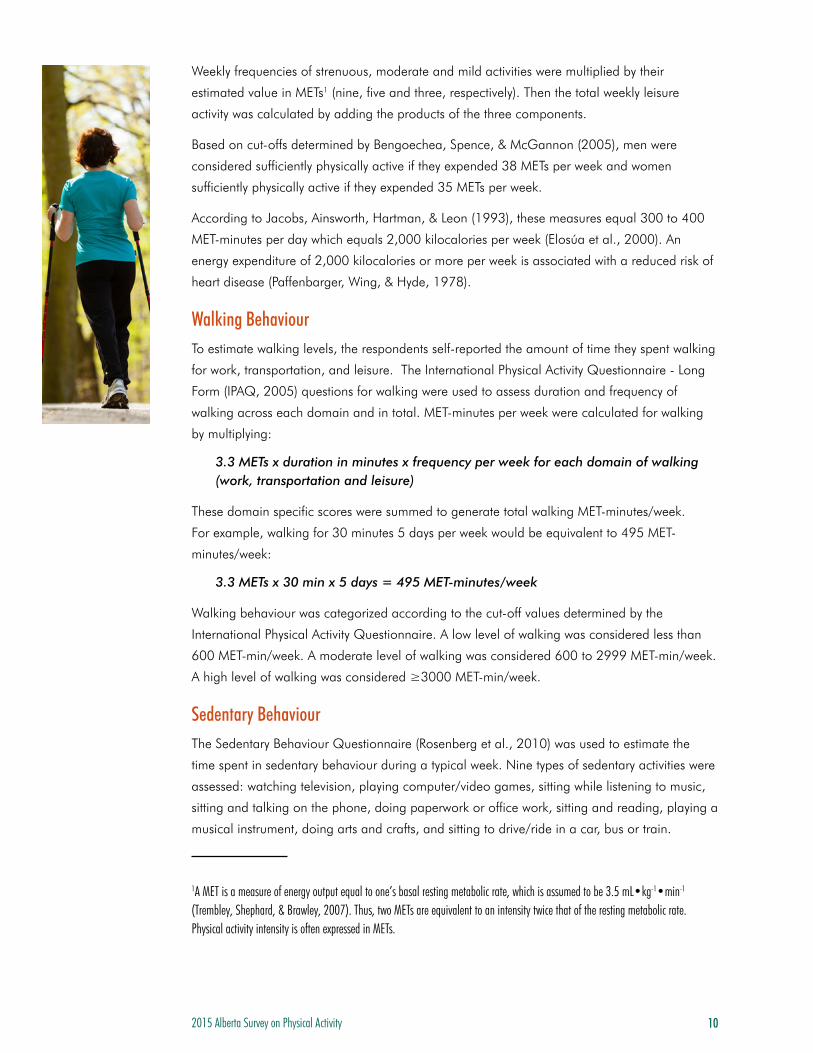
Walking Behaviour To estimate walking levels, the respondents self-reported the amount of time they spent walking
for work, transportation, and leisure. The International Physical Activity Questionnaire - Long
Form (IPAQ, 2005) questions for walking were used to assess duration and frequency of
walking across each domain and in total. MET-minutes per week were calculated for walking
by multiplying:
3.3 METs x duration in minutes x frequency per week for each domain of walking (work, transportation and leisure)
These domain specific scores were summed to generate total walking MET-minutes/week.
For example, walking for 30 minutes 5 days per week would be equivalent to 495 MET-
minutes/week:
3.3 METs x 30 min x 5 days = 495 MET-minutes/week
Walking behaviour was categorized according to the cut-off values determined by the
International Physical Activity Questionnaire. A low level of walking was considered less than
600 MET-min/week. A moderate level of walking was considered 600 to 2999 MET-min/week.
A high level of walking was considered ≥3000 MET-min/week.
Sedentary BehaviourThe Sedentary Behaviour Questionnaire (Rosenberg et al., 2010) was used to estimate the
time spent in sedentary behaviour during a typical week. Nine types of sedentary activities were
assessed: watching television, playing computer/video games, sitting while listening to music,
sitting and talking on the phone, doing paperwork or office work, sitting and reading, playing a
musical instrument, doing arts and crafts, and sitting to drive/ride in a car, bus or train.
1A MET is a measure of energy output equal to one’s basal resting metabolic rate, which is assumed to be 3.5 mL•kg-1•min-1 (Trembley, Shephard, & Brawley, 2007). Thus, two METs are equivalent to an intensity twice that of the resting metabolic rate. Physical activity intensity is often expressed in METs.
2015 Alberta Survey on Physical Activity 11
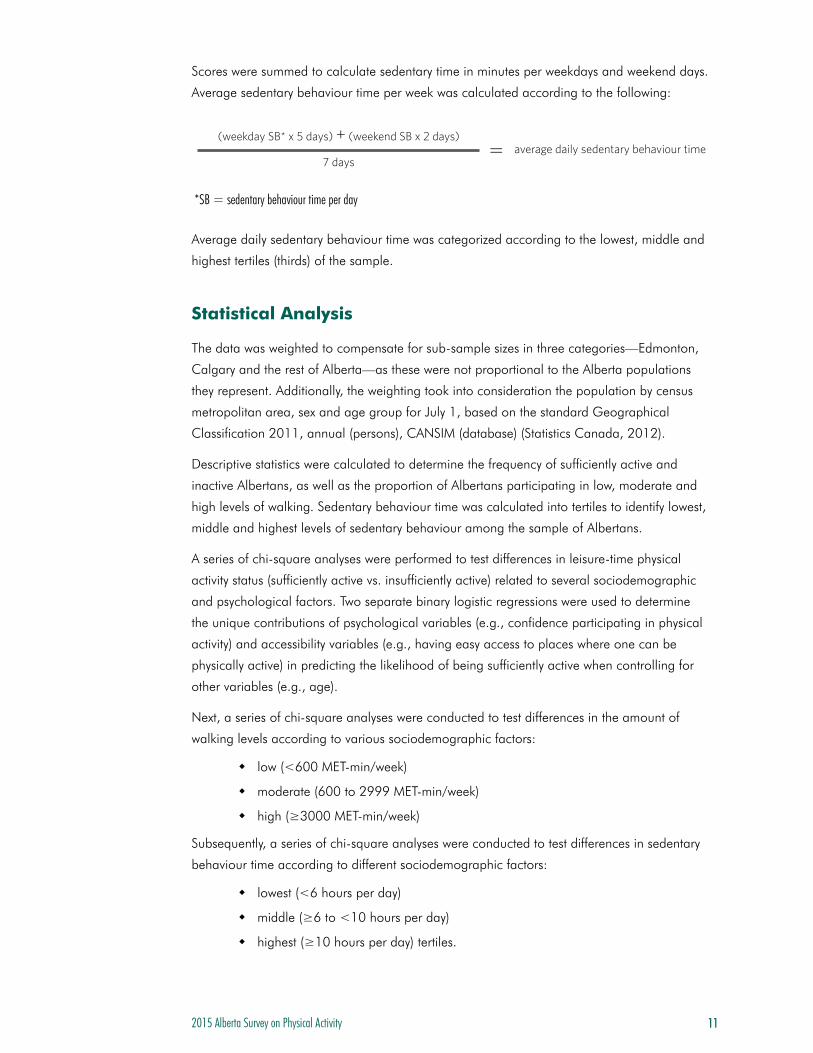
Scores were summed to calculate sedentary time in minutes per weekdays and weekend days.
Average sedentary behaviour time per week was calculated according to the following:
Average daily sedentary behaviour time was categorized according to the lowest, middle and
highest tertiles (thirds) of the sample.
Statistical Analysis
The data was weighted to compensate for sub-sample sizes in three categories—Edmonton,
Calgary and the rest of Alberta—as these were not proportional to the Alberta populations
they represent. Additionally, the weighting took into consideration the population by census
metropolitan area, sex and age group for July 1, based on the standard Geographical
Classification 2011, annual (persons), CANSIM (database) (Statistics Canada, 2012).
Descriptive statistics were calculated to determine the frequency of sufficiently active and
inactive Albertans, as well as the proportion of Albertans participating in low, moderate and
high levels of walking. Sedentary behaviour time was calculated into tertiles to identify lowest,
middle and highest levels of sedentary behaviour among the sample of Albertans.
A series of chi-square analyses were performed to test differences in leisure-time physical
activity status (sufficiently active vs. insufficiently active) related to several sociodemographic
and psychological factors. Two separate binary logistic regressions were used to determine
the unique contributions of psychological variables (e.g., confidence participating in physical
activity) and accessibility variables (e.g., having easy access to places where one can be
physically active) in predicting the likelihood of being sufficiently active when controlling for
other variables (e.g., age).
Next, a series of chi-square analyses were conducted to test differences in the amount of
walking levels according to various sociodemographic factors:
� low (<600 MET-min/week)
� moderate (600 to 2999 MET-min/week)
� high (≥3000 MET-min/week)
Subsequently, a series of chi-square analyses were conducted to test differences in sedentary
behaviour time according to different sociodemographic factors:
� lowest (<6 hours per day)
� middle (≥6 to <10 hours per day)
� highest (≥10 hours per day) tertiles.
average daily sedentary behaviour time=7 days
(weekday SB* x 5 days) + (weekend SB x 2 days)
*SB = sedentary behaviour time per day

2015 Alberta Survey on Physical Activity 12
Findings
Physical activity levels have remained stable over the last decade (see Table 17 in the appendix
for physical activity levels according to Edmonton, Calgary, and rest of Alberta).
60% of Albertans get enough physical activity
Figure 3. Percent of physically active Albertans over the last decade.
(year)
(per
cent
)
2007 2009 2011 2013 2015
100
90
80
70
60
50
40
30
20
10
0
59%62%54%
59% 60%
Alberta Winter Walk Day - warming up with stretching exercises
LEISURE-TIMEP H Y S I C A L A C T I V I T YL E V E L S I N A L B E R TA
2015 Alberta Survey on Physical Activity 13
Sociodemographic Factors
Sociodemographic factors assessed include gender, age, education, annual household
income, marital status, children in the household and employment status. Only significant
relationships between sociodemographic factors and physical activity participation were
included in this section.
Age Physical activity levels differ significantly according to age. Generally, physical activity levels
decrease as Albertans age. The proportion of sufficiently active Albertans dropped drastically
from the 18 to 24 years of age category to the 25 to 34 years of age category; and again,
from the 55 to 64 years of age category to the 65+ years of age category.
Factors InFluencIng leIsure-tIme PhysIcal actIvIty
Table 3. Albertans’ physical activity status according to age categories
• 18-24 years (77% physically active)
• 25-34 years (59% physically active)
• 35-44 years (66% physically active)
• 45-54 years (58% physically active)
• 55-64 years (60% physically active)
• 65+ years (42% physically active)
Age: X² (5, 1152) = 43.37, p < 0.001
2015 Alberta Survey on Physical Activity 14
Annual Household Income Physical activity levels are significantly different according to household income. The highest
rate of physical activity was reported by Albertans with a household income of $150,000 or
more. The proportion of physically active Albertans does not increase linearly according to
household income. The number of family members contributing to the household income was
not assessed.
Marital StatusThe proportion of sufficiently active Albertans is highest among those who are common-law or
have live-in-partners, followed by single people that have never been married.
• < $20,000 (59% physically active)
• $20,000 - $59,999 (54% physically active)
• $60,000 - $99,999 (57% physically active)
• $100,000 - $124,999 (48% physically active)
• $125,000 - $149,999 (55% physically active)
• ≥ $150,000 (73% physically active)
Annual Household Income: X² (5, 941) = 36.21, p < 0.001
Table 4. Albertans’ physical activity status according to household income
• Never married (single) (64% physically active)
• Married (59% physically active)
• Common-law/Live-in partner (79% physically active)
• Divorced (53% physically active)
• Separated (52% physically active)
• Widowed (41% physically active)
Marital Status: X² (5, 1181) = 23.74, p < 0.001
Table 5. Albertans’ physical activity status according to marital status
2015 Alberta Survey on Physical Activity 15
Employment StatusThe percent of Albertans who are sufficiently active varies according to employment status.
Albertans that are on a leave of absence, on disability, retired or semi-retired are less likely to
be active than students and employed Albertans.
• Full-time employment (61% physically active)
• Part-time employment (65% physically active)
• Student (69% physically active)
• Unemployed (69% physically active)
• Retired/Semi-retired (49% physically active)
• On leave/Disability (44% physically active)
Employment Status: X² (5, 1183) = 22.85, p < 0.001
Table 6. Albertans’ physical activity status according to employment status
2015 Alberta Survey on Physical Activity 16
Psychological Factors
Confidence in Physical Activity ParticipationParticipation in physical activity is related to a person’s confidence in his/her ability to
successfully execute the steps needed to be physically active. Three types of physical activity
self-efficacy were examined: general self-efficacy, coping self-efficacy and scheduling
self-efficacy. Higher levels of self-efficacy are associated with the initiation and maintenance of
regular physical activity.
The proportion of physically active Albertans increases with greater general, coping and
scheduling self-efficacy.
General self-efficacy: overall confidence to participate in regular physical activity.
• A lot (72% physically active)
• Some (43% physically active)
• None (23% physically active)
General Self-efficacy: X² (2, 1179) = 120.82, p < 0.001
Coping self-efficacy: confidence to overcome potential barriers to physical
activity such as bad weather, feeling tired or being in a bad mood.
• A lot (78% physically active)
• Some (59% physically active)
• None (25% physically active)
Copîng Self-efficacy: X² (2, 1181) = 120.09, p < 0.001
Scheduling self-efficacy: confidence to arrange one’s schedule to participate in
regular physical activity and overcome potential barriers associated with time
constraints.
• A lot (73% physically active)
• Some (51% physically active)
• None (27% physically active)
Scheduling Self-efficacy: X² (2, 1181) = 88.13, p < 0.001
Table 7. Albertans’ physical activity status according to levels of self-efficacy

2015 Alberta Survey on Physical Activity 17
Physical Activity Intentions and Beliefs Health outcome expectancy beliefs of physical activity, intentions to be physically active and
perceived behaviourial control to participate in regular physical activity were assessed.
Health outcome expectancies of physical activity are the respondents’ beliefs that regular
physical activity results in positive health consequences (Abraham, Conner, Jones, & O’Connor,
2008).
Perceived behavioural control refers to people’s perceptions of their ability to do physical
activity regularly (Abraham et al., 2008).
Intentions are a person’s readiness to engage in regular physical activity, and it is considered to
be the plan prior to engaging in physical activity (Abraham et al., 2008).
The proportion of sufficiently active Albertans increased as health outcome expectancy,
perceived behavioural control of physical activity, and behavioural intentions to be physically
active increased.
• Disagree (43% physically active)
• Neutral (43% physically active)
• Agree (62% physically active)
Health Outcome Expectations: X² (2, 1181) = 9.71, p < 0.001
• Disagree (30% physically active)
• Neutral (53% physically active)
• Agree (67% physically active)
Behavioural Intentions: X² (2, 1178) = 74.67, p < 0.001
• Disagree (35% physically active)
• Neutral (48% physically active)
• Agree (68% physically active)
Perceived Behavioural Control: X² (2, 1176) = 72.44, p < 0.001
Table 8. Albertans’ physical activity status according to health outcome expectancy, perceived behavioural control, and behavioural intentions to be physically active
2015 Alberta Survey on Physical Activity 18
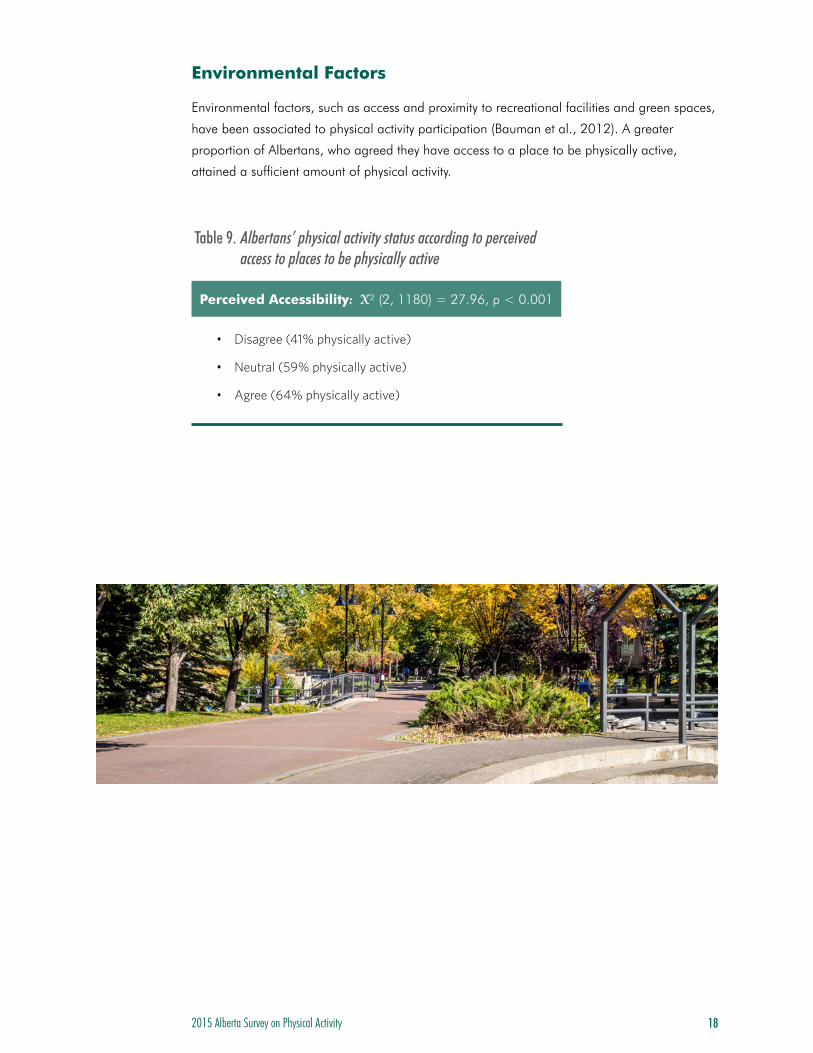
Environmental Factors
Environmental factors, such as access and proximity to recreational facilities and green spaces,
have been associated to physical activity participation (Bauman et al., 2012). A greater
proportion of Albertans, who agreed they have access to a place to be physically active,
attained a sufficient amount of physical activity.
• Disagree (41% physically active)
• Neutral (59% physically active)
• Agree (64% physically active)
Perceived Accessibility: X² (2, 1180) = 27.96, p < 0.001
Table 9. Albertans’ physical activity status according to perceived access to places to be physically active
2015 Alberta Survey on Physical Activity 19
Sociodemographic factors, psychological factors and environmental factors were assessed as
predictors of physical activity status using sequential logistic regression. The findings from these
analysis are below.
Sociodemographic Predictors
The first series of analysis assessed the ability of sociodemographic factors in predicting
physical activity status. Sociodemographic factors include gender, age, income, education,
employment status, children in the household and marital status. Only three sociodemographic
factors predicted physical activity status: age, employment status and marital status. See Table
18 in the appendix for the complete logistic regression results.
Age • Albertans, 25 to 34 years, were 0.45 times as likely to be physically active as Albertans
between 18 to 24 years.
• Albertans, 45 to 54 years, were 0.44 times as likely to be physically active as Albertans
between 18 to 24 years.
• Albertans, 65+ years, were 0.28 times as likely to be physically active as Albertans
between 18 to 24 years.
Employment status • Students in Alberta are 2.18 times more likely to be sufficiently physically active than
those with full-time employment.
Marital status • Albertans in common-law/live-in partner relationships are 3.34 times more likely to be
sufficiently physically active than single Albertans that have never been married.
Psychological Predictors After controlling for sociodemographic factors, the psychological predictors were assessed
according to physical activity status in the second step of the analysis. Examples of
psychological predictors are general self-efficacy, coping self-efficacy and intentions to
participate in regular physical activity. Physical activity status was able to be predicted
using coping self-efficacy, intentions to participate in physical activity and health outcome
expectancies of physical activity. See Table 18 in the appendix for the complete logistic
regression results.
PredIctors oF suFFIcIent PhysIcal actIvIty levels

2015 Alberta Survey on Physical Activity 20
Coping self-efficacy:
• Albertans with moderate levels of coping self-efficacy were 2.41 times more likely to be
sufficiently physically active than those without coping self-efficacy.
• Albertans with high levels of coping self-efficacy were 3.88 times more likely to be
sufficiently physically active than those without coping self-efficacy.
Intentions to participate in regular physical activity:
• Albertans with moderate levels of intentions to be physically active were
2.66 times more likely to be sufficiently active than those lacking intentions to be
physically active.
• Albertans with high levels of intentions to be physically active were
2.47 times more likely to be sufficiently active than those lacking intentions to be
physically active.
Health outcome expectancy of physical activity:
• Albertans with moderate levels of health outcome expectancies of physical activity were
0.18 times as likely to be sufficiently physically active than those with no health outcome
expectancies.
Environmental PredictorsAfter controlling for sociodemographic factors, the environmental predictor (access to places to
be physically active) was assessed for physical activity status in the second step of the analysis
(see Table 19 in the appendix).
Access to places to be physically active:
• Albertans that have access to a place to be physically active were 2.18 times more likely
to be sufficiently physically active than those that did not have access to a place to be
physically active.
2015 Alberta Survey on Physical Activity 21
The proportion of physically active Albertans has remained relatively constant over the last
decade.
60% of Albertans report participating in a sufficient amount of physical activity for health benefits
Examining physical activity levels according to sociodemographic factors can provide insight
in the development and implementation of physical activity programs and initiatives. These
demographic trends of Albertans can help identify:
1) Albertans who could benefit from assistance in the maintenance of their current
physically active lifestyle throughout their lifespan.
2) Physically inactive Albertans that need support to adopt a physically active lifestyle.
For example, physical activity levels drop drastically after the 18 to 24 years of age category,
and again, after the 55 to 64 years of age category. Learning more about how to maintain
physical activity after these two age categories may help support more Albertans, who are
already active, stay active throughout their lifespan.
Health behaviours, such as participation in physical activity, can be predicted according to
sociodemographic, psychological and environmental factors (Loitz et al., 2012). Students,
people in common-law/live-in relationships, people with moderate or high levels of coping
self-efficacy for physical activity, people with moderate to high levels of intentions to be
physically activity, and those reporting access to a place to be physically activity are more likely
to achieve a sufficient amount of physical activity.
summary oF albertans’ PhysIcal actIvIty status
2015 Alberta Survey on Physical Activity 22
Some potential barriers to physical activity are bad weather, feeling tired or being in a bad
mood. Helping Albertans develop confidence to overcome potential barriers could support the
initiation and maintenance of a physically active lifestyle. Albertans’ coping self-efficacy may
be enhanced by:
• Developing and disseminating materials that can help people overcome common barriers
in local or provincial programs and initiatives, e.g., provide babysitting, build places to
walk safely in the dark, cold, icy winter, and provide information on how support physical
activity in the workplace.
• Sharing stories about how Albertans have overcome their physical activity barriers. Stories
can be shared online (blogs, websites, Twitter and Facebook), in print and in programs
(e.g., cardiac rehabilitation groups, religious groups and parent groups).
• Speaking with clients. Health practitioners can talk with clients about barriers to physical
activity and assist them with developing a plan of action to overcome these barriers.
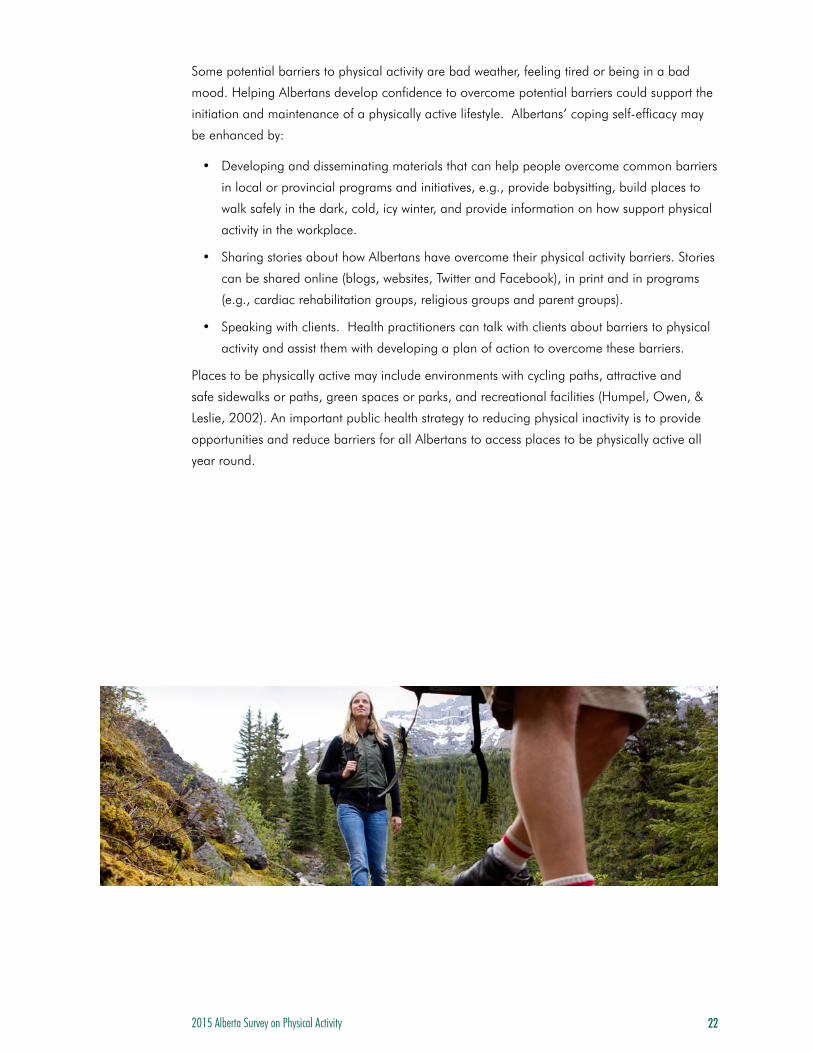
Places to be physically active may include environments with cycling paths, attractive and
safe sidewalks or paths, green spaces or parks, and recreational facilities (Humpel, Owen, &
Leslie, 2002). An important public health strategy to reducing physical inactivity is to provide
opportunities and reduce barriers for all Albertans to access places to be physically active all
year round.
2015 Alberta Survey on Physical Activity 23
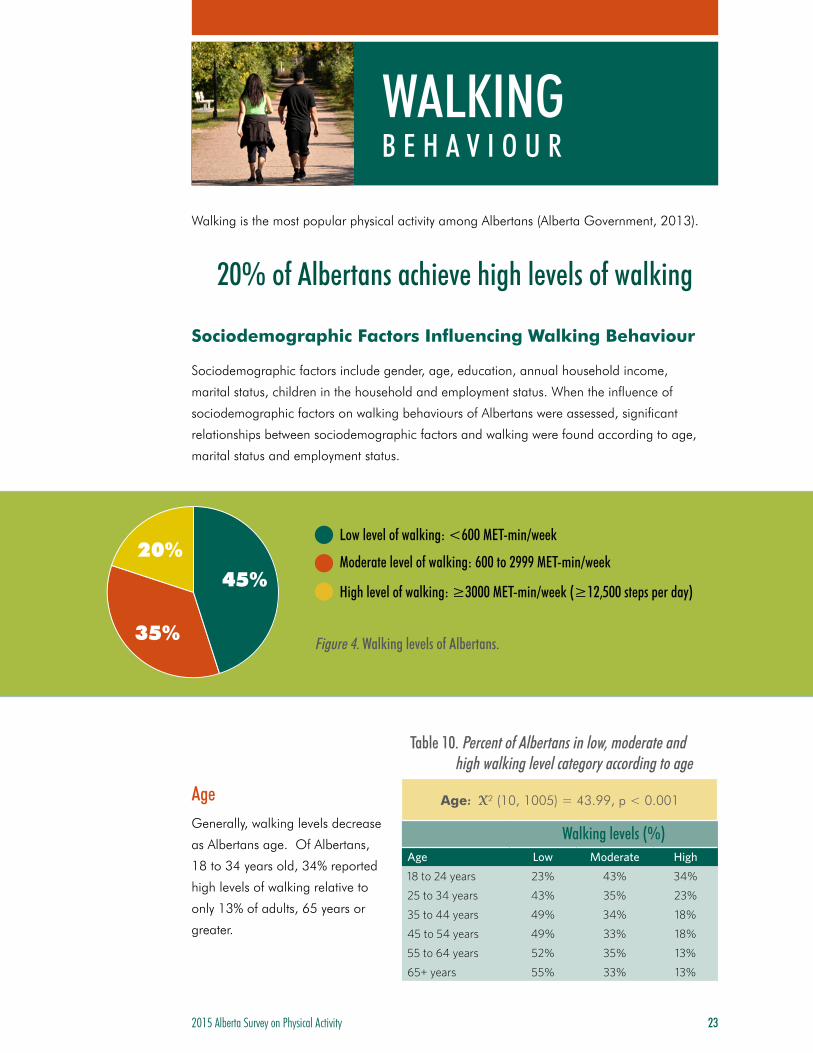
Walking is the most popular physical activity among Albertans (Alberta Government, 2013).
20% of Albertans achieve high levels of walking
Sociodemographic Factors Influencing Walking Behaviour
Sociodemographic factors include gender, age, education, annual household income,
marital status, children in the household and employment status. When the influence of
sociodemographic factors on walking behaviours of Albertans were assessed, significant
relationships between sociodemographic factors and walking were found according to age,
marital status and employment status.
Age Generally, walking levels decrease
as Albertans age. Of Albertans,
18 to 34 years old, 34% reported
high levels of walking relative to
only 13% of adults, 65 years or
greater.
WALKINGB E H A V I O U R
Table 10. Percent of Albertans in low, moderate and high walking level category according to age
Age: X² (10, 1005) = 43.99, p < 0.001
Walking levels (%)Age Low Moderate High
18 to 24 years 23% 43% 34%
25 to 34 years 43% 35% 23%
35 to 44 years 49% 34% 18%
45 to 54 years 49% 33% 18%
55 to 64 years 52% 35% 13%
65+ years 55% 33% 13%
Figure 4. Walking levels of Albertans.35%
20%45%
Low level of walking: <600 MET-min/week
Moderate level of walking: 600 to 2999 MET-min/week
High level of walking: ≥3000 MET-min/week (≥12,500 steps per day)

2015 Alberta Survey on Physical Activity 24
Employment Status Walking levels of Albertans vary according to employment status. Students and employed
Albertans report the greatest rates of walking.
58% of retired/semi-retired respondents participate in low levels of walking
Marital StatusAlbertans, who are in a common-law/live-in partner relationship, have the highest percentage
of people in the high level of walking category. Divorced, separated and widowed Albertans
have the greatest proportion of people in the lowest walking category.
Table 12. Percent of Albertans in low, moderate and high walking level categories according to marital status
Marital Status: X² (10, 1027) = 31.44, p < 0.001
Walking levels (%)Marital Status Low Moderate High
Never married (single) 39% 38% 23%
Married 47% 36% 18%
Common-law/Live-in partner 41% 20% 39%
Divorced 54% 33% 13%
Separated 53% 42% 5%
Widowed 58% 28% 15%
Table 11. Percent of Albertans in low, moderate and high walking level categories according to employment status
Employment Status: X² (5, 1183) = 22.85, p < 0.001
Walking levels (%)Employment Status Low Moderate High
Full-time employment 42% 36% 22%
Part-time employment 42% 28% 30%
Student 36% 46% 19%
Unemployed 52% 41% 7%
Retired/Semi-retired 58% 33% 9%
On leave/Disability 78% 22% 0%
2015 Alberta Survey on Physical Activity 25
20% of Albertans participate in high levels of walking
For most Albertans, walking is simple, free and enjoyable. Physical and psychological health
benefits can be gained from walking regularly (Warbuton et al., 2006). Incorporating walking
into one’s daily routine, for transportation from place-to-place and for leisure-time physical
activity, is a realistic goal for most Albertans.
Active commuting or using active transportation, such as walking to and from work, is one
method of scheduling regular physical activity (Bauman, Allman-Farinelli, Huxley, & James,
2008). Incorporating walking as a source of transportation required people to identify places
in their neighborhood or workplace where they could walk to do errands (stores or cafés) or
meet friends. However, for many Albertans, walking to work may not be possible. Additionally,
walking to use public transportation can help people attain the recommended amount of
physical activity (Besser & Dannenberg, 2005).
The first step to leisure-time walking is to identify areas that are convenient and enjoyable to
walk regularly. For convenience, home and workplace neighborhoods are common places
to plan leisure-time walks. The perceived environmental aesthetics, traffic, personal safety,
and pedestrian connectivity are four common correlates of walking (Saelens & Handy, 2008).
Identifying convenient and safe sidewalks, parks, walking tracks, paths or malls allows people
to create a walking plan. Additionally, dog ownership has been associated with greater
leisure-time walking (Christian et al., 2013).
summary oF albertans’ WalkIng status
2015 Alberta Survey on Physical Activity 26
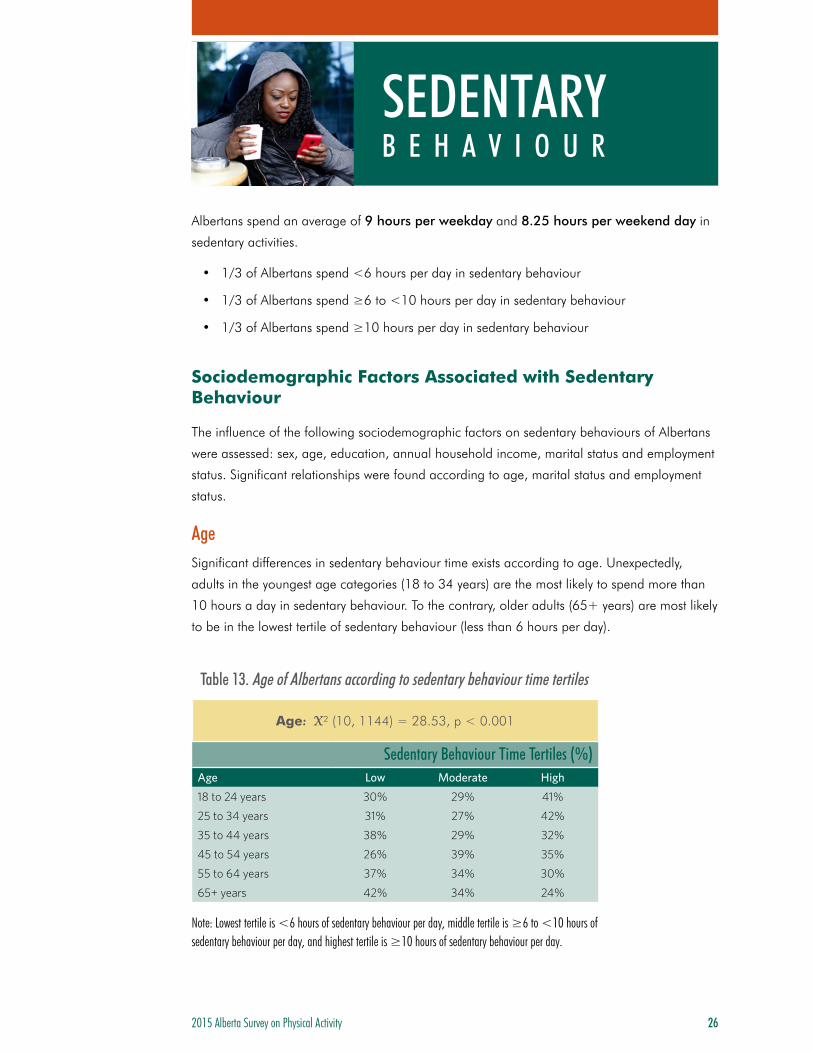
Albertans spend an average of 9 hours per weekday and 8.25 hours per weekend day in
sedentary activities.
• 1/3 of Albertans spend <6 hours per day in sedentary behaviour
• 1/3 of Albertans spend ≥6 to <10 hours per day in sedentary behaviour
• 1/3 of Albertans spend ≥10 hours per day in sedentary behaviour
Sociodemographic Factors Associated with Sedentary Behaviour
The influence of the following sociodemographic factors on sedentary behaviours of Albertans
were assessed: sex, age, education, annual household income, marital status and employment
status. Significant relationships were found according to age, marital status and employment
status.
AgeSignificant differences in sedentary behaviour time exists according to age. Unexpectedly,
adults in the youngest age categories (18 to 34 years) are the most likely to spend more than
10 hours a day in sedentary behaviour. To the contrary, older adults (65+ years) are most likely
to be in the lowest tertile of sedentary behaviour (less than 6 hours per day).
SEDENTARYB E H A V I O U R
Table 13. Age of Albertans according to sedentary behaviour time tertiles
Age: X² (10, 1144) = 28.53, p < 0.001
Sedentary Behaviour Time Tertiles (%)Age Low Moderate High
18 to 24 years 30% 29% 41%
25 to 34 years 31% 27% 42%
35 to 44 years 38% 29% 32%
45 to 54 years 26% 39% 35%
55 to 64 years 37% 34% 30%
65+ years 42% 34% 24%
Note: Lowest tertile is <6 hours of sedentary behaviour per day, middle tertile is ≥6 to <10 hours of sedentary behaviour per day, and highest tertile is ≥10 hours of sedentary behaviour per day.
2015 Alberta Survey on Physical Activity 27
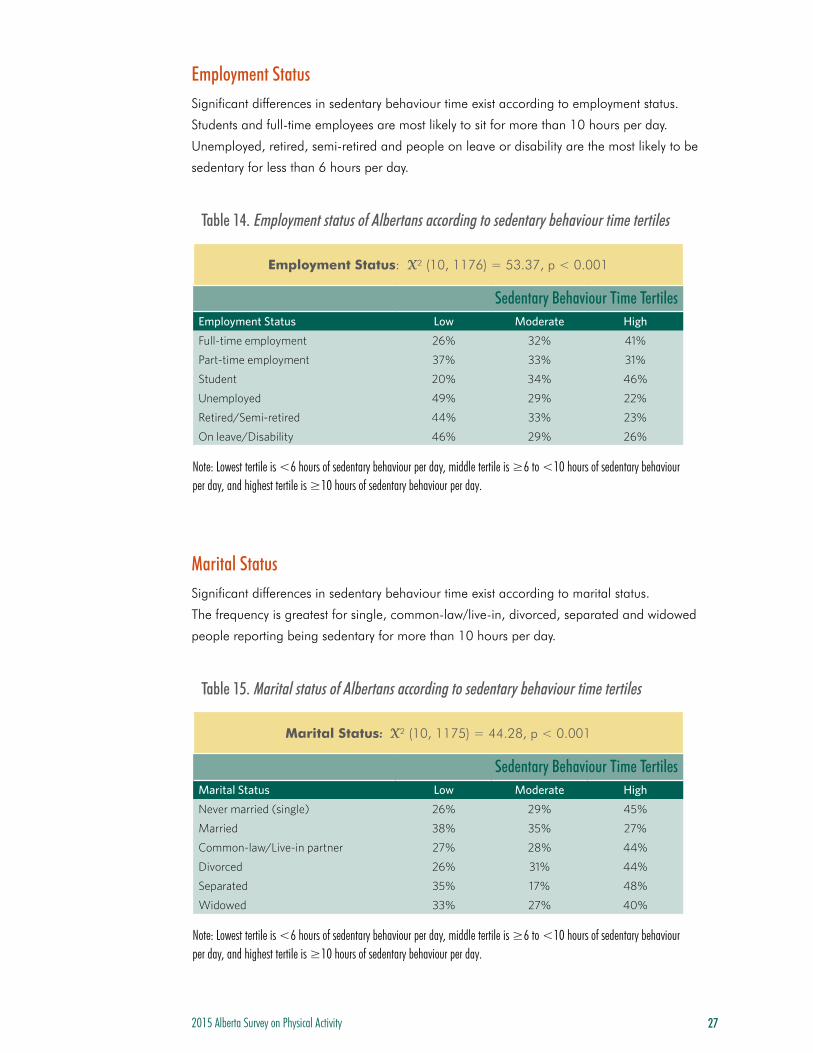
Employment StatusSignificant differences in sedentary behaviour time exist according to employment status.
Students and full-time employees are most likely to sit for more than 10 hours per day.
Unemployed, retired, semi-retired and people on leave or disability are the most likely to be
sedentary for less than 6 hours per day.
Marital StatusSignificant differences in sedentary behaviour time exist according to marital status.
The frequency is greatest for single, common-law/live-in, divorced, separated and widowed
people reporting being sedentary for more than 10 hours per day.
Table 14. Employment status of Albertans according to sedentary behaviour time tertiles
Employment Status: X² (10, 1176) = 53.37, p < 0.001
Sedentary Behaviour Time TertilesEmployment Status Low Moderate High
Full-time employment 26% 32% 41%
Part-time employment 37% 33% 31%
Student 20% 34% 46%
Unemployed 49% 29% 22%
Retired/Semi-retired 44% 33% 23%
On leave/Disability 46% 29% 26%
Note: Lowest tertile is <6 hours of sedentary behaviour per day, middle tertile is ≥6 to <10 hours of sedentary behaviour per day, and highest tertile is ≥10 hours of sedentary behaviour per day.
Table 15. Marital status of Albertans according to sedentary behaviour time tertiles
Marital Status: X² (10, 1175) = 44.28, p < 0.001
Sedentary Behaviour Time TertilesMarital Status Low Moderate High
Never married (single) 26% 29% 45%
Married 38% 35% 27%
Common-law/Live-in partner 27% 28% 44%
Divorced 26% 31% 44%
Separated 35% 17% 48%
Widowed 33% 27% 40%
Note: Lowest tertile is <6 hours of sedentary behaviour per day, middle tertile is ≥6 to <10 hours of sedentary behaviour per day, and highest tertile is ≥10 hours of sedentary behaviour per day.
2015 Alberta Survey on Physical Activity 28
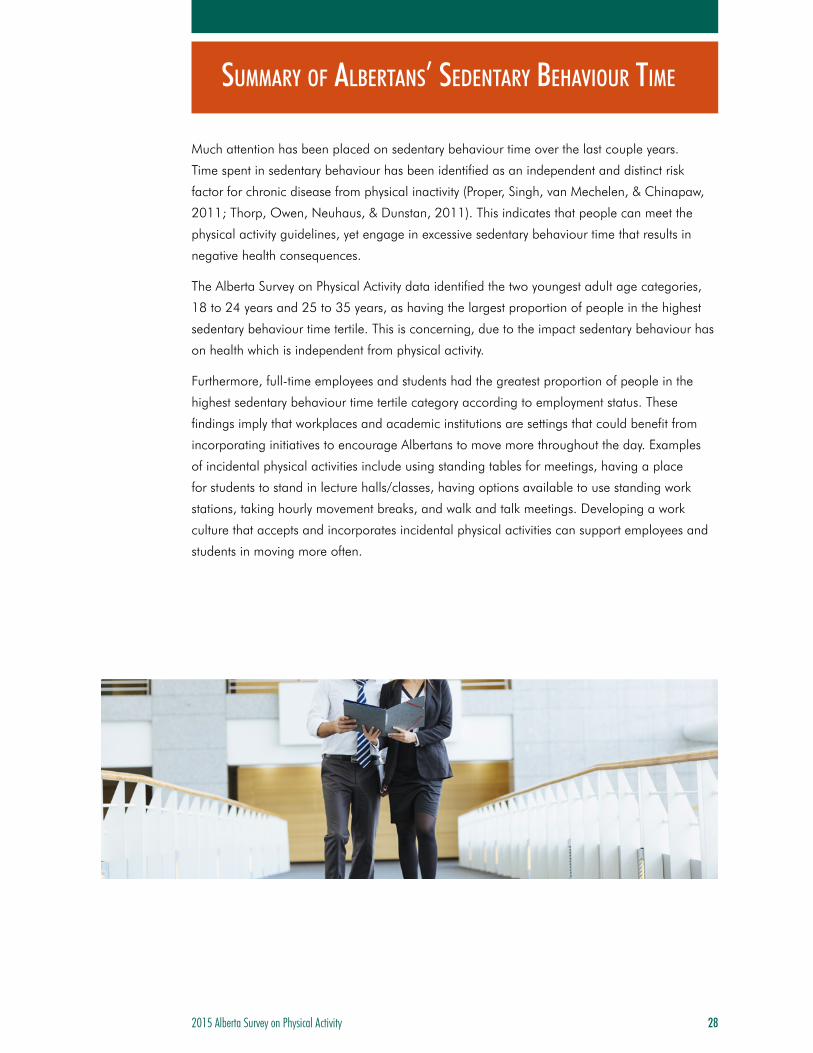
Much attention has been placed on sedentary behaviour time over the last couple years.
Time spent in sedentary behaviour has been identified as an independent and distinct risk
factor for chronic disease from physical inactivity (Proper, Singh, van Mechelen, & Chinapaw,
2011; Thorp, Owen, Neuhaus, & Dunstan, 2011). This indicates that people can meet the
physical activity guidelines, yet engage in excessive sedentary behaviour time that results in
negative health consequences.
The Alberta Survey on Physical Activity data identified the two youngest adult age categories,
18 to 24 years and 25 to 35 years, as having the largest proportion of people in the highest
sedentary behaviour time tertile. This is concerning, due to the impact sedentary behaviour has
on health which is independent from physical activity.
Furthermore, full-time employees and students had the greatest proportion of people in the
highest sedentary behaviour time tertile category according to employment status. These
findings imply that workplaces and academic institutions are settings that could benefit from
incorporating initiatives to encourage Albertans to move more throughout the day. Examples
of incidental physical activities include using standing tables for meetings, having a place
for students to stand in lecture halls/classes, having options available to use standing work
stations, taking hourly movement breaks, and walk and talk meetings. Developing a work
culture that accepts and incorporates incidental physical activities can support employees and
students in moving more often.
summary oF albertans’ sedentary behavIour tIme
2015 Alberta Survey on Physical Activity 29
The Canadian Physical Activity Guidelines recommend that adults accumulate a minimum of
150 minutes of moderate-to-vigorous physical activity per week, in bouts of 10 minutes or
more (CSEP, 2011). According to the self-report data in the Alberta Survey on Physical Activity,
60% of Albertans achieve enough physical activity. This number has remained constant over
the last decade.
For the first time, the 2015 Alberta Survey on Physical Activity has reported sedentary behaviour
time. The average time spent in sedentary behaviour during waking hours is almost 9 hours
per day on weekdays and 8.25 hours per day on weekend days. When the average time
respondents reported spending in sedentary time per day was calculated into thirds, the lowest
third of Albertans spent less than 6 hours per day in sedentary behaviour, the middle group
spent 6 to less than10 hours per day in sedentary behaviour, and the highest third spent 10
hours or more in sedentary behaviour.
Walking is the most common physical activity among Albertans (Alberta Government, 2013).
Increasing the amount of walking, Albertans engage in for leisure and transportation, can help
reduce sedentary behaviour and increase time spent in moderate-intensity physical activity.
Developing strategies, to incorporate more movement and less sitting in Albertans’ daily
lifestyle, is critical in addressing the public health concern of physical inactivity and sedentary
behaviour.
Focus on Sedentary Behaviour
What is Sedentary Behaviour? Sedentary behaviour includes any waking activity characterized by an energy expenditure of
1.5 METs or less while in a seated or reclined posture (Sedentary Behaviour Research Network,
2012).
Common sedentary behaviours include screen time activities, such as watching television,
working on a computer or playing on devices, and non-screen time activities, such as driving,
eating or reading.
Sedentary behaviour can be categorized according to:
• purpose (e.g., work, leisure, travel, domestic, education, social, eating, rest, etc.)
• location (e.g., home, workplace, school, community, etc.)
• social situation (e.g., alone, with family, friends, strangers, organized groups, etc.)
O V E R A L L
SUMMARY
2015 Alberta Survey on Physical Activity 30
• time of day (morning, afternoon, evening) or year (winter, spring, summer, fall)
• type of activity (e.g., reading, writing, phoning, driving, eating, music, spiritual, tv,
computer, video games, devices, etc.) (Chastin, Schwarz, & Skelton, 2013)
What are the Effects of Sedentary Behaviour?In observational studies, sedentary behaviour has been associated with:
• metabolic dysfunction including increased levels of plasma triglyceride, decreased level
of high density lipoproteins, decreased insulin sensitivity, type 2 diabetes mellitus and
metabolic syndrome (Hamburg et al., 2007; Thorp et al., 2011)
• risk of obesity (Thorp et al., 2011)
• decreases in bone mineral density (Tremblay et al., 2010)
• some cancers (colon among men; ovarian and endometrial among women) (Howard
et al, 2008; Gierach et al., 2009; Friberg, Mantzoros, & Wolk, 2006; Patel, Rodriguez,
Pavluck, Thun, & Calle, 2006; Schmid & Leitzmann, 2014)
• poor mental health (Rhodes, Mark, & Temmel, 2012)
• poor quality of life (Rhodes et al., 2012)
• lower life expectancy, mortality rates and premature death (Katzmarzyk & Lee, 2012;
Katzmarzyk, Church, Craig, & Bouchard, 2009; Thorp et al., 2011; Van der Ploeg, Chey,
Korda, Banks, & Bauman, 2012)
Incidences of disease, mortality and weight gain have been independently associated with
sedentary behaviour from physical activity (Hamilton, Healy, Dunstan, Zderic, & Owen, 2008;
Katzmarzyk et al., 2009; Thorp et al., 2011). Current research is examining the extent that
body mass index (BMI) and fitness level can alter the association between sedentary time and
incidence of disease.
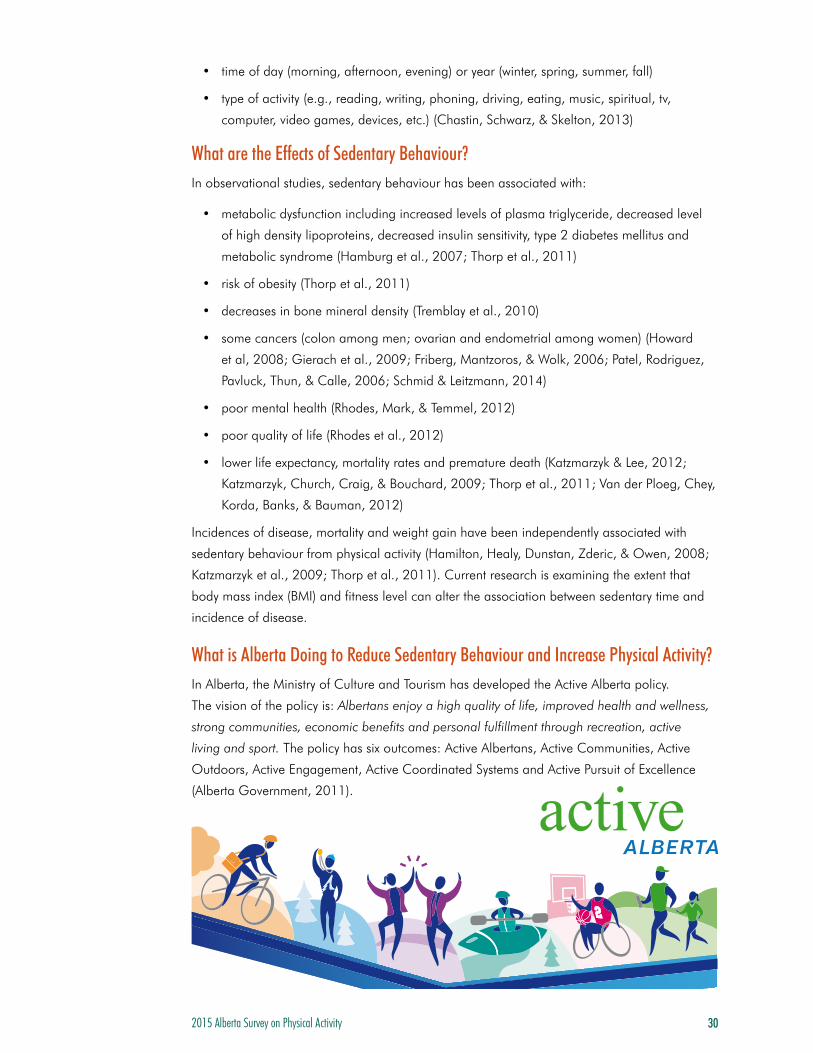
What is Alberta Doing to Reduce Sedentary Behaviour and Increase Physical Activity?In Alberta, the Ministry of Culture and Tourism has developed the Active Alberta policy.
The vision of the policy is: Albertans enjoy a high quality of life, improved health and wellness,
strong communities, economic benefits and personal fulfillment through recreation, active
living and sport. The policy has six outcomes: Active Albertans, Active Communities, Active
Outdoors, Active Engagement, Active Coordinated Systems and Active Pursuit of Excellence
(Alberta Government, 2011).

2015 Alberta Survey on Physical Activity 31
Albertans are more active, more often.
Priorities
• Improve opportunities for children and families to engage in high quality, unstructured and creative play.
• Increase the physical activity of Albertans of all ages and abilities across their lifespan.
• Increase awareness among all Albertans about how and where they can be active.
• Integrate the Canadian Sport for Life Model into the active living education, recreation and sport development systems.
• Develop innovative, accessible after school programs that link community recreation programs and services to schools and community facilities.
• Encourage school communities to adopt a comprehensive approach to promote healthy, active living.
What does this look like?
• More Albertans are physically active in a wide variety of ways and in many different settings.
• More Albertans experience improved physical and mental health through integrating physical activity into their daily lives.
• Increased participation in active living, recreation and sport leads to social benefits, healthy weights and improved resiliency.
Active Albertans - Outcome 1
All Albertans can work together to achieve the goals of Active Alberta and reduce sedentary
behaviour while increasing physical activity. For example, when more active opportunities are
provided in various settings, such as workplaces, schools and neighborhoods, a culture of
Active Living is supported.
Albertan communities are more active, creative, inclusive and safe.
Priorities
• Encourage collaborative planning for facilities and services.
• Identify and share approaches in communities that capitalize on ethnic diversity, urban and rural distinctiveness and mobilize industry to develop active communities.
• Encourage local governments to create opportunities and remove barriers to physical activity.
• Identify and implement best practices in land use and transportation planning to facilitate active transportation, e.g., walking or cycling.
• Explore opportunities for tourism development around sport event hosting.
What do active communities look like?
• Communities are designed and developed to support active living, recreation and sport.
• Communities benefit from the economic impacts of active living, recreation and sport, including job creation and visitor attraction.
• More Albertans are using active transportation in their daily lives.
• Alberta’s communities are known to be safe and inclusive.
Active Communities - Outcome 2
Retrieved from Alberta Government (2011). Note: Active Alberta has 6 outcomes. See http://tpr.alberta.ca/recreation/ for more details.
2015 Alberta Survey on Physical Activity 32
Personal habits, workplace cultures, community connectivity, city planning and local policies
can support an active lifestyle that enriches the health and quality of life of Albertans.
More specifically, incorporating more active forms of transportation, leisure-time activities and
workplace practices can support Albertans in engaging in a healthier lifestyle. Some examples
are listed below.
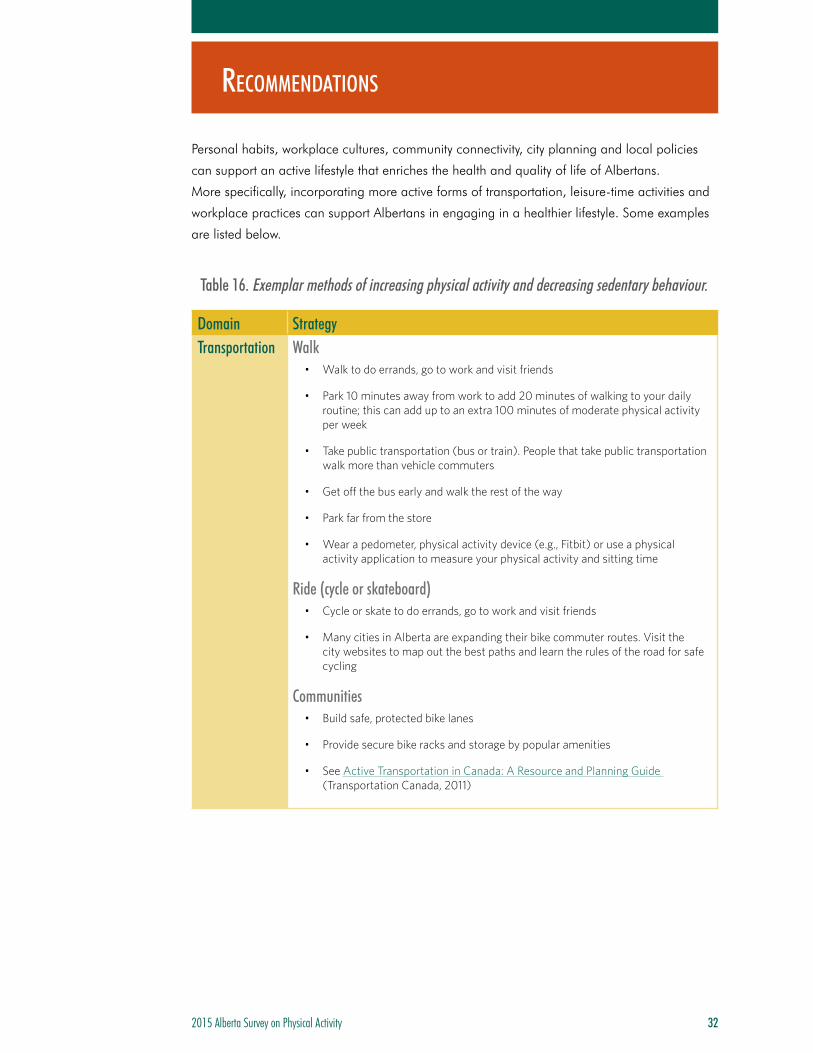
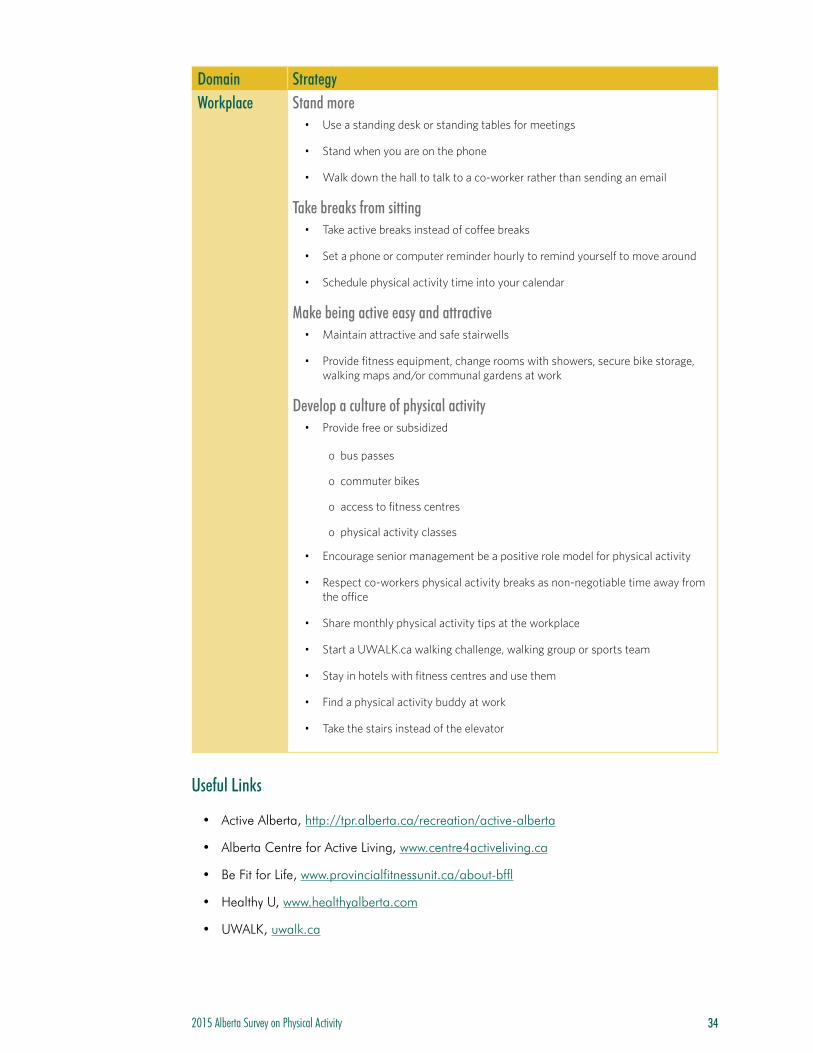
Table 16. Exemplar methods of increasing physical activity and decreasing sedentary behaviour.
Domain StrategyTransportation Walk
• Walk to do errands, go to work and visit friends
• Park 10 minutes away from work to add 20 minutes of walking to your daily routine; this can add up to an extra 100 minutes of moderate physical activity per week
• Take public transportation (bus or train). People that take public transportation walk more than vehicle commuters
• Get off the bus early and walk the rest of the way
• Park far from the store
• Wear a pedometer, physical activity device (e.g., Fitbit) or use a physical activity application to measure your physical activity and sitting time
Ride (cycle or skateboard)• Cycle or skate to do errands, go to work and visit friends
• Many cities in Alberta are expanding their bike commuter routes. Visit the city websites to map out the best paths and learn the rules of the road for safe cycling
Communities• Build safe, protected bike lanes
• Provide secure bike racks and storage by popular amenities
• See Active Transportation in Canada: A Resource and Planning Guide (Transportation Canada, 2011)
recommendatIons

2015 Alberta Survey on Physical Activity 33
Domain StrategyLeisure time Family and Friends
• Do activities your family enjoys or try new activities
• Walk with friends after dinner
• Stand up while you talk with family or on the phone
Outdoors• Go to parks, trails, recreation facilities and school yards to be active
• Go to a flea market, art gallery or farmers market
• Plant and maintain a garden
Dog walking• Make a habit of walking the dog 2 to 3 times a day
• Be a volunteer dog walker at the local SPCA or animal shelter
Community• Start a walking group or club
• Join a sports team or physical activity group
• Walk at the mall
• Don’t use the drive-through window; get out of the vehicle
2015 Alberta Survey on Physical Activity 34
Domain StrategyWorkplace Stand more
• Use a standing desk or standing tables for meetings
• Stand when you are on the phone
• Walk down the hall to talk to a co-worker rather than sending an email
Take breaks from sitting• Take active breaks instead of coffee breaks
• Set a phone or computer reminder hourly to remind yourself to move around
• Schedule physical activity time into your calendar
Make being active easy and attractive• Maintain attractive and safe stairwells
• Provide fitness equipment, change rooms with showers, secure bike storage, walking maps and/or communal gardens at work
Develop a culture of physical activity• Provide free or subsidized
o bus passes
o commuter bikes
o access to fitness centres
o physical activity classes
• Encourage senior management be a positive role model for physical activity
• Respect co-workers physical activity breaks as non-negotiable time away from the office
• Share monthly physical activity tips at the workplace
• Start a UWALK.ca walking challenge, walking group or sports team
• Stay in hotels with fitness centres and use them
• Find a physical activity buddy at work
• Take the stairs instead of the elevator
Useful Links
• Active Alberta, http://tpr.alberta.ca/recreation/active-alberta
• Alberta Centre for Active Living, www.centre4activeliving.ca
• Be Fit for Life, www.provincialfitnessunit.ca/about-bffl
• Healthy U, www.healthyalberta.com
• UWALK, uwalk.ca

2015 Alberta Survey on Physical Activity 35
Abraham, C., Conner, M., Jones, F., & O’Connor, D. (2008). Health cognition and health behaviours. Health Psychology, p.135-156.
Alberta Government. (2011). Active Alberta 2011 to 2021. Retrieved from http://tpr.alberta.ca/recreation/active-alberta/pdf/Active-Alberta-Policy.pdf
Alberta Government. (2013). 2013 Alberta Recreation Survey Report. Retrieved from the Alberta Government from http://tpr.alberta.ca/recreation/resources/research-analytics/recrea-tion-survey/recreation-survey-results/pdf/AB-Rec-2013-ReportFinal.pdf
Bauman, A., Allman-Farinelli, M., Huxley, R., & James, W. P. T. (2008). Leisure-time physical activity alone may not be a sufficient public health approach to prevent obesity – A focus on China. Obesity Reviews, 9 (suppl 1), 119-126. doi: 10.1111/j.1467-789X.2007.00452.x
Bauman, A. E., Reis, R. S., Sallis, J. F., Wells, J. C., Loos, R. J. F., & Martin, B. W. (2012). Correlates of physical activity: Why are some people physically active and others not? The Lancet, 380, 31-44. doi: 10.1016/S0140-6736(12)60735-1
Bengoechea, E. G., Spence, J. C., & McGannon, K. (2005). Gender differences in perceived environmental correlates of physical activity. International Journal of Behavioral Nutrition and Physical Activity, 2, 12. doi:10.1186/1479-5868-2-12
Besser, L. M., & Dannenburg, A. L. (2005). Walking to public transit: Steps to help meet physical activity recommendations. American Journal of Preventive Medicine, 29, 273-280. doi:10.1016/j.amepre.2005.06.010
Canadian Society for Exercise Physiology. (2011). Canadian Physical Activity Guidelines for Adults 18 to 64 Years. Retrieved from http://www.csep.ca/CMFiles/Guidelines/CSEP_PAGuide-lines_adults_en.pdf
Chastin, S. F. M., Schwarz, U., & Skelton, D. A. (2013). Development of a Consensus Taxonomy of Sedentary Behaviors (SIT): Report of Delphi Round 1. PLoS ONE, 9, doi: 10.1371/annotation/40e70c58-2067-4211-a152-22c3ab5534f5. doi: 10.1371/journal.pone.0082313
Christian, H., Westgarth, C. H., Bauman, A., Richards, E. A., Rhodes, R., Evenson, K., Mayer, J. A. Thorpe, & R. J. (2013). Dog ownership and physical activity: A review of the evidence. Journal of Physical Activity and Health, 10, 750-759.
CSEP see: Canadian Society for Exercise Physiology
Elosúa, R., García, M., Aguilar, A., Molina, L., Covas, M., & Marrugat, J. (2000). Validation of the Minnesota leisure time physical activity questionnaire in Spanish women. Medicine and Science in Sports and Exercise, 32, 1431-1437. doi:10.1097/00005768-200008000-00011
Friberg, E., Mantzoros, C. S., & Wolk, A. (2006). Physical activity and risk of endometrial can-cer: a population-based prospective cohort study. Cancer Epidemiology, Biomarkers & Preven-tion. 15, 2136-2140. doi:10.1158/1055-9965.EPI-06-0465
REFERENCES

2015 Alberta Survey on Physical Activity 36
Gierach, G. L., Chang, S. C., Brinton, L. A., Lacey, J. V., Hollenbeck, A. R., Schatzkin, A., & Leitzmann, M. F. (2009). Physical activity, sedentary behavior, and endometrial cancer risk in the NIH–AARP Diet and Health Study. International Journal of Cancer, 124, 2139–2147. doi:10.1002/ijc.24059. PMID:19123463
Godin, G. & Shephard, R. J. (1997). Godin Leisure-Time Exercise Questionnaire. Medicine and Science in Sports and Exercise, 29, S36-S38.
Hamburg, N. M., McMackin, C. J., Huang, A. L., Shenouda, S. M., Widlansky, M. E., Schulz, E., Gokce, N., Ruderman, N. B., Keaney, J. F., Vita, J. A. (2007). Physical inactivity rapidly induces insulin resistance and microvascular dysfunction in healthy volunteers. Artherioscerosis, Thrombosis, and Vascular Biology, 27, 2650-2656. doi:10.1161/ATVBAHA.107.153288
Hamilton, M. T., Healy, G. N., Dunstan, D. W., Zderic, T. W., & Owen, N. (2008). Too little exercise and too much sitting: Inactivity physiology and the need for new recommendations on sedentary behavior. Current Cardiovascular Risk Reports, 2, 292-298. doi:10.1007/s12170-008-0054-8
Howard, R. A., Freedman, D. M., Park, Y., Hollenbeck, A., Schatzkin, A., & Leitzmann, M. F. (2008). Physical activity, sedentary behavior, and the risk of colon and rectal cancer in the NIH-AARP Diet and Health Study. Cancer Causes and Control, 19, 939-953. doi:10.1007/s10552-008-9159-0
Humpel, N., Owen, N., & Leslie, E. (2002). Environmental factors associated with adults’ participation in physical activity: A review. American Journal of Preventive Medicine, 22, 188-199. doi:10.1016/S0749-3797(01)00426-3
International Physical Activity Questionnaire. (2005). Guidelines for Data Processing and Analysis of the International Physical Activity Questionnaire (IPAQ): Short and Long Forms. Retrieved from http://www.ipaq.ki.se/scoring.pdf
IPAQ see: International Physical Activity Questionnaire
Jacobs, D. R., Ainsworth, B. E., Hartman, T. J., & Leon, A. S. (1993). A simultaneous evalua-tion of 10 commonly used physical activity questionnaires. Medicine and Science in Sports and Exercise, 25, 81-91. doi:10.1249/00005768-199301000-00012
Katzmarzyk, P. T., Church, T. S., Craig, C. L., & Bouchard, C. (2009). Sitting time and mortality from all causes, cardiovascular disease, and cancer. Medicine and Science in Sports Exercise, 41, 998–1005. doi:10.1249/MSS.0b013e3181930355
Katzmarzyk, P. T., & Lee, I. M. (2012). Sedentary behaviour and life expectancy in the USA: a cause–deleted life table analysis. BMJ Open, e000828. doi:10.1136/bmjopen-2012-000828
Loitz, C. C., Fraser, S. N., Garcia Bengoechea, E., Berry, T. R., McGannon, K. R., & Spence, J. C. (2012). Sociodemographic patterns of leisure-time physical activity of Albertans 2000 to 2011. The Health and Fitness Journal of Canada, 5, 3-15.
Owen, N., Healy G. N., Matthews, C. E., & Dunstan, D. W. (2010). Too much sitting: the population-health science of sedentary behavior. Exercise Sport Science Review, 38, 105–113. doi: 10.1097/JES.0b013e3181e373a2
Paffenbarger, R. S., Wing, A. L., & Hyde, R. T. (1978). Physical activity as an index of heart attack risk in college alumni. American Journal of Epidemiology, 108, 161-175.
Patel, A. V., Rodriguez, C., Pavluck, A. L., Thun, M. J., & Calle, E. E. (2006). Recreational physical activity and sedentary behavior in relation to ovarian cancer risk in a large cohort of U.S. women. American Journal of Epidemiology, 163, 709-716, doi:10.1093/aje/kwj098
2015 Alberta Survey on Physical Activity 37
Proper, K. I., Singh, A. S., van Mechelen, W., & Chinapaw, M. J. (2011). Sedentary behaviors and health outcomes among adults: a systematic review of prospective studies. American Journal of Preventative Medicine, 40, 174-182. doi:10.1016/j.amepre.2010.10.015
Rhodes, R. E., Mark, R. S., & Temmel, C. P. (2012). Adult sedentary behavior: A system-atic review. American Journal of Preventive Medicine, 42, e3– e28. doi:10.1016/j.ame-pre.2011.10.020
Rosenberg, D. E., Norman, G. J., Wagner, N., Patrick, K., Calfas, K. J. & Sallis, J. F. (2010). Journal of Physical Activity and Health, 7, 697-705
Saelens, B. & Handy, S. (2008). Built environment correlates of walking: A review. Medicine Science and Sport Exercise, 40, S550-S566.
Schmid, D. & Leitzmann, M. F. (2014). Association between physical activity and mortality among breast cancer and colorectal cancer survivors: A systematic review and meta-analysis. Annals of Oncology, 25, 1293-311. doi:10.1093/annonc/mdu012
Sedentary Behaviour Research Network. (2012). Standardized use of the terms “sedentary”and “sedentary behaviours”. Applied Physiology Nutrition and Metabolism, 37, 540–542. doi: 10.1139/h2012-024
Statistics Canada. (2012). Table 051-0056 - Estimates of population by census metropolitan area, sex and age group for July 1, based on the Standard Geographical Classification (SGC) 2011, annual (persons), CANSIM (database). Retrieved from: http://www5.statcan.gc.ca/cansim/a26?lang=eng&retrLang=eng&id=0510056&paSer=&pattern=&stByVal=1&p1=1&p2=-1&tabMode=dataTable&csid= (accessed: 2014-09-17)
Thorp, A. A., Owen, N., Neuhaus, M., & Dunstan, D. W. (2011). Sedentary behaviors and sub-sequent health outcomes in adults a systematic review of longitudinal studies, 1996-2011. American Journal of Preventative Medicine, 41, 207-215. doi:10.1016/j.ame-pre.2011.05.004
Transportation Canada. (2011). Active transportation in Canada: A resource and planning guide. Retrieved from http://www.tc.gc.ca/media/documents/programs/atge.pdf
Tremblay, M. S., Colley, R. C., Saunders, T. J., Healy, G. N., & Owen, N. (2010). Physiological and health implications of a sedentary lifestyle. Applied Physiology, Nutrition and Metabolism, 35, 725-740. doi:10.1139/H10-079
Tremblay, M. S., Shephard, R. J., & Brawley, L. R. (2007). Research that informs Canada’s physical activity guides: An introduction. Applied Physiology, Nutrition, and Metabolism, 32, S1-S8. doi:10.1139/H07-104
Van der Ploeg, H. P., Chey, T., Korda, R. J., Banks, E., & Bauman, A. (2012). Sitting time and all-cause mortality risk in 222 497 Australian adults. Archives of Internal Medicine, 172: pp. 494-500. doi: 10.1001/archinternmed.2011.2174
Warburton, D. E. R., Nicol, C. W., & Bredin, S. S. D. (2006). Health benefits of physical activity: the evidence. Can Med Assoc J, 174:801-809.
2015 Alberta Survey on Physical Activity 38
APPENDIX
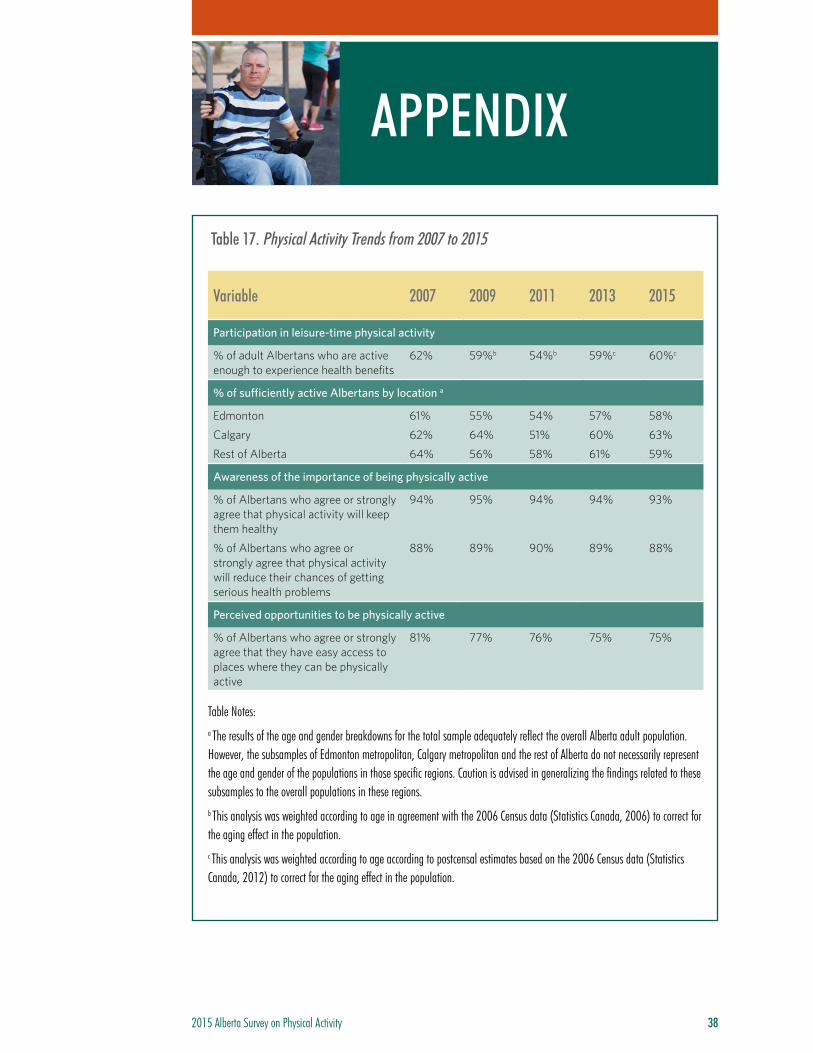
Table 17. Physical Activity Trends from 2007 to 2015
Variable 2007 2009 2011 2013 2015
Participation in leisure-time physical activity
% of adult Albertans who are active enough to experience health benefits
62% 59%b 54%b 59%c 60%c
% of sufficiently active Albertans by location a
Edmonton 61% 55% 54% 57% 58%
Calgary 62% 64% 51% 60% 63%
Rest of Alberta 64% 56% 58% 61% 59%
Awareness of the importance of being physically active
% of Albertans who agree or strongly agree that physical activity will keep them healthy
94% 95% 94% 94% 93%
% of Albertans who agree or strongly agree that physical activity will reduce their chances of getting serious health problems
88% 89% 90% 89% 88%
Perceived opportunities to be physically active
% of Albertans who agree or strongly agree that they have easy access to places where they can be physically active
81% 77% 76% 75% 75%
Table Notes:a The results of the age and gender breakdowns for the total sample adequately reflect the overall Alberta adult population. However, the subsamples of Edmonton metropolitan, Calgary metropolitan and the rest of Alberta do not necessarily represent the age and gender of the populations in those specific regions. Caution is advised in generalizing the findings related to these subsamples to the overall populations in these regions. b This analysis was weighted according to age in agreement with the 2006 Census data (Statistics Canada, 2006) to correct for the aging effect in the population. c This analysis was weighted according to age according to postcensal estimates based on the 2006 Census data (Statistics Canada, 2012) to correct for the aging effect in the population.
2015 Alberta Survey on Physical Activity 39
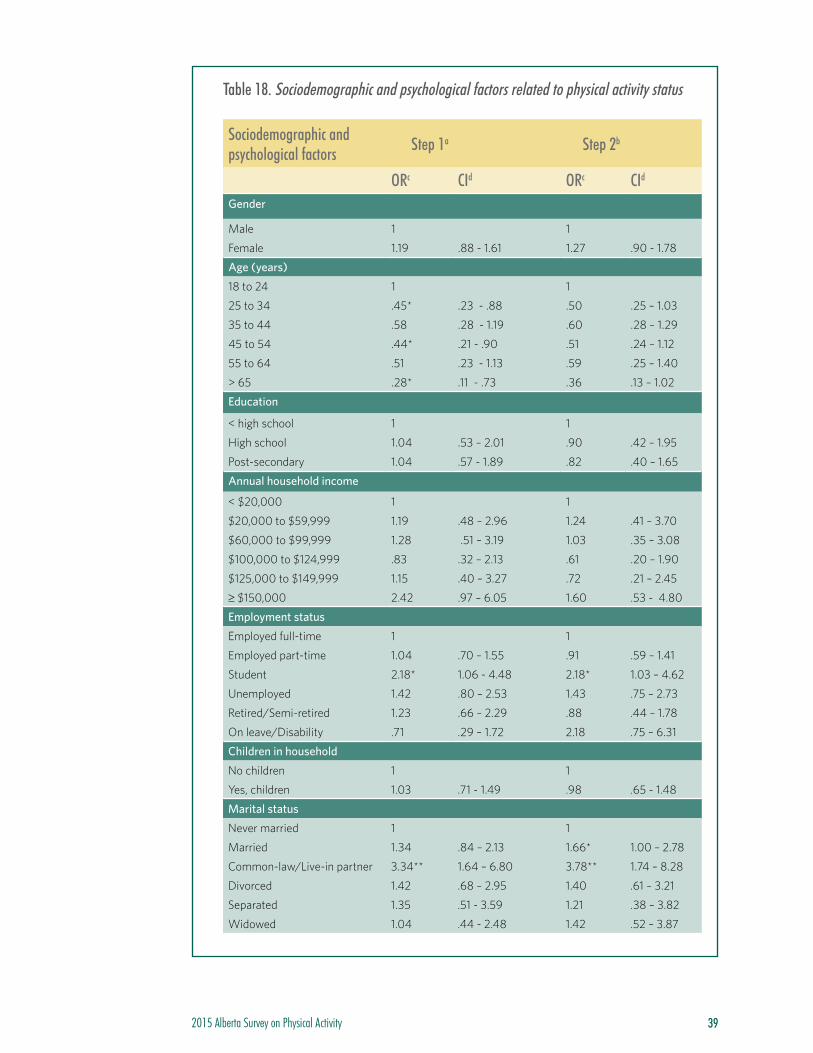
Table 18. Sociodemographic and psychological factors related to physical activity status
Sociodemographic and psychological factors Step 1a Step 2b
ORc CId ORc CId
Gender
Male 1 1
Female 1.19 .88 - 1.61 1.27 .90 - 1.78
Age (years)
18 to 24 1 1
25 to 34 .45* .23 - .88 .50 .25 – 1.03
35 to 44 .58 .28 - 1.19 .60 .28 – 1.29
45 to 54 .44* .21 - .90 .51 .24 – 1.12
55 to 64 .51 .23 - 1.13 .59 .25 – 1.40
> 65 .28* .11 - .73 .36 .13 – 1.02
Education
< high school 1 1
High school 1.04 .53 – 2.01 .90 .42 – 1.95
Post-secondary 1.04 .57 - 1.89 .82 .40 – 1.65
Annual household income
< $20,000 1 1
$20,000 to $59,999 1.19 .48 – 2.96 1.24 .41 – 3.70
$60,000 to $99,999 1.28 .51 – 3.19 1.03 .35 – 3.08
$100,000 to $124,999 .83 .32 – 2.13 .61 .20 – 1.90
$125,000 to $149,999 1.15 .40 – 3.27 .72 .21 – 2.45
≥ $150,000 2.42 .97 – 6.05 1.60 .53 - 4.80
Employment status
Employed full-time 1 1
Employed part-time 1.04 .70 – 1.55 .91 .59 – 1.41
Student 2.18* 1.06 - 4.48 2.18* 1.03 – 4.62
Unemployed 1.42 .80 – 2.53 1.43 .75 – 2.73
Retired/Semi-retired 1.23 .66 – 2.29 .88 .44 – 1.78
On leave/Disability .71 .29 – 1.72 2.18 .75 – 6.31
Children in household
No children 1 1
Yes, children 1.03 .71 - 1.49 .98 .65 - 1.48
Marital status
Never married 1 1
Married 1.34 .84 – 2.13 1.66* 1.00 – 2.78
Common-law/Live-in partner 3.34** 1.64 – 6.80 3.78** 1.74 – 8.28
Divorced 1.42 .68 – 2.95 1.40 .61 – 3.21
Separated 1.35 .51 - 3.59 1.21 .38 – 3.82
Widowed 1.04 .44 - 2.48 1.42 .52 – 3.87

2015 Alberta Survey on Physical Activity 40
Psychological Variables Step 1a Step 2b
ORc CId ORc CId
General self-efficacy
None 1
Moderate .79 .28 – 2.22
High 1.81 .61 – 5.36
Coping self-efficacy
None 1
Moderate 2.41* 1.29 – 4.49
High 3.88** 1.89 – 7.95
Scheduling self-efficacy
None 1
Moderate .85 .37 – 1.93
High 1.35 .56 – 3.29
Intention to participate in regular physical activity
Low 1
Moderate 2.66* 1.40 - 5.07
High 2.47* 1.38 – 4.40
Outcome expectancy (health)
Low 1
Moderate .18* .04 – .88
High .28 .07 – 1.07
Perceived behavioural control
Low 1
Moderate 1.44 .78 – 2.66
High 1.53 .87 – 2.68
Table Notes:a Step 1 refers to the variables entered first in the regression (in this case, sociodemographic variables).b Step 2 refers to the variables subsequently entered in the regression (in this case, sociodemographic and psychological variables). The contribution of psychological variables in predicting activity status was determined after controlling for sociodemographic variables. c OR stands for “odd ratio.” OR is an indicator of the change in odds resulting from a unit change in the predictor (e.g., the change in the odds of being sufficiently active resulting from a unit change in general self-efficacy). If the value is greater than 1, it indicates that as the predictor increases, the odds of the outcome occurring increase. The opposite is also true. The first group in each variable category (the one assigned a value of 1) is a reference group to which the other values are compared. d CI stands for “confidence interval.” CI is an estimate of the values between which the OR would fall in the actual population rather than the survey sample (i.e., 95 out of 100 occasions).
* p < .05 ** p < .001 compared to reference group
2015 Alberta Survey on Physical Activity 41
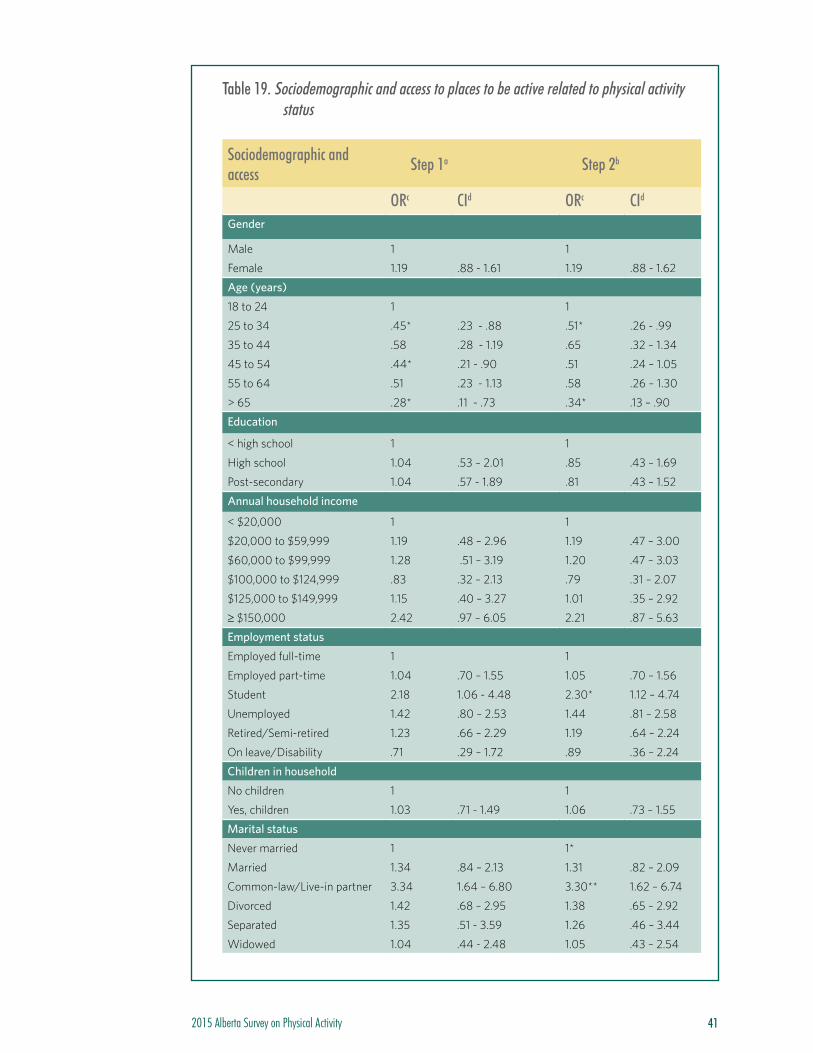
Table 19. Sociodemographic and access to places to be active related to physical activity status
Sociodemographic and access Step 1a Step 2b
ORc CId ORc CId
Gender
Male 1 1
Female 1.19 .88 - 1.61 1.19 .88 - 1.62
Age (years)
18 to 24 1 1
25 to 34 .45* .23 - .88 .51* .26 - .99
35 to 44 .58 .28 - 1.19 .65 .32 – 1.34
45 to 54 .44* .21 - .90 .51 .24 – 1.05
55 to 64 .51 .23 - 1.13 .58 .26 – 1.30
> 65 .28* .11 - .73 .34* .13 – .90
Education
< high school 1 1
High school 1.04 .53 – 2.01 .85 .43 – 1.69
Post-secondary 1.04 .57 - 1.89 .81 .43 – 1.52
Annual household income
< $20,000 1 1
$20,000 to $59,999 1.19 .48 – 2.96 1.19 .47 – 3.00
$60,000 to $99,999 1.28 .51 – 3.19 1.20 .47 – 3.03
$100,000 to $124,999 .83 .32 – 2.13 .79 .31 – 2.07
$125,000 to $149,999 1.15 .40 – 3.27 1.01 .35 – 2.92
≥ $150,000 2.42 .97 – 6.05 2.21 .87 – 5.63
Employment status
Employed full-time 1 1
Employed part-time 1.04 .70 – 1.55 1.05 .70 – 1.56
Student 2.18 1.06 - 4.48 2.30* 1.12 – 4.74
Unemployed 1.42 .80 – 2.53 1.44 .81 – 2.58
Retired/Semi-retired 1.23 .66 – 2.29 1.19 .64 – 2.24
On leave/Disability .71 .29 – 1.72 .89 .36 – 2.24
Children in household
No children 1 1
Yes, children 1.03 .71 - 1.49 1.06 .73 – 1.55
Marital status
Never married 1 1*
Married 1.34 .84 – 2.13 1.31 .82 – 2.09
Common-law/Live-in partner 3.34 1.64 – 6.80 3.30** 1.62 – 6.74
Divorced 1.42 .68 – 2.95 1.38 .65 – 2.92
Separated 1.35 .51 - 3.59 1.26 .46 – 3.44
Widowed 1.04 .44 - 2.48 1.05 .43 – 2.54
2015 Alberta Survey on Physical Activity 42
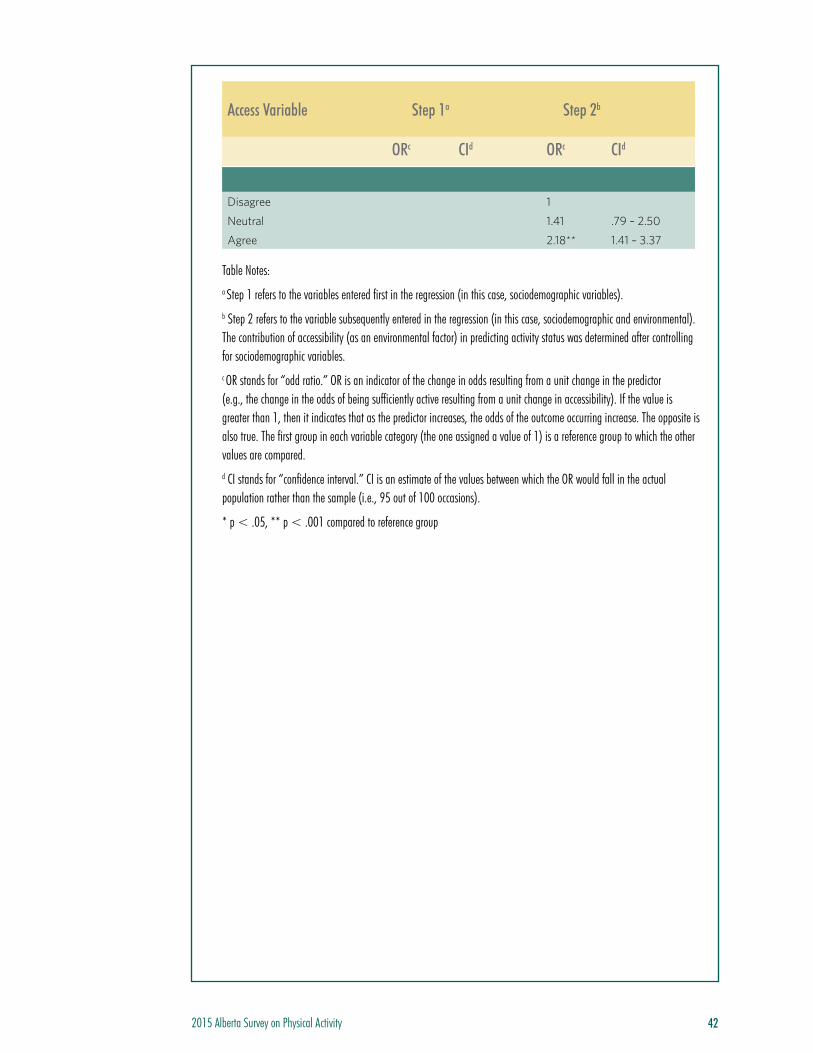
Access Variable Step 1a Step 2b
ORc CId ORc CId
Disagree 1
Neutral 1.41 .79 – 2.50
Agree 2.18** 1.41 – 3.37
Table Notes:a Step 1 refers to the variables entered first in the regression (in this case, sociodemographic variables). b Step 2 refers to the variable subsequently entered in the regression (in this case, sociodemographic and environmental). The contribution of accessibility (as an environmental factor) in predicting activity status was determined after controlling for sociodemographic variables. c OR stands for “odd ratio.” OR is an indicator of the change in odds resulting from a unit change in the predictor (e.g., the change in the odds of being sufficiently active resulting from a unit change in accessibility). If the value is greater than 1, then it indicates that as the predictor increases, the odds of the outcome occurring increase. The opposite is also true. The first group in each variable category (the one assigned a value of 1) is a reference group to which the other values are compared. d CI stands for “confidence interval.” CI is an estimate of the values between which the OR would fall in the actual population rather than the sample (i.e., 95 out of 100 occasions).
* p < .05, ** p < .001 compared to reference group
2015 Alberta Survey on Physical Activity 43
3rd Floor, 11759 Groat Road Edmonton, Alberta, Canada T5M 3K6, Ph: 780.427.6949 E-mail: [email protected] Website: www.centre4activeliving.ca Facebook: /centre4activeliving Twitter: @4ActiveLiving YouTube: Centre4ActiveLiving1
© 2015 Alberta Centre for Active Living
All rights reserved. No part of this document may be reproduced, transmitted in any form or by any means, electronic, mechanical, photocopying, recording, or otherwise stored in a retrieval system, without written permission from the Alberta Centre for Active Living.