Embed Size (px)
Citation preview
Alberta Automobile Insurance Rate Board Review of Profit Level for Automobile Insurance A Submission by Facility Association November 8, 2006
1 October 20, 2006
EXECUTIVE SUMMARY 1 2 3 4 5 6 7 8 9
10 11 12 13 14 15 16 17
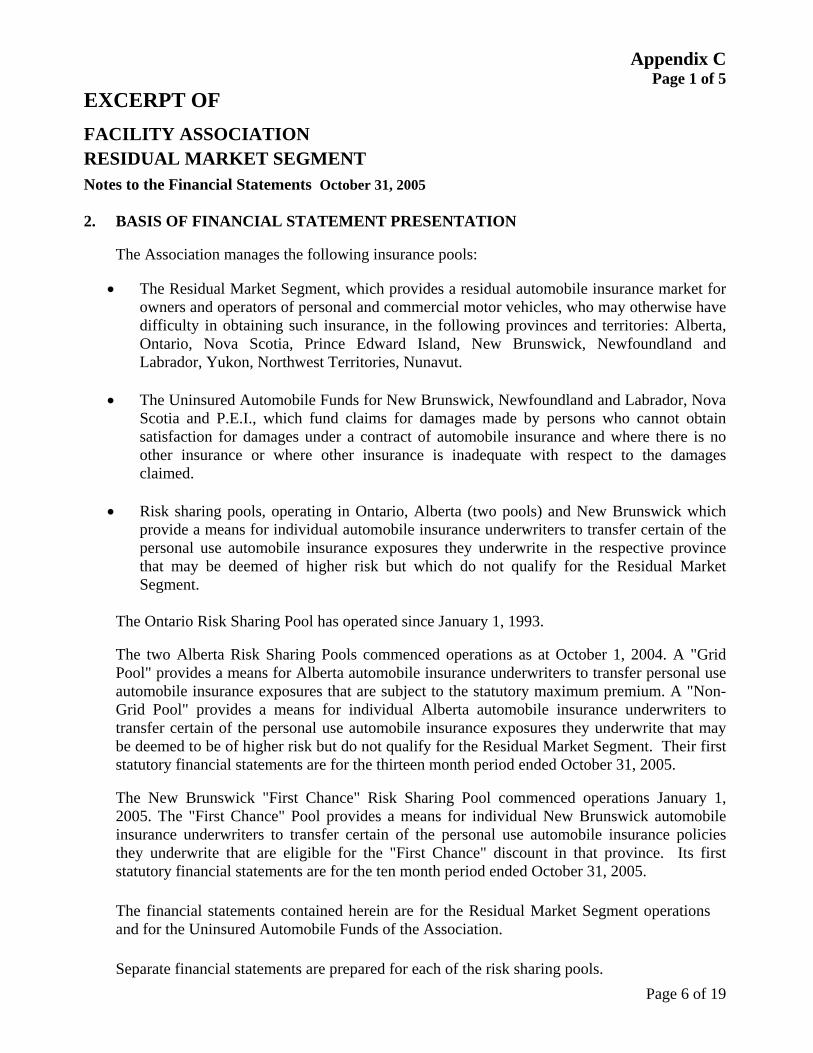
Facility Association operates two types of residual market mechanisms in Alberta: Risk Sharing Pools and the “traditional” type, referred to simply as the Residual Market. Due to their size and characteristics, the Risk Sharing Pools expose companies to an additional element of financial risk that is largely beyond their control. To the extent that risk is correlated with potential return, insurers ought to be able to pursue a higher level of return to compensate for a higher level of risk. Residual Market risks have historically been priced without a cost of capital provision included in the rates for those risks. Future Residual Market rate filings will include a cost of capital provision. Solvency regulators require member insurers to maintain capital to support their share of Residual Market premiums as if those premiums were their own (i.e., they are treated as Direct Written Premium of the member). That capital carries with it a real cost that must be paid. If a cost of capital provision is not included in Residual Market rates, then the industry profit provision for voluntary risks must include a component to cover that cost in voluntary rates. BACKGROUND 18
19 20 21 22 23 24 25 26 27 28 29 30 31 32 33 34 35
Facility Association is an administrative mechanism that administers involuntary residual market automobile insurance on behalf of the voluntary/private sector automobile insurance industry across Canada. Created by the industry and empowered by statute, Facility Association’s mission is to guarantee the availability of automobile insurance coverage for consumers who require it to legally operate their vehicles. Facility Association has a full-time staff of twenty people and a network of outsourcing arrangements. In Alberta, Facility Association administers the Alberta Risk Sharing Pool (in reality, two Pools – one for Grid and the other for Non-Grid risks) for private passenger vehicles. It also administers the traditional Residual Market for non-private passenger vehicles and a very small “Residual Market Segment” (with very tightly defined risk criteria) for private passenger vehicles. Because all licensed automobile insurers must participate in the residual markets administered by Facility Association according to specified sharing formulas, their
Facility Association Submission AIRB 2006 Industry Profit Hearing 2 October 20, 2006
36 37 38 39 40 41 42 43
financial results are subject to greater volatility and uncertainty than would otherwise be the case. As well, because Residual Market rates are set without a cost of capital provision, the necessity of assigning capital to support the Residual Market premiums can be expected to act as a “drag” on member capital that could be employed pursuing voluntary business. Participation in the Residual Market also imposes additional costs on Facility Association member companies for such expenses as premiums taxes, health levies, and compliance. THE RESIDUAL MARKETS - AUTHORIZATION 44
45 46 47
In Alberta, Facility Association administers the Risk Sharing Pools and Residual Market as authorized by its Plan of Operation, which is approved by the provincial Superintendent of Insurance. (The Plan may be viewed and downloaded at www.facilityassociation.com.) All companies licensed to sell automobile insurance in Alberta are required to abide by the provisions of the Plan.
48 49 50 51 52 53 54 55 56 57 58 59
For risks ceded to the Alberta Risk Sharing Pool(s), the Plan requires Facility Association to maintain and report separate financial results for those risks that are subject to the premium grid and those that are not. This creates the need for two Risk Sharing Pools, commonly referred to as the Grid Risk Sharing Pool and the Non-Grid Risk Sharing Pool. Both are for private passenger automobiles only. All financial results of the Alberta Risk Sharing Pools and the traditional Residual Market stay in Alberta. That is, they are not spread across the other jurisdictions Facility Association serves. THE RISK SHARING POOLS - OPERATION 60
61 62 63 64 65 66 67 68 69 70
Essentially, a Risk Sharing Pool is a residual market that acts as an industry-wide reinsurance mechanism that is largely invisible to consumers and intermediaries. A consumer buys insurance in the normal way, and the application is forwarded to a company underwriter. The underwriter assesses the risk, decides whether to keep it on the company’s own books or to transfer the risk to the Risk Sharing Pool, subject to the operational rules and eligibility guidelines of the Pool. For both Alberta Risk Sharing Pools, companies receive an expense allowance to cover costs such as those incurred for acquisition, policy issuance, policy administration and
Facility Association Submission AIRB 2006 Industry Profit Hearing 3 October 20, 2006
71 72 73 74 75 76 77 78 79 80 81 82 83 84 85 86 87 88 89 90 91 92 93 94 95 96 97 98 99
100 101 102 103 104
claims servicing. That expense allowance is set annually by the Facility Association Board of Directors in consultation with the Superintendent. For both Pools, companies are required to submit 100% of all premiums for all coverages on a policy and are eligible for 100% reimbursement of eligible claims and related expenses. Financial results of the Pools are shared among companies based on the proportion of a company’s private passenger automobile exposures not ceded to a Risk Sharing Pool divided by the number of industry private passenger automobile exposures not ceded to a Risk Sharing Pool. As Facility Association is simply an administrative mechanism, all companies receive a monthly report reflecting the operations of the Pool, providing them with the amounts they are then required to book into their own financial statements. The two Pools differ primarily in the number of risks companies can transfer to each. For the Grid Risk Sharing Pool, companies can transfer risks without limit. This lack of limit is based on the philosophy that companies are required to accept risks for which they have no control over price and, therefore, little or no control over the financial results of that business. For the Non-Grid Pool, companies can transfer up to 4% of written exposures not transferred to the Grid Pool. This Pool is designed to help companies cope with the “take-all-comers” environment in the province. In a competitive market, most insurers tend not to target the entire universe of private passenger automobile risks. Insurers generally each have their areas of expertise and a healthy competitive marketplace tends to allow a proper mix of generalist and specialist/niche private passenger automobile writers. Moreover, because it is a practical impossibility to have a perfect price for every risk, most insurers choose to have risk eligibility rules to complement and protect their respective pricing structures. An underwriter faced with a requirement to accept a greater degree of risk than that contemplated by the company’s classification system and rates can transfer that risk to the Non-Grid Pool. The Non-Grid Pool has a relatively low limit to ensure that it does not become used as a marketing tool. That is, without such a limit, companies could deliberately adopt a strategy of under-pricing certain risks to attract new customers. Because these risks could then be transferred to the Non-Grid Pool, and because of the way all insurers share in the results of the Pool, this would amount to companies growing their businesses at the expense of their competitors.
Facility Association Submission AIRB 2006 Industry Profit Hearing 4 October 20, 2006
105 106 107 108 109 110 111 112
The key point here is that Risk Sharing Pools are designed as mechanisms to promote stability in the marketplace by making it possible for companies to accept risks they believe are not adequately priced. Therefore, the general expectation is that Risk Sharing Pools by their very nature will operate at a financial loss. It is also important to note that because the Risk Sharing Pools also act as a cross-subsidization mechanism across the industry, at any given point in time, companies will have their own, unique, financial results vis-à-vis the Pools. RISK SHARING POOLS - SIZE 113
114 115 116 117 118 119 120 121 122 123 124 125 126 127 128 129 130 131 132 133 134 135 136 137 138 139
There are two ways to talk about the size of the Risk Sharing Pools: premium volume and exposure count. For calendar year 2005, the premiums written through the Grid Pool were $370.6M, and were $56.9M through the Non-Grid Pool. Taken together, they represent 22.2% of the private passenger premium volume in the province. If the combined Risk Sharing Pool were an insurance company, it would be the largest single automobile insurance entity in Alberta on a premium-volume basis. In terms of exposure count (exposure defined as one car insured for one year), 207,381 exposures were transferred to the Grid Pool in 2005, and 54,650 to the Non-Grid Pool. Taken together, this is approximately 13.9% of the private passenger vehicles in the province. This is high by historical Alberta standards, where the Facility Association Residual Market averaged 1.9% of private passenger vehicles in the five years prior to the introduction of the Risk Sharing Pools; this rate went as low as .9% in 2000. The Risk Sharing Pool market share is very high by North America residual market standards as well, with Alberta’s being the third largest in the United States and Canada, behind only those of Canada’s territories and North Carolina. The size of the residual market in a jusirisdiction is often looked upon as an indicator of the “health” of a competitive insurance market. Experience in North America suggests that a large residual market over an extended period of time is symptomatic of widespread problems in the insurance system, often related to inadequate pricing generally and/or inappropriate relationships between residual market and voluntary market pricing levels. At the Annual Adjustment Review in June of this year, Facility Association told the AIRB that it was beginning to see a shift in the distribution of risks transferred to the Risk
Facility Association Submission AIRB 2006 Industry Profit Hearing 5 October 20, 2006
140 141 142 143 144 145 146
Sharing Pools from the Grid to Non-Grid Risk Sharing Pool. As of August 31 of this year, a total of 157,822 written exposures had been transferred to both Risk Sharing Pools, as compared with 166,923 written exposures transferred in the same period last year – a decline of about 5.5%. About 31% of the risks transferred to the Risk Sharing Pools in the first eight months of this year were Non-Grid risks, compared with 12.9% for the same period last year. RISK SHARING POOLS - FINANCIAL RESULTS 147
148 149 150 151 152 153 154 155 156 157 158 159 160 161 162 163 164 165 166 167 168 169 170 171 172 173 174
Why is the size of the Risk Sharing Pool important? The main reason is financial. As mentioned above, Risk Sharing Pools are expected to operate at a loss. When they are large, as they are in Alberta, the potential financial impacts on automobile insurance companies in the province are correspondingly large. According to the audited financial statements for the first 13 months of operation of the Pools, the Grid Pool showed a loss of $93.9M on $269M of earned premium, and the Non-Grid Pool showed a loss of $28M on $18.6M of earned premium. The combined losses of the Pools were $121.9M. As the AIRB indicated in its 2005 Annual Report, insurance accounting is based on estimates, and the actual results can take years to finalize. Facility Association addressed this point in its June submission:
“The notes to our audited statements make special mention of the uncertainty around the estimates supporting those statements. Risk Sharing Pools generally are subject to greater uncertainty in estimating claims liabilities than a typical company by their very nature because decisions on what types of risks to transfer to a Pool happen at the individual company level as do decisions on claims handling and reserving practices. Not only can these decisions vary from company to company, they can also vary through time as well. Other factors than those relevant to Risk Sharing Pools generally can and likely will have a material impact on the current estimates underlying the Alberta Risk Sharing Pools’ statements. One is that during the start-up
Facility Association Submission AIRB 2006 Industry Profit Hearing 6 October 20, 2006
175 176 177 178 179 180 181 182 183 184 185 186
phase, companies began using the Risk Sharing Pool at different times and at different rates. Another is the timing and patterns of company claim submissions to the Risk Sharing Pool during the start-up phase. A third is the impact of the product reforms introduced in the province, particularly the cap on minor-injury claims. We expect all these factors to stabilize over a period of time, but right now, there is no question that this is a challenging time for our actuaries.”
As the Risk Sharing Pools’ experience continues to “mature” and stabilize, Facility Association’s consulting actuaries (with the input of its Actuarial Committee) have revised the Expected Loss Ratios (ELRs) for the Risk Sharing Pools along the following lines:
187 188
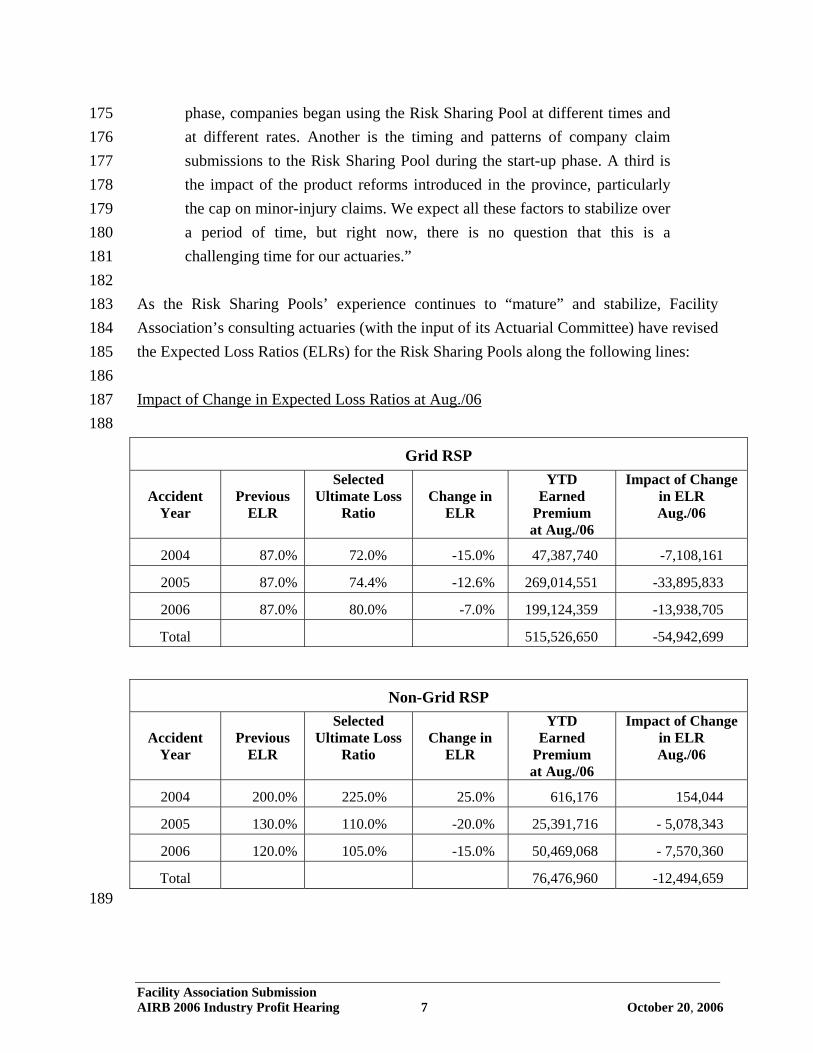
Impact of Change in Expected Loss Ratios at Aug./06
Grid RSP
Accident Year
Previous
ELR
Selected Ultimate Loss
Ratio
Change in
ELR
YTD Earned
Premium at Aug./06
Impact of Change in ELR Aug./06
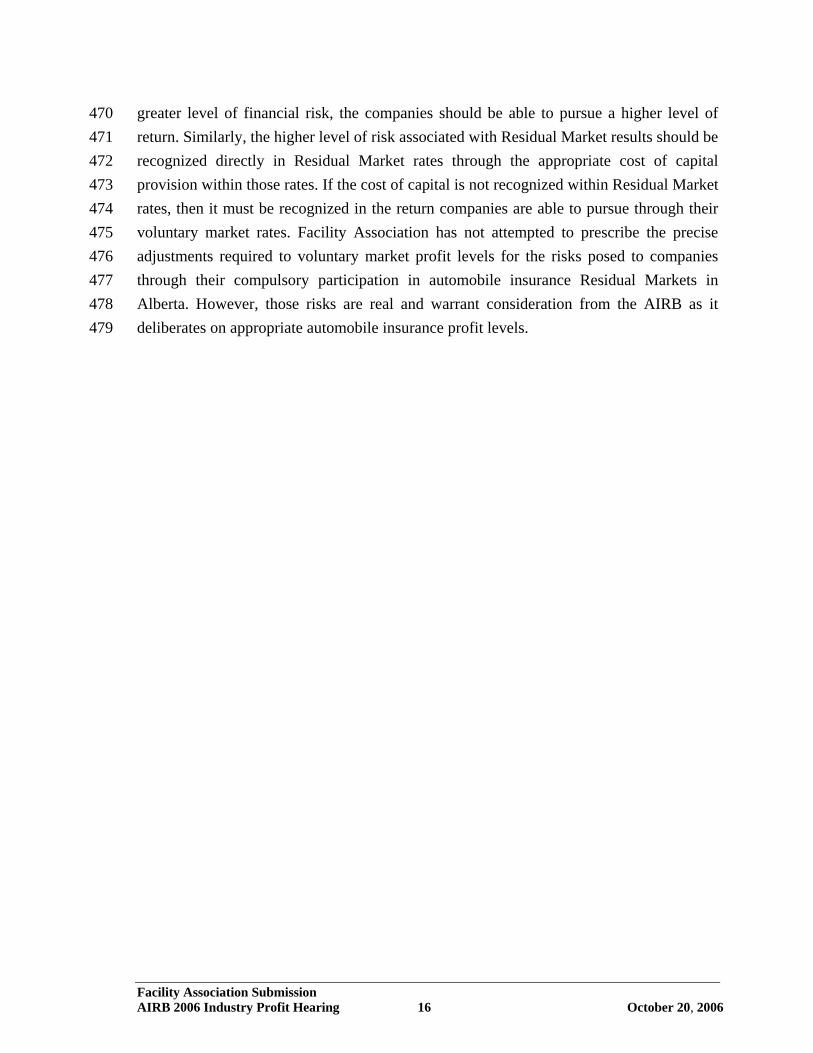
2004 87.0% 72.0% -15.0% 47,387,740 -7,108,161
2005 87.0% 74.4% -12.6% 269,014,551 -33,895,833
2006 87.0% 80.0% -7.0% 199,124,359 -13,938,705
Total 515,526,650 -54,942,699
Non-Grid RSP
Accident Year
Previous
ELR
Selected Ultimate Loss
Ratio
Change in
ELR
YTD Earned
Premium at Aug./06
Impact of Change in ELR Aug./06
2004 200.0% 225.0% 25.0% 616,176 154,044
2005 130.0% 110.0% -20.0% 25,391,716 - 5,078,343
2006 120.0% 105.0% -15.0% 50,469,068 - 7,570,360
Total 76,476,960 -12,494,659 189
Facility Association Submission AIRB 2006 Industry Profit Hearing 7 October 20, 2006
190 191 192 193 194
While these changes are positive in terms of overall financial results, they are based largely on industry experience estimates with little actual Pool experience, so the ultimate financial results could be (and probably will be) materially different. A more detailed exhibit highlighting the derivation of these figures may be found in Appendix A. RISK SHARING POOLS - MARKET IMPACT 195
196 197 198 199 200 201 202 203 204 205 206 207 208 209 210 211 212 213 214 215 216 217 218 219 220 221 222 223 224
In terms of financial impact, the key point for all stakeholders to remember is that a Risk Sharing Pool nearly half a billion dollars in size has the potential to have serious, negative financial consequences for companies and, ultimately, consumers. Simply put, a large amount of money is already being seen to behave in a volatile manner, with unpredictable impacts on Alberta automobile insurers. This is not to say that Risk Sharing Pools, in and of themselves, are necessarily harmful to a competitive marketplace. Properly designed and monitored, they can be used to guarantee availability and enhance stability in the marketplace to the benefit of the consumer by, for example, providing an opportunity for a company to accept a marginal risk on an otherwise profitable account, thus allowing the intermediary to maintain its relationship with a client. In the context of industry profit levels, the Risk Sharing Pools expose Alberta automobile insurers to an additional level of financial risk over which they have little control. The size and financial performance of the Pools are difficult to predict in advance because they result from the sum-total of individual company actions. Not only are the results of the Risk Sharing Pools themselves difficult to predict, but individual companies will be exposed to an additional level of volatility depending on how the results of the risks they cede to the Risk Sharing Pools perform vis-à-vis the Risk Sharing Pools as a whole. The financial impact on members as a result of the Pool is driven by a number of factors, including the volume of business transferred to a Risk Sharing Pool (affects the member’s share of Pool results – the more business transferred, the less the member shares in the Risk Sharing Pool results), the performance of the business transferred to a Risk Sharing Pool (once transferred, the financial results of transferred business are excluded from the member’s financial results) and the overall performance of the Risk Sharing Pool (because the member receives a share of the overall performance of the Pool – as per the formula
Facility Association Submission AIRB 2006 Industry Profit Hearing 8 October 20, 2006
225 226 227 228 229 230 231 232 233 234 235 236 237 238 239 240
mentioned above). So the net financial effect on members is driven by the profitability of the business transferred to a Risk Sharing Pool and the overall profitability of the Risk Sharing Pool. When both the transferred business and the overall Risk Sharing Pool results are negative, the greater the amount of unprofitable business transferred and the more favorable the net financial result on the member. The reverse is true if both the transferred business and the overall results of the Pool are positive. When the business transferred by a member to a Risk Sharing Pool is profitable and the Risk Sharing Pool is unprofitable, or vice versa, it is the relationship between the profitability of the business transferred and the Risk Sharing Pool profitability that will determine the net financial effect on the member. However, it is extremely difficult, if not impossible, for members to predict such results, and therein arises the great uncertainty and high risk. Given this additional level of risk, one would expect providers of capital to Alberta automobile insurers to seek a commensurately higher level of return, although there is no precise figure for what that additional “risk premium” would be. RESIDUAL MARKET - OPERATION 241
242 243 244 245 246 247 248 249 250 251 252 253 254 255 256 257 258 259
The Residual Market operates in a significantly different manner than the Risk Sharing Pools. In the Residual Market, agents and brokers submit applications to an insurer contracted with Facility Association to issue and service policies on its behalf (referred to as “servicing carriers”). Brokers and agents in Alberta are not required to have a contract with a servicing carrier, but if they do, they are required to abide by the provisions of that contract and of the Plan of Operation. All applications are written in accordance with the Residual Market Manual of Rules and Rates; that is, any specific risk will be written at the same rate regardless of the intermediary approached by the consumer. In Alberta, the rules in the manual are approved by the Superintendent, while the rates are those approved by the Automobile Insurance Rate Board or its predecessor. Financial results and statistical information are reported to Facility Association by the servicing carriers, and pertinent financial data are reported to all members monthly via the monthly participation report. Financial results of the Residual Market are shared based on market share in the province. For non-private passenger, the sharing is done on a premium-volume basis, while private
Facility Association Submission AIRB 2006 Industry Profit Hearing 9 October 20, 2006
260 261 262 263
passenger sharing is done on an exposure-count basis. The share base is updated annually, so members experiencing significant changes in their own business volume can anticipate significant changes in their share of Residual Market results as well. RESIDUAL MARKET - SIZE 264
265 266 267 268 269 270 271 272 273 274 275 276 277 278 279 280 281 282 283 284 285 286 287 288 289 290 291 292 293 294
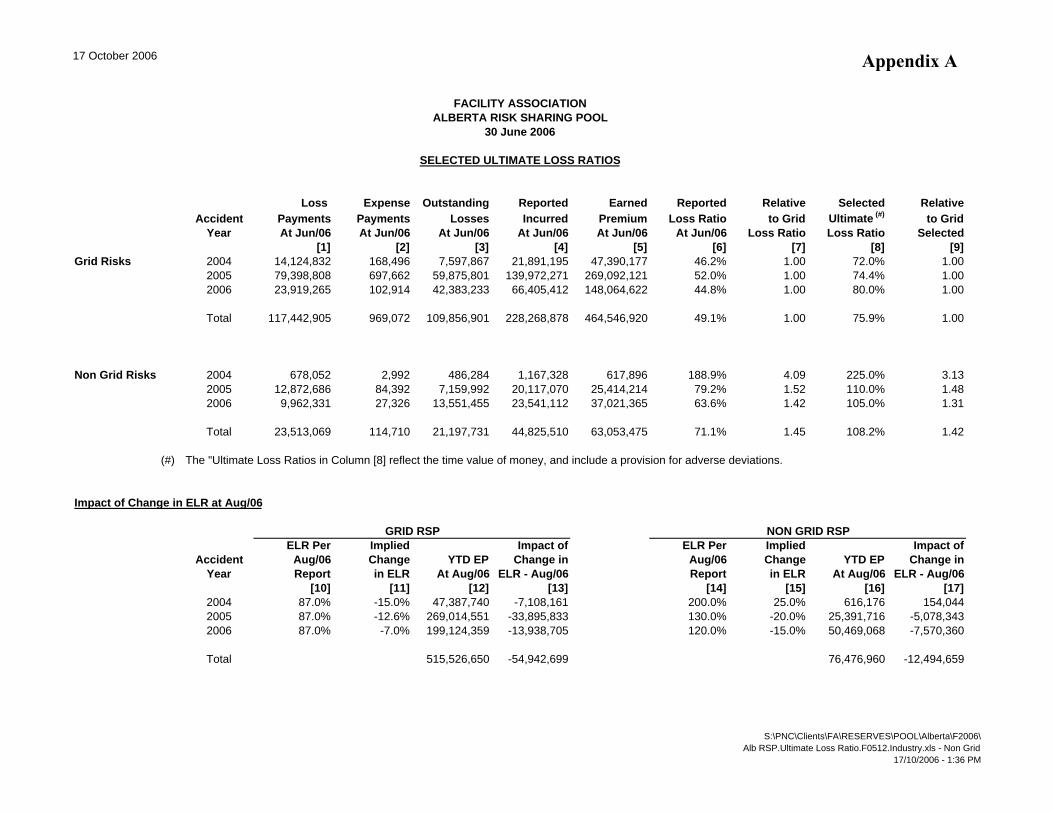
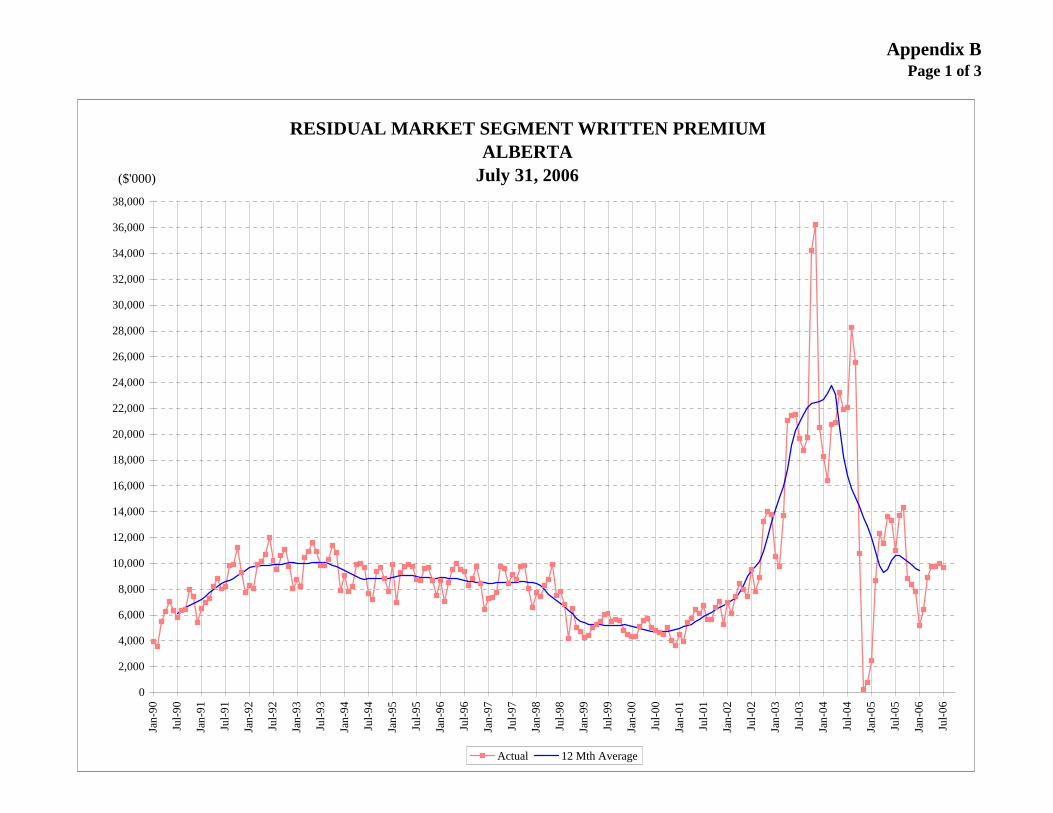
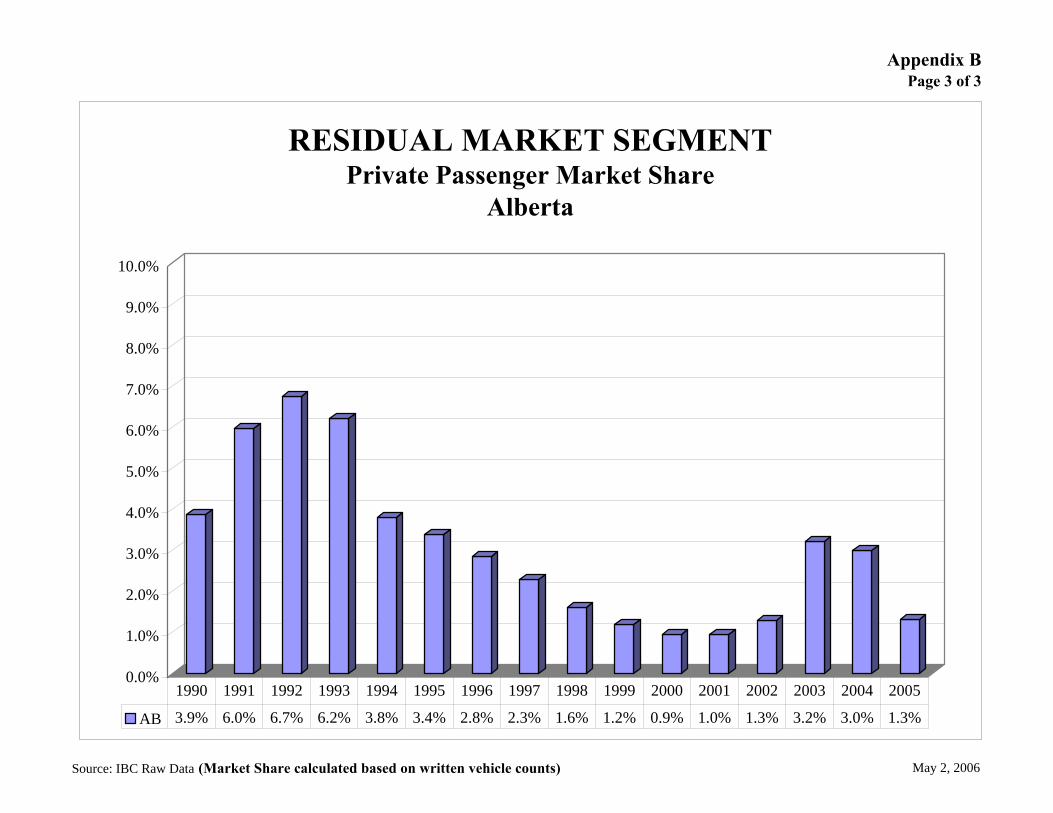
Facility Association does not track non-private passenger exposure count volumes for all vehicle types. However, for calendar accident years 2003, 2004 and 2005, non-private passenger premium volume has been relatively stable at approximately $65M, 69M and $71M, respectively. For the same years, commercial vehicle exposure counts written through the Residual Market were 10,380, 10,217 and 9,769. The private passenger volumes have been a much different story. As Appendix B shows, on an exposure-count basis, business volumes for private passenger vehicles insured through the Residual Market have been significantly more volatile. From a low of approximately 14,500 in mid-2001, the exposure count rose to a high of nearly 75,000 in September of 2004, then dropped again to approximately 9,500 by July of this year. Written premium volumes exhibited similar volatility, peaking at $177M for calendar accident year 2003 and dropping to $52M for calendar accident year 2005. The rapid decline in the size of the Residual Market resulted from very strict eligibility criteria for private passenger new business introduced effective October 1, 2004, and mandatory non-renewal of existing private passenger business that did not meet that criteria effective October 1, 2005. If current private passenger eligibility requirements remain, Residual Market private passenger vehicle volumes will likely settle at about 5,000 to 6,000 written exposures and an annual written premium volume in the neighbourhood of $17M. Facility Association’s best estimate is that 80-90% of all Residual Market private passenger risks are capped by the Premium Grid. In short, the size and the financial performance of the private passenger Residual Market will be largely driven by government-established eligibility rules and premium levels. Residual Market non-private passenger volumes are dependent in a general way on the relationship between the price of insurance available through the Residual Market and that of companies serving the market voluntarily. Because the Residual Market operates as an
Facility Association Submission AIRB 2006 Industry Profit Hearing 10 October 20, 2006

295 296 297 298 299
“open market” for other than private passenger vehicles, Facility Association will attract business if its prices are below those of its member companies. Volumes are also impacted, again in a general way, by the willingness of member companies to write the business voluntarily. RESIDUAL MARKET - FINANCIAL RESULTS 300
301 302 303 304 305 306 307 308 309 310 311 312 313 314 315 316 317 318 319 320 321 322 323 324 325 326 327 328 329
Due to the nature of Residual Market (i.e., because Facility Association is not an insurer), certain costs resulting from member companies’ compulsory membership are incurred on the members’ own accounts, rather than on those of Facility Association. Prominent among these are health levies, premium taxes, and the cost of capital. Because member companies must book their share of premiums written through the Residual Market on their own books, they must pay premium taxes, health levies, and other charges based on premium volumes themselves. This means that even though Facility Association’s financial statements may show a “break even” result, such a result represents a genuine loss to member companies. Similarly, member companies are required by solvency regulators to support their share of Residual Market premiums with their own capital. These realities are highlighted in Note 2 of Facility Association’s annual audited financial statements, and an exhibit illustrating a comparison of the Association’s results versus the impacts on its member companies in Alberta is included as Appendix C. Historically, Residual Market rates have been developed with the goal of generating enough of a surplus to distribute to member companies to cover their costs arising from their compulsory participation in the Residual Market, except that no provision was made in previous rate filings for the cost of capital. The previous position not to include a cost of capital provision was taken voluntarily by Facility Association at the direction of its Board of Directors. Why this position was taken historically is not known with any degree of certainty. The Facility Association Board of Directors revisited the issue at a meeting held on February 12, 2003 and passed a motion that a cost of capital provision be included in future rate filings:
“Following further discussion, on MOTION made by Mr. G. Cooke, SECONDED by Mr. Rodrigues and CARRIED, IT WAS RESOLVED
Facility Association Submission AIRB 2006 Industry Profit Hearing 11 October 20, 2006
330 331 332 333 334 335 336 337 338 339 340 341 342 343 344 345 346 347 348 349 350 351 352 353 354 355 356 357 358 359 360 361 362 363 364
that rates should be developed including a factor for cost of capital and that efforts be undertaken with the Regulators to bring this change about.”
Facility Association included a cost of capital provision in its rate filing for Prince Edward Island for all classes of vehicles, to take effect during 2004. Following an investigation, the Island Regulatory and Appeals Commission approved the rates as filed. Subsequently, Facility Association included a cost of capital provision in rate applications submitted to the New Brunswick Insurance Board (NBIB) in 2004, the Nova Scotia Insurance Review Board (NSIRB) and the Financial Services Commission of Ontario (FSCO). In a decision dated March 23, 2005, the NSIRB did not approve the inclusion of a cost of capital provision, citing the need for further study and evidence. A similar conclusion was reached by the NBIB, and FSCO has said that the cost of capital provision will likely be a matter for a hearing at some future date. Facility Association contends that a provision for the cost of capital supporting Residual Market premiums should be included in its rates in the province of Alberta for the following reasons: (a) Solvency regulators require that Residual Market premiums booked by member
companies be supported by the capital of member companies just as voluntary premiums must be. That capital has a cost and, because rates are to be developed to cover expected costs, it is proper to include a cost of capital provision in Residual Market rates.
(b) If voluntary market rates include a cost of capital provision and involuntary market
rates do not, there is an implicit subsidy of involuntary market rates by member companies, and by extension, by their customers and shareholders. In Alberta, those receiving this implicit subsidy are for the most part commercial enterprises or objectively defined “high-risk” private passenger vehicles and drivers (who also have the protection of the premium grid). This situation can lead to undesirable public policy outcomes, such as the Residual Market being larger than it needs to be. The Facility Association Board contends that drivers insured through the Residual Market should face the same cost elements as drivers insured in the voluntary market.
Facility Association Submission AIRB 2006 Industry Profit Hearing 12 October 20, 2006
365 366 367 368 369 370 371 372 373 374 375 376 377 378 379 380 381 382 383 384 385 386 387 388 389 390 391 392 393 394 395 396 397 398 399
(c) Allowing the implicit subsidy mentioned above means that specialty insurers who specialize in providing coverage for risks typically insured through either the Residual Market or specialty insurers are put at a competitive disadvantage because they are, in effect competing with a cooperative entity backed by the financial strength of the insurance industry providing coverage at a subsidized price.
(d) It could be suggested that the cost of capital to support Residual Market premiums
be included in the voluntary market rates of companies serving the Alberta automobile insurance marketplace. In addition to the adverse public policy implications of that approach (mentioned above), the volatility of Residual Market premium volumes would require companies to frequently re-calculate the “loading” in their rates for the cost of capital needed to support Residual Market premiums.
Facility Association expects that the precise level of return to be used in calculating the cost of capital provision in Residual Market rates will be a logical outcome of the current hearing. Given the inherently higher uncertainty of Residual Market volumes and financial results, the level of return used in calculating the cost of capital provision in Residual Market rates should be slightly higher than the level of return set for the industry as a whole. At a Facility Association rate hearing before the Nova Scotia Insurance Review Board (NSIRB) held November 9 and 10, 2004, the NSIRB’s actuarial advisor, Ted Zubulake of Mercer Oliver Wyman (the Alberta Automobile Insurance Rate Board’s consulting actuary), acknowledged that Facility Association’s operations were inherently more uncertain than those of the voluntary market and that appropriate levels of return on equity should vary directly with the levels of uncertainty facing the enterprise. From the transcripts of that hearing (page 604): Mr. Zubulake: “…to the extent a target -- a cost of capital provision is
allowed the Facility Association and to then -- and to the extent that a target or a cost of capital or a profit contingency provision is -- a standard one is identified and selected for the regular market that perhaps I would certainly
Facility Association Submission AIRB 2006 Industry Profit Hearing 13 October 20, 2006
400 401 402 403 404 405 406 407 408 409 410 411 412 413 414 415 416 417 418 419 420 421 422 423 424 425 426 427 428 429 430 431 432 433 434
suggest or believe that consideration should be given to perhaps a slightly higher return for the Facility Association. How much higher, what the absolute number is, I don't know.”
The volatility in both the size of the Residual Market and in its net operating results pose a significant business risk to Facility Association’s member companies due to their compulsory participation. Dr. Richard McGaw from the Department of Economics of the University of New Brunswick supported this statement in a written submission to the New Brunswick Insurance Board in June, 2005:
“Facility Association Cost of Capital The arguments used to justify a return to capital for a regulated enterprise apply equally to the Facility Association. If capital is provided to the operation of the FA then it has a cost like any other capital provided. To the extent that the cost of capital is borne either by the insurance companies through lower profits or (by) regular policyholders cross-subsidizing FA rates through higher premiums, there is an undesirable element of subsidization. Markets perform best when participants bear the full cost of their choices. As a matter of principle, there should be recognition of the cost of capital and it should be at least as high as the rate for normal business. Given the larger risk, there are valid arguments to exceed the general ROE. I note that a number of companies have written to the effect that they have not included the FA capital in their capital determination for regular policies.”
The question “How does the decision to include a cost of capital provision reconcile with the Facility Association being a non-profit association?” or a similar variant has been posed by various regulatory authorities. Facility Association’s non-profit status has always been based on the fact that its administrative activities have been invoiced to the member companies at cost. Facility Association has always maintained that the financial results (both positive and negative) of the various insurance pools it administers across Canada belong to its members.
Facility Association Submission AIRB 2006 Industry Profit Hearing 14 October 20, 2006
435 436 437 438 439 440 441 442 443 444 445 446 447 448 449 450 451 452 453 454 455 456 457 458 459 460 461 462 463 464 465
The non-profit status of Facility Association was the subject of a lengthy public hearing before the Newfoundland & Labrador Board of Commissioners of Public Utilities (PUB) in 2000-2001. In its order A.I.36 (2000-2001), the PUB offered the following comment:
“From the evidence of witnesses and argument of Counsel, the Board concludes that Facility is a non-profit association that operates as nothing more than the administrator of a risk sharing automobile insurance pool. The servicing carrier companies of Facility underwrite the business risks and, on behalf of the member companies Facility carries out an administration function including, inter alia, investment of funds, administration of the bank accounts, issuing of reports on the status of funds and accounts, distribution of members’ profits and issuing assessment notices for losses incurred. Facility’s expenses are paid by the member companies and that is all Facility is paid. As their revenues can never exceed their expenditures, Facility can never earn a profit.”
In its press release announcing the above Order, the PUB stated:
“The Board found that any profit generated by the operation of Facility Association belongs to the members of the Association.” (Appendix D)
This finding was consistent with the actuarial evidence presented at the hearing, both by the PUB’s own actuarial advisor and Facility Association’s actuary, that historical Facility Association operating results are not directly relevant for the purposes of prospective rate-making, with its focus on expected future revenues and costs. If, despite these arguments supporting the inclusion of a cost of capital provision within the involuntary market rates, a cost of capital provision is not allowed there, the industry voluntary market rates must include that cost. Facility Association has not attempted to calculate what the cost of capital provision should be. CONCLUDING REMARKS 466
467 468 469
The underlying premise of this submission is very basic: the level of return should be commensurate with the risk. To the extent that Risk Sharing Pools expose companies to a
Facility Association Submission AIRB 2006 Industry Profit Hearing 15 October 20, 2006
470 471 472 473 474 475 476 477 478 479
greater level of financial risk, the companies should be able to pursue a higher level of return. Similarly, the higher level of risk associated with Residual Market results should be recognized directly in Residual Market rates through the appropriate cost of capital provision within those rates. If the cost of capital is not recognized within Residual Market rates, then it must be recognized in the return companies are able to pursue through their voluntary market rates. Facility Association has not attempted to prescribe the precise adjustments required to voluntary market profit levels for the risks posed to companies through their compulsory participation in automobile insurance Residual Markets in Alberta. However, those risks are real and warrant consideration from the AIRB as it deliberates on appropriate automobile insurance profit levels.
Facility Association Submission AIRB 2006 Industry Profit Hearing 16 October 20, 2006
17 October 2006
Loss Expense Outstanding Reported Earned Reported Relative Selected RelativeAccident Payments Payments Losses Incurred Premium Loss Ratio to Grid Ultimate (#) to Grid
Year At Jun/06 At Jun/06 At Jun/06 At Jun/06 At Jun/06 At Jun/06 Loss Ratio Loss Ratio Selected[1] [2] [3] [4] [5] [6] [7] [8] [9]
Grid Risks 2004 14,124,832 168,496 7,597,867 21,891,195 47,390,177 46.2% 1.00 72.0% 1.002005 79,398,808 697,662 59,875,801 139,972,271 269,092,121 52.0% 1.00 74.4% 1.002006 23,919,265 102,914 42,383,233 66,405,412 148,064,622 44.8% 1.00 80.0% 1.00
Total 117,442,905 969,072 109,856,901 228,268,878 464,546,920 49.1% 1.00 75.9% 1.00
Non Grid Risks 2004 678,052 2,992 486,284 1,167,328 617,896 188.9% 4.09 225.0% 3.132005 12,872,686 84,392 7,159,992 20,117,070 25,414,214 79.2% 1.52 110.0% 1.482006 9,962,331 27,326 13,551,455 23,541,112 37,021,365 63.6% 1.42 105.0% 1.31
Total 23,513,069 114,710 21,197,731 44,825,510 63,053,475 71.1% 1.45 108.2% 1.42
(#) The "Ultimate Loss Ratios in Column [8] reflect the time value of money, and include a provision for adverse deviations.
Impact of Change in ELR at Aug/06
ELR Per Implied Impact of ELR Per Implied Impact ofAccident Aug/06 Change YTD EP Change in Aug/06 Change YTD EP Change in
Year Report in ELR At Aug/06 ELR - Aug/06 Report in ELR At Aug/06 ELR - Aug/06[10] [11] [12] [13] [14] [15] [16] [17]
2004 87.0% -15.0% 47,387,740 -7,108,161 200.0% 25.0% 616,176 154,0442005 87.0% -12.6% 269,014,551 -33,895,833 130.0% -20.0% 25,391,716 -5,078,3432006 87.0% -7.0% 199,124,359 -13,938,705 120.0% -15.0% 50,469,068 -7,570,360
Total 515,526,650 -54,942,699 76,476,960 -12,494,659
GRID RSP NON GRID RSP
FACILITY ASSOCIATIONALBERTA RISK SHARING POOL
SELECTED ULTIMATE LOSS RATIOS
30 June 2006
S:\PNC\Clients\FA\RESERVES\POOL\Alberta\F2006\Alb RSP.Ultimate Loss Ratio.F0512.Industry.xls - Non Grid
17/10/2006 - 1:36 PM
Appendix A
Appendix BPage 1 of 3
RESIDUAL MARKET SEGMENT WRITTEN PREMIUMALBERTA
July 31, 2006
0
2,000
4,000
6,000
8,000
10,000
12,000
14,000
16,000
18,000
20,000
22,000
24,000
26,000
28,000
30,000
32,000
34,000
36,000
38,000
Jan-
90
Jul-9
0
Jan-
91
Jul-9
1
Jan-
92
Jul-9
2
Jan-
93
Jul-9
3
Jan-
94
Jul-9
4
Jan-
95
Jul-9
5
Jan-
96
Jul-9
6
Jan-
97
Jul-9
7
Jan-
98
Jul-9
8
Jan-
99
Jul-9
9
Jan-
00
Jul-0
0
Jan-
01
Jul-0
1
Jan-
02
Jul-0
2
Jan-
03
Jul-0
3
Jan-
04
Jul-0
4
Jan-
05
Jul-0
5
Jan-
06
Jul-0
6
($'000)
Actual 12 Mth Average
Appendix BPage 2 of 3
Source: IBC Monthly Report Prepared: Nov 8 2006
FACILITY ASSOCIATION Alberta PPV Written Exposures
0
10,000
20,000
30,000
40,000
50,000
60,000
70,000
80,000
1994-41995-2
1995-41996-2
1996-41997-2
1997-41998-2
1998-41999-2
1999-42000-2
2000-42001-2
2001-42002-2
2002-42003-2
2003-42004-2
2004-42005-2
2005-42006-2
Rolling 12 months semi-annually
Written Vehicles
Appendix BPage 3 of 3
Source: IBC Raw Data (Market Share calculated based on written vehicle counts) May 2, 2006
0.0%
1.0%
2.0%
3.0%
4.0%
5.0%
6.0%
7.0%
8.0%
9.0%
10.0%
RESIDUAL MARKET SEGMENT Private Passenger Market Share
Alberta
AB 3.9% 6.0% 6.7% 6.2% 3.8% 3.4% 2.8% 2.3% 1.6% 1.2% 0.9% 1.0% 1.3% 3.2% 3.0% 1.3%
1990 1991 1992 1993 1994 1995 1996 1997 1998 1999 2000 2001 2002 2003 2004 2005
Appendix C Page 1 of 5
EXCERPT OF FACILITY ASSOCIATION RESIDUAL MARKET SEGMENT Notes to the Financial Statements October 31, 2005 2. BASIS OF FINANCIAL STATEMENT PRESENTATION
The Association manages the following insurance pools:
• The Residual Market Segment, which provides a residual automobile insurance market for owners and operators of personal and commercial motor vehicles, who may otherwise have difficulty in obtaining such insurance, in the following provinces and territories: Alberta, Ontario, Nova Scotia, Prince Edward Island, New Brunswick, Newfoundland and Labrador, Yukon, Northwest Territories, Nunavut.
• The Uninsured Automobile Funds for New Brunswick, Newfoundland and Labrador, Nova
Scotia and P.E.I., which fund claims for damages made by persons who cannot obtain satisfaction for damages under a contract of automobile insurance and where there is no other insurance or where other insurance is inadequate with respect to the damages claimed.
• Risk sharing pools, operating in Ontario, Alberta (two pools) and New Brunswick which
provide a means for individual automobile insurance underwriters to transfer certain of the personal use automobile insurance exposures they underwrite in the respective province that may be deemed of higher risk but which do not qualify for the Residual Market Segment.
The Ontario Risk Sharing Pool has operated since January 1, 1993.
The two Alberta Risk Sharing Pools commenced operations as at October 1, 2004. A "Grid Pool" provides a means for Alberta automobile insurance underwriters to transfer personal use automobile insurance exposures that are subject to the statutory maximum premium. A "Non-Grid Pool" provides a means for individual Alberta automobile insurance underwriters to transfer certain of the personal use automobile insurance exposures they underwrite that may be deemed to be of higher risk but do not qualify for the Residual Market Segment. Their first statutory financial statements are for the thirteen month period ended October 31, 2005.
The New Brunswick "First Chance" Risk Sharing Pool commenced operations January 1, 2005. The "First Chance" Pool provides a means for individual New Brunswick automobile insurance underwriters to transfer certain of the personal use automobile insurance policies they underwrite that are eligible for the "First Chance" discount in that province. Its first statutory financial statements are for the ten month period ended October 31, 2005.
The financial statements contained herein are for the Residual Market Segment operations and for the Uninsured Automobile Funds of the Association.
Separate financial statements are prepared for each of the risk sharing pools. Page 6 of 19
Appendix C Page 2 of 5
EXCERPT OF FACILITY ASSOCIATION RESIDUAL MARKET SEGMENT Notes to the Financial Statements October 31, 2005
2. BASIS OF FINANCIAL STATEMENT PRESENTATION (continued)
All of the premiums of the Residual Market Segment are allocated to member companies who are required by regulation to record these premiums in their financial records as direct written premiums. Member companies pay premium taxes and health levies directly to the provinces based on their direct written premiums. Members also incur other costs, such as association dues to industry organizations which are also based on direct written premiums. Accordingly, these costs are not recorded in these financial statements. Investment income earned by members on amounts due to the Association and certain premium levies charged to members in respect of uninsured automobile exposures are also not reflected in these financial statements.
No provision for income taxes is recorded in these financial statements. The results of operations of the insurance pools, including administrative expenses incurred by the Association and investment income earned on insurance pool assets invested by the Association, are included in the members’ income for tax assessment purposes.
Page 7 of 19
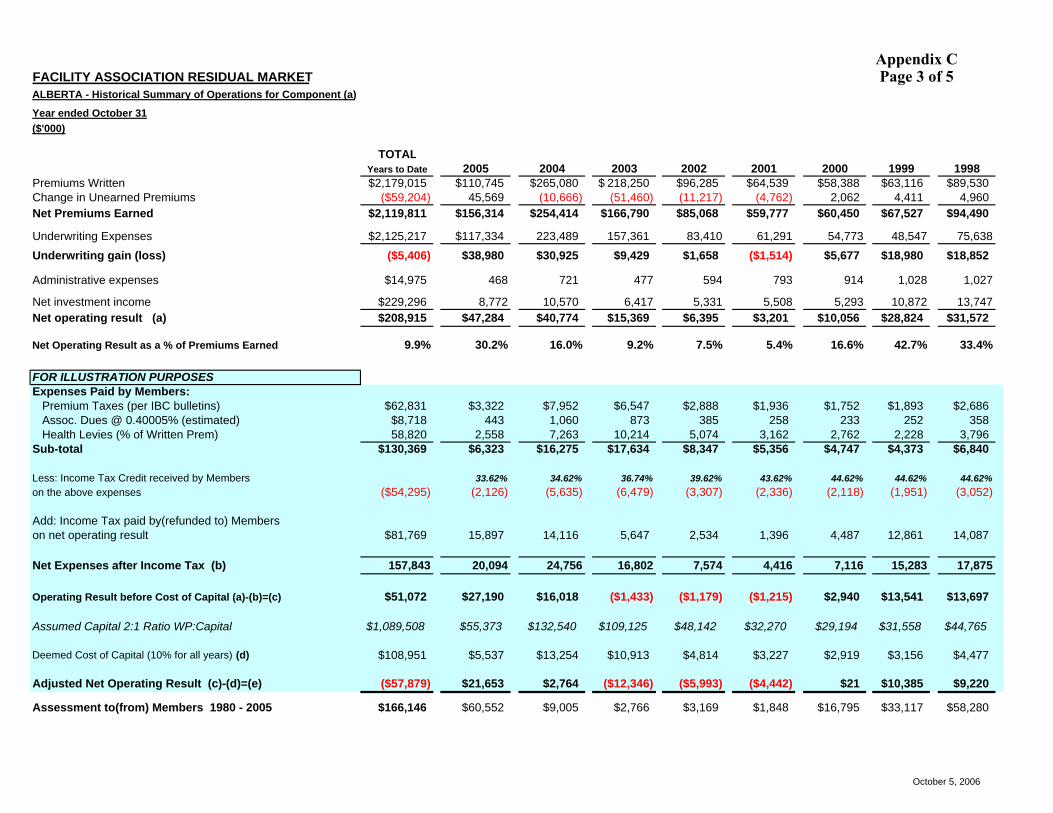
FACILITY ASSOCIATION RESIDUAL MARKETALBERTA - Historical Summary of Operations for Component (a)
Year ended October 31($'000)
TOTALYears to Date 2005 2004 2003 2002 2001 2000 1999 1998
Premiums Written $2,179,015 $110,745 $265,080 218,250$ $96,285 $64,539 $58,388 $63,116 $89,530Change in Unearned Premiums ($59,204) 45,569 (10,666) (51,460) (11,217) (4,762) 2,062 4,411 4,960Net Premiums Earned $2,119,811 $156,314 $254,414 $166,790 $85,068 $59,777 $60,450 $67,527 $94,490
Underwriting Expenses $2,125,217 $117,334 223,489 157,361 83,410 61,291 54,773 48,547 75,638Underwriting gain (loss) ($5,406) $38,980 $30,925 $9,429 $1,658 ($1,514) $5,677 $18,980 $18,852
Administrative expenses $14,975 468 721 477 594 793 914 1,028 1,027
Net investment income $229,296 8,772 10,570 6,417 5,331 5,508 5,293 10,872 13,747Net operating result (a) $208,915 $47,284 $40,774 $15,369 $6,395 $3,201 $10,056 $28,824 $31,572
Net Operating Result as a % of Premiums Earned 9.9% 30.2% 16.0% 9.2% 7.5% 5.4% 16.6% 42.7% 33.4%
FOR ILLUSTRATION PURPOSES Expenses Paid by Members: Premium Taxes (per IBC bulletins) $62,831 $3,322 $7,952 $6,547 $2,888 $1,936 $1,752 $1,893 $2,686 Assoc. Dues @ 0.40005% (estimated) $8,718 443 1,060 873 385 258 233 252 358 Health Levies (% of Written Prem) 58,820 2,558 7,263 10,214 5,074 3,162 2,762 2,228 3,796 Sub-total $130,369 $6,323 $16,275 $17,634 $8,347 $5,356 $4,747 $4,373 $6,840
Less: Income Tax Credit received by Members 33.62% 34.62% 36.74% 39.62% 43.62% 44.62% 44.62% 44.62%on the above expenses ($54,295) (2,126) (5,635) (6,479) (3,307) (2,336) (2,118) (1,951) (3,052)
Add: Income Tax paid by(refunded to) Memberson net operating result $81,769 15,897 14,116 5,647 2,534 1,396 4,487 12,861 14,087
Net Expenses after Income Tax (b) 157,843 20,094 24,756 16,802 7,574 4,416 7,116 15,283 17,875
Operating Result before Cost of Capital (a)-(b)=(c) $51,072 $27,190 $16,018 ($1,433) ($1,179) ($1,215) $2,940 $13,541 $13,697
Assumed Capital 2:1 Ratio WP:Capital $1,089,508 $55,373 $132,540 $109,125 $48,142 $32,270 $29,194 $31,558 $44,765
Deemed Cost of Capital (10% for all years) (d) $108,951 $5,537 $13,254 $10,913 $4,814 $3,227 $2,919 $3,156 $4,477
Adjusted Net Operating Result (c)-(d)=(e) ($57,879) $21,653 $2,764 ($12,346) ($5,993) ($4,442) $21 $10,385 $9,220
Assessment to(from) Members 1980 - 2005 $166,146 $60,552 $9,005 $2,766 $3,169 $1,848 $16,795 $33,117 $58,280
October 5, 2006
Appendix C Page 3 of 5
FACILITY ASSOCIATION RESIDUAL MARKETALBERTA - Historical Summary of Operations for Component (a)
Year ended October 31($'000)
Premiums WrittenChange in Unearned PremiumsNet Premiums Earned
Underwriting ExpensesUnderwriting gain (loss)
Administrative expenses
Net investment incomeNet operating result (a)
Net Operating Result as a % of Premiums Earned
FOR ILLUSTRATION PURPOSES Expenses Paid by Members: Premium Taxes (per IBC bulletins) Assoc. Dues @ 0.40005% (estimated) Health Levies (% of Written Prem)Sub-total
Less: Income Tax Credit received by Memberson the above expenses
Add: Income Tax paid by(refunded to) Memberson net operating result
Net Expenses after Income Tax (b)
Operating Result before Cost of Capital (a)-(b)=(c)
Assumed Capital 2:1 Ratio WP:Capital
Deemed Cost of Capital (10% for all years) (d)
Adjusted Net Operating Result (c)-(d)=(e)
Assessment to(from) Members 1980 - 2005
1997 1996 1995 1994 1993 1992 1991 1990 1989$102,646 $105,881 $109,047 $107,428 $120,159 $117,614 $97,915 $66,885 $47,932
(1,889) 2,147 (1,324) 6,369 (1,366) (5,663) (10,638) (7,117) (3,276)$100,757 $108,028 $107,723 $113,797 $118,793 $111,951 $87,277 $59,768 $44,656
81,853 101,749 96,392 127,223 153,254 159,658 118,576 67,084 48,580$18,904 $6,279 $11,331 ($13,426) ($34,461) ($47,707) ($31,299) ($7,316) ($3,924)
816 829 881 1,022 953 606 422 255 274
24,061 17,437 15,020 15,896 27,197 25,974 14,461 6,930 4,449$42,149 $22,887 $25,470 $1,448 ($8,217) ($22,339) ($17,260) ($641) $251
41.8% 21.2% 23.6% 1.3% -6.9% -20.0% -19.8% -1.1% 0.6%
$3,079 $3,176 $3,271 $3,223 $3,605 $3,528 $2,937 $2,006 $1,438411 424 436 430 481 470 392 268 192
6,703 10,842 1,314 1,101 1,003 800 - - - $10,193 $14,442 $5,021 $4,754 $5,089 $4,798 $3,329 $2,274 $1,630
44.62% 44.62% 44.58% 44.34% 44.34% 44.34% 44.34% 43.84% 43.84%(4,548) (6,444) (2,238) (2,108) (2,256) (2,127) (1,476) (997) (714)
18,807 10,212 11,355 642 (3,643) (9,905) (7,653) (281) 110
24,452 18,210 14,138 3,288 (810) (7,234) (5,800) 996 1,026
$17,697 $4,677 $11,332 ($1,840) ($7,407) ($15,105) ($11,460) ($1,637) ($775)
$51,323 $52,940 $54,524 $53,714 $60,080 $58,806 $48,957 $33,442 $23,966
$5,132 $5,294 $5,452 $5,371 $6,008 $5,881 $4,896 $3,344 $2,397
$12,565 ($617) $5,880 ($7,211) ($13,415) ($20,986) ($16,356) ($4,981) ($3,172)
$27,054 ($10,175) ($16,069) ($6,458) ($3,291) ($1,102) ($309) ($9,746) $3,282
October 5, 2006
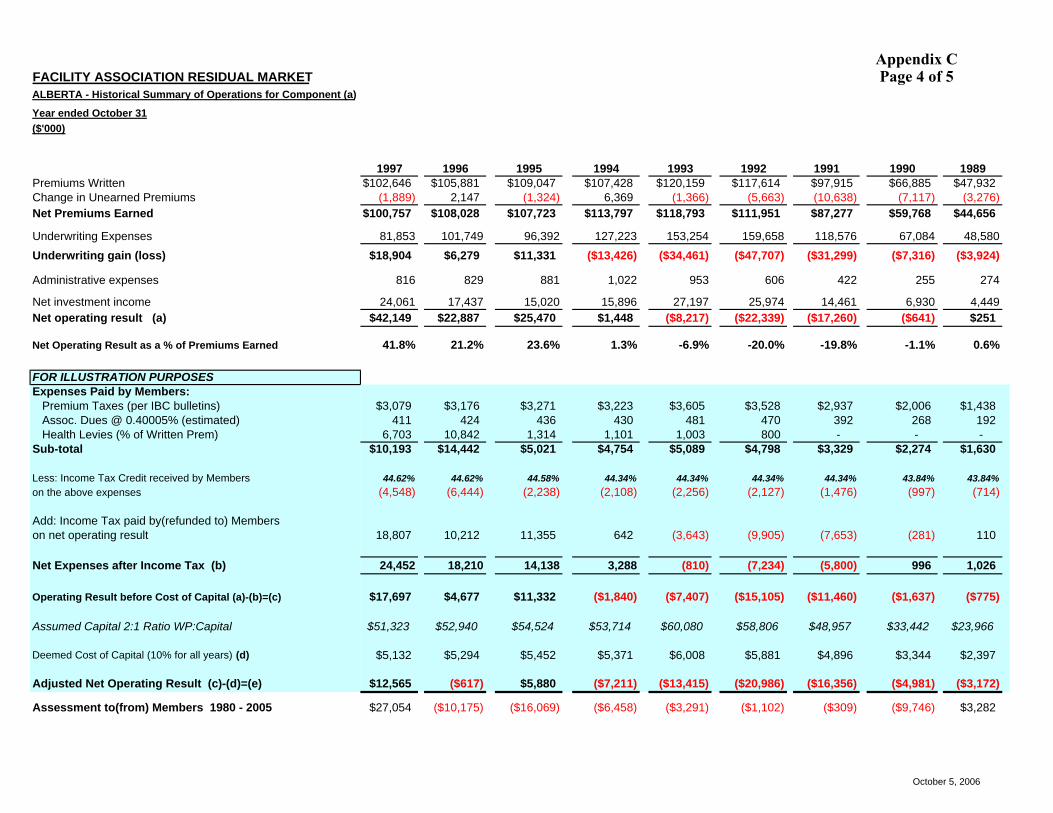
Appendix C Page 4 of 5
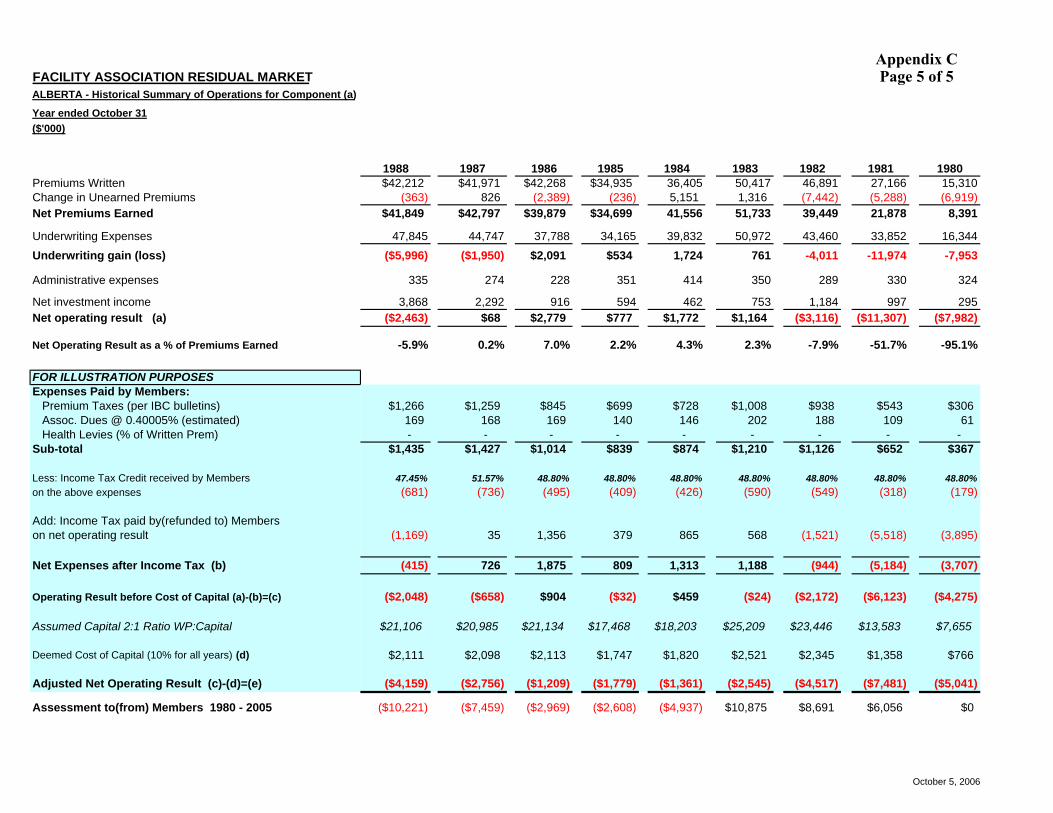
FACILITY ASSOCIATION RESIDUAL MARKETALBERTA - Historical Summary of Operations for Component (a)
Year ended October 31($'000)
Premiums WrittenChange in Unearned PremiumsNet Premiums Earned
Underwriting ExpensesUnderwriting gain (loss)
Administrative expenses
Net investment incomeNet operating result (a)
Net Operating Result as a % of Premiums Earned
FOR ILLUSTRATION PURPOSES Expenses Paid by Members: Premium Taxes (per IBC bulletins) Assoc. Dues @ 0.40005% (estimated) Health Levies (% of Written Prem)Sub-total
Less: Income Tax Credit received by Memberson the above expenses
Add: Income Tax paid by(refunded to) Memberson net operating result
Net Expenses after Income Tax (b)
Operating Result before Cost of Capital (a)-(b)=(c)
Assumed Capital 2:1 Ratio WP:Capital
Deemed Cost of Capital (10% for all years) (d)
Adjusted Net Operating Result (c)-(d)=(e)
Assessment to(from) Members 1980 - 2005
1988 1987 1986 1985 1984 1983 1982 1981 1980$42,212 $41,971 $42,268 $34,935 36,405 50,417 46,891 27,166 15,310
(363) 826 (2,389) (236) 5,151 1,316 (7,442) (5,288) (6,919)$41,849 $42,797 $39,879 $34,699 41,556 51,733 39,449 21,878 8,391
47,845 44,747 37,788 34,165 39,832 50,972 43,460 33,852 16,344($5,996) ($1,950) $2,091 $534 1,724 761 -4,011 -11,974 -7,953
335 274 228 351 414 350 289 330 324
3,868 2,292 916 594 462 753 1,184 997 295($2,463) $68 $2,779 $777 $1,772 $1,164 ($3,116) ($11,307) ($7,982)
-5.9% 0.2% 7.0% 2.2% 4.3% 2.3% -7.9% -51.7% -95.1%
$1,266 $1,259 $845 $699 $728 $1,008 $938 $543 $306169 168 169 140 146 202 188 109 61- - - - - - - - -
$1,435 $1,427 $1,014 $839 $874 $1,210 $1,126 $652 $367
47.45% 51.57% 48.80% 48.80% 48.80% 48.80% 48.80% 48.80% 48.80%(681) (736) (495) (409) (426) (590) (549) (318) (179)
(1,169) 35 1,356 379 865 568 (1,521) (5,518) (3,895)
(415) 726 1,875 809 1,313 1,188 (944) (5,184) (3,707)
($2,048) ($658) $904 ($32) $459 ($24) ($2,172) ($6,123) ($4,275)
$21,106 $20,985 $21,134 $17,468 $18,203 $25,209 $23,446 $13,583 $7,655
$2,111 $2,098 $2,113 $1,747 $1,820 $2,521 $2,345 $1,358 $766
($4,159) ($2,756) ($1,209) ($1,779) ($1,361) ($2,545) ($4,517) ($7,481) ($5,041)
($10,221) ($7,459) ($2,969) ($2,608) ($4,937) $10,875 $8,691 $6,056 $0
October 5, 2006
Appendix C Page 5 of 5
Appendix D
Rates Charged By Facility Association in this Province Press Release Board of Commissioners of Public Utilities Friday, March 30, 2001 The Board has today released its findings resulting from an investigation into the rates charged by Facility Association in the Province. The Board has concluded, in part, that the rates approved for Facility Association have been based on sound actuarial principles and the best information available at the time. The Board found that any profit generated by the operation of Facility Association belongs to the members of the Association. The Board also found that it would not be prudent to consider these profits in the rate setting process. A complete copy of the Board’s decision can be found in Order A.I. 36 (2000-2001) which is available on the Board’s website at www.pub.nf.ca . Any inquiry should be directed to Randy Pelletier, Legal Counsel.
Phone: 726-8600
E-mail: [email protected]
Facsimile: 726-9604
Facility Association - List of Representatives Alberta Automobile Insurance Rate Board Review of Profit Level for Automobile Insurance Mr. David J. Simpson President & CEO Mr. Norman Seeney Vice President, Finance and CFO