Embed Size (px)
Citation preview

Appropriate uses of the AMPM diet survey method
Alanna MoshfeghFood Surveys Research Group
USDA/ARS Beltsville Human Nutrition Research Center
Joint Federal Agency Diet & -Omics WorkshopUSDA George Washington Carver Center
Beltsville, MD, March 31, 2009
Topics to Address
• Automated Multiple Pass Method
• AMPM Validation Study
• Related databases

Dietary Interview Component of NHANES
2 days of dietary intake dataday 1 in-personday 2 telephonebilingual dietary interviewers
Dietary Collection:
Method: USDA’s Automated Multiple Pass Method
National Survey: What We Eat in America, NHANES
9,000+ individuals for 2-year release
AMPM used continuously since 2002
Sample:
Use:
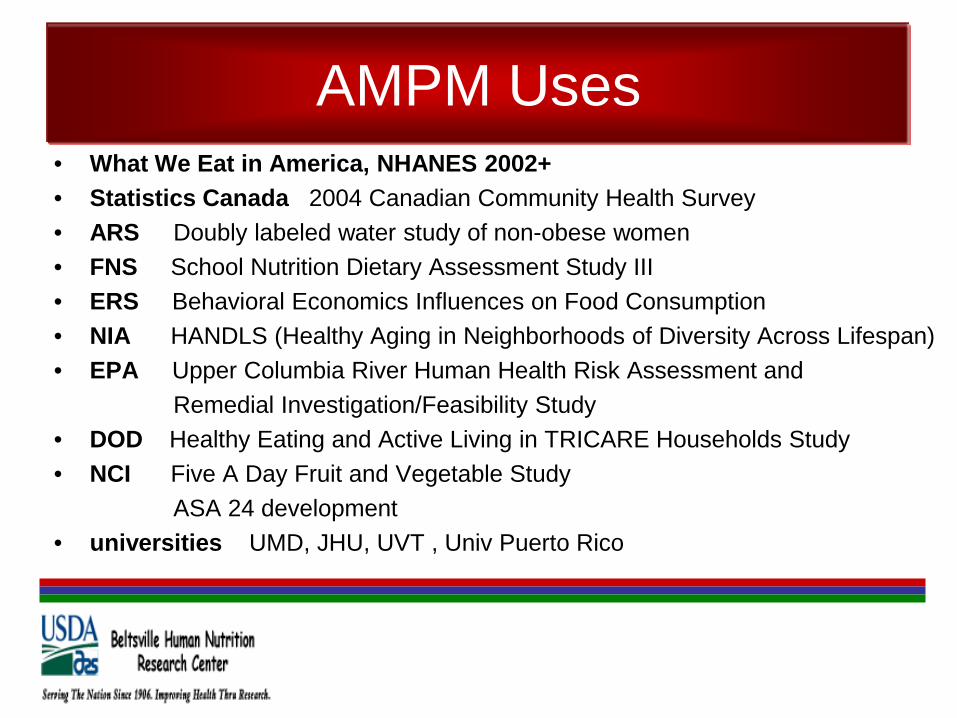
AMPM Uses• What We Eat in America, NHANES 2002+• Statistics Canada 2004 Canadian Community Health Survey• ARS Doubly labeled water study of non-obese women• FNS School Nutrition Dietary Assessment Study III• ERS Behavioral Economics Influences on Food Consumption• NIA HANDLS (Healthy Aging in Neighborhoods of Diversity Across Lifespan) • EPA Upper Columbia River Human Health Risk Assessment and
Remedial Investigation/Feasibility Study• DOD Healthy Eating and Active Living in TRICARE Households Study• NCI Five A Day Fruit and Vegetable Study
ASA 24 development• universities UMD, JHU, UVT , Univ Puerto Rico
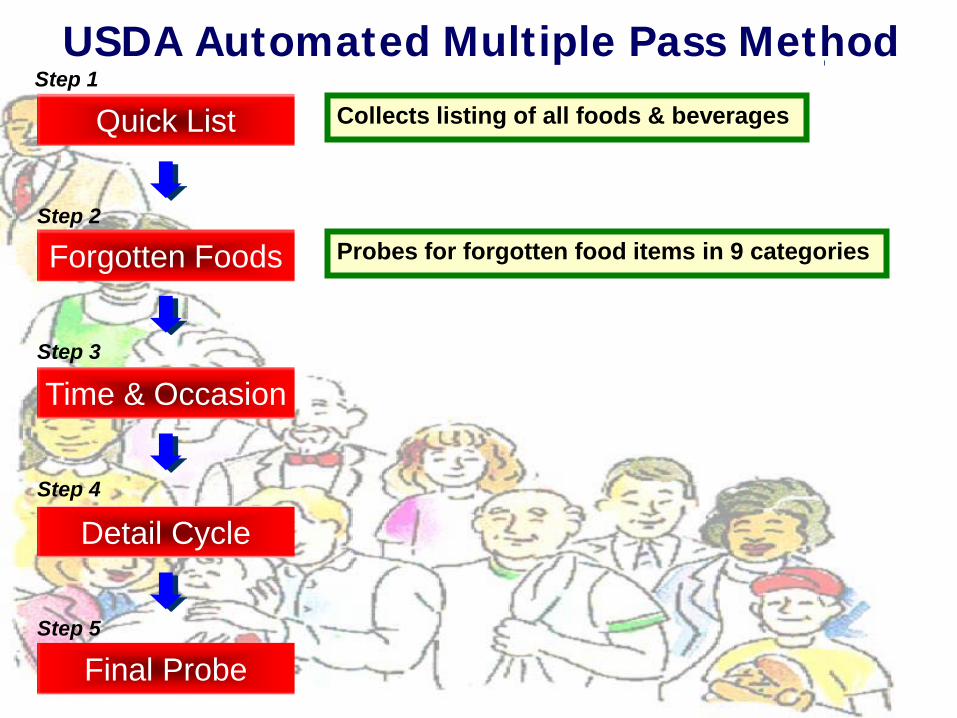
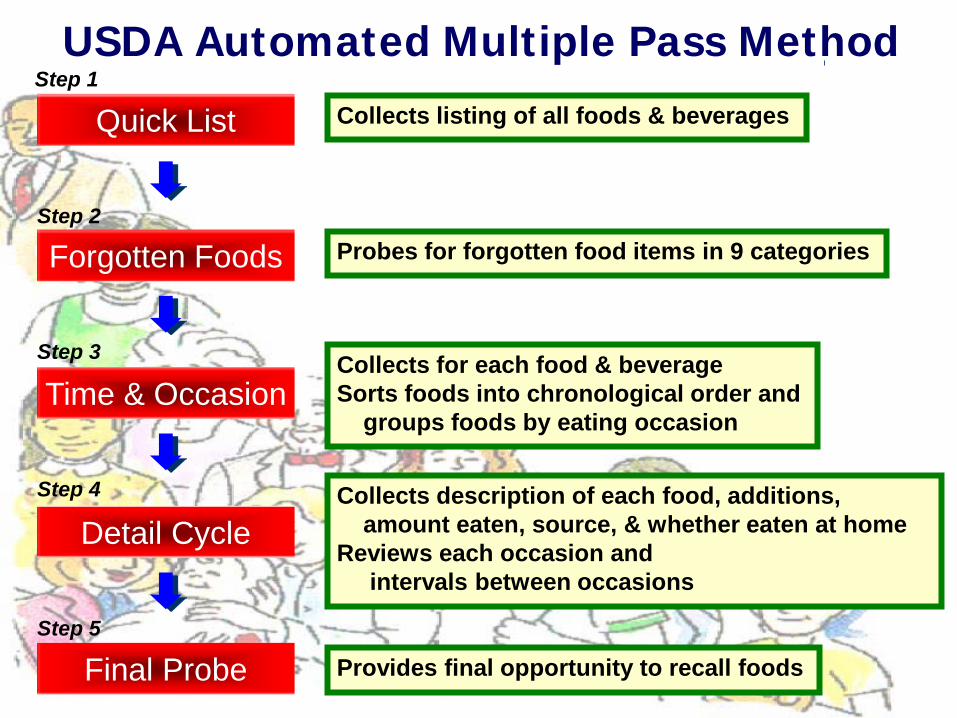
Quick ListStep 1
Forgotten FoodsStep 2
Time & OccasionStep 3
Detail CycleStep 4
Final ProbeStep 5
USDA Automated Multiple Pass MethodCollects listing of all foods & beverages
Probes for forgotten food items in 9 categories
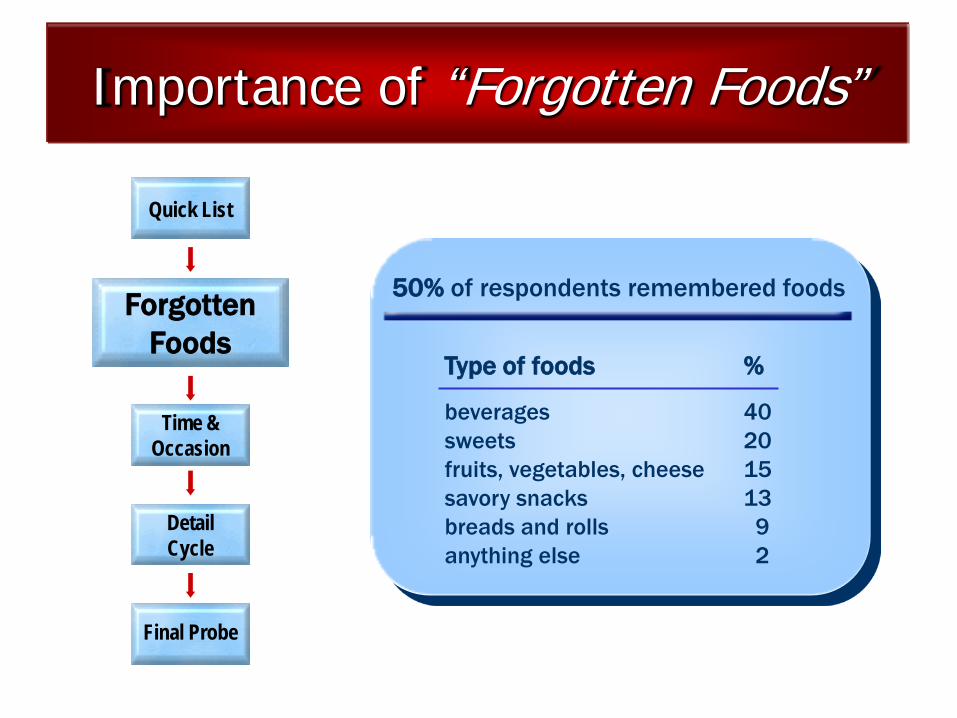
Type of foods %
beverages 40 sweets 20 fruits, vegetables, cheese 15savory snacks 13 breads and rolls 9 anything else 2
ForgottenFoods
50% of respondents remembered foods
Quick List
Time &Occasion
Detail Cycle
Final Probe
Importance of “Forgotten Foods”
Quick ListStep 1
Forgotten FoodsStep 2
Time & OccasionStep 3
Detail CycleStep 4
Final ProbeStep 5
USDA Automated Multiple Pass MethodCollects listing of all foods & beverages
Probes for forgotten food items in 9 categories
Collects for each food & beverageSorts foods into chronological order and
groups foods by eating occasion
Collects description of each food, additions,amount eaten, source, & whether eaten at home
Reviews each occasion and intervals between occasions
Provides final opportunity to recall foods

Quick List
ForgottenFoods
Time &Occasion
Detail Cycle
Final Probe
68
6
3
22
1
78
6
3
13
<1
14
3
11
70
2
(15)
percent
Foods Reported
Energy InterviewLength
(20-30 min.)
Contribution by StepContribution by Step
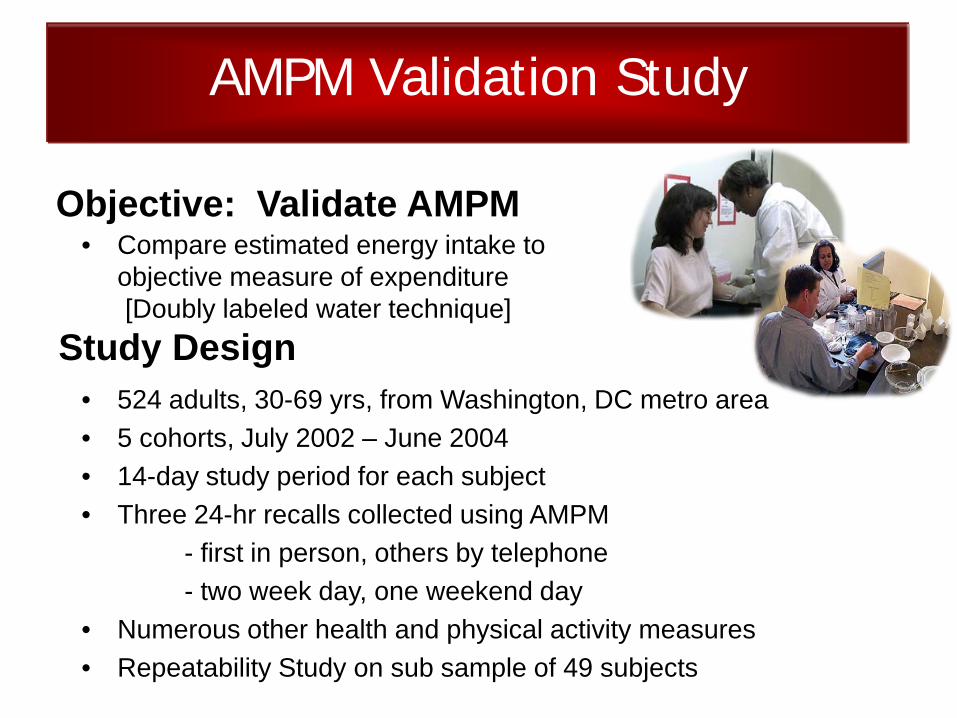
Contribution by StepAMPM Validation Study
• Compare estimated energy intake to objective measure of expenditure [Doubly labeled water technique]
Objective: Validate AMPM
• 524 adults, 30-69 yrs, from Washington, DC metro area• 5 cohorts, July 2002 – June 2004• 14-day study period for each subject• Three 24-hr recalls collected using AMPM
- first in person, others by telephone- two week day, one weekend day
• Numerous other health and physical activity measures• Repeatability Study on sub sample of 49 subjects
Study Design
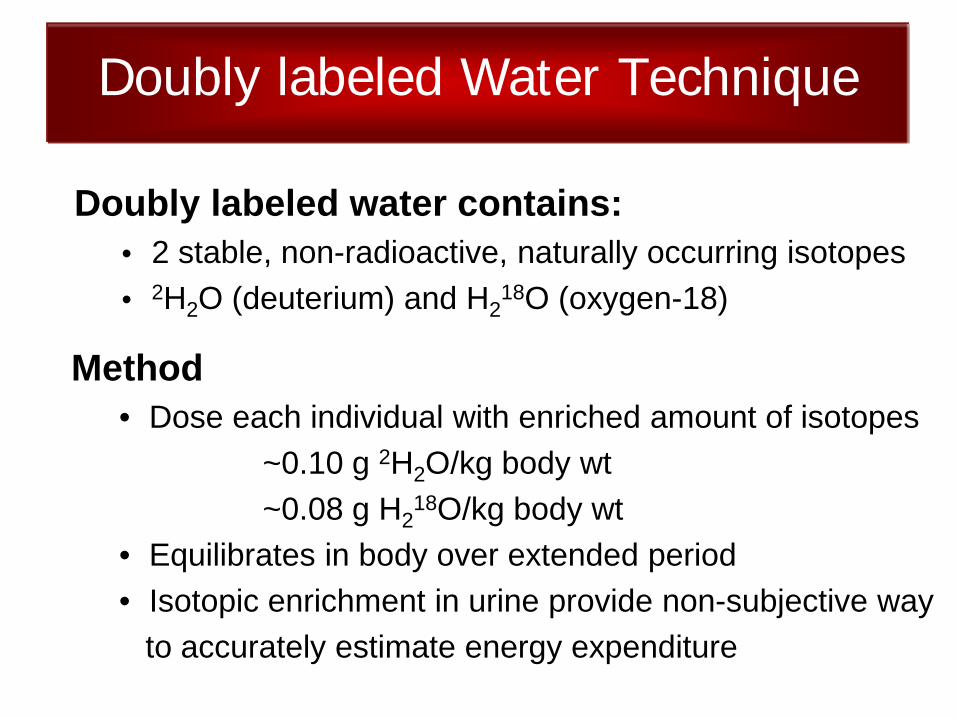
Contribution by StepDoubly labeled Water Technique
Doubly labeled water contains:• 2 stable, non-radioactive, naturally occurring isotopes • 2H2O (deuterium) and H2
18O (oxygen-18)
Method• Dose each individual with enriched amount of isotopes
~0.10 g 2H2O/kg body wt~0.08 g H2
18O/kg body wt• Equilibrates in body over extended period• Isotopic enrichment in urine provide non-subjective way
to accurately estimate energy expenditure
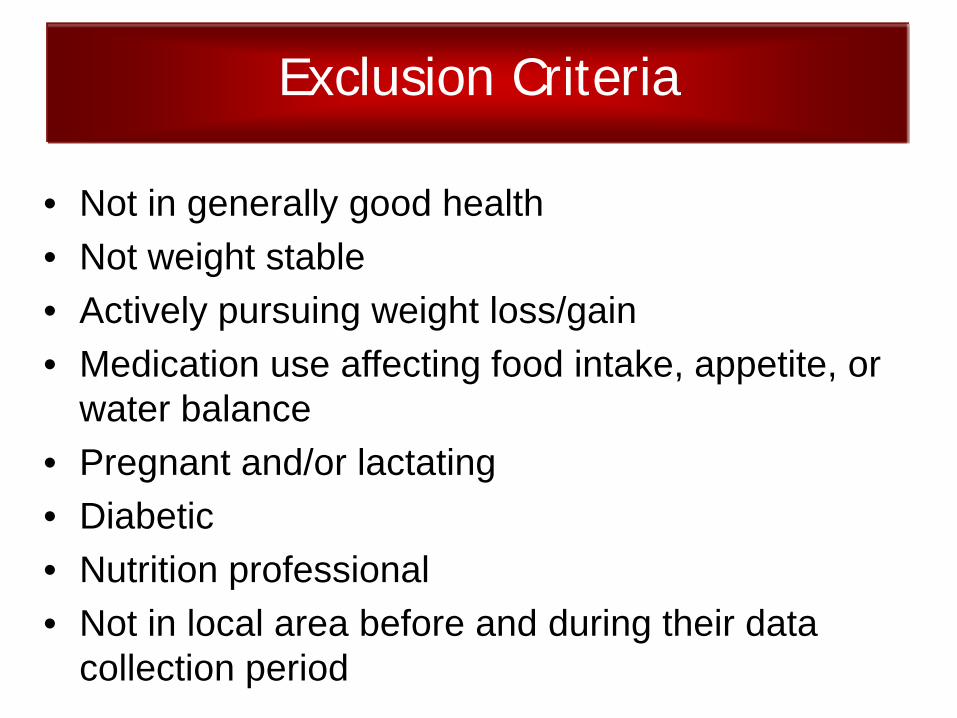
Contribution by StepExclusion Criteria
• Not in generally good health• Not weight stable• Actively pursuing weight loss/gain• Medication use affecting food intake, appetite, or
water balance • Pregnant and/or lactating• Diabetic• Nutrition professional• Not in local area before and during their data
collection period
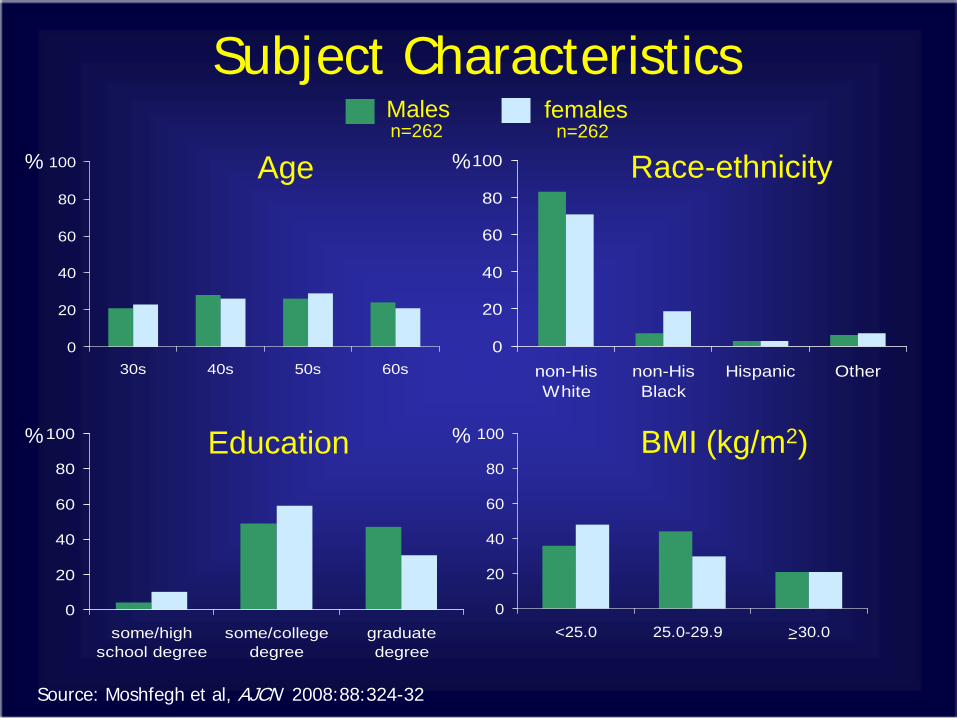
0
20
40
60
80
100
non-HisWhite
non-HisBlack
Hispanic Other
Age Race-ethnicity
0
20
40
60
80
100
30s 40s 50s 60s
0
20
40
60
80
100
some/highschool degree
some/collegedegree
graduatedegree
0
20
40
60
80
100
<25.0 25.0-29.9 >30.0
Education BMI (kg/m2)
Subject CharacteristicsMales females
%
%%
%
Source: Moshfegh et al, AJCN 2008:88:324-32
n=262 n=262

Male FemaleMonday 15 13Tuesday 14 15Wednesday 16 14Thursday 14 16Friday 14 13Saturday 13 15Sunday 15 15
Distribution by Day Of WeekFor Dietary Recalls
Source: Moshfegh et al, AJCN 2008:88:324-32
% %

Mean Daily Measured Energy Intakes by AMPM
0
500
1000
1500
2000
2500
3000
3500
Malesn=262
Femalesn=262
1 32Day
1 32Day
kcal/d
Source: Moshfegh et al, AJCN 2008:88:324-32
Mean daily energy intakes remainedfairly constant across the three recall days.
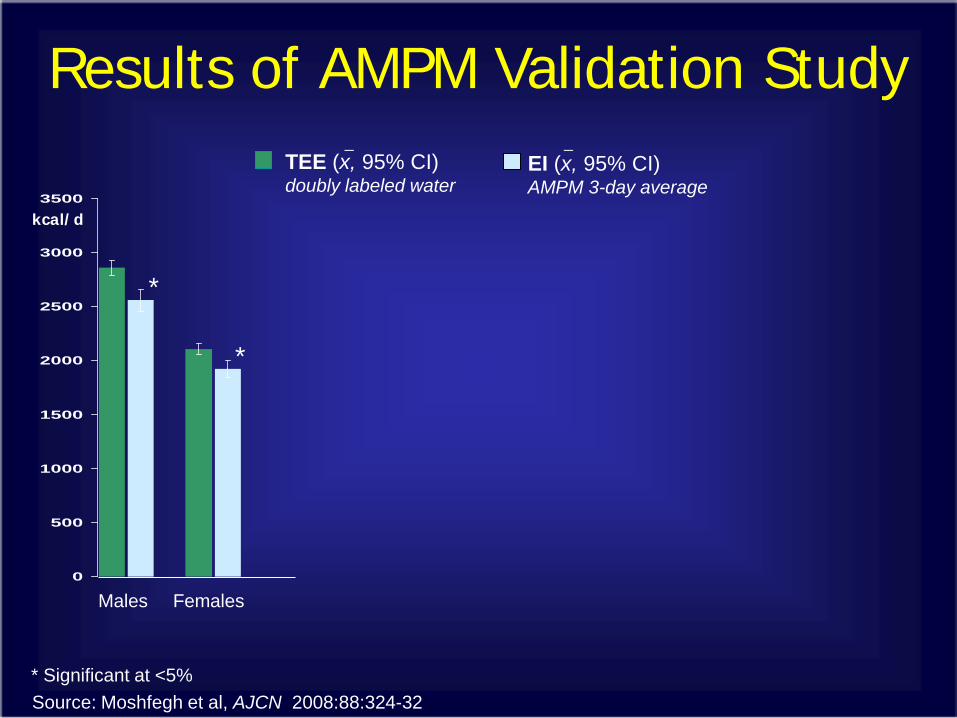
0
500
1000
1500
2000
2500
3000
3500
FemalesMales
Results of AMPM Validation Study
kcal/d
*
*
* Significant at <5%Source: Moshfegh et al, AJCN 2008:88:324-32
TEE (x, 95% CI)doubly labeled water
EI (x, 95% CI)AMPM 3-day average
_ _

0
500
1000
1500
2000
2500
3000
3500
FemalesMales
TEE (x, 95% CI)doubly labeled water
EI (x, 95% CI)AMPM 3-day average
Results of AMPM Validation Study
kcal/d
*
*
* Significant at <5%Source: Moshfegh et al, AJCN 2008:88:324-32
Energy intake was under-reported by: 11% overall<3% for normal weight16% for over weight
FemalesMales FemalesMales FemalesMales
BMI < 25 BMI > 30BMI 25 – 29.9
*
*
*
*
(n=94) (127) (114) (79) (54) (56)
_ _

Males FemalesAllNormal weightOverweightObese
187
1934
22142535
Percent of Low Energy Reporters*
Source: Moshfegh et al, AJCN 2008:88:324-32
*LERs defined as subjects with values below 95% CI of log EI/TEE: <0.72
Contribution by StepAMPM Validation Study Conclusions
• AMPM assessed mean energy intakes within 11% of energy expenditure in a large sample of adults, and
• < 3% in normal-weight subjects.
• Further research is needed to determine what may be contributing to the underreporting observed in overweight and obese subjects.

USDA Dietary Intake Data SystemAutomated Multiple
Pass Method
Post InterviewProcessing System
Survey Net
method for collecting 24-hour dietary recalls
automates food codingformats data from AMPM for Survey Net
supports manual coding, quality review, and nutrient analysis
Food & Nutrient Database for Dietary Studiessupports coding and analysis of food dataFNDDS
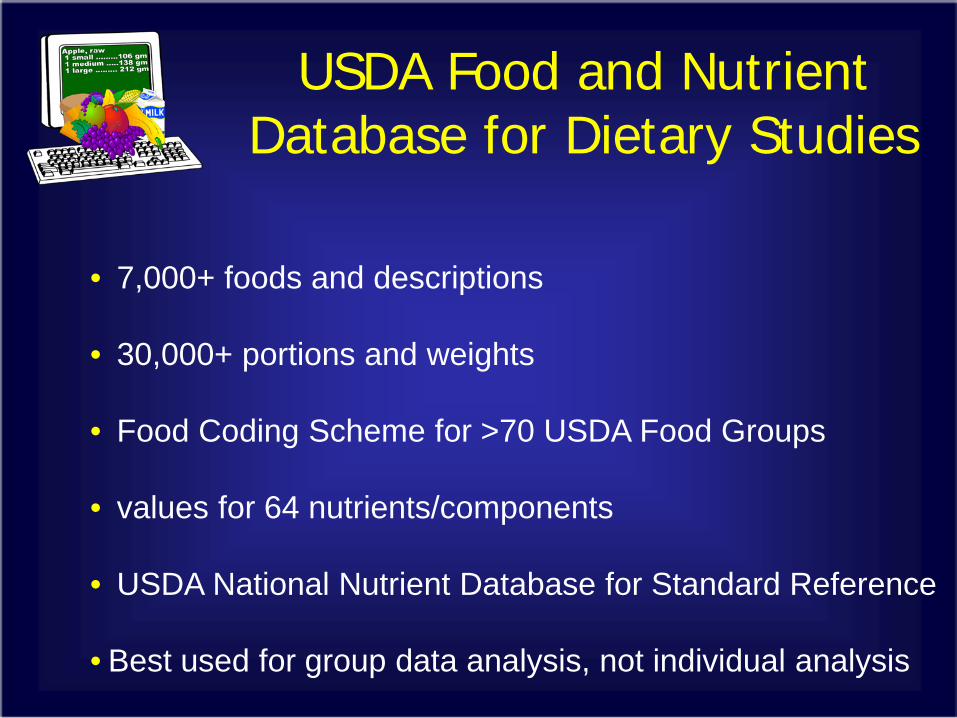
USDA Food and Nutrient Database for Dietary Studies
• 7,000+ foods and descriptions
• 30,000+ portions and weights
• Food Coding Scheme for >70 USDA Food Groups
• values for 64 nutrients/components
• USDA National Nutrient Database for Standard Reference
• Best used for group data analysis, not individual analysis

Contribution by StepSpecial Purpose Databases
• FNDDS foods further defined to support specialized research and policy needs
• MyPyramid Equivalents Database – translates foods in FNDDS into 32 MyPyramid food groups defined by USDA Center for Nutrition Policy and Promotion
• Food Commodity Economic Database – translates foods in FNDDS into 65 food commodities at the retail level defined by USDA Economic Research Service