Embed Size (px)
Citation preview
Alan M. Newman’s Stock Market
CROSSCURRENTS U.S. STOCK MARKET OUTLOOK for DECEMBER 30, 2013
DJIA 16,478 - SPX 1841 - NASDAQ 4156 - GOLD BULLION 1215
THE YEAR AHEAD: WE SEE A MINIMUM 20% CORRECTION IN STOCKS COUPLED WITH A HUGE MOVE IN GOLD AS SEEMINGLY NOTHING GOES RIGHT. WE DETAIL A FEW THINGS THAT CAN GO TERRIBLY WRONG. - NEXT ISSUE - JANUARY 30, 2014 -
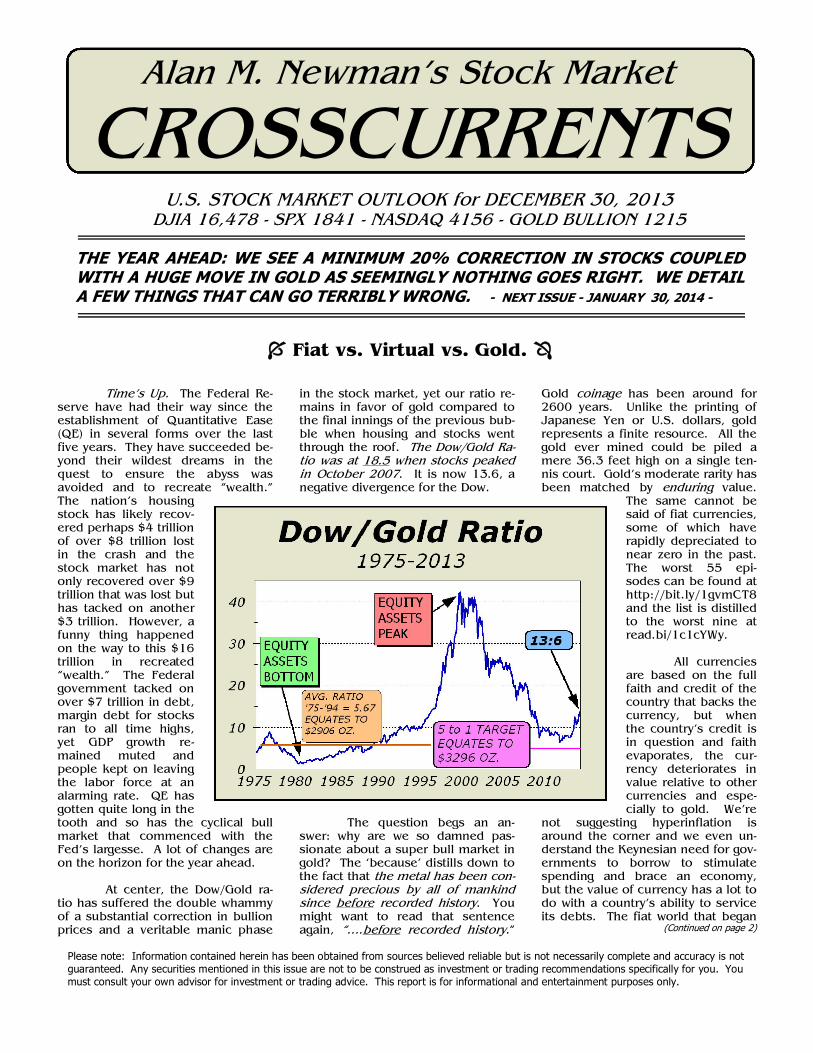
Time’s Up. The Federal Re-serve have had their way since the establishment of Quantitative Ease (QE) in several forms over the last five years. They have succeeded be-yond their wildest dreams in the quest to ensure the abyss was avoided and to recreate “wealth.” The nation’s housing stock has likely recov-ered perhaps $4 trillion of over $8 trillion lost in the crash and the stock market has not only recovered over $9 trillion that was lost but has tacked on another $3 trillion. However, a funny thing happened on the way to this $16 trillion in recreated “wealth.” The Federal government tacked on over $7 trillion in debt, margin debt for stocks ran to all time highs, yet GDP growth re-mained muted and people kept on leaving the labor force at an alarming rate. QE has gotten quite long in the tooth and so has the cyclical bull market that commenced with the Fed’s largesse. A lot of changes are on the horizon for the year ahead. At center, the Dow/Gold ra-tio has suffered the double whammy of a substantial correction in bullion prices and a veritable manic phase
in the stock market, yet our ratio re-mains in favor of gold compared to the final innings of the previous bub-ble when housing and stocks went through the roof. The Dow/Gold Ra-tio was at 18.5 when stocks peaked in October 2007. It is now 13.6, a negative divergence for the Dow.
The question begs an an-swer: why are we so damned pas-sionate about a super bull market in gold? The ‘because’ distills down to the fact that the metal has been con-sidered precious by all of mankind since before recorded history. You might want to read that sentence again, “….before recorded history.”
Gold coinage has been around for 2600 years. Unlike the printing of Japanese Yen or U.S. dollars, gold represents a finite resource. All the gold ever mined could be piled a mere 36.3 feet high on a single ten-nis court. Gold’s moderate rarity has been matched by enduring value.
The same cannot be said of fiat currencies, some of which have rapidly depreciated to near zero in the past. The worst 55 epi-sodes can be found at http://bit.ly/1gvmCT8 and the list is distilled to the worst nine at read.bi/1c1cYWy. All currencies are based on the full faith and credit of the country that backs the currency, but when the country’s credit is in question and faith evaporates, the cur-rency deteriorates in value relative to other currencies and espe-cially to gold. We’re
not suggesting hyperinflation is around the corner and we even un-derstand the Keynesian need for gov-ernments to borrow to stimulate spending and brace an economy, but the value of currency has a lot to do with a country’s ability to service its debts. The fiat world that began
(Continued on page 2)
Fiat vs. Virtual vs. Gold.
Please note: Information contained herein has been obtained from sources believed reliable but is not necessarily complete and accuracy is not guaranteed. Any securities mentioned in this issue are not to be construed as investment or trading recommendations specifically for you. You must consult your own advisor for investment or trading advice. This report is for informational and entertainment purposes only.
THE ODDS HAVE IT
Deflation = 20% Recession Worsens = 30%
Terrorist Event = 10% Derivative Event = 10% Armed Conflict = 15% (will hurt stock prices)
Odds that none of the above will occur = 39%
Odds that at least one will occur = 61% Odds that at least two will occur = 28%
Inflation Surge = 40% (will tend to support stock prices)
CROSSCURRENTS - Commentary - December 30, 2013 - Page 2 (Continued from page 1)
with the Bretton Woods agreement in 1944 has matured into a freakish monster of credit expansion. Vis-à-vis Japan, where the population is declining and is expected to fall by over 25% by 2050, there is virtually no chance of escaping the debt ser-vice trap. For decades, Japan’s an-swer has been to print money. De-spite the most stimulative monetary strategy in history, their stock market remains 61% below a peak regis-tered 24 years ago and GDP growth must remain muted—at best—by the declining population. While the U.S. main-tains an increasing population, current monetary policy adds greatly to long term problems. Simply put, we spend way too much for too little growth. Ian McAvity (http://www.topline-charts.com/Deliberations.htm) posits that although the Fed’s plan to boost the economy “sounds” great, it “hardly ration-alizes the $1 trillion added to the balance sheet” since No-vember 2012. The cost for each job we create works out to $436,000, a luxury that will come back to haunt all those em-ployed with higher taxes to pay the cost. Mr. McAvity also notes that an important demographic has flipped. Whereas population growth domi-nated payroll growth from 1975 to 2000, the “NILF” (not in labor force) category is now rising at double our population growth. McAvity avers this fact is “….a secular shift with years to run as Boomers age.” Frankly, we believe the pros-pects are frightening. By May of 2013, annual debt service for the Federal government was $223 bil-lion. Assuming current plans are fol-lowed, the Congressional Budget of-fice (CBO) forecasts debt service will rise to $764 billion by 2022. Since inflation allows debts to be more easily serviced with cheaper money, the cost of servicing our debt will be
no harder in 2022 only if inflation devalues our currency by an average of 14.65% per annum! Given that much of the eco-nomic progress of the last 30 years worldwide was made possible by an enormous expansion in credit, simi-lar problems are either already in place around the globe or will accel-erate dramatically if the world’s most prolific consumers, those here in the U.S., must adhere to a less affluent stance in the years ahead. While currencies will still compete for at-tention and value, the one constant has been gold bullion. We believe
that this storehouse of value will be more important over time. Could anything go wrong with this theory? Over the last year, Bitcoin has at-tempted to wrest the spotlight away from gold. This virtual currency may even be one of the reasons for gold bullion’s correction following a peak over $1900 per ounce and a one year sideways consolidation. The rapid increase in valuation of all Bit-coins in circulation equated to roughly one-third of the net outflows from gold ETFs. However, we are certain this will not be an ongoing phenomenon. Bitcoin has utility in a virtual world, but as a currency, the only rationale for it to be more valu-able than Paypal is because transac-tion fees are lower. There is nothing else backing a Bitcoin other than its utility to transfer currency.
Since only a finite amount of Bitcoins will ever be “mined,” it is assumed demand will continue to outstrip supply, and increase the value of a Bitcoin. This past year’s move took Bitcoin from $13.45 to as high as $1200 this year. Bitcoins currently trade at $746. The market is volatile and illiquid. Ironically, the finite metric that advances the the-ory of continual increase in value is the same metric that will encourage the creation of other new virtual cur-rencies to meet demand. As well, we note that virtual currencies can suffer huge virtual thefts. The 11 worst of these “heists” (each over
10,000 Bitcoin - see http://bit.ly/18OmLco) equates to $871 million at the 2012 peak valua-tion. Hacking is a growth in-dustry and we can imagine the entire system being infected to the point it is useless. Despite the obvious failings of our Fed-eral Reserve and our legisla-tors, even the full faith and credit of the U.S. is a better alternative. Bullion’s 60% surge into the 2011 peak required a substantial correction and con-
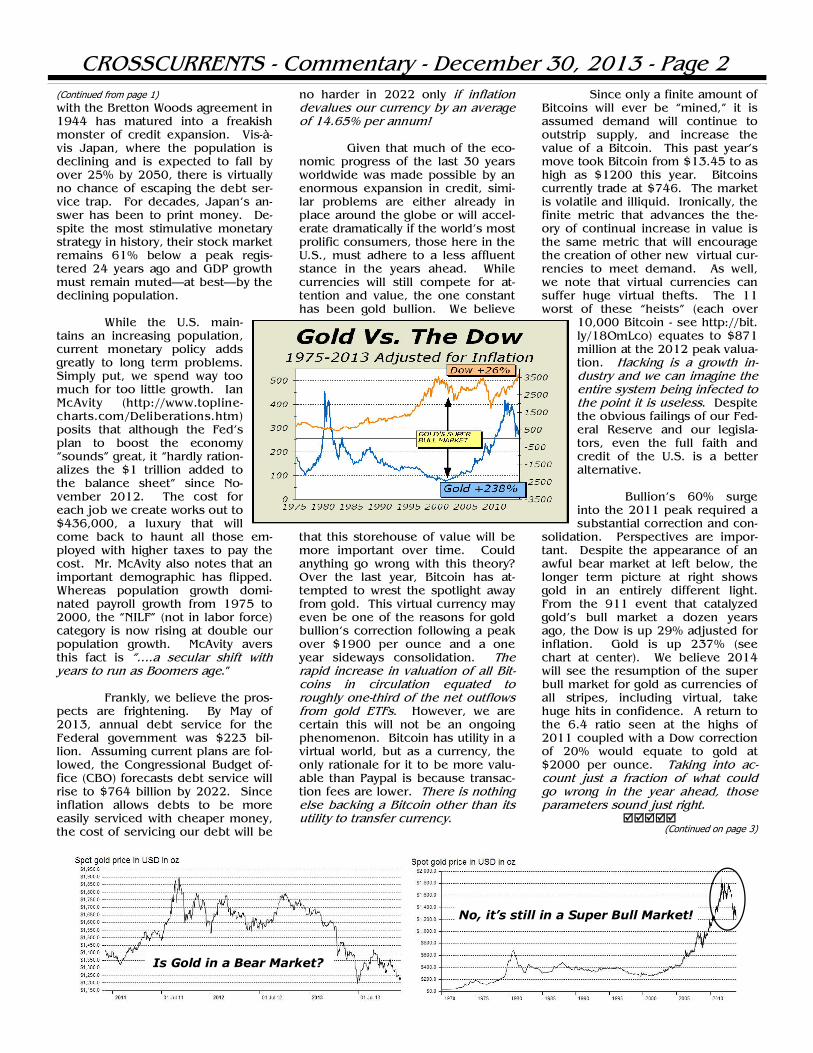
solidation. Perspectives are impor-tant. Despite the appearance of an awful bear market at left below, the longer term picture at right shows gold in an entirely different light. From the 911 event that catalyzed gold’s bull market a dozen years ago, the Dow is up 29% adjusted for inflation. Gold is up 237% (see chart at center). We believe 2014 will see the resumption of the super bull market for gold as currencies of all stripes, including virtual, take huge hits in confidence. A return to the 6.4 ratio seen at the highs of 2011 coupled with a Dow correction of 20% would equate to gold at $2000 per ounce. Taking into ac-count just a fraction of what could go wrong in the year ahead, those parameters sound just right.
(Continued on page 3)
No, it’s still in a Super Bull Market!
Is Gold in a Bear Market?
CROSSCURRENTS - Commentary - December 30, 2013 - Page 3
(Continued from page 2) Buy At Any Price!
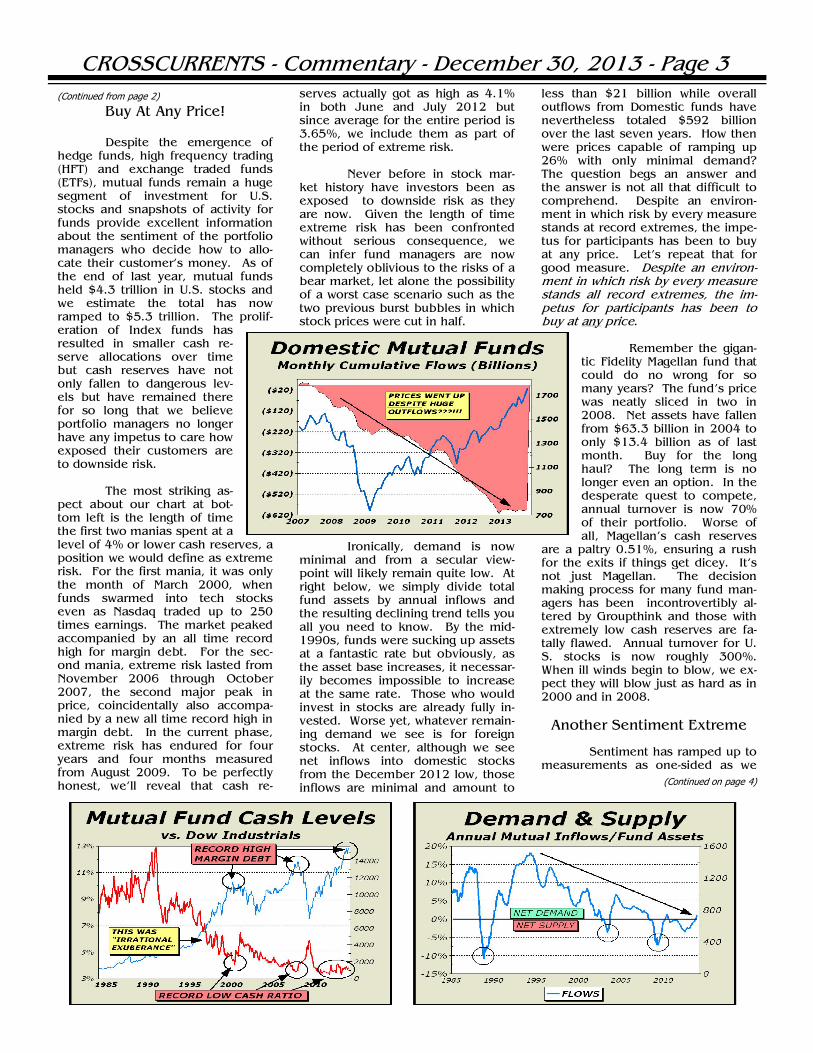
Despite the emergence of hedge funds, high frequency trading (HFT) and exchange traded funds (ETFs), mutual funds remain a huge segment of investment for U.S. stocks and snapshots of activity for funds provide excellent information about the sentiment of the portfolio managers who decide how to allo-cate their customer’s money. As of the end of last year, mutual funds held $4.3 trillion in U.S. stocks and we estimate the total has now ramped to $5.3 trillion. The prolif-eration of Index funds has resulted in smaller cash re-serve allocations over time but cash reserves have not only fallen to dangerous lev-els but have remained there for so long that we believe portfolio managers no longer have any impetus to care how exposed their customers are to downside risk. The most striking as-pect about our chart at bot-tom left is the length of time the first two manias spent at a level of 4% or lower cash reserves, a position we would define as extreme risk. For the first mania, it was only the month of March 2000, when funds swarmed into tech stocks even as Nasdaq traded up to 250 times earnings. The market peaked accompanied by an all time record high for margin debt. For the sec-ond mania, extreme risk lasted from November 2006 through October 2007, the second major peak in price, coincidentally also accompa-nied by a new all time record high in margin debt. In the current phase, extreme risk has endured for four years and four months measured from August 2009. To be perfectly honest, we’ll reveal that cash re-
serves actually got as high as 4.1% in both June and July 2012 but since average for the entire period is 3.65%, we include them as part of the period of extreme risk. Never before in stock mar-ket history have investors been as exposed to downside risk as they are now. Given the length of time extreme risk has been confronted without serious consequence, we can infer fund managers are now completely oblivious to the risks of a bear market, let alone the possibility of a worst case scenario such as the two previous burst bubbles in which stock prices were cut in half.
Ironically, demand is now minimal and from a secular view-point will likely remain quite low. At right below, we simply divide total fund assets by annual inflows and the resulting declining trend tells you all you need to know. By the mid-1990s, funds were sucking up assets at a fantastic rate but obviously, as the asset base increases, it necessar-ily becomes impossible to increase at the same rate. Those who would invest in stocks are already fully in-vested. Worse yet, whatever remain-ing demand we see is for foreign stocks. At center, although we see net inflows into domestic stocks from the December 2012 low, those inflows are minimal and amount to
less than $21 billion while overall outflows from Domestic funds have nevertheless totaled $592 billion over the last seven years. How then were prices capable of ramping up 26% with only minimal demand? The question begs an answer and the answer is not all that difficult to comprehend. Despite an environ-ment in which risk by every measure stands at record extremes, the impe-tus for participants has been to buy at any price. Let’s repeat that for good measure. Despite an environ-ment in which risk by every measure stands all record extremes, the im-petus for participants has been to buy at any price.
Remember the gigan-tic Fidelity Magellan fund that could do no wrong for so many years? The fund’s price was neatly sliced in two in 2008. Net assets have fallen from $63.3 billion in 2004 to only $13.4 billion as of last month. Buy for the long haul? The long term is no longer even an option. In the desperate quest to compete, annual turnover is now 70% of their portfolio. Worse of all, Magellan’s cash reserves
are a paltry 0.51%, ensuring a rush for the exits if things get dicey. It’s not just Magellan. The decision making process for many fund man-agers has been incontrovertibly al-tered by Groupthink and those with extremely low cash reserves are fa-tally flawed. Annual turnover for U.S. stocks is now roughly 300%. When ill winds begin to blow, we ex-pect they will blow just as hard as in 2000 and in 2008.
Another Sentiment Extreme Sentiment has ramped up to measurements as one-sided as we
(Continued on page 4)
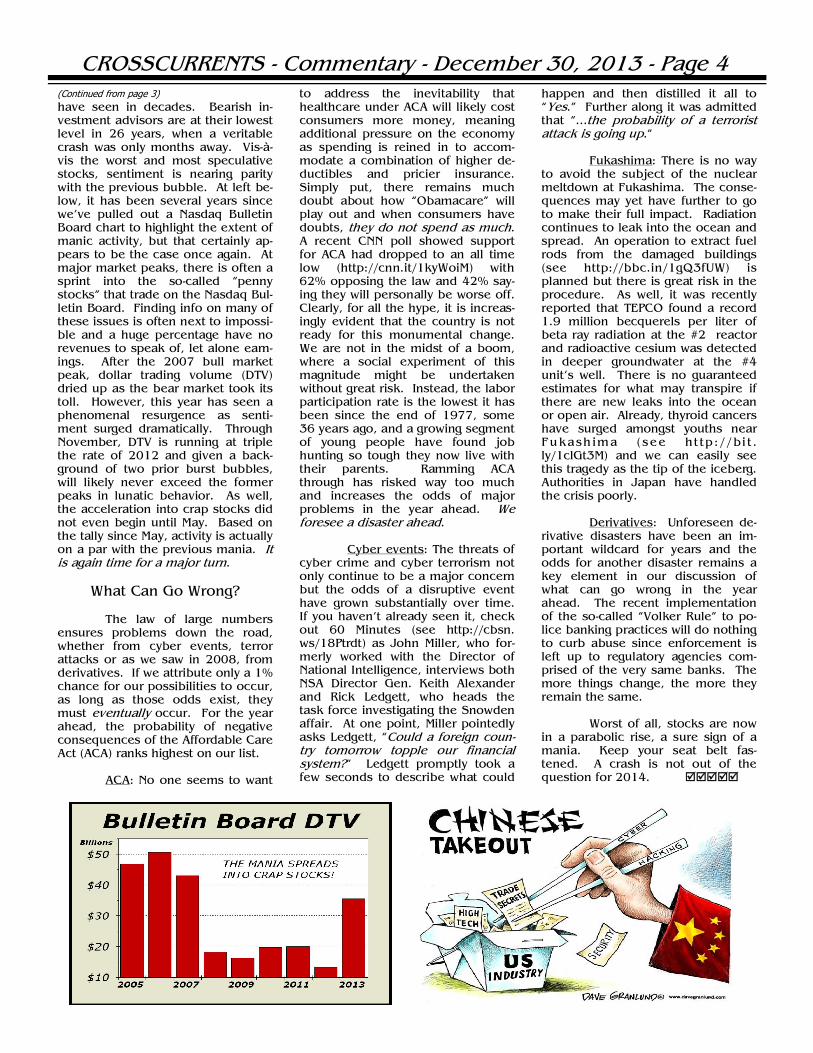
CROSSCURRENTS - Commentary - December 30, 2013 - Page 4 (Continued from page 3) have seen in decades. Bearish in-vestment advisors are at their lowest level in 26 years, when a veritable crash was only months away. Vis-à-vis the worst and most speculative stocks, sentiment is nearing parity with the previous bubble. At left be-low, it has been several years since we’ve pulled out a Nasdaq Bulletin Board chart to highlight the extent of manic activity, but that certainly ap-pears to be the case once again. At major market peaks, there is often a sprint into the so-called “penny stocks” that trade on the Nasdaq Bul-letin Board. Finding info on many of these issues is often next to impossi-ble and a huge percentage have no revenues to speak of, let alone earn-ings. After the 2007 bull market peak, dollar trading volume (DTV) dried up as the bear market took its toll. However, this year has seen a phenomenal resurgence as senti-ment surged dramatically. Through November, DTV is running at triple the rate of 2012 and given a back-ground of two prior burst bubbles, will likely never exceed the former peaks in lunatic behavior. As well, the acceleration into crap stocks did not even begin until May. Based on the tally since May, activity is actually on a par with the previous mania. It is again time for a major turn.
What Can Go Wrong?
The law of large numbers ensures problems down the road, whether from cyber events, terror attacks or as we saw in 2008, from derivatives. If we attribute only a 1% chance for our possibilities to occur, as long as those odds exist, they must eventually occur. For the year ahead, the probability of negative consequences of the Affordable Care Act (ACA) ranks highest on our list. ACA: No one seems to want
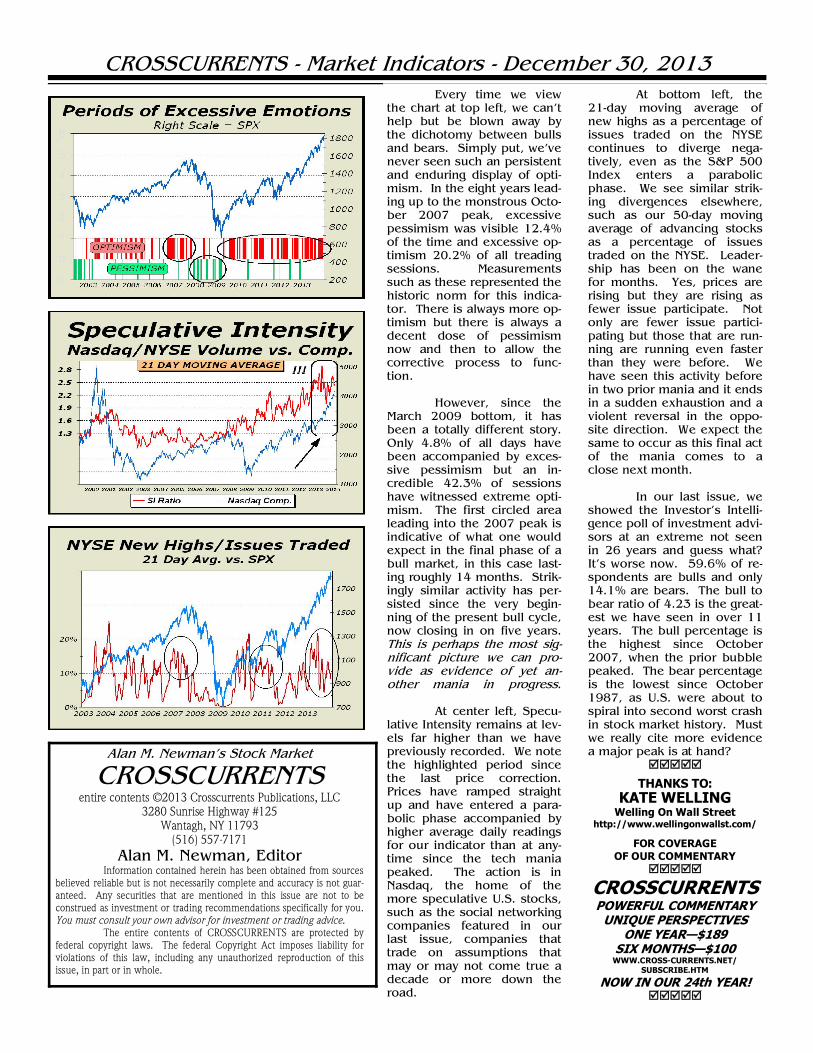
to address the inevitability that healthcare under ACA will likely cost consumers more money, meaning additional pressure on the economy as spending is reined in to accom-modate a combination of higher de-ductibles and pricier insurance. Simply put, there remains much doubt about how “Obamacare” will play out and when consumers have doubts, they do not spend as much. A recent CNN poll showed support for ACA had dropped to an all time low (http://cnn.it/1kyWoiM) with 62% opposing the law and 42% say-ing they will personally be worse off. Clearly, for all the hype, it is increas-ingly evident that the country is not ready for this monumental change. We are not in the midst of a boom, where a social experiment of this magnitude might be undertaken without great risk. Instead, the labor participation rate is the lowest it has been since the end of 1977, some 36 years ago, and a growing segment of young people have found job hunting so tough they now live with their parents. Ramming ACA through has risked way too much and increases the odds of major problems in the year ahead. We foresee a disaster ahead. Cyber events: The threats of cyber crime and cyber terrorism not only continue to be a major concern but the odds of a disruptive event have grown substantially over time. If you haven’t already seen it, check out 60 Minutes (see http://cbsn.ws/18Ptrdt) as John Miller, who for-merly worked with the Director of National Intelligence, interviews both NSA Director Gen. Keith Alexander and Rick Ledgett, who heads the task force investigating the Snowden affair. At one point, Miller pointedly asks Ledgett, “Could a foreign coun-try tomorrow topple our financial system?” Ledgett promptly took a few seconds to describe what could
happen and then distilled it all to “Yes.” Further along it was admitted that “...the probability of a terrorist attack is going up.” Fukashima: There is no way to avoid the subject of the nuclear meltdown at Fukashima. The conse-quences may yet have further to go to make their full impact. Radiation continues to leak into the ocean and spread. An operation to extract fuel rods from the damaged buildings (see http://bbc.in/1gQ3fUW) is planned but there is great risk in the procedure. As well, it was recently reported that TEPCO found a record 1.9 million becquerels per liter of beta ray radiation at the #2 reactor and radioactive cesium was detected in deeper groundwater at the #4 unit’s well. There is no guaranteed estimates for what may transpire if there are new leaks into the ocean or open air. Already, thyroid cancers have surged amongst youths near Fukash ima (see ht tp : / /bi t .ly/1clGt3M) and we can easily see this tragedy as the tip of the iceberg. Authorities in Japan have handled the crisis poorly. Derivatives: Unforeseen de-rivative disasters have been an im-portant wildcard for years and the odds for another disaster remains a key element in our discussion of what can go wrong in the year ahead. The recent implementation of the so-called “Volker Rule” to po-lice banking practices will do nothing to curb abuse since enforcement is left up to regulatory agencies com-prised of the very same banks. The more things change, the more they remain the same. Worst of all, stocks are now in a parabolic rise, a sure sign of a mania. Keep your seat belt fas-tened. A crash is not out of the question for 2014.
CROSSCURRENTS - Market Indicators - December 30, 2013
Alan M. Newman’s Stock Market
CROSSCURRENTS entire contents ©2013 Crosscurrents Publications, LLC
3280 Sunrise Highway #125 Wantagh, NY 11793
(516) 557-7171
Alan M. Newman, Editor Information contained herein has been obtained from sources believed reliable but is not necessarily complete and accuracy is not guar-anteed. Any securities that are mentioned in this issue are not to be construed as investment or trading recommendations specifically for you. You must consult your own advisor for investment or trading advice. The entire contents of CROSSCURRENTS are protected by federal copyright laws. The federal Copyright Act imposes liability for violations of this law, including any unauthorized reproduction of this issue, in part or in whole.
Every time we view the chart at top left, we can’t help but be blown away by the dichotomy between bulls and bears. Simply put, we’ve never seen such an persistent and enduring display of opti-mism. In the eight years lead-ing up to the monstrous Octo-ber 2007 peak, excessive pessimism was visible 12.4% of the time and excessive op-timism 20.2% of all treading sessions. Measurements such as these represented the historic norm for this indica-tor. There is always more op-timism but there is always a decent dose of pessimism now and then to allow the corrective process to func-tion. However, since the March 2009 bottom, it has been a totally different story. Only 4.8% of all days have been accompanied by exces-sive pessimism but an in-credible 42.3% of sessions have witnessed extreme opti-mism. The first circled area leading into the 2007 peak is indicative of what one would expect in the final phase of a bull market, in this case last-ing roughly 14 months. Strik-ingly similar activity has per-sisted since the very begin-ning of the present bull cycle, now closing in on five years. This is perhaps the most sig-nificant picture we can pro-vide as evidence of yet an-other mania in progress. At center left, Specu-lative Intensity remains at lev-els far higher than we have previously recorded. We note the highlighted period since the last price correction. Prices have ramped straight up and have entered a para-bolic phase accompanied by higher average daily readings for our indicator than at any-time since the tech mania peaked. The action is in Nasdaq, the home of the more speculative U.S. stocks, such as the social networking companies featured in our last issue, companies that trade on assumptions that may or may not come true a decade or more down the road.
At bottom left, the 21-day moving average of new highs as a percentage of issues traded on the NYSE continues to diverge nega-tively, even as the S&P 500 Index enters a parabolic phase. We see similar strik-ing divergences elsewhere, such as our 50-day moving average of advancing stocks as a percentage of issues traded on the NYSE. Leader-ship has been on the wane for months. Yes, prices are rising but they are rising as fewer issue participate. Not only are fewer issue partici-pating but those that are run-ning are running even faster than they were before. We have seen this activity before in two prior mania and it ends in a sudden exhaustion and a violent reversal in the oppo-site direction. We expect the same to occur as this final act of the mania comes to a close next month. In our last issue, we showed the Investor’s Intelli-gence poll of investment advi-sors at an extreme not seen in 26 years and guess what? It’s worse now. 59.6% of re-spondents are bulls and only 14.1% are bears. The bull to bear ratio of 4.23 is the great-est we have seen in over 11 years. The bull percentage is the highest since October 2007, when the prior bubble peaked. The bear percentage is the lowest since October 1987, as U.S. were about to spiral into second worst crash in stock market history. Must we really cite more evidence a major peak is at hand?
THANKS TO:
KATE WELLING Welling On Wall Street
http://www.wellingonwallst.com/
FOR COVERAGE OF OUR COMMENTARY
CROSSCURRENTS POWERFUL COMMENTARY
UNIQUE PERSPECTIVES ONE YEAR—$189
SIX MONTHS—$100 WWW.CROSS-CURRENTS.NET/
SUBSCRIBE.HTM
NOW IN OUR 24th YEAR!
CROSSCURRENTS - The Month Ahead - December 30, 2013
FAIR WARNING & DISCLAIMER: The publisher of this newsletter and one or more of its affiliated persons and entities may have positions in the securities or sectors referenced in this newsletter and may therefore have a conflict of interest in any issues mentioned herein. For example, if an affiliate has an existing long position in a security that this newsletter sug-gests for a long position, the buying activity that recommendation generates may cause the price of such securities to rise, potentially allowing the affiliate to exit the position at a profit. Any securities mentioned in this issue are not to be construed as investment or trading recommendations specifically for you. You must consult your own advisor for investment or trading advice.
The Psychology of the Market Invest. Intelligence: 3 Week Bull/Bear Ratio 4.1 Mania!
Rydex Assets: Bull & Sector/Bear Ratio: 16.0 Mania! Mutual Funds: 3.8% cash: Excessive Optimism
Crosscurrents Emotion Based Indicators:
Excessive Optimism
Short to Intermediate Term
AS EXPECTED, A BLOWOFF PHASE IS UNDER-WAY. STRAIGHT UP MOVE CAN LAST AN-OTHER WEEK OR TWO BEFORE EXHAUSTION TAKES OVER AND A VIOLENT REVERSAL COM-MENCES.
Current Support/Target Levels SHORT TERM DOW SUPPORT 16,174 (-1.8%)
DOW BREAKS BELOW 15,703 (-4.7%) FIRST CORRECTION TARGET 14,719 (-10.7%)
BEAR MARKET TARGET 12,471 (-24.3%) ————–
OUTLOOK FOR 2014 IS HUGELY NEGATIVE A STOCK MARKET CRASH IS POSSIBLE
Spotlighted in the last issue: Both TGT and BBY, featured in our last issue as short candidates, are nominally lower. TGT broke a tad below our “line drawn in the sand” and closed below on three days and is desperately attempting to remain above water. Both issues still show signs of deterioration but the market’s overall strength remains the most important factor. They remain short candidates.
Crosscurrents ‘13 Investment Stance Newmont Mining (NEM) 15% LONG
Global X Gold Explorers ETF (GLDX) 5% LONG Eldorado Gold (Ego) 5% LONG
PetroBras (PBR) 5% LONG Goldcorp (GG) 5% LONG
35% LONG (30% GOLD)
Powershares QQQ Trust (QQQ) 10% SHORT We intend to close out the QQQ hedge as soon as practical.
- Rationales & Targets -
How can we not mention the retail sector again? In the last issue, we claimed there was “an overwhelming amount of confidence” in the con-sumer’s ability to ratchet up GDP and it appears we were on the right track. Much of recent GDP gains have been inventory related and Mr. & Mrs. John Doe do not seem to spending as anticipated on holiday gifts. Despite an-other 2.4% upside for the S&P 500 in December, the Market Vectors Retail ETF (RTH) has fallen 4% after spending virtually the entire year way ahead of the major indexes. A significant change in trading character for a major sector often portends a change in trend for the market is on the horizon. At right, our Psychology of the Market section categorizes two of the four indicators as “Mania!” The appellations are of course, purely sub-jective, but we thought carefully before penning the label. While it can al-ways get a bit worse, like Investment Advisory bulls at 60% and bears at 10%, or funds with even a lower percentage of assets as cash, there are never boundaries set in stone; it’s always about an observer’s feel for what is at work in creating price. What we see—worse than we saw before in 1972, 1987, 2000 and in 2007—is a zero decision market. In a one deci-sion environment, at least price is a consideration. Today, it’s buy at any price. How high can prices go? If the parabola continues, perhaps another week to ten days. With a brief timeout, perhaps two to three weeks. We’re rapidly closing in on another historic peak for stocks.
Listen to our December 6th interview with Ike Iossif of Aegean Capital
http://marketviews.tv/paidservices/guests/other/audio/newman.asx
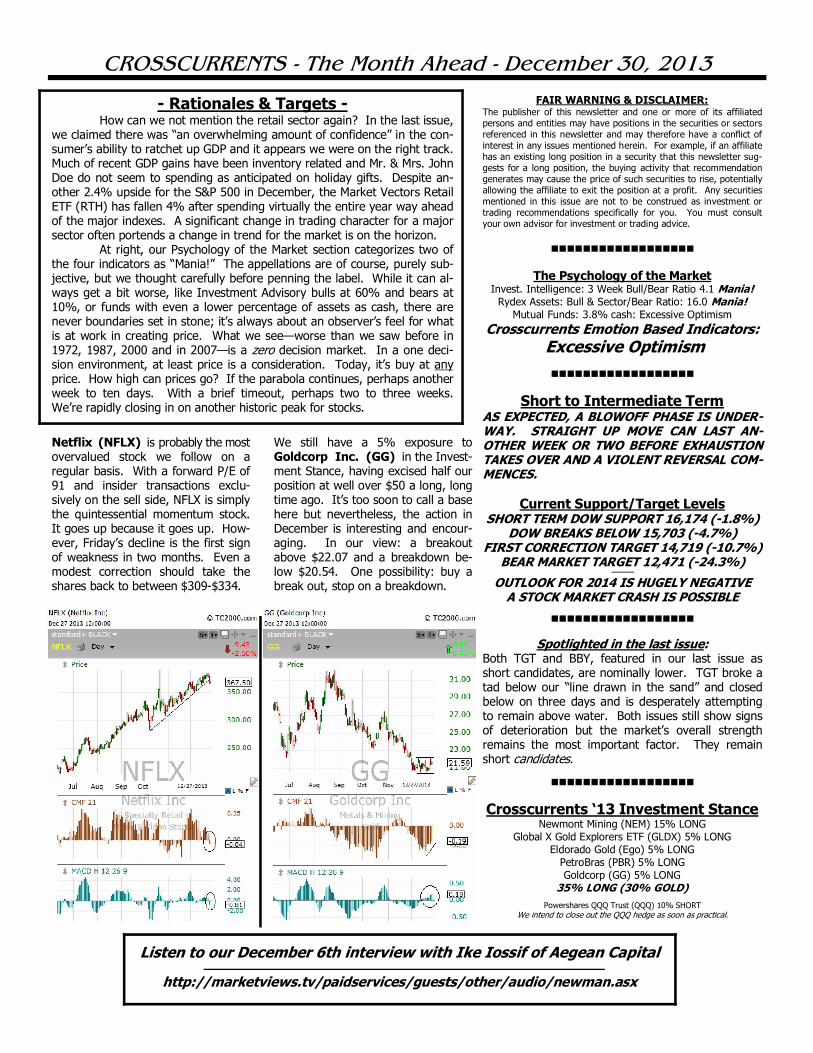
Netflix (NFLX) is probably the most overvalued stock we follow on a regular basis. With a forward P/E of 91 and insider transactions exclu-sively on the sell side, NFLX is simply the quintessential momentum stock. It goes up because it goes up. How-ever, Friday’s decline is the first sign of weakness in two months. Even a modest correction should take the shares back to between $309-$334.
We still have a 5% exposure to Goldcorp Inc. (GG) in the Invest-ment Stance, having excised half our position at well over $50 a long, long time ago. It’s too soon to call a base here but nevertheless, the action in December is interesting and encour-aging. In our view: a breakout above $22.07 and a breakdown be-low $20.54. One possibility: buy a break out, stop on a breakdown.