Embed Size (px)
Citation preview
Alabama Transportation by the Numbers
MEETING THE STATE’S NEED FOR
SAFE, SMOOTH AND EFFICIENT MOBILITY
FEBRUARY 2019
TRIPNET.ORG
Founded in 1971, TRIP ® of Washington, DC, is a nonprofit organization that researches, evaluates and
distributes economic and technical data on surface transportation issues. TRIP is sponsored by insurance
companies, equipment manufacturers, distributors and suppliers; businesses involved in highway and
transit engineering and construction; labor unions; and organizations concerned with efficient and safe
surface transportation.
1
ALABAMA KEY TRANSPORTATION FACTS
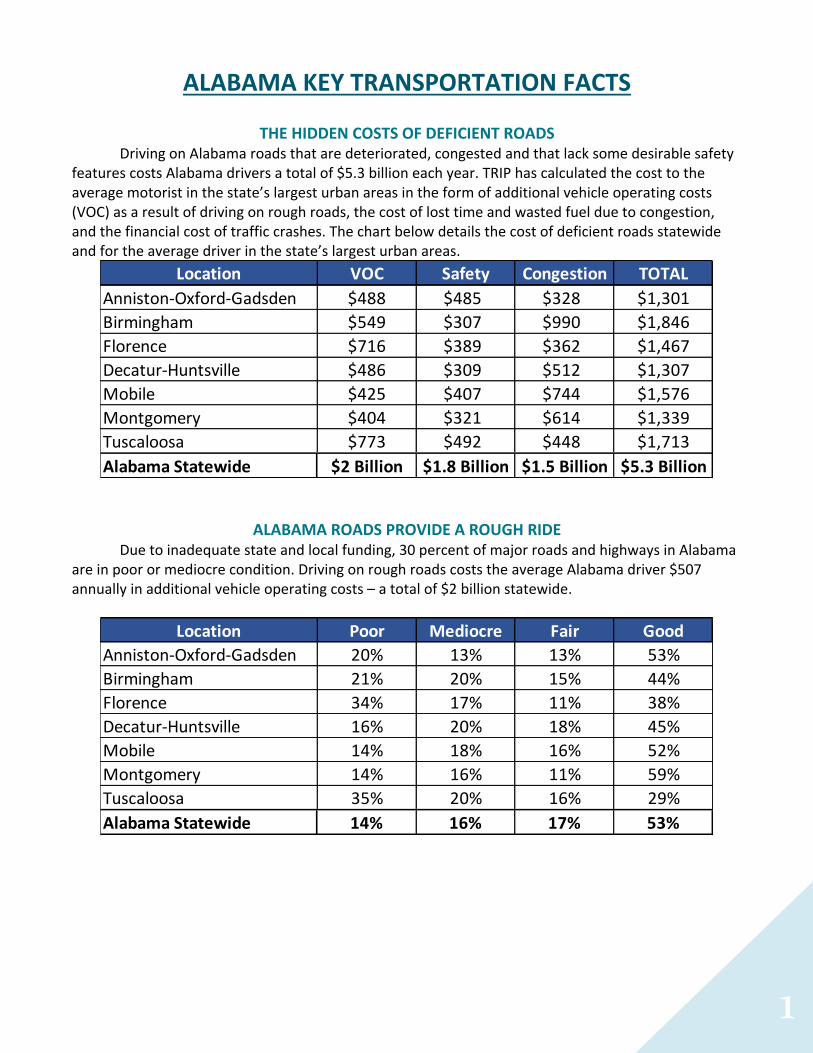
THE HIDDEN COSTS OF DEFICIENT ROADS
Driving on Alabama roads that are deteriorated, congested and that lack some desirable safety features costs Alabama drivers a total of $5.3 billion each year. TRIP has calculated the cost to the average motorist in the state’s largest urban areas in the form of additional vehicle operating costs (VOC) as a result of driving on rough roads, the cost of lost time and wasted fuel due to congestion, and the financial cost of traffic crashes. The chart below details the cost of deficient roads statewide and for the average driver in the state’s largest urban areas.
ALABAMA ROADS PROVIDE A ROUGH RIDE Due to inadequate state and local funding, 30 percent of major roads and highways in Alabama
are in poor or mediocre condition. Driving on rough roads costs the average Alabama driver $507 annually in additional vehicle operating costs – a total of $2 billion statewide.
Location VOC Safety Congestion TOTAL
Anniston-Oxford-Gadsden $488 $485 $328 $1,301
Birmingham $549 $307 $990 $1,846
Florence $716 $389 $362 $1,467
Decatur-Huntsville $486 $309 $512 $1,307
Mobile $425 $407 $744 $1,576
Montgomery $404 $321 $614 $1,339
Tuscaloosa $773 $492 $448 $1,713
Alabama Statewide $2 Billion $1.8 Billion $1.5 Billion $5.3 Billion
Location Poor Mediocre Fair Good
Anniston-Oxford-Gadsden 20% 13% 13% 53%
Birmingham 21% 20% 15% 44%
Florence 34% 17% 11% 38%
Decatur-Huntsville 16% 20% 18% 45%
Mobile 14% 18% 16% 52%
Montgomery 14% 16% 11% 59%
Tuscaloosa 35% 20% 16% 29%
Alabama Statewide 14% 16% 17% 53%
2
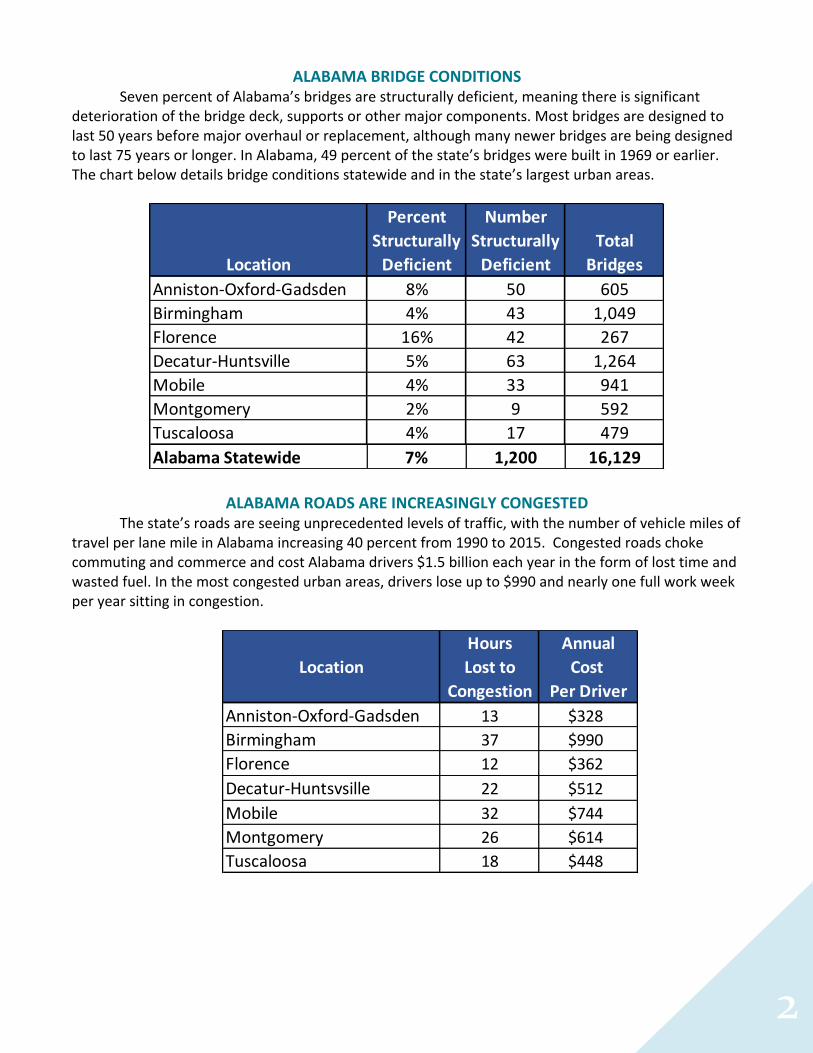
ALABAMA BRIDGE CONDITIONS Seven percent of Alabama’s bridges are structurally deficient, meaning there is significant
deterioration of the bridge deck, supports or other major components. Most bridges are designed to last 50 years before major overhaul or replacement, although many newer bridges are being designed to last 75 years or longer. In Alabama, 49 percent of the state’s bridges were built in 1969 or earlier. The chart below details bridge conditions statewide and in the state’s largest urban areas.
ALABAMA ROADS ARE INCREASINGLY CONGESTED The state’s roads are seeing unprecedented levels of traffic, with the number of vehicle miles of
travel per lane mile in Alabama increasing 40 percent from 1990 to 2015. Congested roads choke commuting and commerce and cost Alabama drivers $1.5 billion each year in the form of lost time and wasted fuel. In the most congested urban areas, drivers lose up to $990 and nearly one full work week per year sitting in congestion.
Percent Number
Structurally Structurally Total
Location Deficient Deficient Bridges
Anniston-Oxford-Gadsden 8% 50 605
Birmingham 4% 43 1,049
Florence 16% 42 267
Decatur-Huntsville 5% 63 1,264
Mobile 4% 33 941
Montgomery 2% 9 592
Tuscaloosa 4% 17 479
Alabama Statewide 7% 1,200 16,129
Hours Annual
Location Lost to Cost
Congestion Per Driver
Anniston-Oxford-Gadsden 13 $328
Birmingham 37 $990
Florence 12 $362
Decatur-Huntsvsille 22 $512
Mobile 32 $744
Montgomery 26 $614
Tuscaloosa 18 $448
3
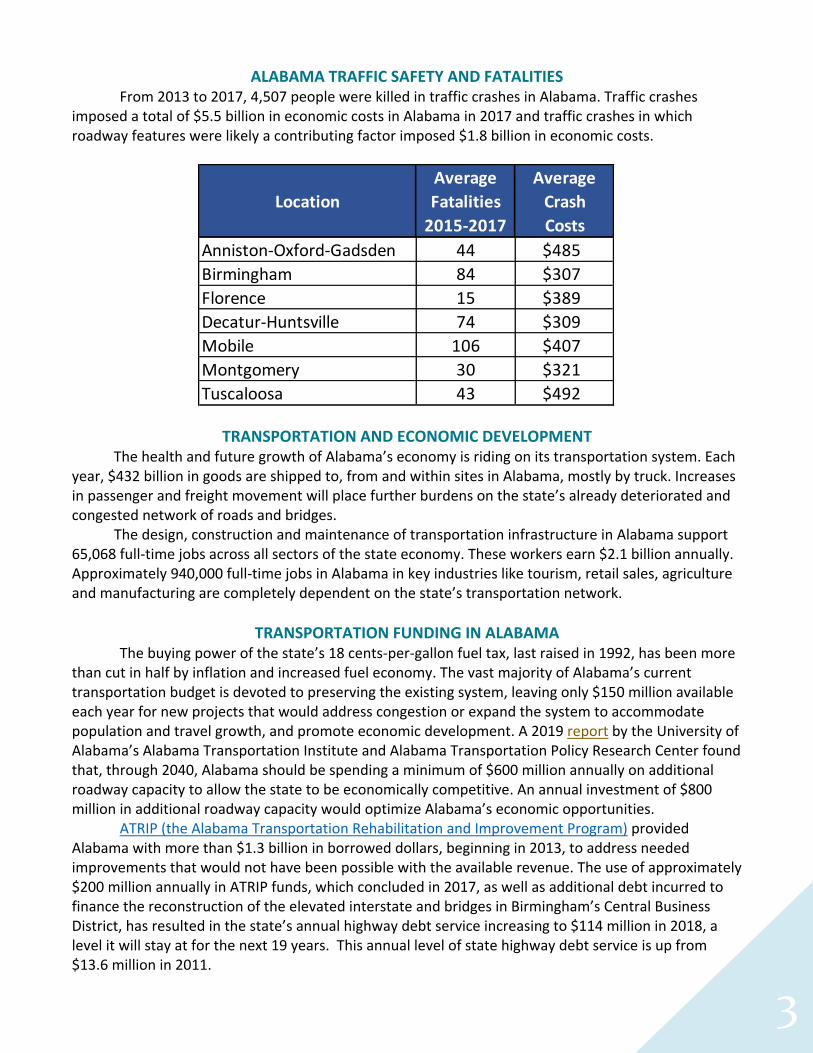
ALABAMA TRAFFIC SAFETY AND FATALITIES From 2013 to 2017, 4,507 people were killed in traffic crashes in Alabama. Traffic crashes
imposed a total of $5.5 billion in economic costs in Alabama in 2017 and traffic crashes in which roadway features were likely a contributing factor imposed $1.8 billion in economic costs.
TRANSPORTATION AND ECONOMIC DEVELOPMENT The health and future growth of Alabama’s economy is riding on its transportation system. Each
year, $432 billion in goods are shipped to, from and within sites in Alabama, mostly by truck. Increases in passenger and freight movement will place further burdens on the state’s already deteriorated and congested network of roads and bridges.
The design, construction and maintenance of transportation infrastructure in Alabama support 65,068 full-time jobs across all sectors of the state economy. These workers earn $2.1 billion annually. Approximately 940,000 full-time jobs in Alabama in key industries like tourism, retail sales, agriculture and manufacturing are completely dependent on the state’s transportation network.
TRANSPORTATION FUNDING IN ALABAMA The buying power of the state’s 18 cents-per-gallon fuel tax, last raised in 1992, has been more than cut in half by inflation and increased fuel economy. The vast majority of Alabama’s current transportation budget is devoted to preserving the existing system, leaving only $150 million available each year for new projects that would address congestion or expand the system to accommodate population and travel growth, and promote economic development. A 2019 report by the University of Alabama’s Alabama Transportation Institute and Alabama Transportation Policy Research Center found that, through 2040, Alabama should be spending a minimum of $600 million annually on additional roadway capacity to allow the state to be economically competitive. An annual investment of $800 million in additional roadway capacity would optimize Alabama’s economic opportunities.
ATRIP (the Alabama Transportation Rehabilitation and Improvement Program) provided Alabama with more than $1.3 billion in borrowed dollars, beginning in 2013, to address needed improvements that would not have been possible with the available revenue. The use of approximately $200 million annually in ATRIP funds, which concluded in 2017, as well as additional debt incurred to finance the reconstruction of the elevated interstate and bridges in Birmingham’s Central Business District, has resulted in the state’s annual highway debt service increasing to $114 million in 2018, a level it will stay at for the next 19 years. This annual level of state highway debt service is up from $13.6 million in 2011.
Average Average
Location Fatalities Crash
2015-2017 Costs
Anniston-Oxford-Gadsden 44 $485
Birmingham 84 $307
Florence 15 $389
Decatur-Huntsville 74 $309
Mobile 106 $407
Montgomery 30 $321
Tuscaloosa 43 $492
4
INTRODUCTION
Alabama’s roads, highways and bridges form vital transportation links for the state’s residents,
visitors and businesses, providing daily access to homes, jobs, shopping, natural resources and
recreation. Modernizing Alabama’s transportation system is critical to quality of life and economic
competitiveness in the Yellowhammer State. Inadequate transportation investment, which will result
in deteriorated transportation facilities and diminished access, will negatively affect Alabama’s
economic competitiveness and quality of life.
To accommodate population and economic growth, maintain its level of economic
competitiveness and achieve further economic growth, Alabama will need to maintain and modernize
its roads, highways and bridges by improving the physical condition of its transportation network and
enhancing the system’s ability to provide efficient, reliable and safe mobility for residents, visitors and
businesses. Making needed improvements to Alabama’s roads, highways, bridges and transit systems
could also provide a significant boost to the state’s economy by creating jobs in the short term and
stimulating long-term economic growth as a result of enhanced mobility and access.
This report examines the condition, use and safety of Alabama’s roads, highways and bridges,
and the state’s future mobility needs. Sources of information for this report include the Federal
Highway Administration (FHWA), the American Association of State Highway and Transportation
Officials (AASHTO), the Bureau of Transportation Statistics (BTS), the U.S. Census Bureau, the Texas
Transportation Institute (TTI), the American Road & Transportation Builders Association (ARTBA), the
National Highway Traffic Safety Administration (NHTSA), and the Public Affairs Research Council of
Alabama (PARC).
In addition to the statewide report, TRIP has also prepared regional reports for the Anniston-
Oxford-Gadsden, Birmingham, Florence, Decatur-Huntsville, Mobile, Montgomery and Tuscaloosa
urban areas. An urban area is defined as a region’s municipalities and surrounding suburbs for
pavement condition and congestion data; bridge and traffic fatality data include a region’s major
counties.1
POPULATION, TRAVEL AND ECONOMIC TRENDS IN ALABAMA
Alabama motorists and businesses require a high level of personal and commercial mobility. To
foster quality of life and spur continued economic growth, it is critical that the state provide a safe and
5
modern transportation system that can accommodate future growth in population, tourism, business,
recreation and vehicle travel.
Alabama’s population grew to approximately 4.9 million residents in 2018, a 10 percent
increase since 2000.2 Alabama had approximately 3.9 million licensed drivers in 2016.3 From 2000 to
2017, Alabama’s gross domestic product (GDP), a measure of the state’s economic output, increased
by 23 percent, when adjusted for inflation.4 U.S. GDP increased 37 percent during the same period.5 In
2017, the state’s transportation system carried 70.7 billion annual vehicle miles of travel (VMT), a 25
percent increase since 2000, and an increase of nine percent since 2013.6
CONDITION OF ALABAMA ROADS
The life cycle of Alabama’s roads is greatly affected by the state and local governments’ ability
to perform timely maintenance and upgrades to ensure that road and highway surfaces last as long as
possible.
The pavement data in this report, which is for all arterial and collector roads and highways, is
provided by the Federal Highway Administration (FHWA), based on data submitted annually by the
Alabama Department of Transportation on the condition of major state and locally maintained roads
and highways. Pavement data for Interstate highways and other principal arterials is collected for all
system mileage, whereas pavement data for minor arterial and all collector roads and highways is
based on sampling portions of roadways as prescribed by FHWA to insure the data collected is
adequate to provide an accurate assessment of pavement conditions on these roads and highways.
Statewide, nearly one-third of Alabama’s major roads are in poor or mediocre condition.
Fourteen percent of Alabama’s major locally and state-maintained roads are in poor condition and 16
percent are in mediocre condition.7 Seventeen percent of Alabama’s major roads are in fair condition
and the remaining 53 percent are in good condition.8
Twenty-six percent of Alabama’s major locally and state-maintained urban roads and highways
have pavements rated in poor condition and 21 percent are in mediocre condition.9 Sixteen percent of
Alabama’s major urban roads are rated in fair condition and the remaining 37 percent are rated in
good condition.10
Nine percent of Alabama’s major locally and state-maintained rural roads and highways have
pavements rated in poor condition and 14 percent are in mediocre condition.11 Seventeen percent of
6
Alabama’s major rural roads are rated in fair condition and the remaining 60 percent are rated in good
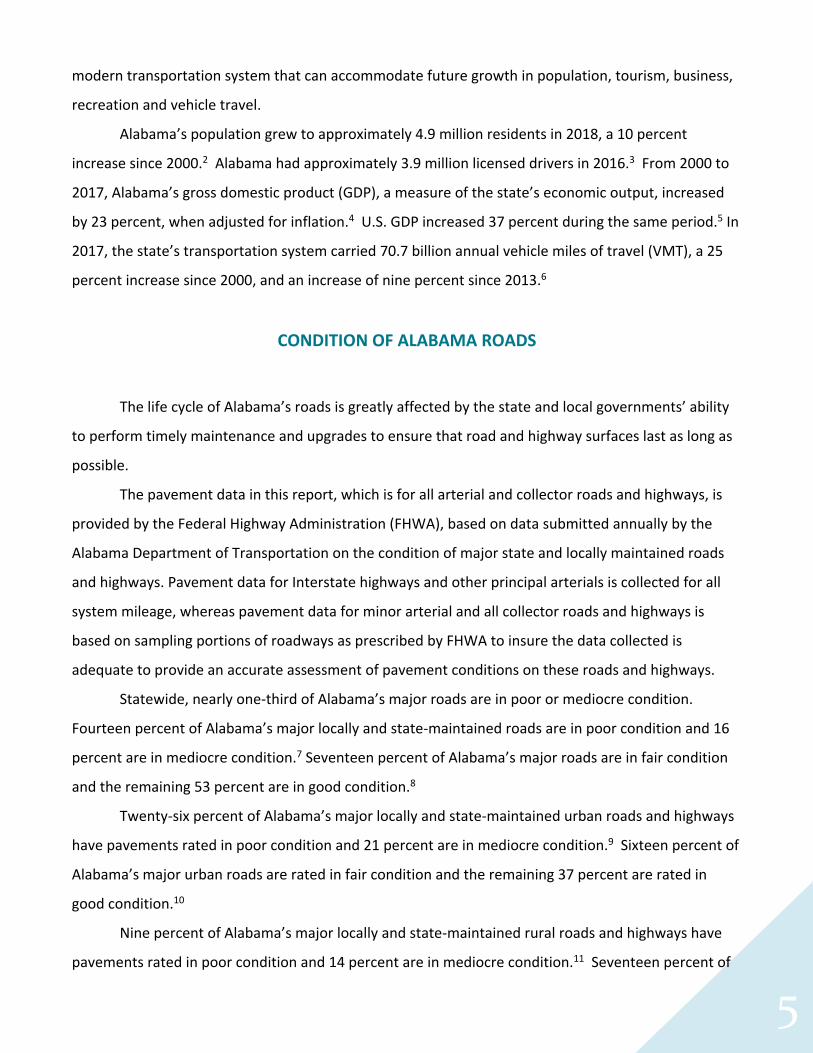
condition.12 The chart below details pavement conditions on major urban roads in the state’s largest
urban areas.13
Chart 1. Pavement conditions on major roads in Alabama’s largest urban areas and statewide.
Source: TRIP analysis of Federal Highway Administration data.
Pavement failure is caused by a combination of traffic, moisture and climate. Moisture often
works its way into road surfaces and the materials that form the road’s foundation. Road surfaces at
intersections are more prone to deterioration because the slow-moving or standing loads occurring at
these sites subject the pavement to higher levels of stress. It is critical that roads are fixed before they
require major repairs because reconstructing roads costs approximately four times more than
resurfacing them.14 As roads and highways continue to age, they will reach a point of deterioration
where routine paving and maintenance will not be adequate to keep pavement surfaces in good
condition and costly reconstruction of the roadway and its underlying surfaces will become necessary.
Location Poor Mediocre Fair Good
Anniston-Oxford-Gadsden 20% 13% 13% 53%
Birmingham 21% 20% 15% 44%
Florence 34% 17% 11% 38%
Decatur-Huntsville 16% 20% 18% 45%
Mobile 14% 18% 16% 52%
Montgomery 14% 16% 11% 59%
Tuscaloosa 35% 20% 16% 29%
Alabama Statewide 14% 16% 17% 53%
7
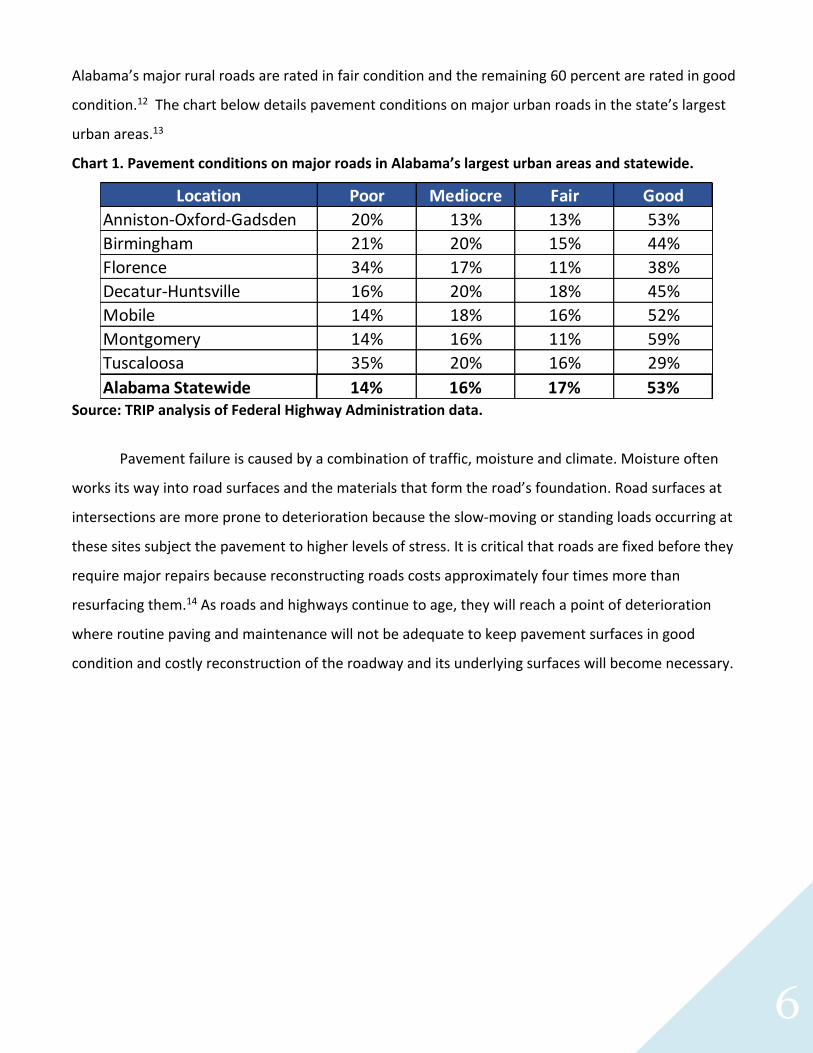
Chart 2. Pavement Condition Cycle Time with Treatment and Cost
Source: North Carolina Department of Transportation (2016). 2016 Maintenance Operations and Performance Analysis Report
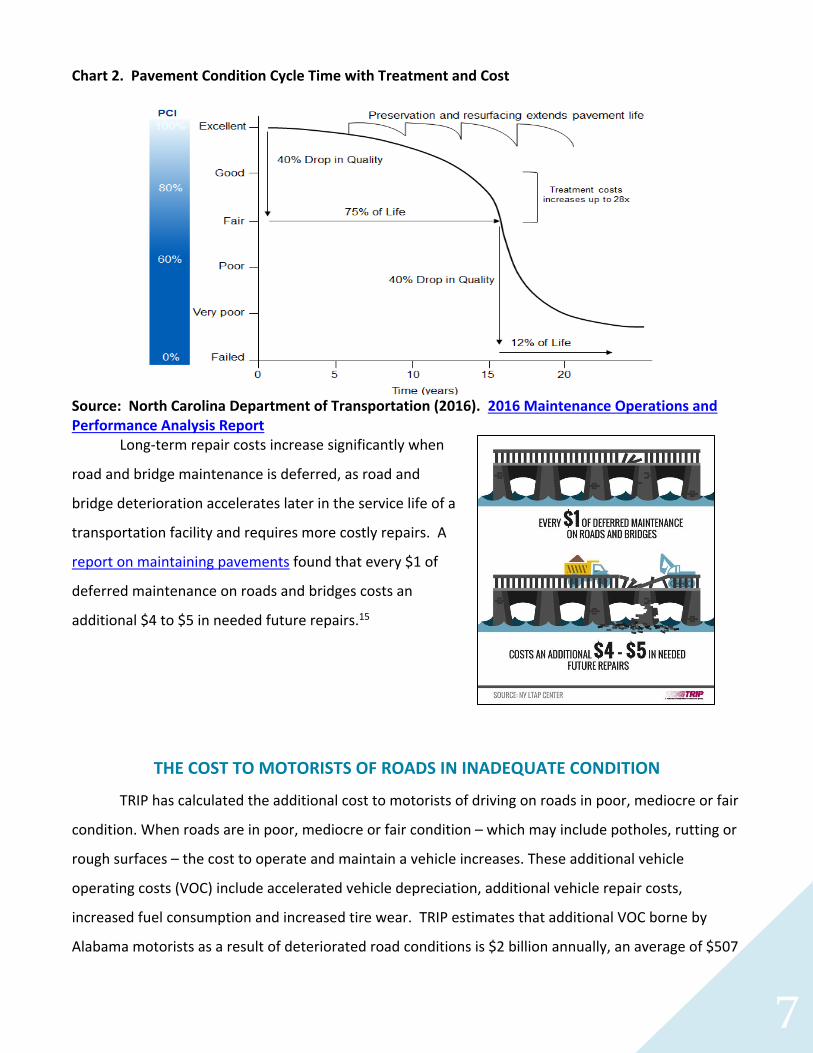
Long-term repair costs increase significantly when
road and bridge maintenance is deferred, as road and
bridge deterioration accelerates later in the service life of a
transportation facility and requires more costly repairs. A
report on maintaining pavements found that every $1 of
deferred maintenance on roads and bridges costs an
additional $4 to $5 in needed future repairs.15
THE COST TO MOTORISTS OF ROADS IN INADEQUATE CONDITION
TRIP has calculated the additional cost to motorists of driving on roads in poor, mediocre or fair
condition. When roads are in poor, mediocre or fair condition – which may include potholes, rutting or
rough surfaces – the cost to operate and maintain a vehicle increases. These additional vehicle
operating costs (VOC) include accelerated vehicle depreciation, additional vehicle repair costs,
increased fuel consumption and increased tire wear. TRIP estimates that additional VOC borne by
Alabama motorists as a result of deteriorated road conditions is $2 billion annually, an average of $507
8
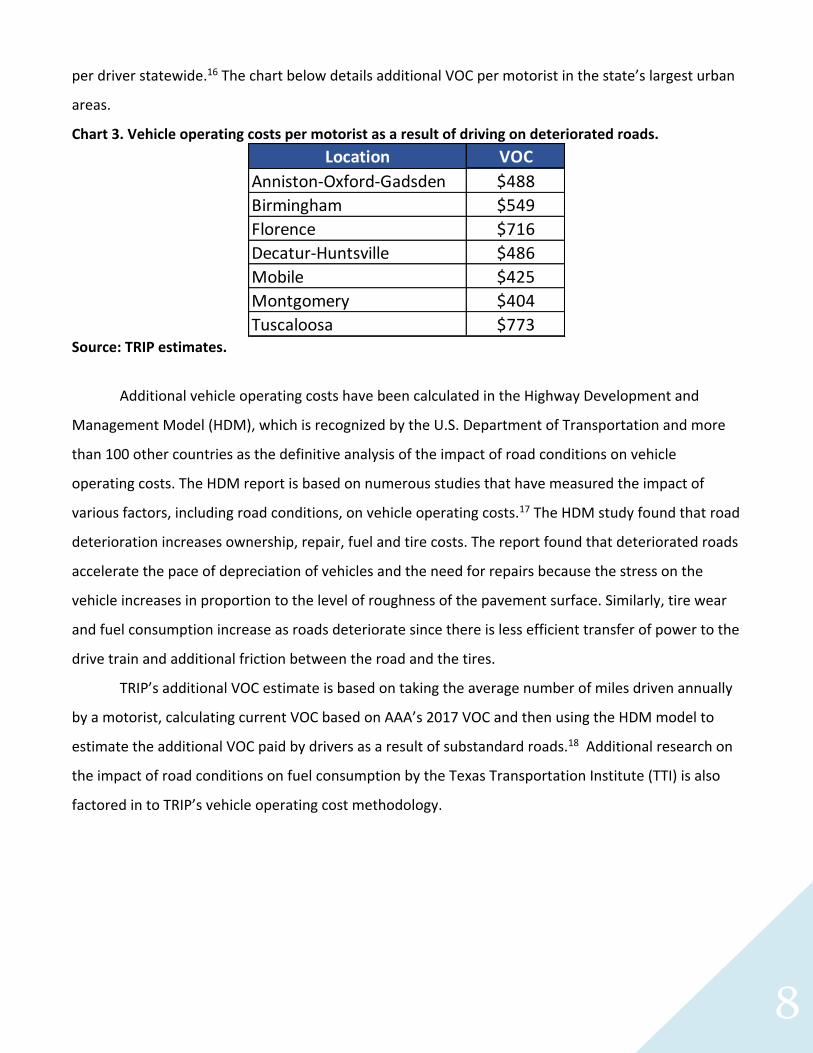
per driver statewide.16 The chart below details additional VOC per motorist in the state’s largest urban
areas.
Chart 3. Vehicle operating costs per motorist as a result of driving on deteriorated roads.
Source: TRIP estimates.
Additional vehicle operating costs have been calculated in the Highway Development and
Management Model (HDM), which is recognized by the U.S. Department of Transportation and more
than 100 other countries as the definitive analysis of the impact of road conditions on vehicle
operating costs. The HDM report is based on numerous studies that have measured the impact of
various factors, including road conditions, on vehicle operating costs.17 The HDM study found that road
deterioration increases ownership, repair, fuel and tire costs. The report found that deteriorated roads
accelerate the pace of depreciation of vehicles and the need for repairs because the stress on the
vehicle increases in proportion to the level of roughness of the pavement surface. Similarly, tire wear
and fuel consumption increase as roads deteriorate since there is less efficient transfer of power to the
drive train and additional friction between the road and the tires.
TRIP’s additional VOC estimate is based on taking the average number of miles driven annually
by a motorist, calculating current VOC based on AAA’s 2017 VOC and then using the HDM model to
estimate the additional VOC paid by drivers as a result of substandard roads.18 Additional research on
the impact of road conditions on fuel consumption by the Texas Transportation Institute (TTI) is also
factored in to TRIP’s vehicle operating cost methodology.
Location VOC
Anniston-Oxford-Gadsden $488
Birmingham $549
Florence $716
Decatur-Huntsville $486
Mobile $425
Montgomery $404
Tuscaloosa $773
9
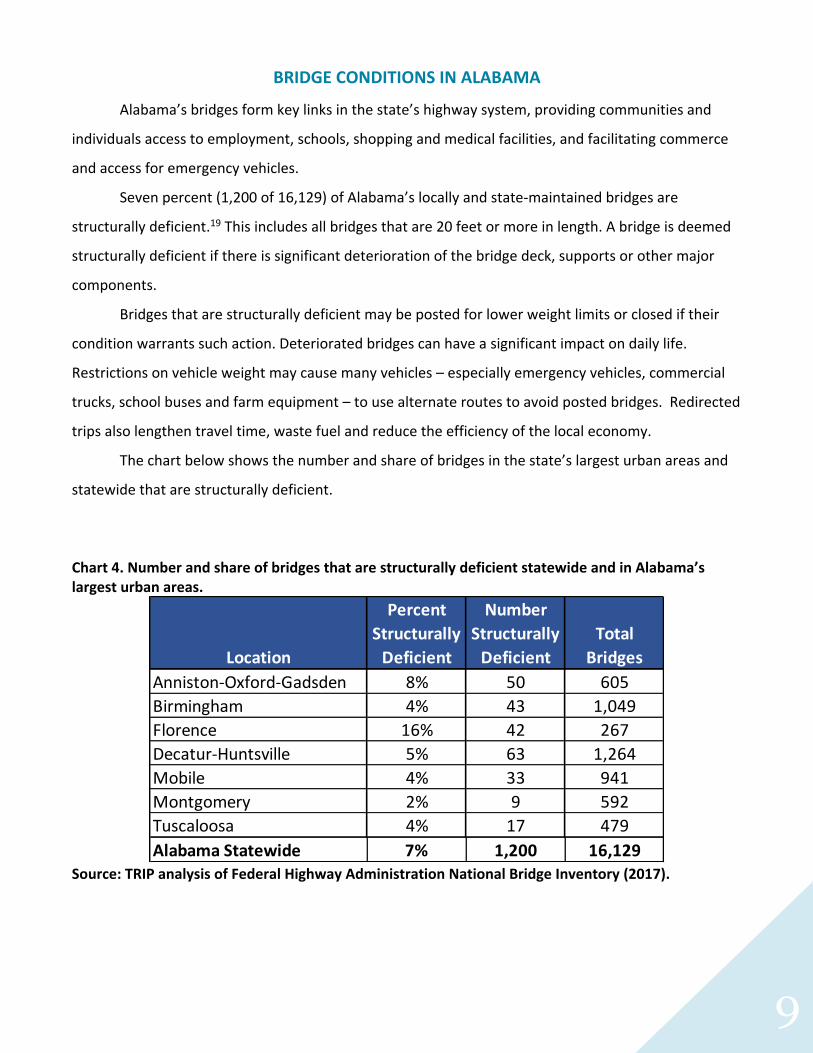
BRIDGE CONDITIONS IN ALABAMA
Alabama’s bridges form key links in the state’s highway system, providing communities and
individuals access to employment, schools, shopping and medical facilities, and facilitating commerce
and access for emergency vehicles.
Seven percent (1,200 of 16,129) of Alabama’s locally and state-maintained bridges are
structurally deficient.19 This includes all bridges that are 20 feet or more in length. A bridge is deemed
structurally deficient if there is significant deterioration of the bridge deck, supports or other major
components.
Bridges that are structurally deficient may be posted for lower weight limits or closed if their
condition warrants such action. Deteriorated bridges can have a significant impact on daily life.
Restrictions on vehicle weight may cause many vehicles – especially emergency vehicles, commercial
trucks, school buses and farm equipment – to use alternate routes to avoid posted bridges. Redirected
trips also lengthen travel time, waste fuel and reduce the efficiency of the local economy.
The chart below shows the number and share of bridges in the state’s largest urban areas and
statewide that are structurally deficient.
Chart 4. Number and share of bridges that are structurally deficient statewide and in Alabama’s largest urban areas.
Source: TRIP analysis of Federal Highway Administration National Bridge Inventory (2017).
Percent Number
Structurally Structurally Total
Location Deficient Deficient Bridges
Anniston-Oxford-Gadsden 8% 50 605
Birmingham 4% 43 1,049
Florence 16% 42 267
Decatur-Huntsville 5% 63 1,264
Mobile 4% 33 941
Montgomery 2% 9 592
Tuscaloosa 4% 17 479
Alabama Statewide 7% 1,200 16,129
10
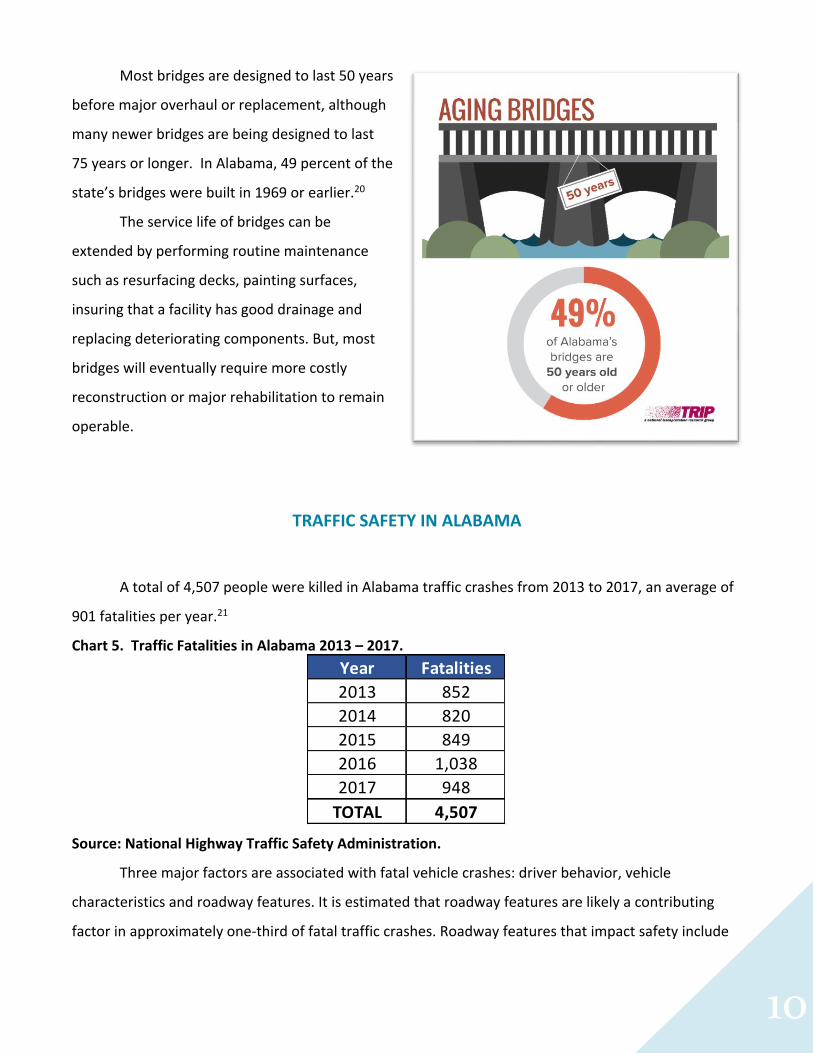
Most bridges are designed to last 50 years
before major overhaul or replacement, although
many newer bridges are being designed to last
75 years or longer. In Alabama, 49 percent of the
state’s bridges were built in 1969 or earlier.20
The service life of bridges can be
extended by performing routine maintenance
such as resurfacing decks, painting surfaces,
insuring that a facility has good drainage and
replacing deteriorating components. But, most
bridges will eventually require more costly
reconstruction or major rehabilitation to remain
operable.
TRAFFIC SAFETY IN ALABAMA
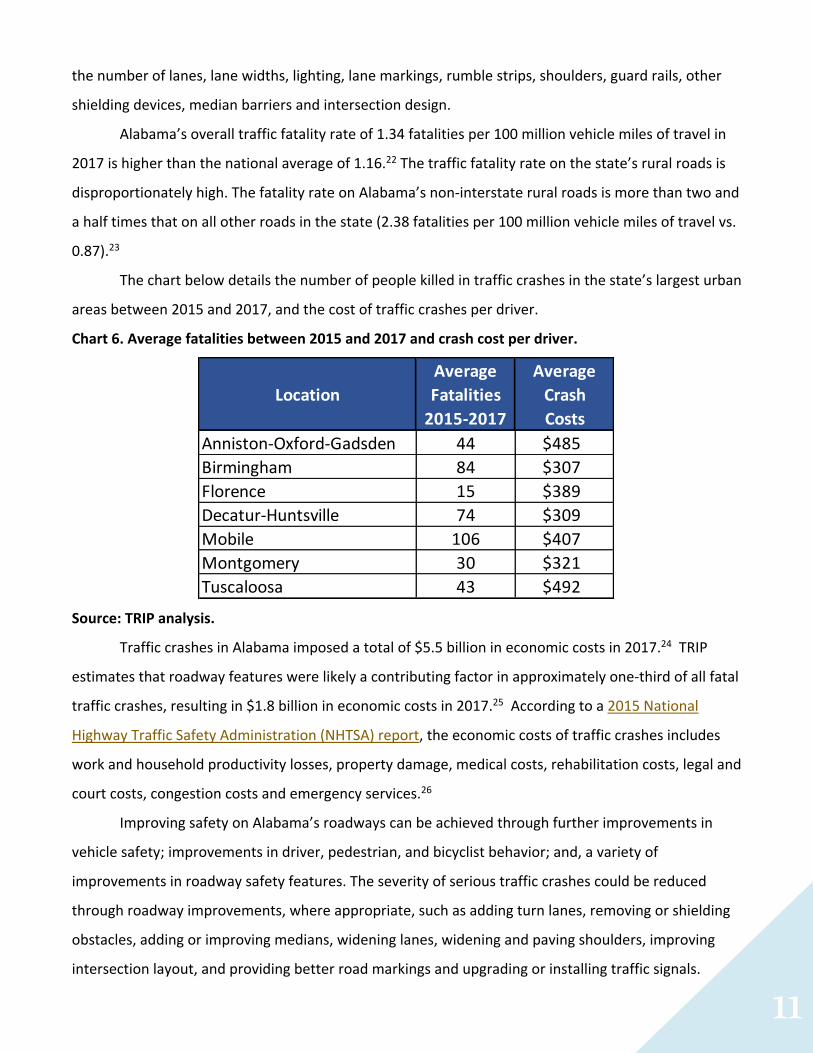
A total of 4,507 people were killed in Alabama traffic crashes from 2013 to 2017, an average of
901 fatalities per year.21
Chart 5. Traffic Fatalities in Alabama 2013 – 2017.
Source: National Highway Traffic Safety Administration.
Three major factors are associated with fatal vehicle crashes: driver behavior, vehicle
characteristics and roadway features. It is estimated that roadway features are likely a contributing
factor in approximately one-third of fatal traffic crashes. Roadway features that impact safety include
Year Fatalities
2013 852
2014 820
2015 849
2016 1,038
2017 948
TOTAL 4,507
11
the number of lanes, lane widths, lighting, lane markings, rumble strips, shoulders, guard rails, other
shielding devices, median barriers and intersection design.
Alabama’s overall traffic fatality rate of 1.34 fatalities per 100 million vehicle miles of travel in
2017 is higher than the national average of 1.16.22 The traffic fatality rate on the state’s rural roads is
disproportionately high. The fatality rate on Alabama’s non-interstate rural roads is more than two and
a half times that on all other roads in the state (2.38 fatalities per 100 million vehicle miles of travel vs.
0.87).23
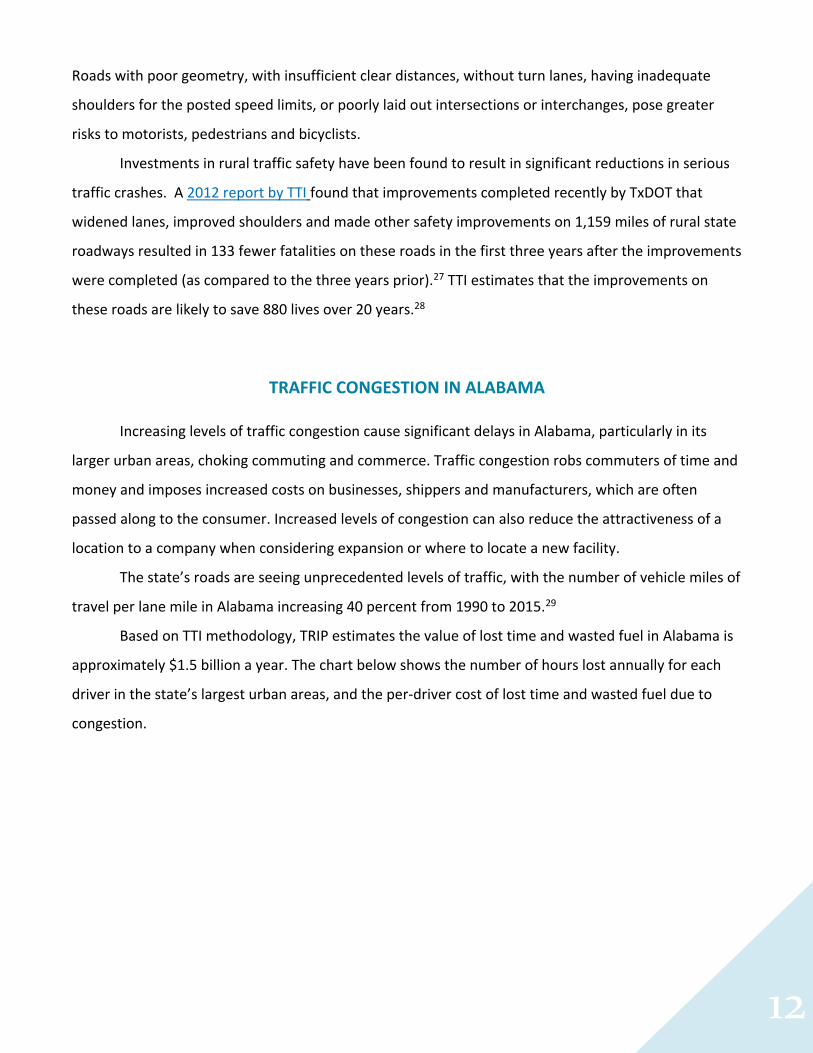
The chart below details the number of people killed in traffic crashes in the state’s largest urban
areas between 2015 and 2017, and the cost of traffic crashes per driver.
Chart 6. Average fatalities between 2015 and 2017 and crash cost per driver.
Source: TRIP analysis.
Traffic crashes in Alabama imposed a total of $5.5 billion in economic costs in 2017.24 TRIP
estimates that roadway features were likely a contributing factor in approximately one-third of all fatal
traffic crashes, resulting in $1.8 billion in economic costs in 2017.25 According to a 2015 National
Highway Traffic Safety Administration (NHTSA) report, the economic costs of traffic crashes includes
work and household productivity losses, property damage, medical costs, rehabilitation costs, legal and
court costs, congestion costs and emergency services.26
Improving safety on Alabama’s roadways can be achieved through further improvements in
vehicle safety; improvements in driver, pedestrian, and bicyclist behavior; and, a variety of
improvements in roadway safety features. The severity of serious traffic crashes could be reduced
through roadway improvements, where appropriate, such as adding turn lanes, removing or shielding
obstacles, adding or improving medians, widening lanes, widening and paving shoulders, improving
intersection layout, and providing better road markings and upgrading or installing traffic signals.
Average Average
Location Fatalities Crash
2015-2017 Costs
Anniston-Oxford-Gadsden 44 $485
Birmingham 84 $307
Florence 15 $389
Decatur-Huntsville 74 $309
Mobile 106 $407
Montgomery 30 $321
Tuscaloosa 43 $492
12
Roads with poor geometry, with insufficient clear distances, without turn lanes, having inadequate
shoulders for the posted speed limits, or poorly laid out intersections or interchanges, pose greater
risks to motorists, pedestrians and bicyclists.
Investments in rural traffic safety have been found to result in significant reductions in serious
traffic crashes. A 2012 report by TTI found that improvements completed recently by TxDOT that
widened lanes, improved shoulders and made other safety improvements on 1,159 miles of rural state
roadways resulted in 133 fewer fatalities on these roads in the first three years after the improvements
were completed (as compared to the three years prior).27 TTI estimates that the improvements on
these roads are likely to save 880 lives over 20 years.28
TRAFFIC CONGESTION IN ALABAMA
Increasing levels of traffic congestion cause significant delays in Alabama, particularly in its
larger urban areas, choking commuting and commerce. Traffic congestion robs commuters of time and
money and imposes increased costs on businesses, shippers and manufacturers, which are often
passed along to the consumer. Increased levels of congestion can also reduce the attractiveness of a
location to a company when considering expansion or where to locate a new facility.
The state’s roads are seeing unprecedented levels of traffic, with the number of vehicle miles of
travel per lane mile in Alabama increasing 40 percent from 1990 to 2015.29
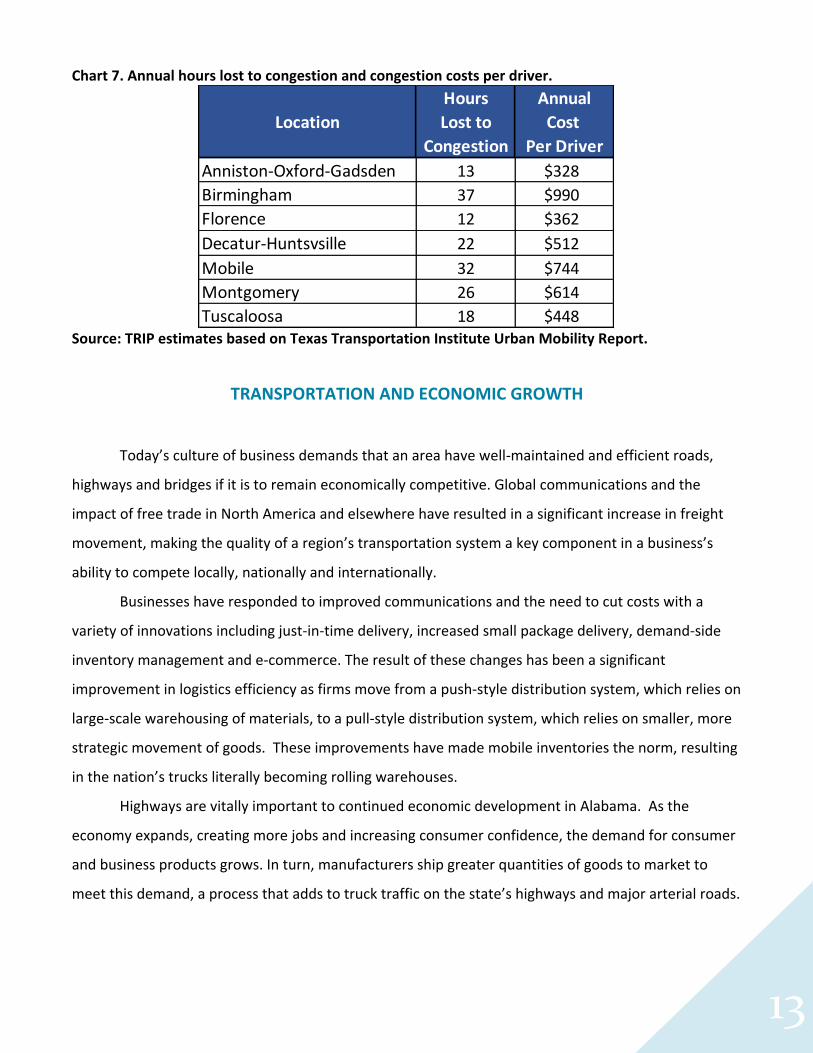
Based on TTI methodology, TRIP estimates the value of lost time and wasted fuel in Alabama is
approximately $1.5 billion a year. The chart below shows the number of hours lost annually for each
driver in the state’s largest urban areas, and the per-driver cost of lost time and wasted fuel due to
congestion.
13
Chart 7. Annual hours lost to congestion and congestion costs per driver.
Source: TRIP estimates based on Texas Transportation Institute Urban Mobility Report.
TRANSPORTATION AND ECONOMIC GROWTH
Today’s culture of business demands that an area have well-maintained and efficient roads,
highways and bridges if it is to remain economically competitive. Global communications and the
impact of free trade in North America and elsewhere have resulted in a significant increase in freight
movement, making the quality of a region’s transportation system a key component in a business’s
ability to compete locally, nationally and internationally.
Businesses have responded to improved communications and the need to cut costs with a
variety of innovations including just-in-time delivery, increased small package delivery, demand-side
inventory management and e-commerce. The result of these changes has been a significant
improvement in logistics efficiency as firms move from a push-style distribution system, which relies on
large-scale warehousing of materials, to a pull-style distribution system, which relies on smaller, more
strategic movement of goods. These improvements have made mobile inventories the norm, resulting
in the nation’s trucks literally becoming rolling warehouses.
Highways are vitally important to continued economic development in Alabama. As the
economy expands, creating more jobs and increasing consumer confidence, the demand for consumer
and business products grows. In turn, manufacturers ship greater quantities of goods to market to
meet this demand, a process that adds to truck traffic on the state’s highways and major arterial roads.
Hours Annual
Location Lost to Cost
Congestion Per Driver
Anniston-Oxford-Gadsden 13 $328
Birmingham 37 $990
Florence 12 $362
Decatur-Huntsvsille 22 $512
Mobile 32 $744
Montgomery 26 $614
Tuscaloosa 18 $448
14
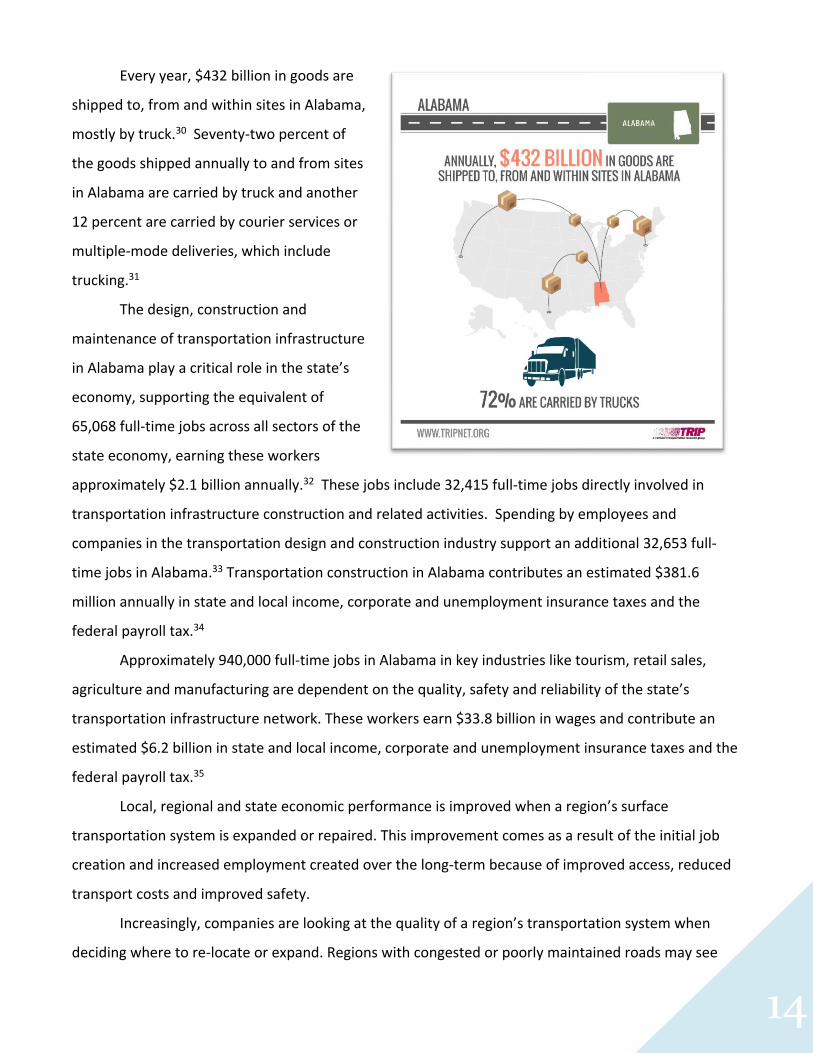
Every year, $432 billion in goods are
shipped to, from and within sites in Alabama,
mostly by truck.30 Seventy-two percent of
the goods shipped annually to and from sites
in Alabama are carried by truck and another
12 percent are carried by courier services or
multiple-mode deliveries, which include
trucking.31
The design, construction and
maintenance of transportation infrastructure
in Alabama play a critical role in the state’s
economy, supporting the equivalent of
65,068 full-time jobs across all sectors of the
state economy, earning these workers
approximately $2.1 billion annually.32 These jobs include 32,415 full-time jobs directly involved in
transportation infrastructure construction and related activities. Spending by employees and
companies in the transportation design and construction industry support an additional 32,653 full-
time jobs in Alabama.33 Transportation construction in Alabama contributes an estimated $381.6
million annually in state and local income, corporate and unemployment insurance taxes and the
federal payroll tax.34
Approximately 940,000 full-time jobs in Alabama in key industries like tourism, retail sales,
agriculture and manufacturing are dependent on the quality, safety and reliability of the state’s
transportation infrastructure network. These workers earn $33.8 billion in wages and contribute an
estimated $6.2 billion in state and local income, corporate and unemployment insurance taxes and the
federal payroll tax.35
Local, regional and state economic performance is improved when a region’s surface
transportation system is expanded or repaired. This improvement comes as a result of the initial job
creation and increased employment created over the long-term because of improved access, reduced
transport costs and improved safety.
Increasingly, companies are looking at the quality of a region’s transportation system when
deciding where to re-locate or expand. Regions with congested or poorly maintained roads may see
15
businesses relocate to areas with a smoother, more efficient and more modern transportation system.
Highway accessibility was ranked the number one site selection factor in a 2017 survey of corporate
executives by Area Development Magazine. Labor costs and the availability of skilled labor, which are
both impacted by a site's level of accessibility, were rated second and third, respectively.36
TRANSPORTATION FUNDING IN ALABAMA
Investment in Alabama’s roads, highways and bridges is funded by local, state and federal
governments. A lack of sufficient funding at all levels will make it difficult to adequately maintain and
improve the state’s existing transportation system.
Inflation and increased fuel economy have decreased the ability of the Alabama’s fuel tax
revenue to provide for the needs of a transportation system that is carrying significantly more vehicle
travel and experiencing increased wear and tear and added congestion as a result. Alabama’s fuel tax
was last raised in 1992. Only eight other states have gone as long without an increase.37 Revenue from
the state’s 18 cent-per-gallon fuel tax has not kept pace with inflation. When adjusted for inflation,
Alabama collects half of what it did in the early 1990s. In 1992, when the state’s fuel tax was last
raised, the yield of per-gallon fuel taxes per 100 miles driven was $1.06, but declined to $0.53 in 2016
when adjusted for inflation.38
An increasingly large share of ALDOT’s budget has been devoted to preserving the existing
system of roads and bridges, leaving only $150 million available each year for new projects that would
address congestion or expand the system to accommodate population and travel growth and promote
economic development.39 ALDOT and communities around the state have identified major
transportation projects across Alabama that would help to ease congestion and create economic
development opportunities. These projects include the 53-mile Northern Beltline around Birmingham;
more than $1 billion in identified expansion needs in Huntsville; a new Mobile Bay Bridge and Bayway;
an outer highway loop for Montgomery; Tuscaloosa’s Eastern Bypass; a bypass around Dothan; and, an
extension of I-85 across West Alabama. At least an additional $10 billion in large-scale projects have
been identified, but only $150 million a year will be available.40
A 2019 report by the University of Alabama’s Alabama Transportation Institute and Alabama
Transportation Policy Research Center found that, through 2040, Alabama should be spending a
minimum of $600 million annually on additional roadway capacity to allow the state to be
16
economically competitive. An annual investment of $800 million in additional roadway capacity would
optimize Alabama’s economic opportunities.41
Through ATRIP (the Alabama Transportation Rehabilitation and Improvement Program), first
introduced in 2012 and enacted in 2013, the state secured more than $1.3 billion in borrowed dollars
to address needed improvements that would not have been possible with the available revenue.
However, the state will see a significant drop in available transportation funding now that the
borrowing authority has been exhausted and the state must devote additional funds to repaying the
debt.
The use of approximately $200 million annually in ATRIP funds, which concluded in 2017, as
well as additional debt incurred to finance the reconstruction of the elevated interstate and bridges in
Birmingham’s Central Business District, has resulted in the state’s annual highway debt service
increasing to $114 million in 2018, a level it will stay at for the next 19 years.42 This annual level of
state highway debt service is up from $13.6 million in 2011.43
The federal government is a critical source of funding for Alabama’s roads, highways, bridges
and transit systems and provides a significant return in road and bridge funding based on the revenue
generated in the state by the federal motor fuel tax.
Most federal funds for highway and transit improvements in Alabama are provided by federal
highway user fees, largely an 18.4 cents-per-gallon tax on gasoline and a 24.4 cents-per-gallon tax on
diesel fuel. Since 2008 revenue into the federal Highway Trust Fund has been inadequate to support
legislatively set funding levels so Congress has transferred approximately $53 billion in general funds
and an additional $2 billion from a related trust fund into the federal Highway Trust Fund.44
17
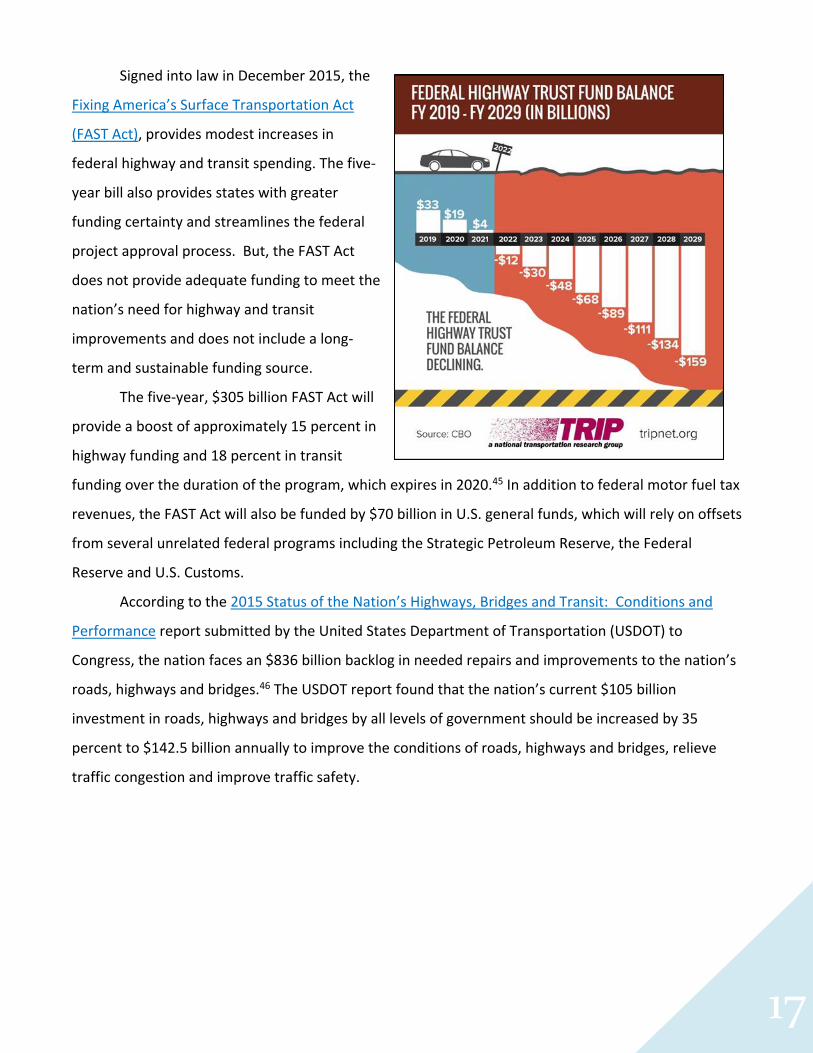
Signed into law in December 2015, the
Fixing America’s Surface Transportation Act
(FAST Act), provides modest increases in
federal highway and transit spending. The five-
year bill also provides states with greater
funding certainty and streamlines the federal
project approval process. But, the FAST Act
does not provide adequate funding to meet the
nation’s need for highway and transit
improvements and does not include a long-
term and sustainable funding source.
The five-year, $305 billion FAST Act will
provide a boost of approximately 15 percent in
highway funding and 18 percent in transit
funding over the duration of the program, which expires in 2020.45 In addition to federal motor fuel tax
revenues, the FAST Act will also be funded by $70 billion in U.S. general funds, which will rely on offsets
from several unrelated federal programs including the Strategic Petroleum Reserve, the Federal
Reserve and U.S. Customs.
According to the 2015 Status of the Nation’s Highways, Bridges and Transit: Conditions and
Performance report submitted by the United States Department of Transportation (USDOT) to
Congress, the nation faces an $836 billion backlog in needed repairs and improvements to the nation’s
roads, highways and bridges.46 The USDOT report found that the nation’s current $105 billion
investment in roads, highways and bridges by all levels of government should be increased by 35
percent to $142.5 billion annually to improve the conditions of roads, highways and bridges, relieve
traffic congestion and improve traffic safety.
18
CONCLUSION
As Alabama works to enhance its thriving, growing and dynamic state, it will be critical that it is
able to address the most significant transportation issues by providing a 21st century network of roads,
highways, bridges and transit that can accommodate the mobility demands of a modern society.
Alabama will need to modernize its surface transportation system by improving the physical
condition of its transportation network and enhancing the system’s ability to provide efficient, safe and
reliable mobility for residents, visitors and businesses. Making needed improvements to the state’s
roads, highways, bridges and transit systems would provide a significant boost to the economy by
creating jobs in the short term and stimulating long-term economic growth as a result of enhanced
mobility and access.
Numerous projects to improve the condition and expand the capacity of Alabama’s roads,
highways, bridges and transit systems will not be able to proceed without a substantial boost in state
or local transportation funding. If Alabama is unable to complete needed transportation projects it will
hamper the state’s ability to improve the condition and efficiency of its transportation system or
enhance economic development opportunities and quality of life.
# # #
19
ENDNOTES
1 Bridge condition data and safety data for each urban area includes the counties noted: Anniston-Oxford-Gadsden: Calhoun and Etowah Counties; Birmingham: Jefferson County; Florence: Lauderdale County; Decatur-Huntsville: Madison, Morgan and Limestone Counties; Mobile: Mobile and Baldwin Counties; Montgomery: Montgomery County; Tuscaloosa: Tuscaloosa County. 2 U.S. Census Bureau (2017). 3Highway Statistics (2016). Federal Highway Administration. DL-1C. 4 TRIP analysis of Bureau of Economic Analysis data. 5 Ibid. 6 U.S. Department of Transportation - Federal Highway Administration: Highway Statistics 2000 and 2016 and analysis of Federal Highway Administration Traffic Volume Trends (2016) https://www.fhwa.dot.gov/policyinformation/travel_monitoring/tvt.cfm 7 Federal Highway Administration (2018). Pavement condition data is for 2017. 8 Ibid. 9 Ibid. 10 Ibid. 11 Ibid. 12 Ibid. 13 Ibid. 14 Selecting a Preventative Maintenance Treatment for Flexible Pavements. R. Hicks, J. Moulthrop. Transportation Research Board. 1999. Figure 1. 15 Pavement Maintenance, by David P. Orr, PE Senior Engineer, Cornell Local Roads Program, March 2006. 16 TRIP calculation. 17 Highway Development and Management: Volume Seven. Modeling Road User and Environmental Effects in HDM-4. Bennett, C. and Greenwood, I. 2000. 18 Your Driving Costs. American Automobile Association. 2017. 19 Federal Highway Administration National Bridge Inventory. 2017. 20 TRIP analysis of Federal Highway Administration National Bridge Inventory data (2018). 21 Federal Highway Administration National Highway Traffic Safety Administration, 2012-2016. 22 TRIP analysis of National Highway Traffic Safety Administration and Federal Highway Administration data (2018). Data is for 2017. 23 TRIP analysis of National Highway Traffic Safety Administration and Federal Highway Administration data (2016). 24 TRIP estimate based on NHTSA report “The Economic and Societal Impact of Motor Vehicle Crashes, 2010 (Revised), 2016. P. 146. 25 Ibid. 26 The Economic and Societal Impact of Motor Vehicle Crashes, 2010 (Revised) (2015). National Highway Traffic Safety Administration. P. 1. https://crashstats.nhtsa.dot.gov/Api/Public/ViewPublication/812013 27 Adding Highway Shoulders, Width, Reduce Crash Numbers and Save Lives (August 9, 2012). Texas Transportation Institute. https://tti.tamu.edu/2012/08/09/tti-study-analyzes-roadway-improvements/ 28 Ibid. 29 How Alabama Roads Compare, 9th Edition. November 2017. Public Affairs Research Council of Alabama. 30 TRIP analysis of Bureau of Transportation Statistics, U.S. Department of Transportation. 2016 Commodity Flow Survey, State Summaries. 31 Ibid. 32 American Road & Transportation Builders Association (2015). The 2015 U.S. Transportation Construction Industry Profile. https://www.transportationcreatesjobs.org/pdf/Economic_Profile.pdf 33 Ibid. 34 Ibid
20
35 Ibid. 36 Area Development Magazine (2018). 32nd Annual Survey of Corporate Executives: Availability of Skilled Labor New Top Priority. http://www.areadevelopment.com/Corporate-Consultants-Survey-Results/Q1-2018/32nd-annual-corporate-survey-14th-annual-consultants-survey.shtml 37 How Alabama Roads Compare, 9th Edition. November 2017. Public Affairs Research Council of Alabama. 38 Ibid. 39 Ibid 40 Ibid 41 “Addressing Alabama’s Transportation Infrastructure: Roads and Bridges.” University of Alabama’s Alabama Transportation Policy Research Center. January 2019. 42 Ibid 43 Ibid 44 “Surface Transportation Reauthorization and the Solvency of the Highway Trust Fund,” presentation by Jim Tymon, American Association of State Highway and Transportation Officials (2014). 45 2015 “Fixing America’s Surface Transportation Act.” (2015) American Road and Transportation Builders Association. http://www.artba.org/newsline/wp-content/uploads/2015/12/ANALYSIS-FINAL.pdf 46 United States Department of Transportation (2015). 2015 Status of the Nation’s Highways, Bridges, and Transit: Conditions and Performance. Executive Summary, Chapter 8. https://www.fhwa.dot.gov/policy/2015cpr/es.cfm#8h