Embed Size (px)
Citation preview

SUPPLEMENT
MARKET OPPORTUNITIES STUDYOCTOBER 2012
2
ALA MOANA | Neighborhood TOD Plan - Existing Transportation Conditions
1) INTRODUCTION/PURPOSE
Th is report, prepared by Keyser Marston Associates, Inc. as a sub consultant to RTKL, assesses the potential market demand for a variety of residential and commercial land uses consistent with TOD principles and to identify the opportunities and constraints for development of those types of uses. More specifi cally, this study examines the following uses:
• Residential
• Retail
• Offi ce
• Hotel
Th is Market Opportunities Study is a companion document to the Existing Conditions Report prepared by RTKL, which describes in more detail the existing conditions around the Ala Moana station. Th e Market Opportunities Study will help the City make decisions with respect to potential TOD land uses that might be accommodated around the station.
2) ASSUMPTIONS & LIMITATIONS
Keyser Marston has assessed the market demand for the various land uses based on typical market and demand factors for real estate analysis, including historic and projected population and employment, market metrics such as rents, vacancies, and absorption, as well as construction trends. In undertaking this analysis, Keyser
MARKET OPPORTUNITIESTh e City and County of Honolulu (City) has initiated preparation of the Ala Moana Neighborhood Transit Oriented Development (TOD) Plan along the planned new elevated transit line in Honolulu. Th e purpose of the overall assignment is to promote transit oriented land uses and improve neighborhood quality and character of the areas around the transit station.
Th e new 20-mile elevated rail system is planned to connect East Kapolei to Ala Moana Center and will consist of 21 stations. As a general rule, existing development in the ewa area of the island is less intense than in the existing built areas of the “urban” stations. According to the Environmental Impact Statement (EIS), it is projected that the transit line will be built out in 2019, and by 2030 it is estimated that there will be approximately 116,000 annual boardings. Th is Market Opportunities Study is intended to evaluate the time period from today to the year 2035.
Marston has performed original research as well as obtained data from third parties such as the City and County of Honolulu, the State of Hawaii, the Honolulu Board of Realtors, Claritas (a private data research company), and local real estate brokers, developers and property owners. While Keyser Marston believes data obtained from third parties is reliable, we cannot guarantee its accuracy.
Th e demand estimates included in this report are based on an examination of historic patterns of new development, the experiences with TOD in other parts of the country, and on Keyser Marston’s professional judgment with respect to TOD opportunities around the Ala Moana station. However, because the study area is a largely built-out environment, in order for much of the potential new demand to be accommodated redevelopment of existing properties will be required. Keyser Marston’s scope of work for this assignment does not include an assessment of fi nancial feasibility of specifi c projects.
Finally, the market demand assessment is undertaken without respect to current zoning designations. If the market demand conclusions drawn in this report are to be fully implemented (i.e. residential units, retail building square feet, etc.), it may be necessary to modify current zoning for factors such as building heights, bulk, fl oor area ratio, etc.

3
3) TRANSIT ORIENTED DEVELOPMENT
In general terms, TOD is defi ned as development around transit stations that is at medium to high densities and that encourages transit ridership. Th e goals of TOD are to be pedestrian and bicycle friendly so as to encourage non-automobile forms of transportation and to encourage mixed use development so that residents, employment centers, and services are within convenient proximity of each other. Th e typical TOD catchment area is typically a fi ve- or ten-minute walk from the station, or up to about a 0.5 mile. Th e Ala Moana station will be located along Kona Street between Kona Iki and Keeaumoku streets.
Th e potential benefi ts of TOD are many:
• Decreased traffi c congestion;
• Cost savings from decreased dependence on private vehicles for transportation and for parking;
• Preservation of open space by accommodating new growth in higher density developments;
• Decreased generation of greenhouse gasses from lower private auto use;
• Promotion of healthier lifestyles by encouraging more walking and bicycling;
• Increased property values;
• Generation of fi scal benefi ts to the City and County through new development and redevelopment of properties around the transit stations
However, for a variety of reasons TOD can also be diffi cult to accomplish. Since TOD is at higher densities, the associated construction costs are also higher. TOD within existing built neighborhoods is further challenged by the need to assemble development sites, relocate existing tenants or buy out existing leases, demolish buildings to clear the way for new construction, replace public infrastructure, and coordinate development eff orts among sometimes numerous small property owners.
4) ALA MOANA STATION AREA
Ala Moana is a diverse, densely developed neighborhood with a mix of residential, retail, offi ce, hotel, and public uses. Th e most prominent single development within the area is the 2 million square foot Ala Moana shopping center (Ala Moana Center), one of the largest and busiest
malls in the country. Other prominent developments in the area include McKinley High School/Adult Education Center, Neal Blaisdell Center, the Honolulu Convention Center, and Walmart/Sam’s Club. Th e area is also home to Ala Moana Park, a large beachfront park popular with both locals and visitors.
As defi ned in the City’s Ala Moana-Sheridan Community Plan, the Ala Moana area is comprised of six distinct neighborhoods or subareas, each with its own character, mix of land uses, and market orientation – the Ala Moana shopping center area, the Sheridan residential tract, the Kaheka District, the Kapiolani Corridor, the Keeaumoku Corridor, and the Civic District.
• Ala Moana Center – Ala Moana Center is a major destination shopping center for both tourists and locals. First built in 1959, the mall has been expanded several times and is now comprised of 2 million square feet with anchor department stores Macy’s, Sears, Neiman Marcus, and Nordstrom. Th e center is one the largest and highest sales-generating shopping centers in the country and is a major employer in Honolulu. Th e mall is owned and operated by General Growth Properties.
• Sheridan Tract – Th e Sheridan Tract is a predominantly residential area roughly bounded by Kapiolani, Pensacola, South King, and Sheridan. Th e
District Plan

4
ALA MOANA | Neighborhood TOD Plan - Existing Transportation Conditions
Sheridan Tract is a mature residential neighborhood characterized by a mix of small single family detached homes and low-rise apartment buildings. Th ere is also an eclectic mix of other uses in the Sheridan Tract such as small scale retail, auto repair, and even a dairy (Meadow Gold). Of signifi cance, the blocks on the ewa side of Piikoi are within the land use regulatory jurisdiction of the State’s Hawaii Community Development Authority (HCDA) rather than the City and County of Honolulu.
• Kaheka District – Th e Kaheka District straddles both sides of Kaheka Street and is sometimes referred to as “K-Town”. It is characterized by the predominance of Korean- or Asian-oriented businesses including such establishments as the Palama Supermarket, Don Quijote Supermarket, and Sorabol Restaurant. Th e Kaheka District’s residential units are predominantly rental apartments of which many are occupied by seniors. Th e Kalakaua public housing project is also located in the Keheka District.
• Kapiolani Corridor – Kapiolani Boulevard is a major corridor running through the Ala Moana area connecting Ala Moana with downtown and the Kakaako District on the ewa side and Waikiki on the Diamondhead side. Given the underutilization of several properties along this corridor, Kapiolani provides opportunities for redevelopment and TOD near the new Ala Moana rail station.
• Keeaumoku Corridor – Keeaumoku Street is a major corridor anchored by Ala Moana Center on the makai side and extending mauka to the H-1 freeway and residential neighborhoods. Th e recently completed Walmart/Sam’s Club development is a dominant presence on the Keeaumoku Corridor. Keeaumoku is a busy transportation corridor and similar to Kapiolani, holds the opportunity to intensify its development pattern to take advantage of its convenient proximity to the new rail station.
• Civic District – On the ewa side of the Ala Moana planning area is the Civic District, which is comprised of McKinley High School/Adult School and the Neal Blaisdell Center. Th ere are currently no fi rm plans to signifi cantly redevelop these properties.
Also within the 0.5 mile planning area of the Ala Moana station are properties in the Kaka’ako area, which is within the land use regulatory jurisdiction of the HCDA. On the ewa side of Piikoi, several high rise residential developments (400’+) have been built under HCDA’s oversight.
5) REDEVELOPMENT OPPORTUNITIES
Given the fact that the Ala Moana area is mostly built out, the opportunities for major development will require redevelopment of existing built properties. One of the factors that contributes to the diffi culty of accomplishing any large scale redevelopment in Ala Moana is the predominance of small land parcels paired with a pattern of multiple property ownerships. In order to assemble a development site large enough to support high density development in an effi cient manner, a developer would have the challenge of reaching agreement to purchase multiple parcels from multiple owners.
In addition, many properties in Ala Moana have relatively healthy rents that generate signifi cant cash fl ow for existing property owners, which drives up property values. Th erefore, a redevelopment project would have to be large enough to support the high cost of property/land acquisition in addition to the high costs of construction common to all high density projects in Honolulu.
Adequacy of existing Infrastructure (streets, water, sewer, etc.) could also present a challenge for accomplishing new redevelopment in Ala Moana. As noted in the Ala Moana Existing Conditions Report, new funding and fi nancing mechanisms may need to be considered in order to build new infrastructure such as community facilities district (CFD) fi nancing and tax increment fi nancing (TIF).
From a market perspective, it needs to be emphasized that there are signifi cant plans for redevelopment in the neighboring Kakaako area under the primary ownership of Kamehameha Schools and the Howard Hughes Corporation. Th e Kakaako area is planned for thousands of residential units and hundreds of thousands of square feet of commercial development. Th e ultimate timing of development in Ala Moana will be dependent to some degree upon the pace of development in Kakaako.

5
6) DEMOGRAPHICS & EMPLOYMENT
For purposes of the market demand analysis, Keyser Marston obtained population and demographic data from Claritas for the 0.5 mile planning area around the Ala Moana station. Claritas estimates that the population of the 0.5 mile radius will be about 15,900 in 2013, the average household size 1.87, and the median household income about $43,000 (see attached Table 1).
In terms of economic activity, much of the State of Hawaii’s economy is based on tourism or the military/government, with about 32% of the Gross State Product generated by these industries1 and much of the economic activity supporting other job sectors such as retail and real estate is generated by the tourism and government sectors. In the Ala Moana-Kakaako subarea of the City, over 60% of the jobs are focused in two categories: services and retail2 (see Table 4).
7) RESIDENTIAL CONDOMINIUMS & APARTMENTS
Residential market conditions in Honolulu experienced a downtown during the recession, which was demonstrated by a decline in condo values, number of sales, and new construction permits. Notably, there were also several projects that were halted mid-construction and sold to new developers as a result of fi nancial problems including the Pacifi ca Honolulu project (formerly Moana Vista).
Th e residential market has experienced a resurgence recently however, with values on the rise and several new project either recently breaking ground or ready to begin construction:
New Projects within the 0.5 mile Ala Moana planning area (list is not necessarily all-inclusive)
• Howard Hughes condominium project atop Nordstrom parking lot
• Samkoo-owned condominium project on Kapiolani
• Waihonua at Kewalo condominium project by Alexander & Baldwin on Waimanu near Piikoi (in construction)
• Cuzco Development-owned site on Keeaumoku
New Projects nearby but outside 0.5 mile Ala Moana planning area (list is not necessarily all-inclusive)
• “Symphony” condominium project on Ward Avenue across from Blaisdell Center
• Star Advertiser site
• 690 Pohukaina project adjacent to Mother Waldron Park (HCDA sponsored)
• Holomua condominium project at Young and Kalakaua (in construction)
Despite continuing challenges in most housing markets on the mainland, Honolulu has rebounded due to demand/supply imbalances, record low mortgage interest rates, low returns in stocks, bonds, and other investments, and other factors. City data indicates that residential building permits for 5+ unit buildings increased from a low of less than 150 in 2009 to about 1,000 in 2010 and 980 in 2011 (see Table 5). Th e average number of multi-family building permits over the past 20 years was about 1,200 per year.
Ala Moana is a high value area due to its convenient location near the waterfront, Waikiki, Ala Moana Center, and the Convention Center, thus making it a convenient location for visitors. It is also a convenient location for locals to live given its close proximity to job centers including Downtown, Civic Center, retail establishments, as well as the nearby hotels and other tourist-based businesses.
With regard to rental apartments, there has been almost no new development of market rate apartments in Honolulu in many years, a refl ection of the discrepancy between the values of for-sale condominiums vs. those supported by apartment rents. Th e rental housing stock in Honolulu is generally a combination of older market rate apartments, public housing or other subsidized housing, and for-sale condominiums that owner/investors are renting. Rental rates for condominium units vary considerably from project to project depending on location and amenities, and can range from about $1,700 per month to well over $2,000 for a two-bedroom unit.
Th e new transit line will further strengthen new opportunities for residential housing growth to the Ala Moana planning area. Studies have shown that new transit
1 Enterprise Hawaii
2 Honolulu Department of Planning and Permitting

6
ALA MOANA | Neighborhood TOD Plan - Existing Transportation Conditions
lines promote growth of higher density housing units within close proximity of the stations, particularly when they are located in mixed use areas near jobs and cultural/entertainment amenities3. Studies have also shown that the these types of neighborhoods are a draw particularly for empty-nesters looking to downscale, as well as young, single people not yet ready to purchase a larger home. Combined with the fact that traffi c congestion is already a major problem in Honolulu, it is likely that there will be growing demand for TOD housing in the Ala Moana planning area.
Keyser Marston has estimated the range of new TOD housing units in the Ala Moana planning area. Th ere are currently about 8,400 housing units within 0.5 mile radius of the Ala Moana station, which represents about a 2.47% share of the 340,000 housing units in all of Honolulu4. Keyser Marston estimates that once the transit line is fully operational, the Ala Moana station planning area (0.5 mile radius) could eventually add in the range of 3,000 new housing units. Th is would increase Ala Moana’s share of Honolulu’s total housing units from 2.47% to 2.74% based on the City’s projection of 416,000 total housing units in all of Honolulu in 2035 (about a 4% share of the regional increase). Th is range is based on the characteristics of the station area and on data that demonstrates that higher density housing tends to cluster around transit stations.
It is likely that the new transit line once it is fully operational will contribute toward the economics of redevelopment projects. Empirical studies of the economic impacts of transit indicate that the value of residential condominiums with close proximity to transit can be increased by up to 18% and apartment values by up to 45%5. Given its locational advantages and given prospects for higher values due to transit, it appears that there are strong economic, market, and demographic factors in favor of more residential growth in the Ala Moana planning area.
8) RETAIL
Th e Ala Moana area is already a major retail destination due to the dominant presence of the Ala Moana Center, Walmart/Sam’s Club, as well as more local oriented markets and restaurants. In general, retail market conditions in Honolulu historically have been quite strong. Average retail rents in Honolulu are currently in the rough
range of $3.00 and $4.00 per square foot and the average vacancy rate is about 4% (see Table 8). In order to assess the amount of additional retail that might be supported in the study area, Keyser Marston analyzed retail sales data for the Ala Moana area. Th is analysis indicates that there is a signifi cant infl ux of retail sales into the planning area; that is, stores within Ala Moana generate sales from a trade area far larger than the immediate area itself. Th is result is expected given the presence of Ala Moana Center and Walmart/Sam’s Club.
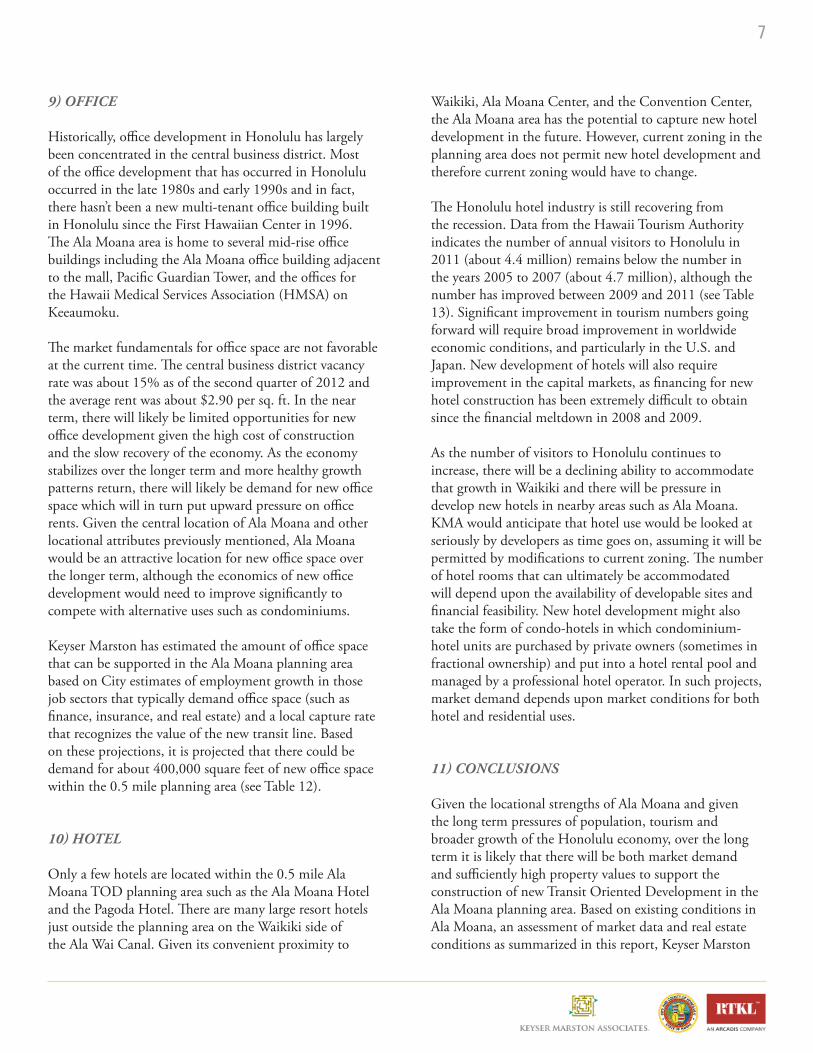
Keyser Marston has evaluated the amount of TOD-oriented retail that can be supported in the 0.5 mile Ala Moana planning area based on projected household growth, capture rates, and other factors. A preliminary estimate is that there could be support for a total of about 600,000 square feet of new retail by 2035, both to serve new residents of Ala Moana as well as the larger region and the tourist industry (see Table 9)6. It is noted that this estimate excludes potential demand from building material/supply stores, general merchandise, and automobile sales because these types of retail uses are generally not consistent with the higher-density, pedestrian-scale principles of TOD, and these types of large-scale retail uses would probably be located outside the planning area going forward in any case.
Based on the largely built out environment of the planning area, new retail opportunities will likely take the form of ground fl oor retail in mixed-use buildings, redevelopment of some retail establishments on the outer edges of the planning area, and possibly an expansion of Ala Moana Center where parking is currently located. Of critical importance to the success of mixed use and other types of pedestrian-oriented retail is the inclusion of "place-making" amenities including sidewalks, streetscape improvements, street trees, public plazas, and the like, as well as, to the extent possible, traffi c calming measures to improve pedestrian and bicycle safety.
3 For example, Hidden in Plain Sight: Capturing the Demand for Housing Near Transit, Center for Transit Oriented Development (September 2004)
4 RTKL and the Honolulu Department of Planning and Permitting
5 Capturing the Value of Transit, Center for Transit-Oriented Development (November 2008).
6 Projections of future retail market demand based on population growth are an “order of magnitude” estimate. A more detailed retail study, which would include a retail void analysis, detailed capture analysis, etc., is beyond the scope of this assignment.
7
9) OFFICE
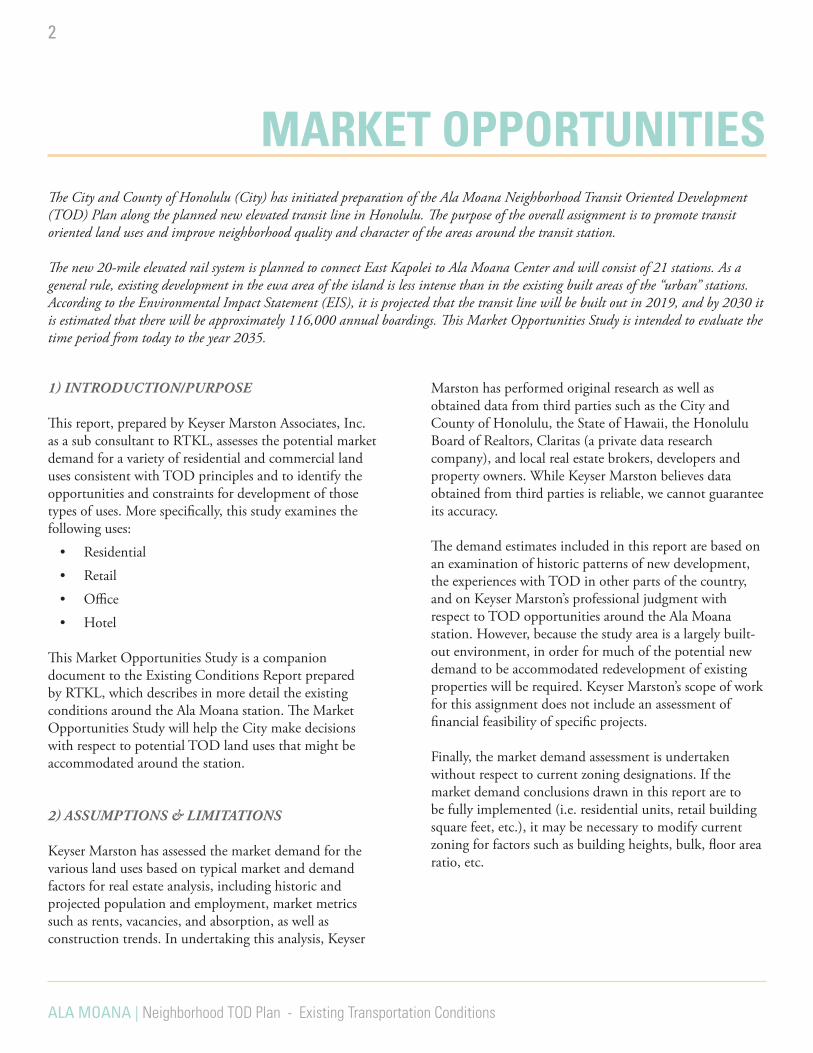
Historically, offi ce development in Honolulu has largely been concentrated in the central business district. Most of the offi ce development that has occurred in Honolulu occurred in the late 1980s and early 1990s and in fact, there hasn’t been a new multi-tenant offi ce building built in Honolulu since the First Hawaiian Center in 1996. Th e Ala Moana area is home to several mid-rise offi ce buildings including the Ala Moana offi ce building adjacent to the mall, Pacifi c Guardian Tower, and the offi ces for the Hawaii Medical Services Association (HMSA) on Keeaumoku.
Th e market fundamentals for offi ce space are not favorable at the current time. Th e central business district vacancy rate was about 15% as of the second quarter of 2012 and the average rent was about $2.90 per sq. ft. In the near term, there will likely be limited opportunities for new offi ce development given the high cost of construction and the slow recovery of the economy. As the economy stabilizes over the longer term and more healthy growth patterns return, there will likely be demand for new offi ce space which will in turn put upward pressure on offi ce rents. Given the central location of Ala Moana and other locational attributes previously mentioned, Ala Moana would be an attractive location for new offi ce space over the longer term, although the economics of new offi ce development would need to improve signifi cantly to compete with alternative uses such as condominiums.
Keyser Marston has estimated the amount of offi ce space that can be supported in the Ala Moana planning area based on City estimates of employment growth in those job sectors that typically demand offi ce space (such as fi nance, insurance, and real estate) and a local capture rate that recognizes the value of the new transit line. Based on these projections, it is projected that there could be demand for about 400,000 square feet of new offi ce space within the 0.5 mile planning area (see Table 12).
10) HOTEL
Only a few hotels are located within the 0.5 mile Ala Moana TOD planning area such as the Ala Moana Hotel and the Pagoda Hotel. Th ere are many large resort hotels just outside the planning area on the Waikiki side of the Ala Wai Canal. Given its convenient proximity to
Waikiki, Ala Moana Center, and the Convention Center, the Ala Moana area has the potential to capture new hotel development in the future. However, current zoning in the planning area does not permit new hotel development and therefore current zoning would have to change.
Th e Honolulu hotel industry is still recovering from the recession. Data from the Hawaii Tourism Authority indicates the number of annual visitors to Honolulu in 2011 (about 4.4 million) remains below the number in the years 2005 to 2007 (about 4.7 million), although the number has improved between 2009 and 2011 (see Table 13). Signifi cant improvement in tourism numbers going forward will require broad improvement in worldwide economic conditions, and particularly in the U.S. and Japan. New development of hotels will also require improvement in the capital markets, as fi nancing for new hotel construction has been extremely diffi cult to obtain since the fi nancial meltdown in 2008 and 2009.
As the number of visitors to Honolulu continues to increase, there will be a declining ability to accommodate that growth in Waikiki and there will be pressure in develop new hotels in nearby areas such as Ala Moana. KMA would anticipate that hotel use would be looked at seriously by developers as time goes on, assuming it will be permitted by modifi cations to current zoning. Th e number of hotel rooms that can ultimately be accommodated will depend upon the availability of developable sites and fi nancial feasibility. New hotel development might also take the form of condo-hotels in which condominium-hotel units are purchased by private owners (sometimes in fractional ownership) and put into a hotel rental pool and managed by a professional hotel operator. In such projects, market demand depends upon market conditions for both hotel and residential uses.
11) CONCLUSIONS
Given the locational strengths of Ala Moana and given the long term pressures of population, tourism and broader growth of the Honolulu economy, over the long term it is likely that there will be both market demand and suffi ciently high property values to support the construction of new Transit Oriented Development in the Ala Moana planning area. Based on existing conditions in Ala Moana, an assessment of market data and real estate conditions as summarized in this report, Keyser Marston

8
ALA MOANA | Neighborhood TOD Plan - Existing Transportation Conditions
believes the TOD might be supported in the Ala Moana planning area within the following broad ranges:
It is diffi cult to estimate the amount and timing of development that might occur in the planning area because there are a number of variables and considerations that are hard to predict or are beyond the scope of this assignment to analyze. Th ese considerations include:
Zoning – As noted earlier in this report, if the market demand conclusions drawn in this report are to be fully implemented, it may be necessary to modify current zoning for factors such as building heights, bulk, fl oor area ratio, etc.
Parcel Assemblage – In order to accommodate higher densities in the Ala Moana area, small parcels with individual owners will likely have to be assembled in order to create effi ciently sized development sites;
Existing Encumbrances – Many properties in the study area have existing property encumbrances (such as leases with existing businesses) that must run their course or be bought out before redevelopment can occur;
Need for Infrastructure – Th ere is a need for new public infrastructure improvements in some parts of the study area, the funding and timing for which is uncertain;
Economic Recovery – Th ere is a need for improvement in broader economic conditions in order to drive up values suffi cient to support high construction costs and land values
Since these factors cannot entirely be predicted, it is possible that not all market demand will necessarily translate into new development within this study’s 2035 timeframe.
From an implementation perspective, TOD can be encouraged if the City is able to adopt a consistent, well-coordinated set of policies that removes regulatory barriers, prioritizes key infrastructure improvements, and (to the extent possible) assists in lowering the costs of private development. Strategies that can be utilized to encourage successful TOD include:
• Lower parking requirements in TOD areas in order to encourage transit use and lower construction costs on new projects;
• Permit some fl exibility in development densities, heights, setback requirements, etc.;
• Coordinate and streamline fees and permits costs on new development and consider lowering fees if appropriate;
• Provide fl exibility in how aff ordable housing and park dedication requirements may be satisfi ed;
• Target some level of public fi nancial resources for the production of aff ordable housing so that households of all income ranges can benefi t from TOD;
• Consider use of tax increment fi nancing, community facilities district fi nancing, tax credits, and other fi nancing tools to invest in public infrastructure and increase the fi nancial feasibility of TOD, but only to the extent that private development cannot support itself;
• Consider public-private partnerships and joint development between the City and private developers to facilitate development consistent with TOD principles.
12) INDIVIDUALS INTERVIEWED
1. Christine Camp, Avalon Development
2. Michael Goshi, Design Partners Incorporated
3. Jackson Nakasone & Sheldon Glassco, Grubb & Ellis/CBI
4. Deepak Neupane, HCDA
5. Jay Ro, Samkoo Pacifi c

9
APPENDIX

10
ALA MOANA | Neighborhood TOD Plan - Existing Transportation Conditions
Table 1 Working DRAFTAla Moana Station Area - Demographic Trends and Projections - 0.5 Mile RadiusAla Moana Station Area TOD Market Study
2013 2018Demographic Statistics Estimate Projection
Population 15,884 17,314Households 8,419 9,164Families 3,702 4,047Housing Units 9,638 10,510Group Quarters Population 161 163
Average Household Size 1.87 1.87
2013 2018Households By Income Estimate % Projection %
Less than $34,999 3,581 42.53% 3,530 38.52%$35,000-$49,999 1,179 14.00% 1,171 12.78%$50,000-$74,999 1,281 15.21% 1,370 14.95%$74,000-99,999 995 11.82% 1,091 11.91%$100,000 or more 1,384 16.44% 2,001 21.84%
8,420 100.00% 9,163 100.00%
Average Household Income $63,328 $75,050
Median Household Income $43,000 $48,472
Source: Claritas

11
Table 2 Working DRAFTHonolulu County Largest EmployersAla Moana Station Area TOD Market Study
CountyRank
StateRank Employer
Number of Employees Industry
1 1 University of Hawaii 9,000 Colleges, Universities, and Professional Schools2 2 Kapiolani Medical Center 5,000 General Medical and Surgical Hospitals3 3 Kyo-Ya Co Ltd.1 4,000 Federal Government Contractors4 4 Hawaii Health Systems Foundation 3,400 Legislative Bodies5 5 Bank Of Hawaii 2,500 Commercial Banking6 6 Bank Of Hawaii Corp 2,100 Offices of Bank Holding Companies7 7 St Francis Healthcare System 2,100 Home Health Care Services8 8 Aloha Air Cargo 2,090 Scheduled Freight Air Transportation9 10 Honolulu Police Department 2,000 Police Protection10 11 Kaiser Permanente Medical 2,000 General Medical and Surgical Hospitals11 12 Straub Clinic & Hospital 1,900 General Medical and Surgical Hospitals12 13 Hilton-Hawaiian Village Beach 1,800 Hotels (except Casino Hotels) and Motels13 14 Polynesian Cultural Center 1,700 Nature Parks and Other Similar Institutions14 15 Outrigger Enterprises Group 1,600 Hotels (except Casino Hotels) and Motels15 16 Hawaii Medical Service Association 1,500 Insurance Agencies and Brokerages16 17 Honolulu Intl Airport-Hnl 1,500 Other Airport Operations17 18 Oahu Transit Service 1,431 Other Urban Transit Systems18 19 Adjutant General 1,400 State Government-National Security19 21 Roberts Overnighters 1,400 Travel Agencies & Bureaus20 22 Kuakini Emergency Service 1,300 General Medical and Surgical Hospitals21 24 Kaimuki Toyota/Suzuki 1,200 Automobile Dealers-New Cars22 25 Kapi'Olani Health 1,200 All Other Miscellaneous Ambulatory Health Care Services23 26 Sheraton-Waikiki 1,200 Hotels (except Casino Hotels) and Motels24 27 Servco Pacific Inc 1,100 Offices of Real Estate Agents and Brokers25 28 Castle Medical Ctr 1,000 General Medical and Surgical Hospitals26 30 Honolulu Environmental Services 1,000 City Government-Environmental Programs27 31 Kuakini Health System 1,000 All Other Miscellaneous Ambulatory Health Care Services28 33 Royal Hawaiian Hotel 1,000 Hotels (except Casino Hotels) and Motels29 34 Servco Mapunapuna Plaza 1,000 Automobile Dealers-New Cars30 35 Sheraton-Princess Kaiulani 1,000 Hotels (except Casino Hotels) and Motels31 36 Thomas Hale Hamilton Library 1,000 Libraries-Public32 39 Hale Koa Hotel 900 Hotels (except Casino Hotels) and Motels33 41 Hyatt Regency-Waikiki Resort 875 Hotels (except Casino Hotels) and Motels34 44 Halekulani-Orchids 800 Hotels (except Casino Hotels) and Motels35 45 Hawaii Newspaper Agency Inc 800 Newspaper Publishers36 46 Hawaiian Telcom 800 Wireless Telecommunications Carriers (except Satellite)37 48 Sheraton-Moana Surfrider 735 Hotels (except Casino Hotels) and Motels
Source: 50 Largest Employeers in State of Hawaii, CareerOneStop, U.S. Department of Labor, Employment and Training.
1 Owner of Princess Kaiulani Hotel, Moana Surfrider Hotel, Sheraton Waikiki Hotel,Royal Hawaiian Hotel, Sheraton Maui Hotel, and other restaurants and parking lots

12
ALA MOANA | Neighborhood TOD Plan - Existing Transportation Conditions
Tabl
e 3
Wor
king
DR
AFT
Empl
oym
ent (
Jobs
) Tre
nds
and
Proj
ectio
ns -
City
and
Cou
nty
of H
onol
ulu
Ala
Moa
na S
tatio
n A
rea
TOD
Mar
ket S
tudy
2000
2005
2010
2015
2020
2025
2030
2035
Prim
ary
Urb
an C
ente
rA
la M
oana
/Kak
aako
51,9
0056
,814
58,6
4462
,881
64,2
5865
,616
67,0
1068
,477
Res
t of P
UC
310,
940
324,
031
329,
440
336,
344
344,
085
350,
506
357,
304
364,
862
Tota
l Prim
ary
Urb
an C
ente
r36
2,84
038
0,84
538
8,08
439
9,22
540
8,34
341
6,12
242
4,31
443
3,33
9
Res
t of H
onol
ulu
City
and
Co.
138,
289
168,
963
173,
600
197,
958
212,
772
227,
841
241,
880
255,
041
Tota
l City
and
Cou
nty
501,
129
549,
808
561,
684
597,
183
621,
115
643,
963
666,
194
688,
380
As
% o
f Tot
al P
rimar
y U
rban
Cen
ter
Ala
Moa
na/K
akaa
ko14
.3%
14.9
%15
.1%
15.8
%15
.7%
15.8
%15
.8%
15.8
%R
est o
f PU
C85
.7%
85.1
%84
.9%
84.2
%84
.3%
84.2
%84
.2%
84.2
%
As
% o
f Tot
al C
ity a
nd C
ount
yA
la M
oana
/Kak
aako
10.4
%10
.3%
10.4
%10
.5%
10.3
%10
.2%
10.1
%9.
9%R
est o
f PU
C62
.0%
58.9
%58
.7%
56.3
%55
.4%
54.4
%53
.6%
53.0
%72
.4%
69.3
%69
.1%
66.9
%65
.7%
64.6
%63
.7%
63.0
%
Sou
rce:
Dep
artm
ent o
f Pla
nnin
g an
d P
erm
ittin
g

13
Table 4 Working DRAFTEmployment (Jobs) Trends and Projections by Industry - Primary Urban Center Ala Moana Station Area TOD Market Study
2000-2010 2010-2020 2020-2030Change Change Change
2000 2010 2020 2030 2035 Total % Total % Total %Ala Moana-Kakaako
Armed Forces 0 23 23 23 23 23 0 0% 0 0%Public Admin 2,976 3,067 3,184 3,327 3,395 91 3% 117 4% 143 4%Hotel 892 892 895 898 898 0 0% 3 0% 3 0%Agriculture 345 156 160 164 164 -189 -55% 4 3% 4 3%Transportation and Utilities 6,259 6,669 7,329 7,735 7,941 410 7% 660 10% 406 6%Industrial 3,133 3,133 3,133 3,133 3,133 0 0% 0 0% 0 0%Fin. Ins. & RE 5,947 5,405 5,433 5,454 5,505 -542 -9% 28 1% 21 0%Services 17,752 20,635 23,573 24,960 25,641 2,883 16% 2,938 14% 1,387 6%Retail 13,323 14,957 16,468 17,073 17,409 1,634 12% 1,511 10% 605 4%Construction 1,273 3,707 4,060 4,243 4,368 2,434 191% 353 10% 183 5%Total 51,900 58,644 64,258 67,010 68,477 6,744 13% 5,614 10% 2,752 4%
Rest of PUCArmed Forces 14,780 15,220 15,214 15,214 15,214 440 3% -6 0% 0 0%Public Admin 24,663 25,309 26,085 27,005 27,479 646 3% 776 3% 920 4%Hotel 14,350 14,406 14,744 14,789 14,802 56 0% 338 2% 45 0%Agriculture 1,047 467 486 489 494 -580 -55% 19 4% 3 1%Transportation ad Utilities 28,281 30,450 33,740 35,782 36,850 2,169 8% 3,290 11% 2,042 6%Industrial 21,498 21,469 21,469 21,469 21,469 -29 0% 0 0% 0 0%Fin. Ins. & RE 21,726 19,748 19,841 19,934 20,112 -1,978 -9% 93 0% 93 0%Services 116,695 131,327 140,774 149,114 153,210 14,632 13% 9,447 7% 8,340 6%Retail 57,605 59,262 60,868 61,709 62,780 1,657 3% 1,606 3% 841 1%Construction 10,295 11,782 10,864 11,799 12,452 1,487 14% -918 -8% 935 9%Total 310,940 329,440 344,085 357,304 364,862 18,500 6% 14,645 4% 13,219 4%
Primary Urban Center (PUC)Armed Forces 14,780 15,243 15,237 15,237 15,237 463 3% -6 0% 0 0%Public Admin 27,639 28,376 29,269 30,332 30,874 737 3% 893 3% 1,063 4%Hotel 15,242 15,298 15,639 15,687 15,700 56 0% 341 2% 48 0%Agriculture 1,392 623 646 653 658 -769 -55% 23 4% 7 1%Transportation ad Utilities 34,540 37,119 41,069 43,517 44,791 2,579 7% 3,950 11% 2,448 6%Industrial 24,631 24,602 24,602 24,602 24,602 -29 0% 0 0% 0 0%Fin. Ins. & RE 27,673 25,153 25,274 25,388 25,617 -2,520 -9% 121 0% 114 0%Services 134,447 151,962 164,347 174,074 178,851 17,515 13% 12,385 8% 9,727 6%Retail 70,928 74,219 77,336 78,782 80,189 3,291 5% 3,117 4% 1,446 2%Construction 11,568 15,489 14,924 16,042 16,820 3,921 34% -565 -4% 1,118 7%Total 362,840 388,084 408,343 424,314 433,339 25,244 7% 20,259 5% 15,971 4%
Source: City and County of Honolulu Department of Planning and Permitting

14
ALA MOANA | Neighborhood TOD Plan - Existing Transportation Conditions
Table 5 Working DRAFTResidential Building Permits 1980-2011 - City and County of HonoluluHonolulu TOD Market Study
Year TotalUnits
Units in Single-Family
Structures
Units in All Multi-Family
Structures
Units in 2-unit Multi-FamilyStructures
Units in 3- and 4-unit Multi-Family
Structures
Units in 5+ Unit Multi-FamilyStructures
1980 4,952 1,599 3,353 46 256 3,0511981 2,617 688 1,929 44 113 1,7721982 3,223 700 2,523 30 72 2,4211983 2,852 1,568 1,284 64 69 1,1511984 3,255 2,199 1,056 112 81 8631985 4,307 2,314 1,993 112 183 1,6981986 4,115 2,021 2,094 108 67 1,9191987 3,569 2,670 899 120 34 7451988 3,286 1,945 1,341 170 183 9881989 3,458 1,582 1,876 114 140 1,6221990 2,977 1,524 1,453 126 85 1,2421991 4,118 1,203 2,915 50 116 2,7491992 4,588 1,793 2,795 42 148 2,6051993 3,411 1,916 1,495 62 59 1,3741994 4,612 2,440 2,172 76 66 2,0301995 4,544 2,090 2,454 64 76 2,3141996 2,000 1,125 875 34 0 8411997 2,035 1,141 894 38 23 8331998 1,601 1,272 329 20 16 2931999 1,928 1,449 479 0 21 4582000 1,969 1,732 237 4 0 2332001 1,975 1,673 302 10 39 2532002 2,673 1,964 709 12 67 6302003 3,473 2,910 563 84 12 4672004 4,084 1,898 2,186 8 108 2,0702005 3,988 2,079 1,909 0 160 1,7492006 2,606 1,727 879 0 0 8792007 2,944 1,152 1,792 0 148 1,6442008 1,438 780 658 2 21 6352009 1,036 862 174 8 20 1462010 1,891 879 1012 10 0 10022011 1,724 734 990 0 9 981
1980-89Total 35,634 17,286 18,348 920 1198 16,230Avg/Yr 3,563 1,729 1,835 92 119.8 1,623
1990-99Total 31,814 15,953 15,861 512 610 14,739Avg/Yr 3,181 1,595 1,586 51 61 1,474
2000-2009Total 26,186 16,777 9,409 128 575 8,706Avg/Yr 2,619 1,678 941 13 57.5 871
Source: State of the Cities Data System, HUD
0
500
1,000
1,500
2,000
2,500
3,000
3,500
1990 1991 1992 1993 1994 1995 1996 1997 1998 1999 2000 2001 2002 2003 2004 2005 2006 2007 2008 2009 2010 2011
Units in Single-Family Structures
Units in All Multi-Family Structures

15
Table 6 Working DRAFTResidential For-Sale Market Trends - City and County of HonoluluAla Moana Station Area TOD Market Study
Annual Unit Sales
Median Sales Price of Residential Properties
Source: Honolulu Board of Realtors
0
1,000
2,000
3,000
4,000
5,000
6,000
7,000
8,000
9,000
2000
2001
2002
2003
2004
2005
2006
2007
2008
2009
2010
2011
Num
ber o
f Sal
es
Condominiums
Single Family
$0
$100,000
$200,000
$300,000
$400,000
$500,000
$600,000
$700,000
2000
2001
2002
2003
2004
2005
2006
2007
2008
2009
2010
2011
Med
ian
Sal
es P
rice
Condominiums
Single Family
Keyser Marston Associates Inc

16
ALA MOANA | Neighborhood TOD Plan - Existing Transportation Conditions
Table 7 Working DRAFTCondominiums For-Sale Market Trends - Select NeighborhoodsAla Moana Station Area TOD Market Study
Annual Condominium Resales Activity, by Neighborhood
Median Sales Price of Condominiums, by Neighborhood
Source: Honolulu Board of Realtors
-
200
400
600
800
1,000
1,200
1,400
1,600
2000 2001 2002 2003 2004 2005 2006 2007 2008 2009 2010 2011
Con
dom
iniu
m S
ales
Downtown-Nuuanu Ala Moana-Kakaako Waikiki
$0
$100,000
$200,000
$300,000
$400,000
$500,000
$600,000
2000 2001 2002 2003 2004 2005 2006 2007 2008 2009 2010 2011
Med
ian
Sale
s Pr
ice
Downtown-Nuuanu Ala Moana-Kakaako Waikiki

17Ta
ble
8W
orki
ng D
RA
FTR
etai
l Mar
ket T
rend
s by
Ret
ail T
ype,
City
and
Cou
nty
of H
onol
ulu
Ala
Moa
na S
tatio
n A
rea
TOD
Mar
ket S
tudy
Tota
l Inv
ento
ry (S
F)Va
canc
y R
ate
Net
Abs
orpt
ion
(SF)
2009
2010
2011
2009
2010
2011
2009
2010
2011
Com
mun
ity/P
ower
Cen
ter
2,70
3,83
82,
703,
838
2,71
7,69
34.
79%
4.55
%5.
60%
343,
098
6,45
5(2
8,99
7)
Nei
ghbo
rhoo
d3,
627,
044
3,68
9,83
13,
689,
831
2.44
%3.
36%
3.09
%13
3,57
8(2
7,83
1)9,
779
Reg
iona
l*4,
418,
985
4,41
8,98
54,
418,
985
2.39
%1.
61%
2.33
%(6
6,85
6)34
,803
(31,
932)
Res
ort/S
peci
alty
1,34
1,58
41,
341,
584
1,44
1,45
46.
27%
9.14
%8.
18%
11,8
87(3
8,45
2)74
,026
Stri
p17
7,18
817
7,18
817
7,18
810
.08%
12.7
1%16
.47%
(237
)(4
,648
)3,
417
Tota
ls12
,268
,639
12,3
31,4
2612
,445
,151
3.47
%3.
75%
4.15
%42
1,47
0(2
9,67
3)26
,293
Avg
. Low
NN
N A
skin
g R
ents
Avg
. Hig
h N
NN
Ask
ing
Ren
tsA
vg. C
AM
Exp
ense
s
2009
2010
2011
2009
2010
2011
2009
2010
2011
Com
mun
ity/P
ower
Cen
ter
$3.6
4$3
.38
$3.2
4$4
.53
$4.2
5$4
.25
$1.1
0$1
.14
$1.1
4
Nei
ghbo
rhoo
d$2
.97
$2.8
7$2
.78
$3.8
9$3
.78
$3.5
9$0
.97
$0.9
6$1
.00
Reg
iona
l*$2
.69
$2.9
2$2
.77
$4.2
9$9
.98
$9.4
0$1
.83
$1.8
9$6
.08
Res
ort/S
peci
alty
$4.3
3$4
.13
$4.4
5$1
4.10
$12.
96$1
2.98
$2.1
9$1
.90
$1.8
9
Stri
p$3
.37
$3.2
8$3
.04
$4.0
8$4
.16
$4.2
9$1
.03
$1.1
6$1
.19
Tota
ls**
$3.0
8$2
.94
$2.8
7$4
.05
$3.9
2$3
.88
$1.1
0$1
.09
$1.1
0
Sou
rce:
Col
liers
Mon
roe
Frie
dlan
der 2
009
and
2010
; Col
liers
Inte
rnat
iona
l 201
1.*
Inc
lude
s A
la M
oana
Cen
ter i
n C
alcu
latio
ns**
Isla
ndw
ide
tota
l for
ave
rage
rent
s an
d C
AM
cal
cula
tions
exc
lude
Wai
kiki
and
Ala
Moa
na S
hopp
ing
Cen
ter
18
ALA MOANA | Neighborhood TOD Plan - Existing Transportation Conditions
Table 9 Working DRAFTHousehold Spending Patterns and Opportunity Gap AnalysisAla Moana Station Area TOD Market Study
2012 Household Retail Expenditures and Retail Sales (0.5 Mile Radius)
Expenditures Retail Sales Opportunityper Household 2 per Household 2 Gap/Surplus 3
Apparel and Accessories, Furniture and Other 1 $3,160 $77,440 ($74,280)Health and Personal Care Stores $1,750 $11,630 ($9,880)Foodservice and Drinking Places $3,070 $26,570 ($23,500)Grocery Stores and Liquor Stores $3,880 $8,650 ($4,770)
Supportable Additional Retail Space 2010-2035 (0.5 Mile Radius)
Total Growth in Households (2013 - 2035) 4 3,000
Retail Space Supported by: Total RetailArea HH Outside Demand Space DemandSq. Ft. 5 Sq. Ft. 5 Sq. Ft. 5
Apparel and Accessories, Furniture and Other 1 16,000 382,000 398,000Health and Personal Care Stores 13,000 0 13,000Foodservice and Drinking Places 16,000 123,000 139,000Grocery Stores and Liquor Stores 23,000 29,000 52,000
68,000 534,000 602,000
1
2 Based on data from Claritas.3
4 Estimated by KMA.5
Includes clothing and clothing accessories stores, sporting goods, hobby, book and music stores, office supplies, stationary, and gift stores.
The difference between expenditures and sales represents the opportunity gap or surplus - a positive value signifies an opportunity gap while a negative value signifies a surplus.
Estimated by KMA. Assumptions for sales per square foot and local capture rates based on industry trends and localconditions.

19
Table 10 Working DRAFTClass A Office Market Snapshot (Select Properties) - Central Business District - Q2 2012Ala Moana Station Area TOD Market Study
OperatingBuilding Low High Expenses
SF $/SF/Mo. $/SF/Mo. $/SF/Mo. VacancyAlii Place 316,040 $3.01 $3.16 $1.26 7.3%Bishop Place 462,072 $2.62 $2.77 $1.42 11.3%Bishop Square / ASB Tower 483,455 $2.69 $2.89 $1.39 8.5%Bishop Square / Pauahi Tower 438,596 $2.74 $2.89 $1.39 18.2%Central Pacific Plaza 209,821 $3.07 $3.07 $1.42 4.1%City Financial Tower 180,563 $2.72 $2.72 $1.32 13.1%Davies Pacific Center 354,322 $2.45 $3.10 $1.45 24.3%First Hawaiian Center 379,336 $3.32 $3.32 $1.32 12.5%Harbour Court - Office Tower 186,138 $2.90 $3.10 $1.38 16.7%Pacific Guardian Center 632,136 $2.85 $2.95 $1.37 17.6%Pioneer Plaza 245,000 $2.72 $3.20 $1.35 11.9%TOPA Financial Center 483,776 $2.75 $3.00 $1.50 16.6%Waterfront Plaza (Office Portion) 455,600 $2.99 $3.14 $1.49 10.3%
4,826,855Average $2.84 $3.07 $1.39 14.6%
Range $2.45 $3.75
CBD Class A Office Vacancy Rate
Source: Hawaii Commercial Real Estate, LLC
Asking FSG Rents
15.0% 15.1% 14.6%
10.9%12.1%
14.0%13.2% 12.8%
9.8%
7.6%
9.2%
10.7%9.8%
12.6%
14.4% 14.6%
0.0%
2.0%
4.0%
6.0%
8.0%
10.0%
12.0%
14.0%
16.0%
YE '97 YE '98 YE '99 YE '00 YE '01 YE '02 YE '03 YE '04 YE '05 YE '06 YE '07 YE '08 YE '09 YE '10 YE '11 Q2 '12

20
ALA MOANA | Neighborhood TOD Plan - Existing Transportation Conditions
Table 11 Working DRAFTOffice Market Trends - City and County of HonoluluAla Moana Station Area TOD Market Study
Vacancy Trends (Q3 2010 through Q2 2012)Total SF No. Bldg. 3Q2010 4Q2010 1Q2011 2Q2011 3Q2011 4Q2011 1Q2012 2Q2012
Airport 575,042 4 19.6% 16.4% 18.7% 18.2% 14.0% 14.8% 13.1% 15.4%CBD 5,727,241 24 12.9% 13.6% 14.2% 14.9% 14.8% 15.3% 16.1% 15.8%East Oahu 257,586 6 6.0% 5.2% 2.4% 3.3% 3.6% 5.7% 5.4% 4.9%Kakaako 1,338,687 6 5.5% 6.1% 6.5% 7.3% 8.9% 8.1% 7.6% 8.3%Kalihi/Iwilei 569,529 4 9.8% 10.5% 13.3% 15.3% 15.0% 14.5% 14.0% 12.4%Kapiolani 1,249,565 9 11.1% 10.3% 9.1% 9.9% 10.5% 11.2% 10.1% 9.9%King 78,547 2 8.8% 20.3% 21.8% 22.0% 20.0% 20.0% 21.0% 23.4%Leeward 603,712 8 0.9% 2.7% 7.7% 10.4% 15.1% 15.2% 16.5% 21.5%Waikiki 782,395 7 18.3% 20.9% 21.4% 23.1% 24.0% 25.4% 25.6% 26.9%Windward Oahu 110,165 3 8.9% 7.4% 5.0% 5.0% 10.1% 14.2% 12.7% 12.4%
Total 11,292,469 73 11.5% 12.1% 12.8% 13.6% 14.0% 14.4% 14.6% 14.9%
Average Lease Rates (FSG/SF/Mo)Total SF Avg. rate 3Q2010 4Q2010 1Q2011 2Q2011 3Q2011 4Q2011 1Q2012 2Q2012
Airport 575,042 $2.47 $2.42 $2.46 $2.48 $2.53 $2.51 $2.51 $2.43 $2.51CBD 5,727,241 $2.74 $2.68 $2.68 $2.68 $2.68 $2.68 $2.68 $2.70 $2.94East Oahu 257,586 $3.38 $3.32 $3.67 $3.32 $3.32 $3.32 $3.32 $3.37 $3.22Kakaako 1,338,687 $3.24 $3.26 $3.26 $3.26 $3.26 $3.25 $3.03 $3.04 $2.99Kalihi/Iwilei 569,529 $2.46 $2.48 $2.41 $2.67 $2.67 $2.67 $2.41 $2.44 $2.45Kapiolani 1,249,565 $3.42 $3.32 $3.29 $3.34 $3.34 $3.34 $3.34 $3.43 $3.42King 78,547 $2.77 $2.77 $2.77 $2.59 $2.59 $2.59 $2.61 $2.61 $2.61Leeward 603,712 $3.59 $3.51 $3.51 $3.51 $3.51 $3.42 $3.42 $3.44 $3.69Waikiki 782,395 $2.95 $2.85 $2.85 $2.85 $2.85 $2.85 $2.85 $3.05 $3.15Windward Oahu 110,165 $3.10 $3.05 $3.05 $3.06 $3.06 $3.19 $3.19 $3.21 $3.21
Total 11,292,469 $3.01 $2.96 $2.99 $2.97 $2.98 $2.98 $2.93 $2.97 $3.02
Net Absorption Q3 2010 - Q2 2012
Source: Hawaii Commercial Real Estate, LLC
(120,000)
(100,000)
(80,000)
(60,000)
(40,000)
(20,000)
0
20,000
40,000
3Q2010 4Q2010 1Q2011 2Q2011 3Q2011 4Q2011 1Q2012 2Q2012
CBD
Other
Total

21
Table 12 Working DRAFTProject Area Projected Office Space DemandAla Moana Station Area TOD Market Study
Primary Urban Center Project AreaProjected Job
Growth 1Projected Office
Employment Office EmploymentIndustry 2010-2035 Share 2 2010-2035 Capture 3 2010-2035
Armed Forces -6 0% 0 0% 0Public Admin 2,498 80% 1,998 0% 0Hotel 402 7% 27 0% 0Agriculture 35 0% 0 0% 0Transportation and Utilities 7,672 10% 767 5% 38Industrial 0 10% 0 0% 0Fin. Ins. & RE 464 100% 464 5% 23Services 26,889 50% 13,445 10% 1,344Retail 5,970 5% 299 10% 30Construction 1,331 0% 0 0% 0
Total 45,255 17,000 1,436
2010-2035Total Office Space Demand (@250SF/Employee) 4 359,000
Plus Normal Vacancy (@ 10%) 4 35,900
Ala Moana Station Area Office Space Demand 394,900
1 Planning and Permitting Department. 2
3 Based on KMA's estimate of the Ala Moana's share of employment by industry.4 KMA Assumption.
Represents the percentage of employment in each industry that is likely to occupy office space. KMA assumption based on data from the 2008-18 National Employment Matrix by the Bureau of Labor Statistics.

22
ALA MOANA | Neighborhood TOD Plan - Existing Transportation Conditions
Tabl
e 13
Wor
king
DR
AFT
Tour
ism
Indu
stry
Tre
nds
- City
and
Cou
nty
of H
onol
ulu
Ala
Moa
na S
tatio
n A
rea
TOD
Mar
ket S
tudy
2000
2001
2002
2003
2004
2005
2006
2007
2008
2009
2010
2011
Tota
l Vis
itors
(tho
usan
ds)1
4,71
94,
258
4,27
64,
091
4,46
54,
732
4,68
84,
695
4,19
44,
025
4,27
44,
402
Vis
itor E
xpen
ditu
res
($m
illio
ns, c
urre
nt) 2
$4,6
28$5
,384
$5,6
43$5
,623
$5,7
12$5
,626
$5,0
11$5
,501
$6,2
58R
oom
Sto
ck (t
hous
ands
) 336
.336
.836
.535
.535
.833
.933
.633
.634
.134
.033
.835
.0A
vera
ge L
engt
h of
Sta
y (D
omes
tic) 4
7.5
7.7
7.8
8.2
7.8
7.6
7.4
7.3
7.8
7.9
8.0
11.3
Ave
rage
Len
gth
of S
tay
(Inte
rnat
iona
l) 4
5.8
5.9
5.9
6.0
5.9
5.8
5.7
5.8
6.1
6.5
6.5
6.7
Long
Ter
m V
isito
r Tre
nds
Sou
rce:
Haw
aii T
ouris
m A
utho
rity.
Acc
esse
d V
ia U
nive
rsity
of H
awai
i Eco
nom
ic R
esea
ch O
rgan
izat
ion
(UH
ER
O).
1To
tal V
isito
r Arr
ival
s2
Cur
rent
Dol
lars
3To
tal V
isito
r Acc
omm
odat
ions
. Sum
of h
otel
s, c
ondo
min
ium
hot
els,
tim
esha
re u
nits
, ind
ivid
ual v
acat
ion
units
, bed
& b
reak
fast
s, h
oste
ls, a
nd o
ther
s.4
Vis
itor D
ays
Div
ided
by
Vis
itor A
rriv
als
0500
1,00
0
1,50
0
2,00
0
2,50
0
3,00
0
3,50
0
4,00
0
4,50
0
5,00
0
-15.
00%
-10.
00%
-5.0
0%
0.00
%
5.00
%
10.0
0%
15.0
0%
2000
2001
2002
2003
2004
2005
2006
2007
2008
2009
2010
2011
Visitors (Thousands)
Annual % Change
% C
hang
e
Tota
l Vis
itors

23
Table 14 Working DRAFTHotel Trends - City and County of HonoluluAla Moana Station Area TOD Market Study
Occupancy Rates
Average Daily Rate (ADR)
Average Daily Rate per Available Room (RevPAR)
Source:PKF
0.65
0.7
0.75
0.8
0.85
0.9
2006 2007 2008 2009 2010 2011F 2012F 2013F 2014F 2015F
All HotelsUpper-Priced HotelsLower-Priced Hotels
0
50
100
150
200
250
2006 2007 2008 2009 2010 2011F 2012F 2013F 2014F 2015F
All HotelsUpper-Priced HotelsLower-Priced Hotels
0
50
100
150
200
250
2006 2007 2008 2009 2010 2011F 2012F 2013F 2014F 2015F
All HotelsUpper-Priced HotelsLower-Priced Hotels