Embed Size (px)
Citation preview
1
AL Pictoris and FR Piscis: two regular Blazhko RR Lyrae stars
Pierre de Ponthière 1
15 Rue Pré Mathy, Lesve – Profondeville 5170 – Belgium; address email correspondence to [email protected]
Franz-Josef (Josch) Hambsch 1,2,3
12 Oude Bleken, Mol, 2400 - Belgium
Kenneth Menzies 1
318A Potter Road, Framingham MA,01701 – USA
Richard Sabo 1
2336 Trailcrest Drive, Bozeman MT, 59718 - USA
1 American Association of Variable Star Observers (AAVSO)
2 Bundesdeutsche Arbeitsgemeinschaft für Veränderliche Sterne e.V. (BAV), Germany 3Vereniging Voor Sterrenkunde (VVS), Belgium
Abstract The results presented are a continuation of observing campaigns conducted by a small group of amateur astronomers
interested in the Blazhko effect of RR Lyrae stars. The goal of these observations is to confirm the RR Lyrae
Blazhko effect and to detect any additional Blazhko modulation which cannot be identified from all sky survey data-
mining. The Blazhko effect of the two observed stars is confirmed, but no additional Blazhko modulations have
been detected.
The observation of the RR Lyrae star AL Pic during 169 nights was conducted from San Pedro de Atacama (Chile).
From the observed light curve, 49 pulsation maxima have been measured. Fourier analyses of (O-C), magnitude at
maximum light (Mmax) and the complete light curve have provided a confirmation of published pulsation and
Blazhko periods, 0.548622 and 34.07 days, respectively. The second multi-longitude observation campaign focused
on the RR Lyrae star FR Psc was performed from Europe, United States and Chile. Fourier analyses of the light
curve and of 59 measured brightness maxima have improved the accuracy of pulsation and Blazhko periods which
are 0.45568 and 51.31 days, respectively. For both stars, no additional Blazhko modulations have been detected.
1. Introduction The data-mining of automated sky surveys like All Sky Automated Survey - ASAS (Wils and Sódor 2005) and
Northern Sky Variability Survey - NSVS (Wils et al. 2006) is frequently used to discover new RR Lyrae stars and to
measure their pulsation periods and for some of them to detect and measure Blazhko modulation. Automated sky
surveys with their low sampling frequencies (at best one sample per night) generate sparse datasets. As a result,
spectral analysis of the datasets is not always fully reliable. Some Blazhko modulation periods are published as
uncertain and multiple Blazhko modulations are not always detected. To overcome those shortcomings, more
observations of identified RR Lyrae stars are required. Detailed study of long time-series observations allows the
identification of individual brightness maxima of the light curve and other light curve details. The spectral analysis
of the rich time-series is able to characterize the Blazhko modulation(s) in detail.
The results of observing campaigns presented herein are related to two RR Lyrae stars exhibiting the Blazhko effect,
AL Pic and FR Psc, discovered respectively from ASAS and NSVS surveys (Wils and Sódor 2005 and Wils et al.
2006).
The designation of AL Pic appeared in the General Catalogue of Variable Stars with the 79th
Name List of Variable
Stars (Kazarovets et al. 2008), and previously this star was identified as GSC 8082-0469, NSV 1700 and
ASAS J044131-5216.6. From the All Sky Automated Survey database, Wils and Sódor (2005) measured a pulsation
period of 0.54861 day and also a Blazhko period of 34.0 days. The results presented herein are derived from data
gathered during 169 nights between July 17, 2012 and February 1, 2013. A total of 17,416 magnitude measurements
2
covering 5.8 Blazhko cycles were collected. All the observations were made by Franz-Josef Hambsch using
remotely a 40 cm f/6.8 telescope located in San Pedro de Atacama (Chile).
The designation of FR Psc appeared in the General Catalogue of Variable Stars with the first part of 80th
Name List
of Variable Stars (Kazarovets et al. 2011). This star was previously identified as GSC 0607-0591 and NSV
9149730. From the Northern Sky Variability Survey data (Wozniak et al. 2004), Wils et al. (2006) have measured a
pulsation period of 0.45570 days and an uncertain Blazhko period of 55 days. Our observations were made between
August 18, 2012 and December 30, 2013. During the 126 observation nights, a total of 12,653 observations have
been made by Franz-Josef Hambsch from Cloudcroft (NM) and from San Pedro de Atacama (Chile), by Richard
Sabo from Bozeman (Montana), Kenneth Menzies from Framingham (MA) and Pierre de Ponthière from Lesve
(Belgium). The numbers of observations for the different locations are 3597, 7272, 1106, 146 and 532, respectively.
For images of both stars, dark and flat field corrections were performed with MAXIMDL software (Diffraction Limited,
2004), and aperture photometry was performed using LESVEPHOTOMETRY (de Ponthière, 2010), a custom software
which also evaluates the SNR and estimates magnitude errors. The photometric observations of both stars are
available in the AAVSO International Database (AAVSO, 2014).
AL Pic observations were performed with only a V filter and are not transformed to the standard system. The
comparison stars are given in Table 1, their coordinates and magnitudes in B and V bands were obtained from the
AAVSO’s Variable Star Database (VSD). The observations have been reduced with C1 as a magnitude reference
and C2 as a check star.
The observations of FR Psc were also performed with a V filter and are not transformed to the standard system.
The comparison star coordinates and magnitudes in B and V bands were extracted from the AAVSO APASS survey
and are given in Table 8. All observations, except from Cloudcroft, were reduced with C1 as magnitude reference
and C2 as check star. Cloudcroft observations were reduced with C2 and C3 as reference and comparison stars. A
correction of 0.021 magnitude has been applied to Cloudcroft observations. This correction has been calculated from
the magnitude difference of C3 when measured with C1 and C2 as magnitude references.
2. Light curve maxima analyses The times of maxima of the light curves have been evaluated with custom software (de Ponthiere, 2010) fitting the
light curve with a smoothing spline function (Reinsch, 1967).
2.1 AL Pic
A total of 49 maxima have been observed for AL Pic. Table 2 provides the list of the observed maxima and Figure 1
shows the (O-C) and Mmax (Magnitude at Maximum) values. A linear regression of all available (O-C) values has
provided a pulsation period of 0.548549 d (1.822858 d-1
). The (O-C) values have been re-evaluated with this new
pulsation period and the pulsation ephemeris origin has been set to the highest recorded brightness maximum: HJD
2 456 154.7560. The new derived pulsation elements are:
HJDPulsation = (2 456 154.7560 ± 0.0080) + (0.548549 ± 0.000044) EPulsation
The derived pulsation period is in good agreement with the value of 0.54861 published by Wils and Sódor (2005).
The folded light curve on the newly determined pulsation period is shown in Figure 2.
To determine the Blazhko period, Fourier analyses and sine-wave fittings of the (O-C) values and Mmax (Magnitude
at Maximum) values were performed with PERIOD04 (Lenz and Breger 2005). These analyses were limited to the three
first harmonic components and are given in Table 3. The frequency uncertainties have been evaluated from the
Monte Carlo simulation module of PERIOD04. The Blazhko periods obtained from (O-C) and Mmax are 34.23 ± 0.12
and 34.03 ± 0.07 days, respectively, which are in reasonable agreement. On this basis the best Blazhko ephemeris is
HJDBlazhko = 2456154.75 + (34.03 ± 0.07) EBlazhko
3
The origin has been selected as the epoch of the highest recorded maximum. The (O-C) and Mmax curves folded with
this Blazhko period are given in Figure 3. The variations of (O-C) and Mmax over the Blazhko cycles are respectively
0.097 day and 0.639 mag.
2.2 FR Psc
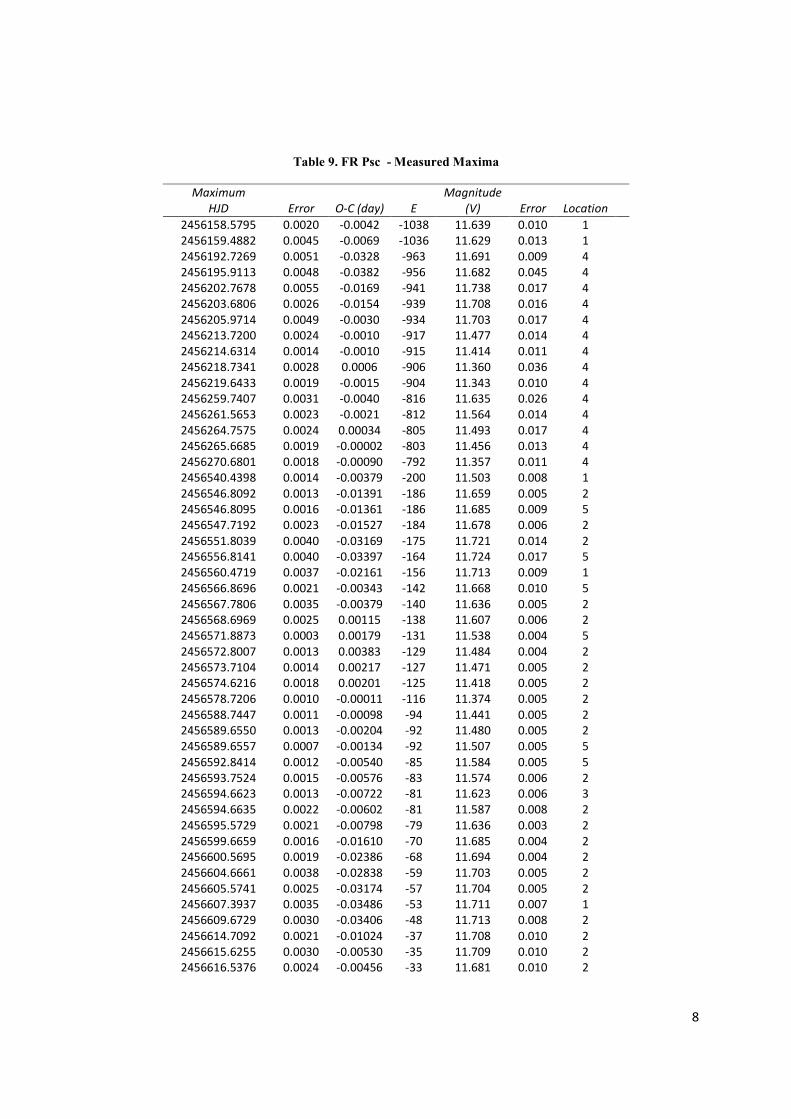
For FR Psc, the 59 observed maxima are listed in Table 9 and the graphs of (O-C) and Mmax values versus time
(HJD) are given in Figure 6. A pulsation period of 0.4555800 d (2.1945223 d-1
) was derived from a linear
regression of the (O-C) values. The (O-C) values have been re-evaluated with this new pulsation period and the
pulsation ephemeris origin has been set to the highest recorded brightness maximum: HJD 2 456 631.5796. The
new derived pulsation elements are:
HJDPulsation = (2 456 631.5796 ± 0.0021) + (0.4556800 ± 0.0000042) EPulsation
The calculated pulsation period is very close to the value of 0.45570 day published by Wils et al. (2006). The
Blazhko amplitude and phase modulations are clearly visible in Figure 7 which presents the graph of the light curve
folded with the pulsation period.
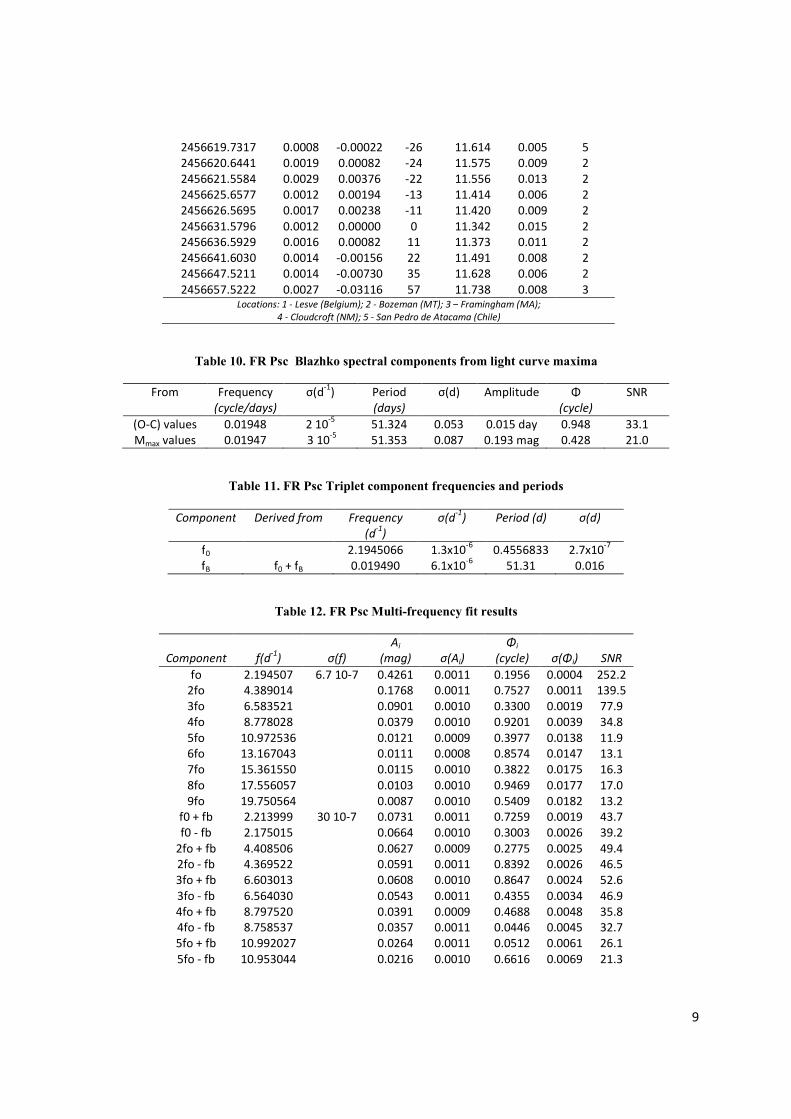
The Blazhko period has been measured with PERIOD04 in the same way as for AL Pic. The results are given in Table
10. The Blazhko periods, from (O-C) and Mmax are 51.32 ± 0.05and 51.35 ± 0.09 days, respectively and agree within
the errors. The Blazhko period of 55 days reported as uncertain by Wils et al. (2006) is slightly longer and not
compatible with our improved results. The best Blazhko ephemeris is:
HJDBlazhko = 2 456 631.58 + (51.32 ± 0.05) EBlazhko
The (O-C) and Mmax curves folded with the Blazhko period are given in Figure 8. The (O-C) and Mmax curves are
anti-correlated and their shapes are very similar to the corresponding curves of AL Pic. The variations of (O-C) and
Mmax over the Blazhko cycles are 0.042 day and 0.396 mag, respectively.
3. Frequency spectrum analyses of the light curve For both AL Pic and FR Psc, the primary pulsations and Blazhko frequency have been derived from Mmax and (O-C)
analyses. The Blazhko modulation frequencies appear clearly in the spectrum of the complete light curves. The
method used for spectrum analysis has already been detailed in other observation reports (de Ponthiere et al. 2014),
but the method is nevertheless briefly recalled here.
The spectrum of a signal modulated in amplitude and phase is characterized by a pattern of peaks called multiplets at
the positions kf0 ± nfB with k and n being integer numbers corresponding respectively to the harmonic and multiplet
orders. The frequencies, amplitudes and phases of the multiplets have been obtained with PERIOD04 by performing a
succession of Fourier analyses, pre-whitenings and sine-wave fittings. Only the harmonic and multiplet components
having a signal to noise ratio (SNR) greater than 4 have been retained as significant signals. Tables 5 and 12, for AL
Pic and FR Psc, respectively, provide the complete lists of Fourier components with their amplitudes, phases and
uncertainties. For both stars, besides the pulsation frequency f0 and harmonics nf0, one series of triplets nf0 ± fB
based on the Blazhko frequency fB has been found. The Blazhko frequencies and corresponding periods are
tabulated in Tables 4 and 11 with their uncertainties. These Blazhko periods are close to the values obtained with the
Mmax analysis given in Tables 3 and 10.
During the sine-wave fitting, the fundamental frequencies f0 and triplet f0 + fB have been left unconstrained and the
other frequencies have been entered as combinations of these two frequencies. The uncertainties of frequencies,
amplitudes and phases have been estimated by Monte Carlo simulations. The amplitude and phase uncertainties
have been multiplied by a factor of two as it is known that the Monte Carlo simulations underestimate these
uncertainties (Kolenberg et al. 2009). Tables 6 and 13 list for each harmonic the amplitude ratios Ai/A1 and the
4
ratios usually used to characterize the Blazhko effect, that is, Ai+/A1 ; Ai
-/A1 ; Ri = A
+i / A
-i and asymmetries Qi =
(A+
i - A-i) / (A
+i + A
-i). In the present cases the side lobe amplitudes A
-i and A
+i are similar which leads to small
values for the Qi asymmetry ratios. Except for some higher order triplets of AL Pic, the asymmetry ratios are
positive (A+
i > A-i). For the majority of Blazhko stars, the Qi asymmetry ratios are larger and generally lie between
0.1 and 0.5 but smaller and negative values are not unusual (Alcock et al. 2003). The fact that first triplet values
(A+
1 , A-1) are larger for AL Pic (0.39 and 0.36) than for FR Psc values (0.17 and 0.16) is due to the relative strength
of Blazhko modulations and is consistent with the corresponding variations of the magnitudes at maximum light
provided in the preceding section (0.639 and 0.396 mag).
4. Light curve variations over Blazhko cycle Subdividing the data set into temporal subsets is a classical method to visualize and analyze the light curve
variations over the Blazhko cycle. For both stars, ten temporal subsets corresponding to the different Blazhko phase
intervals Ψi (i = 0 , 9) have been created using the epochs of the highest recorded maxima as the origins of the first
subset. The folded light curves for the ten subsets are presented in Figures 4 and 9. For AL Pic, the data cover
around six successive Blazhko cycles and are relatively well distributed over the different temporal subsets and
Blazhko cycles. The population percentage of data points varies between 7.7% and 12% for the ten temporal subsets
and between 8.4% and 30% for the six Blazhko cycles. The first and second observation seasons of FR Psc cover
around 2.6 and 2.3 Blazhko cycles, respectively. The observation data are also well distributed over the temporal
subsets, the population varying between 6.4% and 16%.
From a visual inspection of Figures 4 and 9, it is clear that the light curves are only affected by a small scatter during
the successive Blazhko cycles. This fact is not surprising, indeed for both stars only one Blazhko modulation
frequency has been detected in the spectrum analysis. Fourier analyses and Least-Square fittings have been
performed on the different temporal subsets. For the fundamental frequency and the first four harmonics the
amplitudes Ai and the epoch-independent phase differences (Φk1 = Φk - kΦk1) are given in Tables 7 and 14 and
plotted in Figures 5 and 10. The differences between maximal and minimal values of A1 over the Blazhko cycle for
AL Pic and FR Psc are 0.235 and 0.106 mag, respectively. The larger Ai value for AL Pic is a confirmation that the
Blazhko modulation is stronger for AL Pic than for FR Psc.
5. Conclusions The two analysis methods, maximum brightness and light curve Fourier analyses, have provided similar results for
both stars. No multiple or irregular Blazhko modulations have been detected and for the two stars the light curves
repeat from one cycle to another. The FR Psc Blazhko period was previously published as uncertain. The new
measured period value of 51.31 ± 0.02 days removes the uncertainty. The period of 34.07 ± 0.02 days for AL Pic is
in agreement with the previously published value. The objective of this small group of amateur astronomers is to
observe and to analyze Blazhko RR Lyrae stars with the hope of finding stars affected by irregular or multiple
Blazhko modulations. These two coordinated multi-longitude campaigns have not revealed such multiple
modulations. However, observers should continue their regular and coordinated multi-longitude observations to
precisely characterize Blazhko modulations in other RR Lyrae stars.
Acknowledgements Dr A. Henden, Director of AAVSO and the AAVSO are acknowledged for the use of AAVSOnet telescopes at
Cloudcroft (New Mexico, USA). The AAVSO Charts and Sequence Team is thanked for preparing the comparison
star sequences. The authors thank the referee for the comments and encouragements. This work has made use of The
International Variable Star Index (VSX) maintained by the AAVSO and the SIMBAD astronomical database
(http://simbad.u-strasbg.fr).
5
References
AAVSO, 2014, AAVSO International Database (AID) (http://www.aavso.org/aavso-international-database)
Alcock, C., et al. 2003, Astrophys. J., 598, 597.
de Ponthière, P. 2010, LESVEPHOTOMETRY, automatic photometry software (http://www.dppobservatory.net).
de Ponthière, P., et al. 2014, J. Amer. Assoc. Var. Star Obs., 42, 53 Diffraction Limited. 2004, MAXIMDL image processing software (http://www.cyanogen.com).
Kazarovets, E.V., et al. 2008 IBVS No. 5863
Kazarovets, E.V., et al. 2011 IBVS No. 5969
Kolenberg, K., et al. 2009, Mon. Not. Roy. Astron. Soc., 396, 263.
Lenz, P., and Breger, M. 2005, Commun. Asteroseismology, 146, 53.
Reinsch, C. H. 1967, Numer. Math., 10, 177.
Wils, P. and Sódor, A. 2005, IBVS No.5655
Wils, P., Lloyd, C., Bernhard, K. 2006, Mon. Not. Roy. Astron. Soc., 368, 1757.
Wozniak, P., et al. 2004, Astron. J., 127, 2436.
Table 1. AL Pic- Comparison stars
Identification
AAVSO R.A.
(2000) Dec (2000) B V B-V
AUID h m s ° ' "
GSC 8082-440 000-BKP-193 4:40:50.7 -52:22:27.4 12.608 12.006 0.602 C1
GSC 8082-564 000-BKP-194 4:42:14.3 -52:23:12.9 13.252 12.590 0.662 C2
Table 2. AL Pic - Measured Maxima
Maximum
HJD Error O-C (day) E
Magnitude
(V) Error
2456144.8755 0.0060 -0.0059 -18 13.2840 0.015
2456149.8190 0.0027 0.0003 -9 12.9820 0.012
2456150.9137 0.0020 -0.0022 -7 12.9020 0.010
2456154.7560 0.0030 0.0000 0 12.8060 0.011
2456155.8556 0.0026 0.0024 2 12.8710 0.011
2456160.7891 0.0040 -0.0014 11 13.1290 0.012
2456161.8840 0.0048 -0.0037 13 13.1720 0.013
2456167.8557 0.0049 -0.0664 24 13.3320 0.014
2456172.7790 0.0085 -0.0804 33 13.3760 0.019
2456177.7657 0.0059 -0.0310 42 13.3250 0.015
2456182.7317 0.0030 -0.0023 51 13.0730 0.012
2456183.8278 0.0043 -0.0034 53 13.0180 0.026
2456188.7707 0.0035 0.0022 62 12.8800 0.014
2456189.8658 0.0020 0.0001 64 12.8810 0.013
2456221.6849 0.0028 0.0010 122 12.8660 0.015
2456222.7875 0.0022 0.0065 124 12.8970 0.013
2456226.6283 0.0038 0.0071 131 13.0180 0.015
2456233.7125 0.0038 -0.0403 144 13.2920 0.016
2456234.8038 0.0068 -0.0462 146 13.3650 0.021
2456239.7063 0.0053 -0.0810 155 13.3470 0.017
2456240.8087 0.0079 -0.0758 157 13.4140 0.018
2456244.7041 0.0071 -0.0205 164 13.4160 0.017
2456245.8124 0.0048 -0.0094 166 13.3930 0.014
2456249.6738 0.0057 0.0119 173 13.1860 0.025
6
2456250.7666 0.0029 0.0075 175 13.1350 0.015
2456254.6044 0.0028 0.0052 182 12.8370 0.014
2456255.7034 0.0029 0.0070 184 12.8530 0.017
2456256.8042 0.0023 0.0106 186 12.8680 0.02
2456259.5492 0.0034 0.0127 191 12.9610 0.018
2456261.7435 0.0029 0.0126 195 13.0910 0.018
2456265.5621 0.0043 -0.0089 202 13.2590 0.014
2456266.6495 0.0055 -0.0187 204 13.2920 0.02
2456272.6187 0.0052 -0.0839 215 13.3530 0.015
2456273.7370 0.0085 -0.0628 217 13.4330 0.021
2456277.6083 0.0064 -0.0316 224 13.4250 0.013
2456278.7047 0.0043 -0.0324 226 13.4300 0.009
2456283.6765 0.0031 0.0021 235 13.1350 0.016
2456288.6169 0.0024 0.0052 244 12.8560 0.007
2456289.7104 0.0019 0.0015 246 12.8240 0.015
2456293.5592 0.0018 0.0102 253 12.9820 0.006
2456294.6572 0.0026 0.0110 255 13.0200 0.007
2456295.7542 0.0068 0.0108 257 13.1420 0.033
2456299.5782 0.0050 -0.0053 264 13.2820 0.016
2456300.6648 0.0034 -0.0159 266 13.2850 0.008
2456301.7665 0.0112 -0.0114 268 13.3850 0.021
2456305.5711 0.0153 -0.0469 275 13.4250 0.025
2456307.7435 0.0092 -0.0688 279 13.4450 0.015
2456317.6883 0.0043 0.0014 297 13.1820 0.013
2456321.5373 0.0040 0.0102 304 12.9370 0.021
Table 3. AL Pic Blazhko spectral components from light curve maxima
From Frequency
(cycle/days)
σ(d-1
) Period
(days)
σ(d) Amplitude
Φ
(cycle)
SNR
(O-C) values 0.02922 10 10-5
34.23 0.12 0.037 day 0.758 21.1
Mmax values 0.02939 6 10-5
34.025 0.07 0.270 mag 0.207 36.9
Table 4 AL Pic Triplet component frequencies and periods
Component Derived from Frequency
(d-1
)
σ(d-1
) Period
(d)
σ(d)
f0 1.822749 4.5x10⁻⁶
0.548622 1.4x10⁻⁶
fB f0 + fB 0.029353 13x10-6
34.07 0.02
Table 5 AL Pic Multi-frequency fit results
Component f(d-1
) σ(f)
Ai
(mag) σ(Ai)
Φi
(cycle) σ(Φi) SNR
fo 1.822749 4.5x10⁻⁶ 0.2790 0.0007 0.5947 0.0005 99.8
2fo 3.645498
0.0972 0.0008 0.5489 0.0013 38.5
3fo 5.468248
0.0512 0.0007 0.4973 0.0022 22.3
4fo 7.290997
0.0321 0.0008 0.4488 0.0033 14.5
5fo 9.113746
0.0197 0.0007 0.4206 0.0065 11.2
6fo 10.936495
0.0117 0.0008 0.3931 0.0102 7.4
7
7fo 12.759244
0.0075 0.0007 0.3313 0.0167 5.3
8fo 14.581993
0.0051 0.0007 0.2765 0.0215 4.3
f0 + fb 1.852103 13x10-6 0.1090 0.0007 0.9100 0.0012 39.1
f0 - fb 1.793396
0.1006 0.0007 0.9945 0.0012 35.9
2fo + fb 3.674852
0.0797 0.0007 0.9162 0.0015 31.5
2fo - fb 3.616145
0.0703 0.0007 0.9495 0.0017 27.9
3fo + fb 5.497601
0.0504 0.0007 0.9529 0.0023 22.0
3fo - fb 5.438894
0.0460 0.0008 0.9602 0.0027 20.0
4fo + fb 7.320350
0.0271 0.0007 0.9422 0.0044 12.3
4fo - fb 7.261643
0.0233 0.0007 0.9605 0.0053 10.5
5fo + fb 9.143099
0.0129 0.0007 0.8866 0.0100 7.3
5fo - fb 9.084393
0.0142 0.0008 0.8988 0.0083 8.0
6fo + fb 10.965848
0.0102 0.0008 0.8041 0.0125 6.5
6fo - fb 10.907142
0.0107 0.0008 0.8459 0.0125 6.8
7fo + fb 12.788598
0.0073 0.0007 0.7938 0.0157 5.1
Table 6. AL Pic Harmonic, Triplet amplitudes, ratios and asymmetry parameters
i Ai/A1 Ai+/A1 Ai
-/A1 Ri Qi
1 1.00 0.39 0.36 1.08 0.04
2 0.35 0.29 0.25 1.13 0.06
3 0.18 0.18 0.16 1.10 0.05
4 0.12 0.10 0.08 1.16 0.08
5 0.07 0.05 0.05 0.91 -0.05
6 0.04 0.04 0.04 0.95 -0.03
7 0.03 0.03 - - -
8 0.02 - - - -
Table 7. AL Pic Fourier coefficients over Blazhko cycle
Ψ A1 A2 A3 A4 Φ1 Φ21 Φ31 Φ41
(cycle) (mag) (mag) (mag) (mag) (rad) (rad) (rad) (rad)
0.0 - 0.1 0.444 0.212 0.134 0.071 3.297 2.501 5.225 1.596
0.1 - 0.2 0.376 0.167 0.086 0.049 3.593 2.543 5.340 1.978
0.2 -0.3 0.286 0.120 0.063 0.036 3.504 2.522 5.232 1.625
0.3 - 0.4 0.235 0.095 0.034 0.021 4.462 2.798 5.394 2.124
0.4 - 0.5 0.209 0.096 0.041 0.021 4.446 2.433 5.305 1.913
0.5 - 0.6 0.235 0.078 0.032 0.023 4.554 2.482 5.319 1.765
0.6 - 0.7 0.205 0.083 0.035 0.015 3.459 2.204 4.660 1.182
0.7 - 0.8 0.285 0.125 0.072 0.028 3.877 2.177 4.841 1.023
0.8 - 0.9 0.362 0.192 0.116 0.080 3.422 2.508 5.310 1.685
0.9 - 1.0 0.421 0.223 0.156 0.099 3.350 2.461 5.217 1.623
Table 8. FR Psc- Comparison stars (AAVSO Chart 8256CED)
Identification
AAVSO R.A.
(2000) Dec (2000) B V B-V
AUID h m s ° ' "
GSC 607-409 000-BKP-155 0:47:35.6 11:47:09.1 12.347 11.657 0.690 C1
GSC 607-679 000-BKP-158 0:47:54.0 11:42:16.4 14.017 13.310 0.707 C2
GSC 607-799 000-BKP-159 14.837 14.237 0.600 C3
8
Table 9. FR Psc - Measured Maxima
Maximum
HJD Error O-C (day) E
Magnitude
(V) Error
Location
2456158.5795 0.0020 -0.0042 -1038 11.639 0.010 1
2456159.4882 0.0045 -0.0069 -1036 11.629 0.013 1
2456192.7269 0.0051 -0.0328 -963 11.691 0.009 4
2456195.9113 0.0048 -0.0382 -956 11.682 0.045 4
2456202.7678 0.0055 -0.0169 -941 11.738 0.017 4
2456203.6806 0.0026 -0.0154 -939 11.708 0.016 4
2456205.9714 0.0049 -0.0030 -934 11.703 0.017 4
2456213.7200 0.0024 -0.0010 -917 11.477 0.014 4
2456214.6314 0.0014 -0.0010 -915 11.414 0.011 4
2456218.7341 0.0028 0.0006 -906 11.360 0.036 4
2456219.6433 0.0019 -0.0015 -904 11.343 0.010 4
2456259.7407 0.0031 -0.0040 -816 11.635 0.026 4
2456261.5653 0.0023 -0.0021 -812 11.564 0.014 4
2456264.7575 0.0024 0.00034 -805 11.493 0.017 4
2456265.6685 0.0019 -0.00002 -803 11.456 0.013 4
2456270.6801 0.0018 -0.00090 -792 11.357 0.011 4
2456540.4398 0.0014 -0.00379 -200 11.503 0.008 1
2456546.8092 0.0013 -0.01391 -186 11.659 0.005 2
2456546.8095 0.0016 -0.01361 -186 11.685 0.009 5
2456547.7192 0.0023 -0.01527 -184 11.678 0.006 2
2456551.8039 0.0040 -0.03169 -175 11.721 0.014 2
2456556.8141 0.0040 -0.03397 -164 11.724 0.017 5
2456560.4719 0.0037 -0.02161 -156 11.713 0.009 1
2456566.8696 0.0021 -0.00343 -142 11.668 0.010 5
2456567.7806 0.0035 -0.00379 -140 11.636 0.005 2
2456568.6969 0.0025 0.00115 -138 11.607 0.006 2
2456571.8873 0.0003 0.00179 -131 11.538 0.004 5
2456572.8007 0.0013 0.00383 -129 11.484 0.004 2
2456573.7104 0.0014 0.00217 -127 11.471 0.005 2
2456574.6216 0.0018 0.00201 -125 11.418 0.005 2
2456578.7206 0.0010 -0.00011 -116 11.374 0.005 2
2456588.7447 0.0011 -0.00098 -94 11.441 0.005 2
2456589.6550 0.0013 -0.00204 -92 11.480 0.005 2
2456589.6557 0.0007 -0.00134 -92 11.507 0.005 5
2456592.8414 0.0012 -0.00540 -85 11.584 0.005 5
2456593.7524 0.0015 -0.00576 -83 11.574 0.006 2
2456594.6623 0.0013 -0.00722 -81 11.623 0.006 3
2456594.6635 0.0022 -0.00602 -81 11.587 0.008 2
2456595.5729 0.0021 -0.00798 -79 11.636 0.003 2
2456599.6659 0.0016 -0.01610 -70 11.685 0.004 2
2456600.5695 0.0019 -0.02386 -68 11.694 0.004 2
2456604.6661 0.0038 -0.02838 -59 11.703 0.005 2
2456605.5741 0.0025 -0.03174 -57 11.704 0.005 2
2456607.3937 0.0035 -0.03486 -53 11.711 0.007 1
2456609.6729 0.0030 -0.03406 -48 11.713 0.008 2
2456614.7092 0.0021 -0.01024 -37 11.708 0.010 2
2456615.6255 0.0030 -0.00530 -35 11.709 0.010 2
2456616.5376 0.0024 -0.00456 -33 11.681 0.010 2
9
2456619.7317 0.0008 -0.00022 -26 11.614 0.005 5
2456620.6441 0.0019 0.00082 -24 11.575 0.009 2
2456621.5584 0.0029 0.00376 -22 11.556 0.013 2
2456625.6577 0.0012 0.00194 -13 11.414 0.006 2
2456626.5695 0.0017 0.00238 -11 11.420 0.009 2
2456631.5796 0.0012 0.00000 0 11.342 0.015 2
2456636.5929 0.0016 0.00082 11 11.373 0.011 2
2456641.6030 0.0014 -0.00156 22 11.491 0.008 2
2456647.5211 0.0014 -0.00730 35 11.628 0.006 2
2456657.5222 0.0027 -0.03116 57 11.738 0.008 3 Locations: 1 - Lesve (Belgium); 2 - Bozeman (MT); 3 – Framingham (MA);
4 - Cloudcroft (NM); 5 - San Pedro de Atacama (Chile)
Table 10. FR Psc Blazhko spectral components from light curve maxima
From Frequency
(cycle/days)
σ(d-1
) Period
(days)
σ(d) Amplitude
Φ
(cycle)
SNR
(O-C) values 0.01948 2 10-5
51.324 0.053 0.015 day 0.948 33.1
Mmax values 0.01947 3 10-5
51.353 0.087 0.193 mag 0.428 21.0
Table 11. FR Psc Triplet component frequencies and periods
Component Derived from Frequency
(d-1
)
σ(d-1
) Period (d) σ(d)
f0 2.1945066 1.3x10⁻⁶
0.4556833 2.7x10⁻⁷
fB f0 + fB 0.019490 6.1x10⁻⁶
51.31 0.016
Table 12. FR Psc Multi-frequency fit results
Component f(d-1
) σ(f)
Ai
(mag) σ(Ai)
Φi
(cycle) σ(Φi) SNR
fo 2.194507 6.7 10-7 0.4261 0.0011 0.1956 0.0004 252.2
2fo 4.389014
0.1768 0.0011 0.7527 0.0011 139.5
3fo 6.583521
0.0901 0.0010 0.3300 0.0019 77.9
4fo 8.778028
0.0379 0.0010 0.9201 0.0039 34.8
5fo 10.972536
0.0121 0.0009 0.3977 0.0138 11.9
6fo 13.167043
0.0111 0.0008 0.8574 0.0147 13.1
7fo 15.361550
0.0115 0.0010 0.3822 0.0175 16.3
8fo 17.556057
0.0103 0.0010 0.9469 0.0177 17.0
9fo 19.750564
0.0087 0.0010 0.5409 0.0182 13.2
f0 + fb 2.213999 30 10-7 0.0731 0.0011 0.7259 0.0019 43.7
f0 - fb 2.175015
0.0664 0.0010 0.3003 0.0026 39.2
2fo + fb 4.408506
0.0627 0.0009 0.2775 0.0025 49.4
2fo - fb 4.369522
0.0591 0.0011 0.8392 0.0026 46.5
3fo + fb 6.603013
0.0608 0.0010 0.8647 0.0024 52.6
3fo - fb 6.564030
0.0543 0.0011 0.4355 0.0034 46.9
4fo + fb 8.797520
0.0391 0.0009 0.4688 0.0048 35.8
4fo - fb 8.758537
0.0357 0.0011 0.0446 0.0045 32.7
5fo + fb 10.992027
0.0264 0.0011 0.0512 0.0061 26.1
5fo - fb 10.953044
0.0216 0.0010 0.6616 0.0069 21.3

10
6fo + fb 13.186535
0.0161 0.0010 0.6491 0.0090 19.0
6fo - fb 13.147551
0.0122 0.0010 0.2430 0.0158 14.4
7fo + fb 15.381042
0.0087 0.0011 0.2217 0.0168 12.4
7fo - fb 15.342058
0.0065 0.0010 0.8239 0.0263 9.2
8fo + fb 17.575549
0.0040 0.0011 0.7335 0.0424 6.6
8fo - fb 17.536565
0.0022 0.0011 0.3048 0.0793 3.7
Table 13. FR Psc Harmonic, Triplet amplitudes, ratios and asymmetry parameters
i Ai/A1 Ai+/A1 Ai
-/A1 Ri Qi
1 1.00 0.17 0.16 1.10 0.05
2 0.41 0.15 0.14 1.06 0.03
3 0.21 0.14 0.13 1.12 0.06
4 0.09 0.09 0.08 1.09 0.05
5 0.03 0.06 0.05 1.23 0.10
6 0.03 0.04 0.03 1.32 0.14
7 0.03 0.02 0.02 1.34 0.14
8 0.02 0.01 0.01 1.80 0.29
9 0.02 - - - -
Table 14. FR Psc Fourier coefficients over Blazhko cycle
Ψ A1 A2 A3 A4 Φ1 Φ21 Φ31 Φ41
(cycle) (mag) (mag) (mag) (mag) (rad) (rad) (rad) (rad)
0.0 - 0.1 0.496 0.234 0.159 0.084 3.977 2.276 4.728 1.092
0.1 - 0.2 0.462 0.211 0.134 0.068 4.149 2.311 4.792 1.151
0.2 -0.3 0.441 0.179 0.106 0.054 3.766 2.357 4.850 1.197
0.3 - 0.4 0.409 0.173 0.093 0.044 4.379 2.322 4.822 1.201
0.4 - 0.5 0.394 0.170 0.098 0.050 4.540 2.324 4.897 1.207
0.5 - 0.6 0.390 0.161 0.094 0.047 4.646 2.309 4.934 1.222
0.6 - 0.7 0.402 0.163 0.082 0.038 4.437 2.282 4.929 1.409
0.7 - 0.8 0.418 0.180 0.087 0.035 4.200 2.304 4.767 1.021
0.8 - 0.9 0.456 0.212 0.132 0.068 4.082 2.238 4.629 0.921
0.9 - 1.0 0.491 0.240 0.170 0.108 3.979 2.273 4.712 1.046
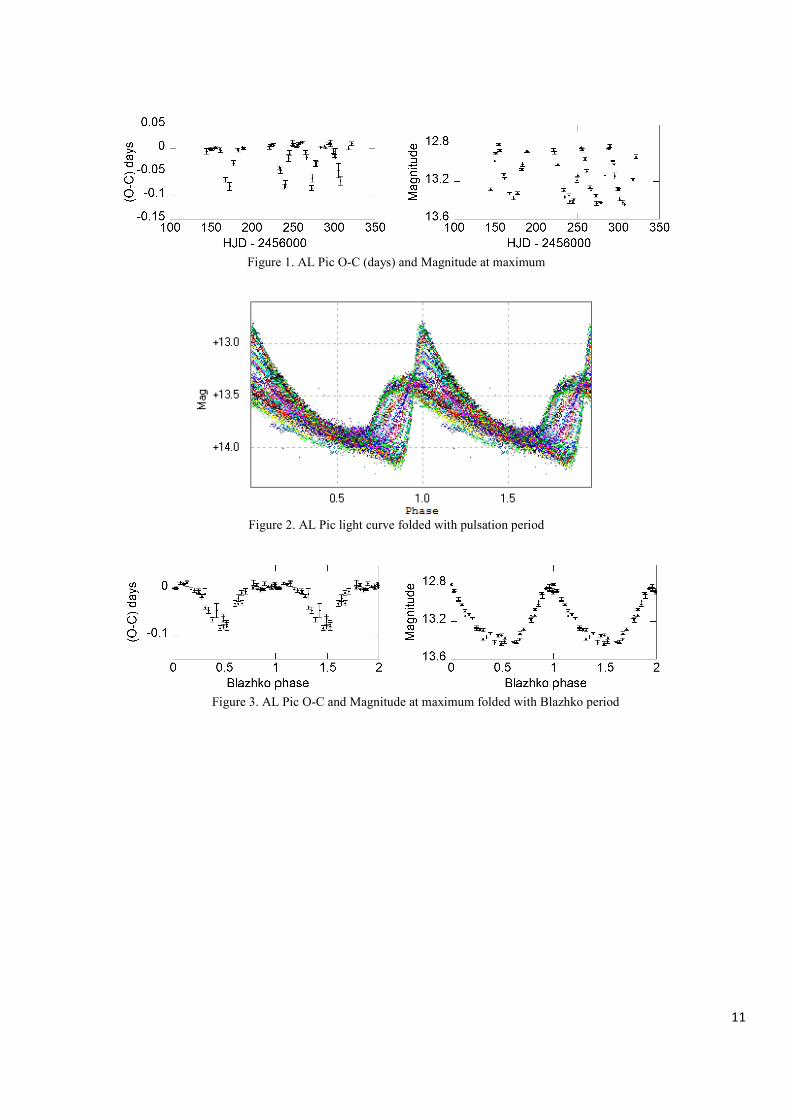
Figure 1. AL Pic O
Figure 2.
Figure 3. AL Pic
Figure 1. AL Pic O-C (days) and Magnitude at maximum
igure 2. AL Pic light curve folded with pulsation period
AL Pic O-C and Magnitude at maximum folded with Blazhko period
11
Blazhko period
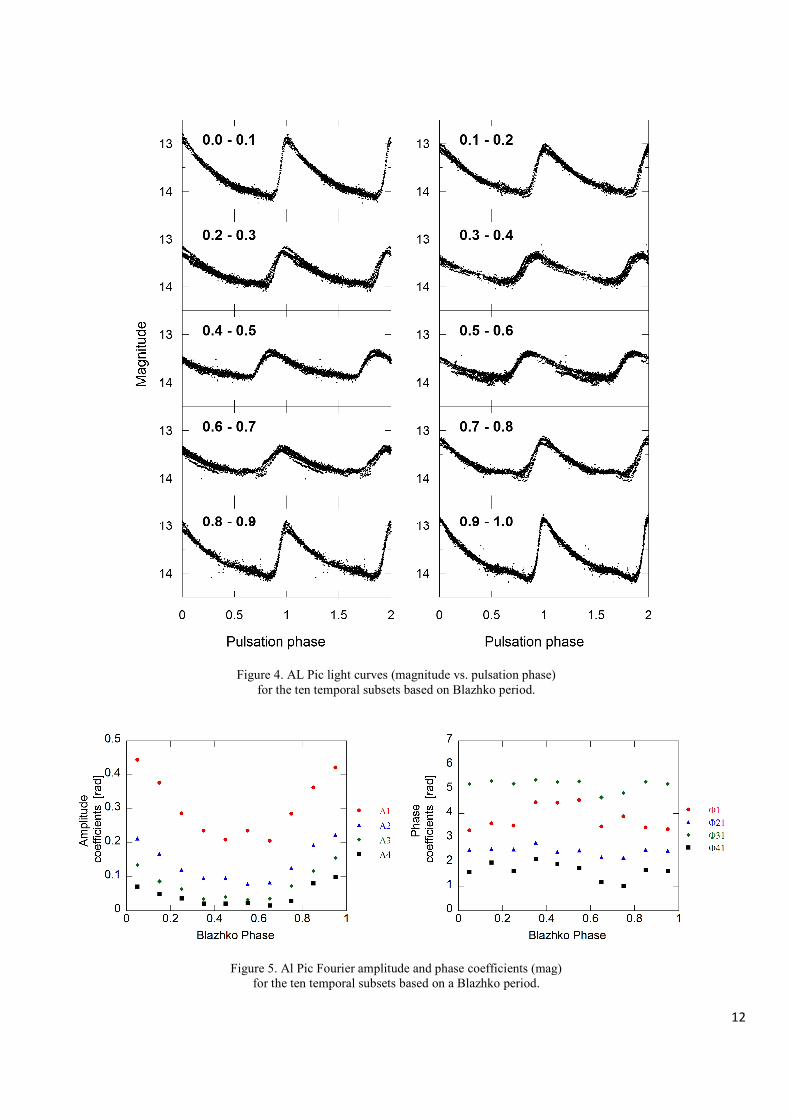
Figure 4.
for the ten
Figure 5.
for the ten temporal subsets
4. AL Pic light curves (magnitude vs. pulsation phase)
the ten temporal subsets based on Blazhko period.
. Al Pic Fourier amplitude and phase coefficients (mag)
for the ten temporal subsets based on a Blazhko period.
12
phase)
(mag)
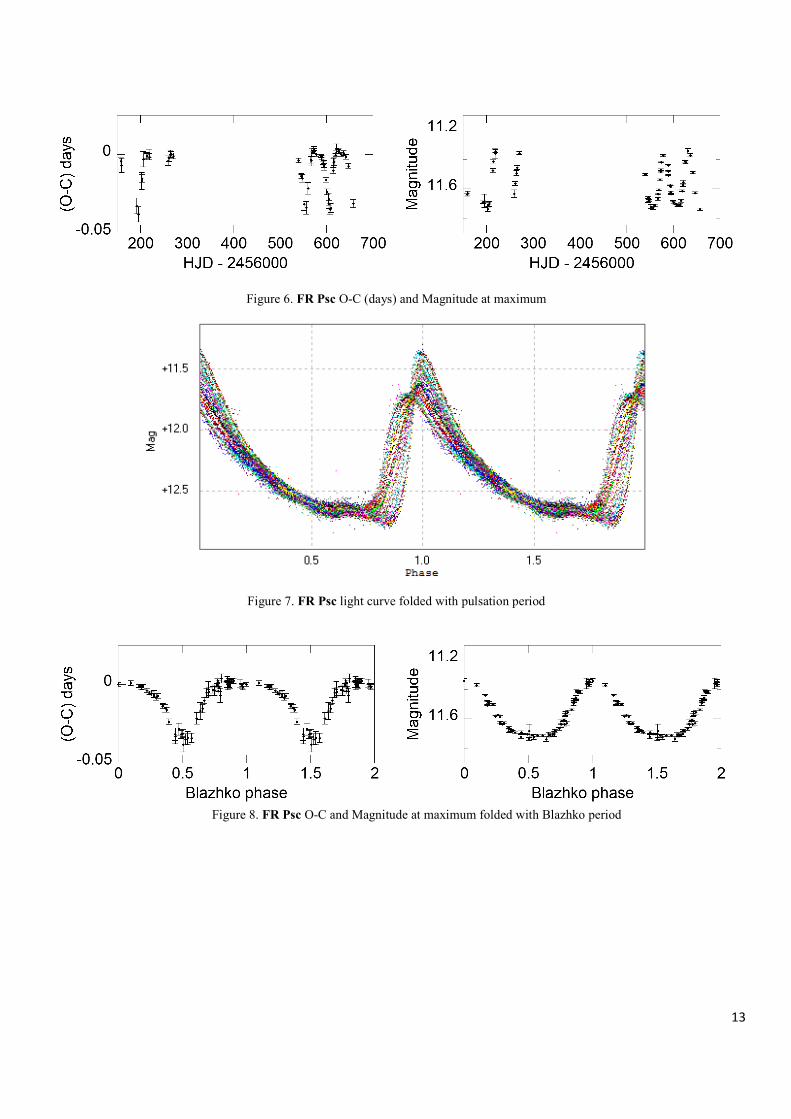
Figure 6.
Figure 7.
Figure 8. FR Psc
Figure 6. FR Psc O-C (days) and Magnitude at maximum
igure 7. FR Psc light curve folded with pulsation period
FR Psc O-C and Magnitude at maximum folded with Blazhko period
13
Blazhko period
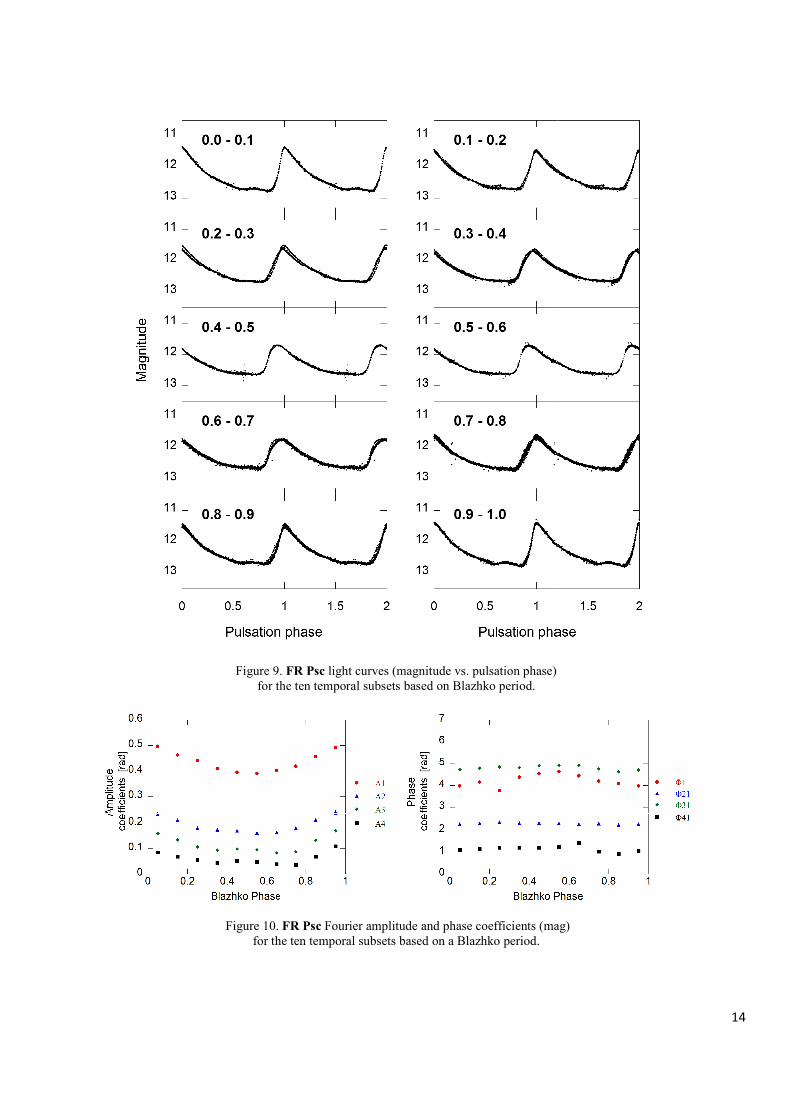
Figure 9.
for the ten
Figure 10.
for the ten temporal subsets
9. FR Psc light curves (magnitude vs. pulsation phase)
the ten temporal subsets based on Blazhko period.
Figure 10. FR Psc Fourier amplitude and phase coefficients (mag)
for the ten temporal subsets based on a Blazhko period.
14
phase)
coefficients (mag)


![INTRODUCTION by Michael Hall - baldwin.co.uk · all in a rocky landscape, OPVS PISANI PICTORIS [the work of Pisanello the painter], ΕΡΓΟΝ ΤΟV](https://img.pdfslide.us/doc/110x75/5b5b157b7f8b9ab8578d5b05/introduction-by-michael-hall-all-in-a-rocky-landscape-opvs-pisani-pictoris.jpg)