Embed Size (px)
Citation preview

Crowding Out: The Real Ethanol Issue in Canada1
Al Mussell, Kevin Grier, Anatoliy Oginskyy, and Graeme Hedley
September, 2008
1 The authors acknowledge helpful comments from Dr. Douglas Hedley and Dr. Tesfalidet Asfaha

Crowding Out: The Real Ethanol Issue in Canada
2
EXECUTIVE SUMMARY The purpose of this independent study was to provide an economic analysis of expansions in ethanol production in Canada under the ethanol blend mandate, using Ontario as an illustration. To do so, a conceptual framework was developed within which to understand competing uses of feed grains. This was then analyzed empirically to determine anticipated adjustment in feed grain allocation due to increased ethanol production across uses, with particular reference to red meat livestock as the fringe demand. Finally, the apparent change in value added, as measured by contribution margin, was measured under the reallocation of feed grains toward ethanol. The results showed the following, based on Ontario corn. First, ethanol production capacity of 1.4 billion litres and anticipated consumption of about 2.8 million tonnes of corn will be in place by the end of 2009 in Ontario. Under the assumption that feed for supply-managed livestock and food and industrial users will continue to competitively bid for corn at import-basis price levels, the increased corn utilization by ethanol will be reallocated from red meat livestock. Because pork and beef industries operate on an export-price basis, hogs and pork cannot be cost competitive on an import basis for corn. Assuming maximum feasible use of distillers dried grain (DDG) across major livestock species, the remaining indigenously-produced corn in Ontario would allow for production of about 2 million market hogs per year, or 211,000 head of slaughter cattle, or some combination thereof. This compares with 2007 hog marketings of 5.4 million head, and slaughter cattle marketings of about 622,000 head. After factoring out structural adjustments in livestock marketings, suggested by Mussell, Hedley and Oginskyy, the implied reduction in hog marketings that can be attributed to increased ethanol production in Ontario is 3.7 million head, and the implied reduction in cattle marketings is 436,000 head. The net cost of the reallocation of corn from red meats to ethanol was estimated using enterprise models to estimate contribution margins in pork production, beef production, and ethanol production. The results show that the combined effect of reductions in hog and cattle marketings, as expressed by forgone beef and pork contribution margins, and ethanol contribution margin losses anticipated for 2009, amounts to $148 million to $156 million per year. The literature on the development of ethanol manufacturing in North America has been dominated by debates regarding the relative environmental merits of ethanol. Alleged environmental advantages notwithstanding this study suggests, based on measurable costs and benefits, that ethanol production from feed grains represents significant economic self-injury to the Canadian economy. The red meat sector and its supporting industries are the principal victims. Ultimately, the cost Canada is inflicting upon itself by consuming ever greater proportions of feed grains into ethanol and, thus, making it impossible to leverage its efficient feed grain production in export-based livestock and red meat is likely to be severe.

Crowding Out: The Real Ethanol Issue in Canada
3
Table of Contents 1. Introduction ................................................................................................................. 4
2. Conceptual Framework ............................................................................................... 5
3. Empirical Analysis ...................................................................................................... 8
3.1 Ontario Corn and Corn Consuming Segments ..................................................... 8
3.1.1 Ontario Corn ................................................................................................. 8
3.1.2 Ontario Food and Industrial Use of Corn ................................................... 11
3.1.3 Ontario Supply Managed Livestock .......................................................... 14
3.1.4 Ontario Cattle Industry ............................................................................... 14
3.1.5 The Ontario Hog Industry ........................................................................... 17
3.2 Corn Tradeoffs in a Growing Ethanol Market ................................................... 19
4. Economic Significance of Corn Reallocation ........................................................... 23
4.1 Value of Corn Transformed as Pork .................................................................. 23
4.2 Value of Corn Transformed as Beef .................................................................. 23
4.3 Value of Corn Transformed as Ethanol and DDG ............................................. 25
4.4 Observations ....................................................................................................... 29
5. Conclusions ............................................................................................................... 34
References ......................................................................................................................... 37
Appendix 1 ........................................................................................................................ 38
Appendix 2 ........................................................................................................................ 39
Appendix 3 ........................................................................................................................ 40
Appendix 4 ........................................................................................................................ 42

Crowding Out: The Real Ethanol Issue in Canada
4
1. Introduction Canada is in the early stages of a biofuel development strategy that will involve conversion of feed grains, mostly corn in Eastern Canada and wheat in Western Canada, into ethanol. The objective is to obtain an ethanol blend ratio in motor vehicles of 5% by 2010 nationally. A number of provincial blend mandates also exist that exceed the national blend. As is the case in other countries that use grains as a primary feedstock in ethanol production, public assistance is required to make ethanol production economically feasible, and subsidy programs are in existence nationally and at the provincial level that offer capital and operating support to ethanol plants. Ethanol development has been confronted by widespread criticism recently (see, for example, Auld). Most critics of ethanol have argued that the carbon-reducing and energy-saving benefits of ethanol are relatively small, and that other environmental effects associated with ethanol production are detrimental. Ethanol proponents dispute these claims, and the debate around the science of carbon reduction and energy savings around ethanol continues. However, relatively little has been discussed about the effect of ethanol development on the competing uses of feed grains, other than in reference to the food vs. fuel debate. The discussion has centered on whether ethanol developments are the direct cause of increasing food prices and food insecurity in developing countries. Less focus has been spent on the impact of ethanol development on the profitability and indeed the viability of industries that must compete for feed grains with ethanol manufacturing, and what the implications are for an exporting country like Canada. This must be understood to fully evaluate public policy encouraging ethanol production. 1.1 Purpose and Approach The purpose of this paper is to provide an economic analysis of ethanol development in Canada in the context of competing users of feed grains. To do so, a conceptual framework is developed in which industries compete with one another for indigenous feed grain supplies, with explicit reference to the impact of subsidy and protection offered to a subset of industries competing for feed grains. This is then analyzed empirically using corn and Ontario conditions as an illustration. These are then interpreted in the broader context of value generated in red meats vs. ethanol. 1.2 Organization of the Paper Section 2 develops the basic conceptual model for the analysis of competition for feed grains. Section 3 develops an empirical model with which to measure the impacts of competition for corn across industries. Section 4 presents a discussion of the impacts observed from the empirical model. Section 5 concludes the paper.

Crowding Out: The Real Ethanol Issue in Canada
5
2. Conceptual Framework Feed grain consuming industries compete with one another for the supply of feed grains available in a region. In a market economy, competition allocates feed grains to its most valued end uses. “Crowding out” occurs when government subsidies targeted to a specific industry provide it with the leverage to supplant competing industries that do not benefit from subsidy. To study competition for feed grains among competing users, we adopt the notion of segmented demand and fringe competitors. Feed grain demand in Canada, and more precisely corn demand in Ontario, can be segmented into food industry and industrial users of feed grains, feed for livestock and dairy products marketed under Canadian supply management schemes, and feed for red meat livestock (hogs and cattle)2. To understand the competitive position and, therefore, the ordering of demands from these segments, some knowledge of the industries and policies influencing each are necessary. The food and industrial segment of feed grain consumption, which includes ethanol, tends to be in a relatively strong position of demand for feed grains. Food users of feed grains can leverage brands and a relatively close link to consumers in competing for corn. Ethanol plants in Canada are the recipients of federal direct subsidies for operations of up to $.10/litre, plus provincial incentives, and both federal and provincial capital grants for ethanol plant construction. Ethanol also benefits from a blend mandate of 5% nationally with additional provincial mandates, and protection through a tariff of 4.92¢/liter. Dairy products and poultry products are marketed under mandated supply control schemes that are protected by trade policy instruments from external competition, and are granted price setting authority which allows for production cost increases to essentially be passed on. Red meat livestock is commodity market-based, export focused, and is not subject to targeted protection from government. The red meat livestock sector (comprised mostly of cattle and hogs) has access to whole-farm safety net programs similar to other aspects of production agriculture, with occasional ad hoc protection allotted to it, as does corn and field crops. Figure 2.1 provides a graphical representation of the situation for Ontario corn. Initially we assume, as was historically the case, that demands exist in Ontario for corn to feed supply management (SM), corn for food and industrial use (F&I), and corn to feed red meat livestock (RM); ethanol is not produced. This scenario is given by D1. Given corn supply function S, these demands result in surplus corn (EXP) given by (QS
1-QD1) that is
exported. To facilitate exports, the Ontario corn market clears at price P1. Under subsidized ethanol production from corn, the demand for corn shifts to D2. Given the Ontario corn supply function S, Ontario supplies a corn volume QS
2. This is less than expanded demand QD
2, resulting in corn imports (QD2-QS
2). To induce corn imports, the Ontario corn price must increase to P2. The increase in corn price to P2 results in a shrink in the corn demand from red meat; this corn is reallocated to ethanol. The reason for this is that, with the benefits of protection, the primary demands SM, F&I, and Ethanol can be sustainable on an import pricing basis.
2 Exports of feed grains from Western Canada are significant.

Crowding Out: The Real Ethanol Issue in Canada
6
Figure 2.1 Segmented Demands and Corn Supply in the Ontario Market
P1
Rest of the WorldOntario
EXPRMSM
SM
F&I
F&I RM Ethanol
P2
D1
D2
S
QS1 QS
2 QD2QD
1
Allocation to Ethanol Imports
Exports
Price
QuantityQuantity

Crowding Out: The Real Ethanol Issue in Canada
7
Red meat livestock faces an export pricing basis for both livestock and meat products; an import pricing basis for feed grains as the critical input to production is unsustainable. In effect, red meat livestock comprises the fringe demand for feed grains in Canada.

Crowding Out: The Real Ethanol Issue in Canada
8
3. Empirical Analysis
This section develops an empirical model of feed grain allocation, using Ontario as an illustration. The Ontario situation is used because the feed grain segment is dominated by a single crop (corn) and ethanol development is occurring rapidly and is based exclusively on corn. Section 3.1 presents an overview of the Ontario corn and corn consuming segments. Section 3.2 presents an analysis of Ontario ethanol development on the beef/cattle and hog/pork segments. Section 3.3 makes observations on the results.
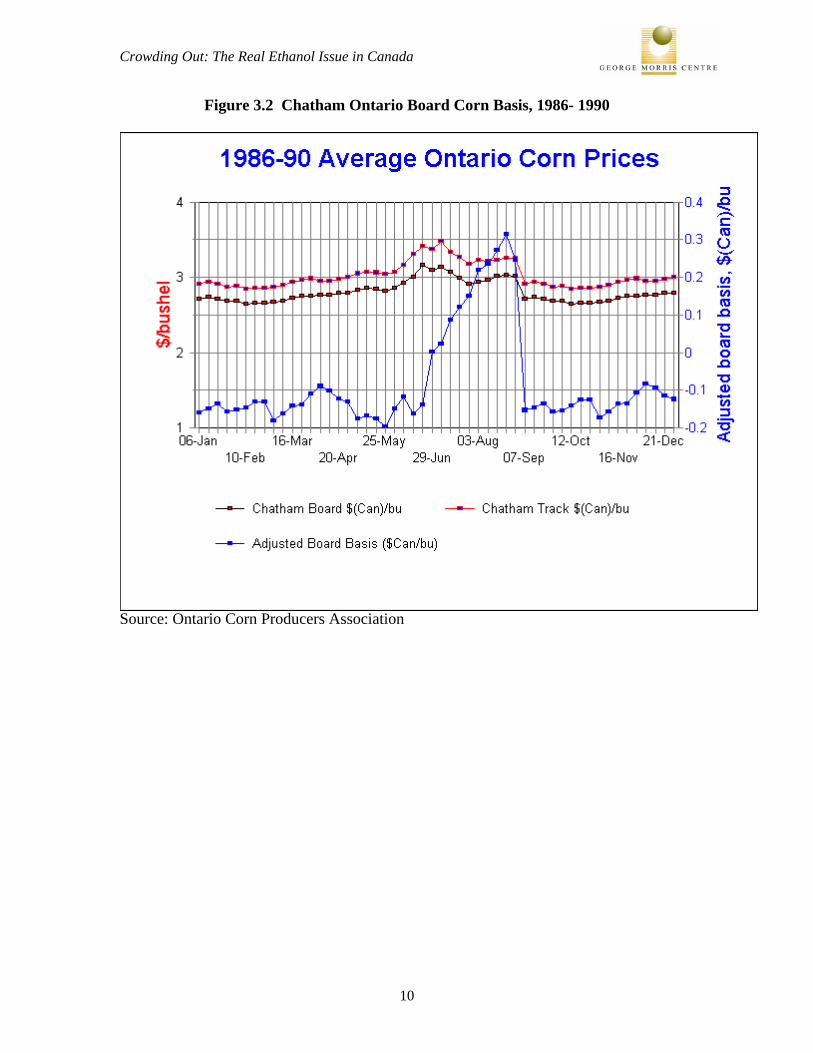
3.1 Ontario Corn and Corn Consuming Segments 3.1.1 Ontario Corn Grain corn acreage in Ontario grew rapidly through the 1970’s and early 1980’s, peaking at just over 2 million acres. Since then, grain corn acreage has been decreasing. This is depicted in Figure 3.1 below. Grain corn production has not seen the same trend, with production mostly leveling out around 5 million tonnes. Recent years have seen a significant production increase toward 6 million tonnes, and a very large 2007 crop resulted in production of over 7 million tonnes. At the same time, corn imports have increased. In much of the 1980’s, Ontario was a net corn exporter; however, as shown in Figure 3.1 below, since 2000 corn net imports in Ontario have been material and have ranged between 1 million and 2 million tonnes. The nature of corn pricing in Ontario has also experienced a significant evolution. Throughout much of the 1980’s Ontario was a net exporter of corn and as such, corn prices in Ontario were at a discount to Chicago futures. An indication of this is presented in Figure 3.2 below, which plots the average Chatham Ontario board basis for the period 1986 to 1990. The figure shows that, even with the drought of 1988 included in the average, the Chatham basis averaged $Can .10/bushel to $Can .20/bushel under Chicago, with the exception of a pre-harvest season strengthening in the basis. Since 1990, a general strengthening of the basis has occurred in Ontario. This is illustrated in Figure 3.3, which plots the Chatham track basis since 1990. The figure shows that strengthening in the corn basis occurred in the early and mid-1990’s, and that the corn basis strengthened markedly in about 2000, consistent with the increases in corn imports observed above.

Crowding Out: The Real Ethanol Issue in Canada
9
‐2,000,000
‐1,000,000
0
1,000,000
2,000,000
3,000,000
4,000,000
5,000,000
6,000,000
7,000,000
8,000,000
1970
1971
1972
1973
1974
1975
1976
1977
1978
1979
1980
1981
1982
1983
1984
1985
1986
1987
1988
1989
1990
1991
1992
1993
1994
1995
1996
1997
1998
1999
2000
2001
2002
2003
2004
2005
2006
2007
Acres Production (Tonnes) Net Imports (tonnes)
Figure 3.1 Corn Acreage and Production
Crowding Out: The Real Ethanol Issue in Canada
10
Figure 3.2 Chatham Ontario Board Corn Basis, 1986- 1990
Source: Ontario Corn Producers Association

Crowding Out: The Real Ethanol Issue in Canada
11
‐1.000
‐0.500
0.000
0.500
1.000
1.500
2.000
2.50019
9119
92
1993
1994
1995
1996
1997
1998
1999
2000
2001
2002
2003
2004
2005
2006
2007
2008
$Can/bushe
l
Figure 3.3 Chatham Ontario Track Corn Basis, September 1990- June 2008, Monthly ($Can/bushel)
3.1.2 Ontario Food and Industrial Use of Corn Corn is used in Ontario to manufacture corn sweeteners, alcoholic beverages, other food uses, and in denatured ethanol and other industrial uses. The data on corn utilization are presented as an aggregate, as presented in Figure 3.4 below. It shows that non-feed use of corn in Ontario has ranged, mostly, just over 2 million tonnes/year, but that 2007 utilization was up sharply. Because of the way data is reported in this category, little can be said of corn use in ethanol manufacturing. This can only be estimated using posted plant capacity and making assumptions regarding corn use, as presented in Table 3.1 below. In the table, the nameplate capacity of existing and planned ethanol plants that are expected to open in 2008 or 2009 are presented, as quoted by the Canadian Renewable Fuels Association. It was assumed that actual production is 80% of nameplate capacity. For plants opened prior to 2006, an ethanol yield of 9.7 litres/bushel of corn was used, based on the subsidy formula used by the Ontario Ethanol Growth Fund. For plants opened since 2006, it is
Crowding Out: The Real Ethanol Issue in Canada
12
assumed that the ethanol yield is increased to 10.58 litres/bushel of corn, based on the model developed by Tiffany. Regardless of plant age, the distillers dried grains (DDG) yield was assumed at 18 lbs/bushel of corn (Tiffany). The table shows that prior to 2006, these assumptions yield an estimated ethanol consumption of corn was about 439,000 tonnes based on Chatham and Tiverton plants. This increased in 2006 when Sarnia-St. Clair came online and again in 2007 with the opening of the Collingwood plant. Based on the projected steady-state of production of plants that have been established, ethanol production is estimated to consume over 900,000 tonnes of corn. With new capacity that is being added, the projected corn consumption will jump to about 2.7 million tonnes, with total DDG production of about 883,000 tonnes.

Crowding Out: The Real Ethanol Issue in Canada
13
0
500,000
1,000,000
1,500,000
2,000,000
2,500,000
3,000,000
1997 1998 1999 2000 2001 2002 2003 2004 2005 2006 2007
Tonn
es
Figure 3.4 Human Food and Industrial Use of Corn, Ontario
Source: Statistics Canada v31185230
Table 3.1 Ethanol Capacity and Estimated Corn Use
Existing plant location Capacity
(Million Litres) Year Opened
Implied Corn Demand, tonnes
DDG Produced, tonnes
Collingwood 52 2007 99,859 32,098 Tiverton 25 1989 52,311 16,814 Chatham 185 1997 387,099 124,425 St. Clair-Sarnia 200 2006 384,073 123,452 Total Existing 462 923,341 296,788 Plants in Development St.Clair-Sarnia, Ont 200 Mid 2009 384,073 123,452 Aylmer, Ont 150 Late 2008 288,055 92,589 Johnstown, Ontario 200 Late 2008 384,073 123,452 Northern Ethanol- Sarnia, Ont 400 Mid 2009
768,146 246,904
Total New/Planned 950 1,824,347 586,397 Total Existing and in Development 1,412 2,747,688 883,185

Crowding Out: The Real Ethanol Issue in Canada
14
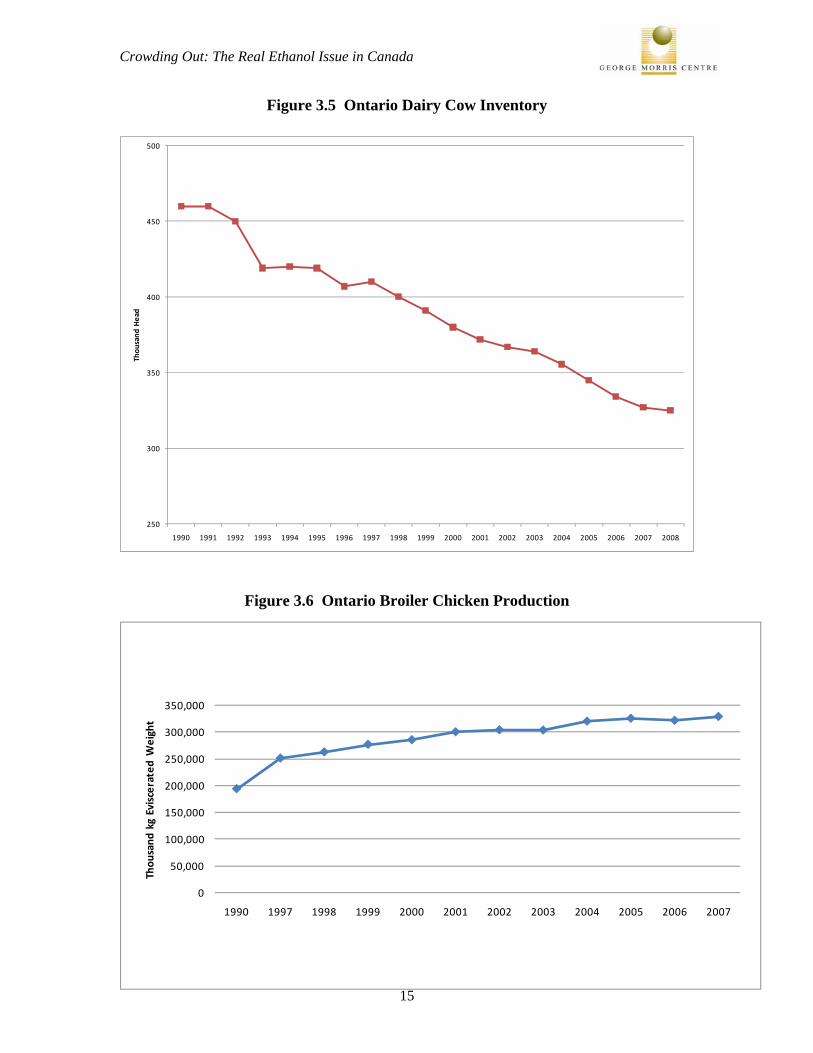
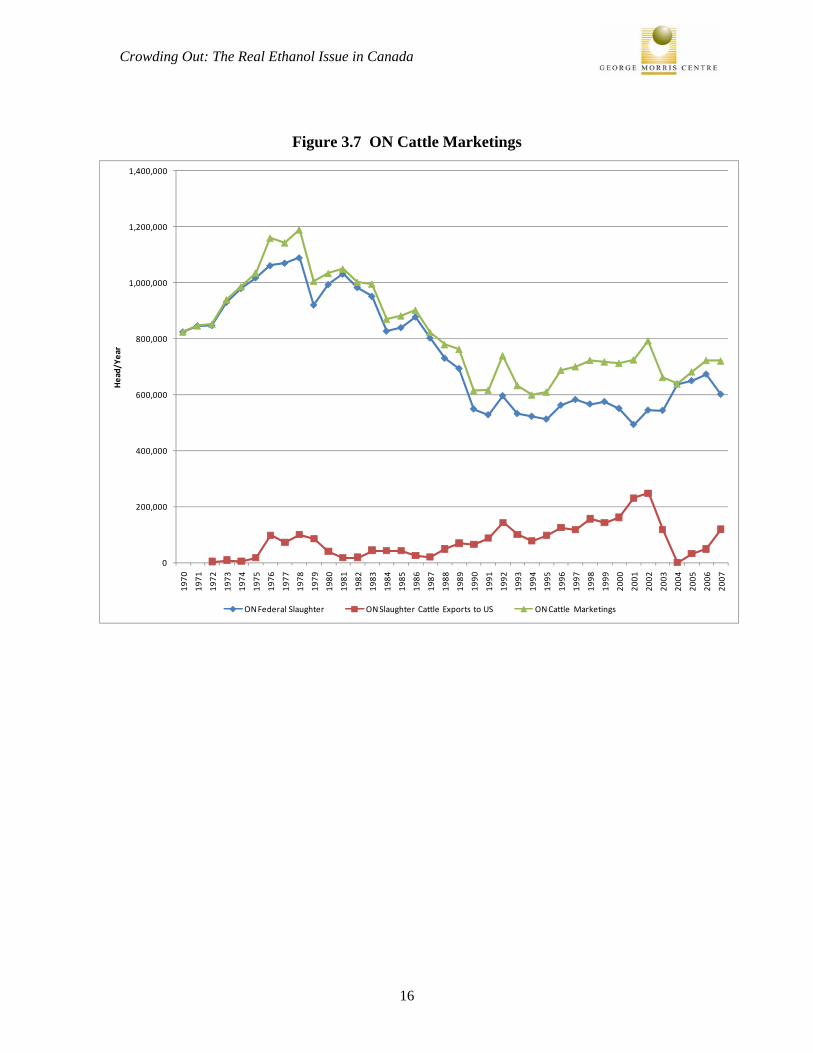
3.1.3 Ontario Supply Managed Livestock Within supply managed livestock, corn is consumed by dairy cows, broiler chickens, turkeys, laying hens, and hatching egg layers. The trend in dairy cow inventories is presented in Figure 3.5. The figure shows that since 1990, the Ontario dairy cow inventory has decreased to just less than 350,000 head. Thus, not accounting for changes in the intensity of grain in dairy rations, the corn demand from dairy cows has decreased. At the same time, the poultry segments have broadly increased. The most significant illustration of this is in broilers, as illustrated in Figure 3.6 below. The Ontario chicken slaughter has increased by about 25% since 1997, and by fully 50% since 1990. 3.1.4 Ontario Cattle Industry The Ontario fed cattle marketings peaked in the mid-1970’s at almost 1.2 million head. Since then, consistent with the broad decline in per capita consumption of beef, cattle marketings in Ontario have decreased to 600,000 to 800,000 head per year, and a trend toward increasing cattle exports. This is presented in Figure 3.7 below. The figure plots the slaughter of steers and heifers in Ontario plants and exports of Ontario cattle, with estimated marketings taken as the sum of the fed cattle kill and fed cattle exports. Since data on cattle marketings is not collected, in the data presented in the figure it is assumed that the kill of fed cattle from other provinces in Ontario plants is approximately equal to the provincial slaughter. From the figure, in addition to the general decrease in the Ontario slaughter, increasing live cattle exports prior to BSE in 2003 show that there has been a move toward an export basis for cattle. This has occurred largely as Ontario slaughter capacity rationalized to decreased marketings, and Ontario moved away from excess slaughter capacity. Estimated cattle marketings suggest that beef production and the implied corn feeding of cattle have declined since the mid-1970’s. However, this disregards the transformation toward larger frame slaughter cattle and the changes in cattle rations. Figure 3.8 below provides the context within which to interpret the transformation of the cattle industry from primarily smaller framed, British breeds toward larger, continental European breeds. The figure shows that up until the early 1980’s, carcass weights averaged around 600 lbs/head. Through the mid-1980’s until today, carcass weights have increased, and have increased by more than 50% over the period.
Crowding Out: The Real Ethanol Issue in Canada
15
0
50,000
100,000
150,000
200,000
250,000
300,000
350,000
1990 1997 1998 1999 2000 2001 2002 2003 2004 2005 2006 2007
Thou
sand
kg Eviscerated Weight
250
300
350
400
450
500
1990 1991 1992 1993 1994 1995 1996 1997 1998 1999 2000 2001 2002 2003 2004 2005 2006 2007 2008
Thou
sand
Head
Figure 3.5 Ontario Dairy Cow Inventory
Figure 3.6 Ontario Broiler Chicken Production
Crowding Out: The Real Ethanol Issue in Canada
16
0
200,000
400,000
600,000
800,000
1,000,000
1,200,000
1,400,00019
70
1971
1972
1973
1974
1975
1976
1977
1978
1979
1980
1981
1982
1983
1984
1985
1986
1987
1988
1989
1990
1991
1992
1993
1994
1995
1996
1997
1998
1999
2000
2001
2002
2003
2004
2005
2006
2007
Head/Ye
ar
ON Federal Slaughter ON Slaughter Cattle Exports to US ON Cattle Marketings
Figure 3.7 ON Cattle Marketings

Crowding Out: The Real Ethanol Issue in Canada
17
500
550
600
650
700
750
800
850
900
1970 1974 1978 1982 1986 1990 1994 1998 2002 2006
Lbs/Head
Figure 3.8 Ontario Cattle Average Carcass Weights, Lbs/Head
3.1.5 The Ontario Hog Industry The Ontario hog industry grew rapidly in the 1990’s. Between 1990 and 2002, Ontario hog marketings increased by 25%. This is illustrated in Figure 3.9 below. In addition, marketings of slaughter hogs to Quebec and the US increased markedly, from around 500,000 head in 2000 to over 1 million by 2007. More generally, the move to an export basis for hogs is indicated by the difference between hog marketings and slaughter since the mid 1990’s which lead to an effective export pricing basis for hogs in Ontario.

Crowding Out: The Real Ethanol Issue in Canada
18
2,000,000
2,500,000
3,000,000
3,500,000
4,000,000
4,500,000
5,000,000
5,500,000
6,000,000
1990 1991 1992 1993 1994 1995 1996 1997 1998 1999 2000 2001 2002 2003 2004 2005 2006 2007
Total M
arketings, Head
ON Hog Marketings ON Hog Slaughter
Figure 3.9 Total Ontario Hog Marketings and Ontario Hog Slaughter

Crowding Out: The Real Ethanol Issue in Canada
19
3.2 Corn Tradeoffs in a Growing Ethanol Market The above section provides historical background to Ontario’s corn economy. However, rather than a stable situation characterized by reversion to a long run average, the corn market is in the midst of a powerful trend toward ethanol expansion. This section provides an estimate of how this is likely to affect other corn consuming industries in the Ontario market. To start, we assume that, consistent with the discussion in Section 2, cattle and hogs are the residual claimants on corn in Ontario. Secondly we note that, consistent with Mussell, Oginskyy, and Hedley (2008), any jurisdiction that has a significant dependence upon exports in commodity beef or pork must have a cost advantage linked to feed. In particular, Ontario is on an export pricing basis for livestock and meats, so it cannot sustainably be on an import price basis for corn. The implication is that, even if the future continued like the past in terms of corn utilization, Ontario’s red meat industry must shrink to erase the impact of imported corn and get back to an export basis for corn. Here, we extend Mussell, Oginskyy, and Hedley to account for the fact that future corn utilization looks very different from the past. To estimate the impact of planned ethanol development in 2008-09, the following was undertaken. Starting with average Ontario corn production for the period 2003-07 as an indicator of the future corn production base, linear trend consumption of corn in food and industrial uses exclusive of ethanol, and anticipated ethanol use of corn beyond 2009 were subtracted. Next, corn consumption in feeding supply managed livestock was subtracted, with allowance made for maximum use of DDG in rations. Finally, the residual corn was allocated to feeding cattle and hogs, with imposition of maximum feasible inclusion rates of DDG in livestock rations. To do so, first, the data reported as “food and industrial use” needed to be fragmented to project growth in corn use in ethanol. This was done by subtracting implied ethanol use of corn from the aggregate category according to the assumptions cited for Table 3.1. Thus, prior to 2006, corn demand in ethanol was from the Chatham and Tiverton plants. For 2006, it was assumed that the St. Clair plant operated for 6 months. In 2007, it was assumed that the Collingwood plant operated for six months. Thus, historical non-ethanol food and industrial use were estimated as a residual. For the purpose of projections for 2008 and 2009, a five year trend was used to project food and non-ethanol industrial use. Ethanol demand for corn was estimated based on the conversion factors and plant openings described in Table 3.1. It was assumed that the Aylmer and Johnstown plants would operate for one quarter in 2008, and that the St. Clair ethanol expansion and the new Sarnia plant would open mid-year 2009. In steady state, all plants are assumed to be fully operational. The results of this procedure are presented in Table 3.2.

Crowding Out: The Real Ethanol Issue in Canada
20
Table 3.2 Utilization of Corn in Ethanol, Human Food, and Industrial Use Total Human food, ethanol and other industrial use Estimated Ethanol
Implied Food and Non-Ethanol Industrial
1997 1,380,000 439,410 940,590 1998 1,545,000 439,410 1,105,590 1999 1,690,000 439,410 1,250,590 2000 1,860,000 439,410 1,420,590 2001 1,980,000 439,410 1,540,590 2002 2,070,000 439,410 1,630,590 2003 2,150,000 439,410 1,710,590 2004 2,200,000 439,410 1,760,590 2005 2,180,000 439,410 1,740,590 2006 2,075,000 631,446 1,443,554 2007 2,750,000 873,412 1,876,588
2008* 3,106,824 1,403,433 1,703,391 2009* 3,814,394 2,171,579 1,642,816
Steady State*
4,416,218
2,747,688
1,668,530
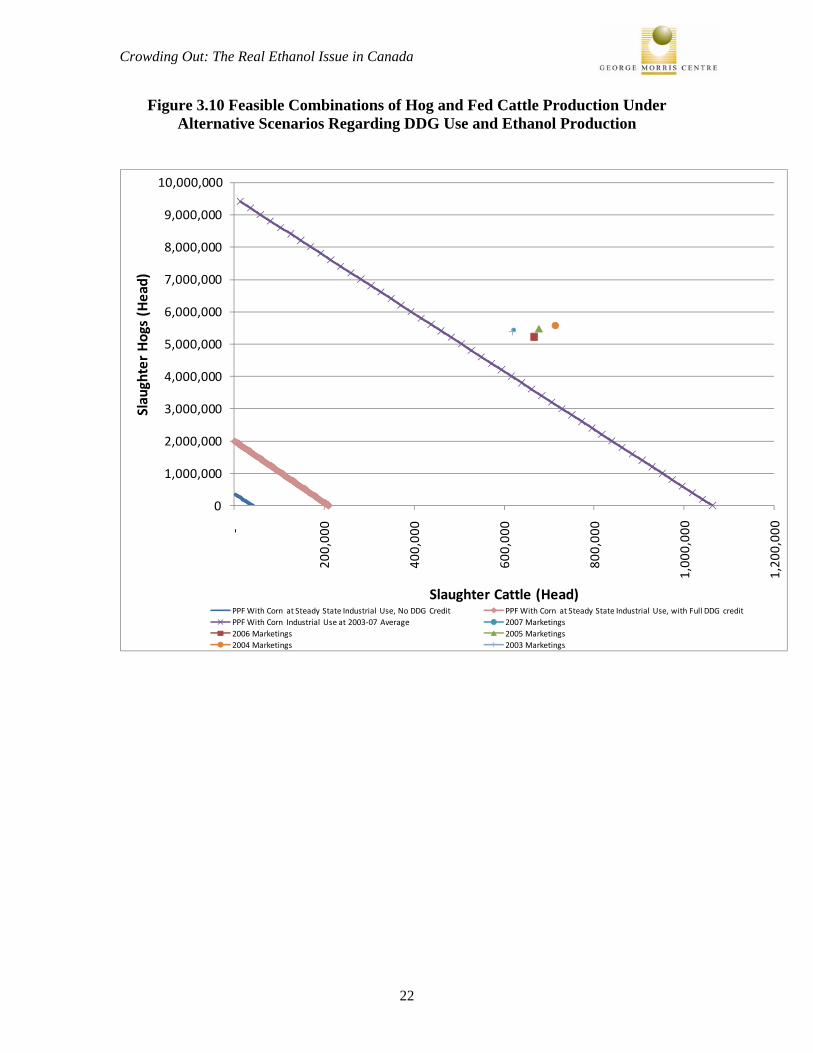
*Estimated Next, we estimate corn utilization in feed by species and the extent to which DDG produced by ethanol plants could be used to mitigate corn usage in livestock feeding. This was done using the George Morris Centre Feed Grain Cost Optimization model described in Mussell, Oginskyy, and Stiefelmeyer3, which is based on US National Research Council values. Feeding values for turkeys and laying hens were based on industry sources and assumptions based on feed conversion and corn inclusion rates were used. The parameters are presented in Table 3.3 below and the basic ration formulations, with and without DDG, are presented in Appendix 1. The table suggests that corn requirements to feed supply managed livestock are typically about 1.4 million tonnes, with slaughter cattle consuming about 1.34 million tonnes, and hogs about 1.2 million tonnes. The implication of maximum utilization of DDG in diets in terms of reduced corn consumption was estimated using the George Morris Centre least-cost ration model, based on 2007-08 average prices. In the cases of turkey and laying hens, the same proportional adjustment in corn utilization was attributed as observed in chicken rations reformulated for maximum DDG use. The table shows that when maximum use of DDG is imposed, the corn requirement in feeding livestock decreases by about 270,000 tonnes or about 7%, thus dampening implied adjustment in livestock feeding as corn consumption by ethanol increases. However, the adjustment in red meat livestock feeding remains dramatic. This is illustrated in Figure 3.10. The figure plots the feasible production of hogs and fed cattle 3 Maximum inclusion rates of DDG assumed are 20% for beef cattle, 20% for dairy cows, 20% for hogs, 10% for poultry; all on dry matter basis.

Crowding Out: The Real Ethanol Issue in Canada
21
given indigenous corn supplies under three scenarios. Under the first scenario, corn production and supply management feed consumption of corn is assumed at 2003-07 averages, and total food and industrial use of corn is assumed at its “steady state” value as described in Table 3.2 above. Given these assumptions, feasible production combinations of hog and cattle production are estimated assuming that food, industrial and supply management feeding demands for corn are satisfied first, and with no attribution of DDG in feed. In the second, the first scenario is repeated but with the feeding value of DDG reflected at maximum inclusion rates. Finally, a scenario is considered that provides a recent historic reference using actual 2003-07 averages for corn production, supply management feed demand, and food and industrial use, and attributes no use of DDG in livestock feeding.
Table 3.3 Corn Use in Feed With and Without DDG
The figure suggests the potential for dramatic changes in red meat livestock segments. Under the scenario ignoring DDG as feed, adjustment is the most dramatic as indigenous corn production allows for production of about 350,000 hogs and no fed cattle, or about 43,000 head of fed cattle and no hogs, or some combination. This compares with 2007 marketing levels of 5.4 million hogs and 622,000 head of fed cattle. Under the scenario feeding imposing maximum inclusion of DDG, feasible red meat livestock is significantly higher. The figure shows that marketings of about 2 million hogs or 211,000 head of cattle, or some combination, are feasible with indigenous corn. The third scenario shows that, with food and industrial use of corn at 2003-07 averages, much higher levels of red meat livestock production are possible, but that compared with actual marketings in that period corn imports were clearly required. This is consistent with the presence of corn imports observed in Figure 3.1, and with the finding by Mussell, Hedley, and Oginskyy that hog and cattle marketings must shrink. Thus, the reallocation of corn into ethanol production will result in what can be expected to be a very significant reduction in red meat livestock production in Ontario. The economic significance of this reallocation is explored in the next section.
Inventory/ Slaughter
(Head)
Corn Consumption Without DDG, Metric
tons
Max Inclusion Rate, % DM
Corn Consumption With DDG at Maximum
Inclusion, Metric tons Per Head Total Per Head Total
Dairy 340,325 2.04 680,039 20% 1.103 366,968Chicken 202,226,750 0.0024 485,344 10% .0025 505,567Turkey 93,379,000 0.0137 117,310 10% .0143 122,198Laying Hens 9,596,250 0.0194 186,167 10% .02 193,924Hogs 5,407,206 0.223 1,205,807 20% .181 978,704Slaughter cattle 669,799 2.0 1,339,598 20% 1.73 1,158,752Total Corn Use in Feed 3,595,800 3,326,114
Crowding Out: The Real Ethanol Issue in Canada
22
0
1,000,000
2,000,000
3,000,000
4,000,000
5,000,000
6,000,000
7,000,000
8,000,000
9,000,000
10,000,000
‐
200,00
0
400,00
0
600,00
0
800,00
0
1,00
0,00
0
1,20
0,00
0
Slaughter Hogs (Head)
Slaughter Cattle (Head)PPF With Corn at Steady State Industrial Use, No DDG Credit PPF With Corn at Steady State Industrial Use, with Full DDG creditPPF With Corn Industrial Use at 2003‐07 Average 2007 Marketings2006 Marketings 2005 Marketings2004 Marketings 2003 Marketings
Figure 3.10 Feasible Combinations of Hog and Fed Cattle Production Under Alternative Scenarios Regarding DDG Use and Ethanol Production

Crowding Out: The Real Ethanol Issue in Canada
23
4. Economic Significance of Corn Reallocation The results above suggest that, in the near future, a very large reallocation of corn will occur away from red meat livestock and toward ethanol production. This section measures the value of that reallocation. To provide a comparable measure of the value of corn allocated to feeding hogs, feeding cattle, or producing ethanol, we adopt as comparator the contribution margin per tonne of corn. This measure captures the value of output, exclusive of subsidy, compared to the value of variable inputs consumed in production, relative to the yield of output from corn (in value terms). In so doing, we avoid the possible distortions introduced by including fixed costs that are enterprise specific and tend to be capitalized based on residual income streams. Section 4.1 provides an analysis of corn used in pork production. Section 4.2 analyzes corn used in beef production. Section 4.3 considers the value of corn used in ethanol production. Section 4.4 draws observations from these analyses.
4.1 Value of Corn Transformed as Pork To consider the value of corn transformed into pork, we start with the constructed value of the hog carcass based on pork cuts and primals, subtract the cost of slaughter, and subtract the feed, labour, and variable costs of hog. This is then divided by the consumption of corn by the hog, assuming no use of DDG. Table 4.1 below reports estimated Canadian hog contribution margins, fragmented by year and industry segment. Carcass cutout values are based on data from Ronald A. Chisholm and the Canadian Pork Market Review. The table suggests that hog carcass values averaged around $156/head from 2003 to 2007. Associated with this, we assume a cost of $25/head for slaughter and cutting in a federally inspected facility. Thus, the value of the carcass net of slaughter and cutting costs has averaged around $131/head since 2003. To obtain farm production costs, we extend the model developed by Martin et al and apply the US Midwest model to Ontario prices. A technical description of the model is presented in Appendix 2. The table shows that when farm variable costs and the cost of slaughter and cutting are subtracted from the carcass cutout value, the contribution margin has averaged just over $20/head, or about $93/tonne of corn allocated to hog production
4.2 Value of Corn Transformed as Beef To estimate the value of corn transformed into beef, a similar approach as above was applied, with an additional consideration. The feedlot sector in Ontario (and elsewhere) is organized such that cattle feeding is conducted as a specialized enterprise with feeder cattle purchased from the cow-calf sector. There is an inherent tendency for gross margins from cattle feeding to be capitalized into feeder cattle prices such that the profitability from cattle feeding is largely dissipated if the feedlot segment is viewed in isolation. To account for this, we amend the approach used with hogs above to exclude

Crowding Out: The Real Ethanol Issue in Canada
24
feeder cattle purchases, as the approximate value of this contribution margin is the transfer from the feedlot segment to the upstream cow-calf segment. In practice, only a very small amount of the contribution margin over the cost of feeder cattle is retained; periodically the contribution margin is a loss. To account for this, we simulate the contribution margin at, respectively, 2% and 4% of the margin exclusive of feeder cattle.
Table 4.1 Estimated Canadian Hog Carcass Value
Carcass Value $/Head
Cost of Slaughter and Meat Cutting, $/Head
On-Farm Variable Costs, $/Head
Contribution Margin,
$/Head
$/tonne Corn
Consumed2003 149 25 114.34 9.66 43.322004 177 25 116.90 35.1 157.402005 166 25 102.74 38.26 171.572006 147 25 102.17 19.83 88.922007 141 25 115.28 0.72 3.23
Average 156 25 110.25 20.75 93.05 Table 4.2 below reports estimated Canadian fed cattle contribution margins, fragmented by year and industry segment. Carcass cutout values are based on data from Canfax and Canadian Cattle Buyer. The table suggests that beef carcass values averaged around $1500/head from 2003 to 2007. Associated with this, we assume a cost of $220/head for slaughter and cutting in a federally inspected facility. Feedlot costs are obtained from a model described in Appendix 3 that feeds slaughter cattle from a weight of 925 lbs to 1390 lbs on a 150-day cycle. The costs of feed and variable costs averaged about $412/head, exclusive of feeder cattle. When the contribution margin is taken at 2-4% of the margin exclusive of feeder cattle, the table shows average contribution margins of about $18-$35/head, or about $9-$18/tonne4.
4 It is acknowledged that when contribution margins are estimated as a percentage from a margin exclusive of feeder cattle, the effect of negative cattle feeding and processing margins is masked. Contributions in cattle feeding and processing in Ontario are tight, and are periodically negative. This has especially been the case in 2006-07.

Crowding Out: The Real Ethanol Issue in Canada
25
Table 4.2 Estimated Canadian Cattle Carcass Value
Carcass Value $/Head
Cost of Slaughter and Meat Cutting, $/Head
On-Farm Variable Costs Exclusive of
Feeder Cattle, $/Head
Contribution Margin, Assuming 4% of Margin
over Feeder Cattle Retained
Contribution Margin, Assuming 2% of Margin
over Feeder Cattle Retained
$/Head
$/tonne Corn Consumed $/Head
$/tonne Corn Consumed
2003 1626 220 426.06 39.20 19.60 19.60 9.802004 1494 220 414.34 34.39 17.19 17.19 8.602005 1475 220 354.72 36.01 18.01 18.01 9.002006 1475 220 387.28 34.71 17.35 17.35 8.682007 1490 220 479.43 31.62 15.81 15.81 7.91
Average 1512 220 412.37 35.19 17.59 17.59 8.80
4.3 Value of Corn Transformed as Ethanol and DDG To consider the value of corn transformed into ethanol, we start with an ethanol plant model developed by Tiffany in which an ethanol plant transforms corn into ethanol and DDG at a rate of 2.75 US gallons of ethanol and 18 lbs DDG per bushel. It is assumed the plant has a nameplate capacity of 50 million US gallons and normally operates at 80% capacity. Utilization of natural gas and other variable inputs were taken from Tiffany, assuming the Canadian dollar at par with the US. Ethanol pricing is taken at US wholesale average, and DDG is priced according to Chatham price quotes. For transparency, ethanol operating and capital subsidies are ignored. The technical aspects of the model are described in Appendix 4. In estimating returns to ethanol manufacturing, the evolution in the market constrains the relevance of historical data. Prior to early 2007 ethanol traded at a significant premium to unleaded gas and ethanol has since retreated to a price discount compared with unleaded gas. This is illustrated in Figure 4.1. The reason for this spread reversal is that, in mid-2006, methyl-butyl ester (MTBE) essentially ceased to be used as oxygenate in unleaded gasoline in the US, and ethanol captured that oxygenate market. For unleaded gasoline requiring oxygenate (Reformulated Blendstock for Oxygenate Blending, or RBOB), ethanol is the only available oxygenate. However, conventional blends of unleaded gasoline (Conventional Blendstock for Oxygenate Blending, or CBOB) do not require oxygenate. The US RBOB oxygenate market is essentially filled; in order for ethanol to compete as a blend in CBOB it must displace unleaded gas and compete on price, with a discount for relative energy value. In other words, growth in ethanol volume must occur as a competitive fuel rather than as oxygenate, and it must be priced as such. Thus, the model is run using historical data for 2006 and 2007 since market conditions were different prior to that time period in ways that are unlikely to reoccur. To estimate

Crowding Out: The Real Ethanol Issue in Canada
26
0.0000
0.5000
1.0000
1.5000
2.0000
2.5000
3.0000
3.5000
4.0000
Feb. 06
Mar. 06
Apr. 06
May. 06
Jun. 06
July. 06
Aug. 06
Sep. 06
Oct. 06
Nov. 06
Dec. 06
Jan. 07
Feb. 07
Mar. 07
Apr. 07
May. 07
Jun. 07
Jul. 07
Aug. 07
Sept. 07
Oct. 07
Nov. 07
Dec. 07
Jan. 08
Feb. 08
Mar. 08
Apr. 08
May. 08
$/US Gallon, Chicago
Ethanol RBOB
future profitability given the large increase in ethanol production that will occur in the future, we use key futures prices to forecast 2009 costs and returns. Finally, the analysis is limited to ethanol production as no further downstream value added is observed in ethanol production. Figure 4.1 Unleaded Gasoline (RBOB) and Fuel Ethanol Prices at Chicago

Crowding Out: The Real Ethanol Issue in Canada
27
The results are presented in Table 4.3 below. The table shows that, in 2006 ethanol contribution margins amounted to about $132/tonne corn. Much lower contribution margins of about $24/tonne were realized in 2007. Over the two years, contribution margins averaged $78/tonne of corn consumed. Futures prices for 2009 suggest that, absent the operating subsidies, ethanol production will see a negative contribution margin equivalent to about $23/tonne of corn in 2009. For the purposes of context, the fixed cost that contribution margins apply against is about 13¢/litre, or about $54/tonne of corn. The above results are exclusive of public assistance targeted to ethanol. However, the discussion of ethanol gross margins is incomplete without reference to the public assistance targeted to support the ethanol mandate. Historically, ethanol benefitted from a blending tax credit of $.145/litre from the Ontario government and $.10 from the federal government. In January, 2007, Ontario support was switched to operating assistance contingent on market conditions of up to $.11/litre. In April of 2008, federal assistance switched to operating assistance of up to $.10/litre, conditional on market conditions. The estimated levels of public assistance, exclusive of capital assistance, are presented in Table 4.4 below. The table provides an estimate of actual ethanol production based on plants operating at 80% capacity and timing of production coming online as described above in Tables 3.1 and 3.2. For 2006, the public assistance for ethanol production is the federal and provincial blending tax credit. For 2007, federal assistance is given by the federal blending credit, and with actual provincial operating assistance of $.05/litre estimated from formulas used by the Ontario Ethanol Growth Fund (OEGF) based on annual average crude oil, ethanol, corn, and currency values. For 2008 and future periods, the operating subsidy from federal and OEGF sources is assumed to be at cap levels, based on oil price projections from the US Energy Information Agency and corn price forecasts by the Food and Agricultural Policy Research Institute. The table shows that in order to generate the contribution margins observed above for 2006 and 2007, transfers from the combined treasuries of $52 to $61 million, or $59 to $96/tonne of corn consumed, are implied. When the full complement of Ontario ethanol production comes on stream after 2009, public expenditures for ethanol production are expected to increase to $237 million/year, or about $85/tonne of corn, excluding capital assistance. The contribution margins from ethanol observed in Table 4.2 do not include subsidy as a revenue item, so there is no subsidy to deduct in accounting for public support of ethanol. However, consistent with the blending tax exemption in the US, the Canadian tax exemption schemes, when they were in place, were implicit in the revenue stream received by ethanol, and thus represent subsidy unaccounted for.

Crowding Out: The Real Ethanol Issue in Canada
28
Table 4.3 Estimated Ethanol Plant Corn Conversion Value
Input and Output Prices
Ethanol and DDG Revenue, $/Litre Ethanol
Variable Costs, $/Litre
Contribution Margin, $/Litre
Contribution Margin, $/tonne Corn Consumed
Ethanol, $/Litre
DDG $/Tonne
Corn $/Tonne
Natural Gas $/MJ
2006 0.774 117.73 119.32 9.05 0.862 0.538 0.324 132.482007 0.573 137.83 159.93 8.57 0.681 0.622 0.06 24.392006-07 Average 0.7715 0.58 0.192 78.4352009 Forecast 0.608* 231.57** 246.36** 8.805*** 0.79 0.847 -0.057 -23.27
*Based on April 2009 futures close of $ 2.15/gallon, as of Sep 5th, 2008 and March 2009 Canadian dollar futures ($Can 1=$US .935) **Based on 94% of corn price *** Based on composite of May-Sep 2009 CBOT corn futures prices of approximately $5.85/nushel., as of Sep 5th, 2009 and March 2009 Canadian dollar futures ($Can 1=$US .935) ****Based on composite of April-Sep 2009 NYMEX natural gas futures, assuming an Alberta-Henry Hub spread of -1.50/mmBTU and March 2009 Canadian dollar futures ($Can 1=$US .935)
Table 4.4 Ethanol Operating Assistance
Estimated Ethanol
Production, Litres
Estimated Per Unit Assistance, $/Litre Total ($)
Per tonne of corn
consumedFederal Provincial
2006
248,000,000
Blending Tax Credit
.10
Blending Tax Credit
.145
60,760,000 95.71
2007
348,800,000
Blending Tax Credit
.10
Operating Subsidy
.05
52,320,000 59.38
2008
569,600,000
Operating Subsidy
.10
Operating Subsidy
.11
119,616,000 84.20
2009
889,600,000
Operating Subsidy
.10
Operating Subsidy
.11
186,816,000 84.82
Steady State
1,129,600,000
Operating Subsidy
.10
Operating Subsidy
.11
237,216,000 85.06

Crowding Out: The Real Ethanol Issue in Canada
29
Thus, to reflect the effect of the true social value of ethanol, the federal and provincial blending tax credits are removed from the contribution margin estimate for 2006, and the federal blending credit should be removed from the 2007 contribution margin. When this adjustment is made, ethanol contribution margins look much different. This is presented in Table 4.5. The table shows that when the effect of tax credits is deducted, ethanol contribution margins are small or even negative. Based on 2006-07 averages, ethanol plants generated only $8/tonne of corn consumed when the implicit effect of the tax credit is removed.
Table 4.5 Estimated Ethanol Plant Corn Conversion Value, After Removal of the Implicit Tax Credit Subsidy
Contribution Margin, $/Litre
Implicit Subsidy from Tax Exemption, $/Litre
Contribution Margin Less Subsidy, $/Litre
Contribution Margin Less Subsidy, $/tonne Corn Consumed
2006 0.324 .245 .079 32.33 2007 0.06 .10 -.04 -16.37
2006-07 Average 0.192 .1725 .0195 7.98
2009 Forecast -0.057 0 -23.27
4.4 Observations The sections above suggest there is significant variability in value added across alternative uses of corn, and over time. Pork is generally the most valued use of corn among those compared but the returns are indicative of the hog cycle and of the recent challenges faced by the pork sector. In beef, returns to corn are generally lower than in hogs due in part to sharply different rates of feed conversion, and the struggle that has occurred in the beef industry since BSE. Returns were clearly better in 2006 than in 2007. However, when the effect of tax credit benefit allocated to ethanol is deducted, ethanol plants generated a negative contribution margin. The current best estimate of ethanol contribution margins that is consistent with the full complement of Ontario ethanol capacity coming on stream in 2009 is a loss of about 6¢/litre, or nearly $23/tonne of corn. What can be observed regarding competition between livestock/meats and ethanol for corn? One way to interpret the results above is in terms of the value of corn allocated to red meat livestock vs. ethanol. To do so, we aggregate the contribution margin of corn used in pork and beef production together based on 2003-07 averages based on shares of total corn consumption. When we do so, we observe an average per tonne contribution margin of between $48.40/tonne and $53.06/tonne in pork and beef. Absent the operating subsidy to ethanol plants, current estimates of input and output prices based on futures market suggest a $23/tonne loss. Thus, based on red meat history and prudent

Crowding Out: The Real Ethanol Issue in Canada
30
forecasts for ethanol, pork is the most efficient corn user in the group, beef is a less efficient corn user, and ethanol stands to make a negative contribution margin.
Table 4.6 Livestock Contribution Margin per Tonne Corn Consumed
Marketings (Head)
Implied Corn Consumption (tonnes) Share
Contribution Margin ($/tonne Corn Consumed)
Contribution Margin ($/tonne Corn Consumed)
Pork 5,407,206 1,205,807 0.474 93.05 93.05 Beef 669,799 1,339,598 0.526 8.80* 17.59**
Total 2,545,405 48.40 53.06*Assuming 2% of margin before feeder cattle captured **Assuming 4% of margin before feeder cattle captured In order to fully measure the impact of the reallocation of corn to ethanol on the red meat sector, some sense of adjustment in livestock as well as in meat packing is required. Figure 3.10 gives feasible levels of hog and cattle marketings under the maintained hypothesis that the red meat sector can only be based on indigenous corn (i.e. it requires an export pricing basis) to be cost competitive given its export focus. Rather than estimate optimal levels of hog and cattle marketings under the feasibility conditions illustrated in Figure 3.10, we assume that the path of adjustment will retain the existing ratio of hog marketings to cattle marketings, and that adjustment would occur to the point of full use of DDG in the Ontario market. Thus, we determine the point in hog:cattle marketing space in Figure 3.10 that lies on the “With Full DDG Credit” constraint line, and retains the current ratio of hog:cattle ratio. The current ratio of hog to cattle marketings is 8.07; on the constraint line in Figure 3.10 this ratio lies at the point of about 925,000 hog marketings and cattle marketings of about114,000 head. A measure of the cost of ethanol crowding out of red meat is the per head contribution margin over the number of hog and cattle marketings that are reduced in adjustment to ethanol expansion. However, consistent with Mussell, Hedley, and Oginskyy we note that based on 2003-2007 averages, Ontario red meat livestock marketings were already in excess of the indigenous corn available to supply it, and retrenchment in these marketing was warranted prior to the ethanol expansions slated to occur in 2008 and 2009. This is consistent with the shift from the cluster of points representing actual marketings in Figure 3.10 to the line delineating production possibilities based on 2003-07 industrial use of corn. It would be inappropriate to assess the cost of this adjustment to ethanol, so this is factored out below. An estimate of the above restructuring is made by taking the contribution margin per head from Tables 4.1 and 4.2 and multiplying by the predicted adjustment in marketings. This is presented in Table 4.7 below. The table shows that reduced marketings of 807,000 hogs and about 119,000 head of cattle are warranted just to get back to long run average indigenous corn availability, based on the received situation in which essentially no DDG is used. A further reduction of 3.7 million hogs and 436,000 head of cattle is based on ethanol expansion to the steady state at the end of 2009, assuming full use of DDG. The remaining marketings would be 925,000 hogs and 115,000 head of cattle.
Crowding Out: The Real Ethanol Issue in Canada
31
The reduction of 3.7 million hogs due to ethanol expansion results in a lost contribution margin of about $76 million per year, and the losses from cattle marketing reductions of 436,000 head are between about $7.7 million per year and $15.3 million per year. The total cost to the farm and primary processing components of the beef and pork supply chains is between $84 million and $92 million annually. The corn allocated away from red meat livestock will be used to produce 1.13 billion litres of ethanol by the end of 2009. Based on best available current forecasts from futures markets, this will generate a negative contribution margin before subsidy of 5.7¢/litre, or an aggregate loss of about $64.4 million. Thus, as shown in Table 4.8, the net cost of the corn reallocation from red meat to ethanol to the Ontario economy can thus be expected to be $148 million to $156 million per year.

Crowding Out: The Real Ethanol Issue in Canada
32
Table 4.7 Value of the “Crowding Out” Effect on Ontario Red Meat Livestock
Hogs Cattle 2% of Margin over Feeder Cattle Retained
4% of Margin over Feeder Cattle Retained
2003-2007 Average Marketings 5,407,206 669,799 669,799 Reduction in Marketings Due to 2003-07 Average Corn-Livestock Balance, no DDG 807,206 119,229 119,229 Reduction in Marketings Due to Ethanol Expansion in 2008-09 with Full DDG Credit 3,675,000 435,968 435,968 Remaining Marketings With Corn at Steady State Industrial Use and Full DDG credit 925,000 114,602 114,602
Contribution Margin per Head 20.75 17.59 35.19Lost Contribution Margin 76,256,250 7,668,670 15,341,700
Total, Assuming 2% of Margin over Feeder Cattle Retained 83,924,920 Total, Assuming 4% of Margin over Feeder Cattle Retained 91,597,950

Crowding Out: The Real Ethanol Issue in Canada
33
Table 4.8 Net Cost of Corn Allocated to Ethanol and Away From Red Meat 2% of Margin over Feeder
Cattle Retained 4% of Margin over Feeder Cattle Retained
Pork Lost Contribution Margin
76,256,250 76,256,250
Beef Lost Contribution Margin
7,668,670 15,341,700
Ethanol Negative Contribution Margin
64,387,200 64,387,200
Total Economic Loss 148,312,120 155,985,150
Crowding Out: The Real Ethanol Issue in Canada
34
5. Conclusions The purpose of this paper was to consider, and logically trace the impacts of ethanol development in Canada. To do so, we developed a framework within which to understand competition for feed grains and residual users. Using Ontario and corn as an illustration, we traced corn production and apparent feed and non-feed consumption of corn historically, and then superimposed future use of corn in ethanol on this dynamic and observed the implied shift in red meat livestock. Finally, we estimated the impact of ethanol “crowding out” livestock in terms of contribution margins per tonne of corn consumed and per head of livestock reduced, relative to the value of ethanol generated. Based on the maintained hypothesis that red meat livestock is located in Ontario to take advantage of available corn, the results suggest a dramatic shift is forthcoming. Sharp increases in ethanol production and its concomitant increase in corn consumption will leave red meat livestock to a restructuring that will see it literally a shadow of its former self. The results also show that, despite very difficult years in 2006 and 2007, pork generates the largest contribution margin relative to corn consumed. Since 2003, beef has struggled under relatively low contribution margins per tonne of corn consumed. Ethanol returns were sharply lower in 2007 compared with 2006, but after the implied effect of the tax incentives are removed, both years were marginal. Current estimates of returns exclusive of subsidy for 2009 are for a significant loss in ethanol production. It is critical to recognize that the issue raised here is unique to a livestock and meat exporting country. The intensity with which Canada produces livestock and meat is predicated on export and on relatively inexpensive feed grains as its rationale. For the US, which remains primarily a domestic meat supplier, the effect of ethanol development will be to increase feed costs which will eventually result in higher meat and livestock prices. But because the US meat industry is domestically focused, it faces little real threat due to loss of competitiveness as its feed grain prices increase. Conversely, for Canada, increases in its relative feed grain prices could prove calamitous for the red meat industry. The rate of expansion in ethanol production, and thus the rate at which Ontario corn is being reallocated, is not consistent with red meat as a more highly valued use of corn. Rather, the subsidies and mandates encouraging ethanol production can be seen as driving this change. The measured cost of this corn reallocation in Ontario when currently planned ethanol production comes online is $148-$156 million per year. Indeed, the true cost must be much greater than this, as no costs due to lost profitability and reduction in capacity in supplying industries such as feed milling, animal genetics and breeding, veterinary services, and animal pharmaceuticals is attributed. Moreover, the potential loss to upstream producing segments, notably in cattle (cow-calf and backgrounding) have not been included. Indeed, as ethanol crowds out cattle production, it will eventually crowd out much of the cow-calf segment which is based on pasture and grassland. It further begs the question of how grassland might be reallocated
Crowding Out: The Real Ethanol Issue in Canada
35
if maintaining cow herds cease to be its highest and best use. This presents the prospect that as ethanol forces out the cattle industry, it may induce reallocation of pasture to produce feedstocks for ethanol, which itself poses new environmental sustainability questions. In addition, we have characterized the human food and non-ethanol industrial users of corn as protected from crowding out. In many cases, this may be a distinct oversimplification of the situation, thus further underestimating the costs of crowding out. For example, purchasers of corn to manufacture corn sweeteners in Canada probably only have a limited ability to pass through cost increases due to ethanol before they come under threat of market share loss to imports. Even in some supply managed markets, pressure from imports or ingredient substitution exists that could lead to lost market under the movement to a long-term import basis for corn, despite the regulatory authority granted to pass through costs. Thus, the cost of ethanol crowding out must be significantly understated. Finally, these results only reflect the situation in Ontario. This was done because feed grains are essentially limited to corn in Ontario, and ethanol production in Ontario is also based on corn. The economic implications of ethanol production in Western Canada can be expected to be analogous, albeit with a greater complexity in terms of feed grains and feedstocks for ethanol, a much larger red meat livestock base, and even greater dependence on export markets and export competitiveness. To say the least, the findings regarding retrenchment in beef and pork are dramatic, and warrant pause to ask whether they are real. Some farmers will remain committed to livestock as their lives’ work even as others exit and processing capacity declines. Many farmers in both Eastern and Western Canada grow their own feed grains to feed their livestock, and provided that they cover their feed grain costs of production, they may choose to continue feeding on farm even if they could sell their crops at a higher price, mitigating the loss of red meat livestock. It is true that opportunity costs can be ignored in the short run; indeed, this seems to be what has happened much of this decade as we moved to an import basis for corn in Ontario and remained on an export basis for livestock and meat. But opportunity costs cannot be ignored forever. The first realization of this comes as inputs (especially land) are bid up by the highest valued use, and farmers growing crops to feed on-farm have difficulty competing for land with cash-croppers. The second realization occurs as lenders grow tired of financing livestock purchases that will be fed on farm, and direct their client to sell the crop instead. The final and most disheartening realization occurs when younger generations opt not to return to home to farms feeding grains grown on-farm because of the low returns and difficulty competing for resources. Thus, the anticipated adjustment will occur, but the timeframe may be extended. The literature on the development of ethanol manufacturing in North America has been dominated by debates regarding the relative environmental merits of ethanol. Alleged environmental advantages notwithstanding this study suggests, based on measurable costs and benefits, that ethanol production from feed grains represents significant economic

Crowding Out: The Real Ethanol Issue in Canada
36
self-injury to the Canadian economy. The red meat sector and its supporting industries are the principal victims. Ultimately, the cost Canada is inflicting upon itself by consuming ever greater proportions of feed grains into ethanol and thus making it impossible to leverage its efficient feed grain production in an export-based livestock and red meat is likely to be severe. The ultimate sustainability of reallocating feed grains into ethanol production should be questioned, and not just because of the injury to other sectors and the Canadian economy. At its root, ethanol production is driven by a policy mandate, which is subject to change with the political tide. Market-based initiatives, such as auto parts made from corn and other new uses for feed grain products are not subject to the same vagaries of politics, and are not subject to the same criticisms.

Crowding Out: The Real Ethanol Issue in Canada
37
References Auld, Doug. The Ethanol Trap: Why Policies to Promote Ethanol as Fuel Need Rethinking, CD Howe Institute Commentary #268. Ottawa: CD Howe Institute. July, 2008. Martin, Larry, Kevin Grier, Al Mussell, and Kate Stiefelmeyer. Relative Profitability of Hog Production in Western Canada and the US Midwest. George Morris Centre, October, 2001. Mussell, Al, Anatoliy Oginskyy, and Graeme Hedley. The Troubled Corn Economy of Ontario Livestock Sector: A Strategic Policy Analysis. George Morris Centre paper, July, 2008. Mussell, Al, Anatoliy Oginskyy, and Kate Stiefelmeyer. Status and Competitive Impacts of Ethanol Development on Canadian Livestock Industries. George Morris Centre Special Report, October, 2007. Tiffany, Doug. Ethanol Dry Mill Spreadsheet Tool. Available at http://www.agmrc.org/NR/rdonlyres/4C6BD4DE-8DA0-44F6-A9AE-02320DBF99F6/0/ethanolsuccess.xls

Appendix 1 Basic Ration Formulations
Table A1 Livestock Rations Assuming No Use of DDG, Metric tons as Fed
Table A2 Livestock Rations Assuming Maximum Use of DDG, Metric tons as Fed
Total Corn Grain Soymeal
Dicalcium Phosphate (Ca2PO3)
Alfalfa Silage
(Haylage)
Corn Silage
Meat and
Bone Meal
Pork Meal
Chicken Meal Fat
Corn Distillers Grains
Hogs 0.307 0.181 0.051 0.001 0.000 0.000 0.015 0.000 0.000 0.000 0.060 Beef Cattle 7.998 1.730 0.247 0.035 0.000 5.029 0.000 0.000 0.000 0.000 0.957 Dairy Cattle 21.137 1.103 1.103 0.031 1.950 14.815 0.000 0.000 0.000 0.000 2.134 Chickens 0.004 0.0025 0.0010 0.0001 0.000 0.000 0.0001 0.000 0.000 0.000 0.00034
Total Corn Grain Soymeal
Dicalcium Phosphate (Ca2PO3)
Alfalfa Silage
(Haylage)
Corn Silage
Meat and
Bone Meal
Pork Meal
Chicken Meal Fat
Corn Distillers Grains
Hogs 0.311 0.223 0.071 0.003 0.000 0.000 0.015 0.000 0.000 0.000 0.000 Beef Cattle 7.795 2.000 1.106 0.029 0.000 4.651 0.000 0.000 0.000 0.008 0.000 Dairy Cattle 21.342 2.040 2.308 0.000 0.079 16.915 0.000 0.000 0.000 0.000 0.000 Broiler Chickens 0.004 0.0024 0.0011 0.0001 0.000 0.000 0.0001 0.000 0.000 0.00002 0.000

Appendix 2 Description of Hog Enterprise Model
1. Based on a 1200 sow farrow-finish system, with 21.2 pigs marketed per sow at a dressed weight of 88 kg/head
2. Feed cost is based on a ration consisting of 2.06 metric tons of corn per sow, .66 metric tons of soymeal per sow, and .13 metric tons of premix per sow.
3. Corn prices were obtained from Agriculture and Agri-Food Canada (AAFC) for Chatham, Ontario track for the period 2003-2007. Soymeal prices were obtained from AAFC for Hamilton, Ontario for the same period. Premix was taken as a constant at $700/metric ton
4. Labor costs are $318/sow, based on a wage rate of $13.39/hour obtained from Human Resources and Social Development Canada for Waterloo, Ontario, NOC code 8253
5. Replacement gilt and boar costs result from scheduled culls and mortality. Gilts are purchased at breeding age based on a sow culling rate of 42% and a death loss of 5%. Gilts are priced at 2.5times the Ontario Pork index 100 market hog price. The ratio of boars to sows is 5%, so at 1200 sows there are 60 boars. The boar cull rate is assumed at 50%, and boars are priced at 7 times the Ontario Pork index 100 market hog price.
6. Other variable costs are taken as a constant at $488/sow 7. Operating Interest is charged on 50% of combined feed, replacement livestock,
labor, and other variable costs, prorated by a factor of 177/365 to account for the portion of a year in which hogs are on feed. Bank prime interest rates plus 1 percentage point were used to value operating interest, obtained from the Bank of Canada.

Crowding Out: The Real Ethanol Issue in Canada
40
Appendix 3 Description of Cattle Enterprise Model
1. A start weight for a steer of 925 lbs is assumed. Feed consumption is 2.35% of body weight per day. Finish weight is 1390 lbs and the feeding period is 150 days
2. Feed cost is based on a ration consisting of: i. 96% corn
ii. 4% concentrate iii. a $15.00/metric ton mixing charge
3. Weekly corn prices were obtained from two sources: Farm Market News (Western Ontario Feed) for the period 2001 to 2006 and AAFC weekly Chatham Elevator prices for the period 1990 to 2001. Analysis was undertaken for the period 2001 to 2006 to establish an average difference or basis between the two price series and this basis was applied to the weekly Chatham elevator prices for the period 1990 to 2001.
4. Weekly concentrate prices were derived as follows: 85% of the price of soymeal plus a fixed value to reflect the value of added urea, minerals, vitamins, drugs and growth promoters. The fixed value at week 1, 1990 was $150/metric ton and this value was inflated at 2.5% per year. This formula gives rise to a concentrate price of approximately $440/metric ton in late summer, 2006.
5. Soymeal prices were obtained primarily from Farm Market News (based at Hamilton) plus a derived value for the year 1990 using a basis adjustment to Chicago nearby future (as compared to Farm Market News).
6. Weekly feeder cattle prices were obtained from Ontario Cattlemen’s Association (OCA).
7. The following values over time were used for the analysis: Years Yardage rates Chute/drug/labor rates Transport Out rate $/hd/day $/hd/day $/cwt Steers Heifers 2003 0.33 0.11 0.14 0.85 2004 0.34 0.12 0.15 0.90 2005 0.35 0.12 0.15 0.95 2006 0.36 0.13 0.16 1.00
8. The “transport in” charge/cwt was based on 75% of the “transport out” charge/cwt – i.e. if the “transport out” charge was $1.00/cwt, the “transport in” charge was $0.75/cwt and each of these was applied to the start weight and finish weight of the cattle.
9. Interest is charged on 75% of the combined value of the purchased stocker plus half of the feed at 1% over the average bank prime rate for the period in which the cattle are on feed – (essentially 21 weeks for steers and 20 weeks for heifers). This assumes the feed is purchased on a weekly basis through the feeding period. Bank prime interest rates were obtained from the Bank of Canada.
10. Rail prices for cattle were obtained from the OCA. Only the “high” of the weekly range in price could be obtained for the period of analysis. The normal range in

Crowding Out: The Real Ethanol Issue in Canada
41
rail prices from “low” to “high” is $2.00 to $3.00/cwt. The rail price quotations in the data are before weight and grade discounts.

Crowding Out: The Real Ethanol Issue in Canada
42
Appendix 4 Description of Ethanol Plant Model The model plant has a nameplate capacity of 50 million US gallons (189 million litres), which makes it similar in capacity to existing plants such as Greenfield in Chatham, Ontario and St. Clair in Sarnia, Ontario. It is assumed that on a steady-state basis the plant would operate at 80% of capacity. Based on a model developed by Tiffany a conversion efficiency of 10.395 litres (2.75 US gallons) of fuel ethanol per bushel of corn and 8.2 kg (18 lbs) of distillers dried grains (DDG) is adopted. Heating requirements (supplied by natural gas) of 9747 GJ/litre ethanol is applied, along with an electricity requirement of .29 KWh/litre. Plant Revenues Plant revenues were based on the above ethanol yield multiplied by the historic Chicago daily spot ethanol price, converted to Canadian dollars/litre. DDG prices were obtained from Ontario farm market news and were multiplied by the above yield and output to obtain the DDG revenue estimate. No direct subsidies for plant operations are assumed. Direct Conversion Costs The key costs of ethanol conversion are corn, natural gas, electricity, and chemicals. Corn prices were obtained from Agriculture and Agri-Food Canada, based on Chatham-track. Natural gas prices were obtained for Alberta-AESO 30 day published by Sproule and Associates, and then adjusted for Ontario basis by assuming a $2.25/GJ transport differential. Electricity prices for Ontario were obtained from the Ontario Independent Electrical System Operator for industry, with an assumed charge for delivery, regulatory, and debt retirement charge of $.04/KWh. Chemical and enzyme costs were adopted from Tiffany and converted to Canadian dollars. Other Variable Cost Items Costs of labour, management and quality control, maintenance and repairs, operating interest, real estate taxes, licenses and insurance, and miscellaneous costs were obtained from Tiffany and were converted to Canadian dollars per litre based on annual average exchange rates. Fixed Costs The fixed costs of the plant were based on the plant recently built by Integrated Grain Processors Cooperative (IGPC) in Aylmer, Ontario, and linearly adjusted to 189 million litres from the IGPC plant capacity of 150 million litres. The estimated capital cost of the plant is $175.1 million. To convert establishment costs to annual fixed costs, the annuity method was used assuming a 15 year useful life for the plant, a hurdle rate of prime plus 2 percentage points, and a salvage value of 10% of initial cost.


![[PPT]PowerPoint Presentation - NDSU - North Dakota State …grier/eHeart-presentation.ppt · Web viewTitle PowerPoint Presentation Author Jim Grier Last modified by James W Grier](https://img.pdfslide.us/doc/110x75/5adf17f57f8b9a8f298c7439/pptpowerpoint-presentation-ndsu-north-dakota-state-griereheart-viewtitle.jpg)