Embed Size (px)
Citation preview
Hydrological Research Letters 14(1), 23–28 (2020)Published online in J-STAGE (www.jstage.jst.go.jp/browse/hrl). DOI: 10.3178/hrl.14.23
Potential for and feasibility of small hydropower generation at headworksin Japan
Fenglan Wang1, Keigo Noda2, Issaku Azechi3 and Masateru Senge1
1The United Graduate School of Agricultural Science, Gifu University, Japan2Faculty of Applied Biological Science, Gifu University, Japan
3Institute for Rural Engineering, National Agriculture and Food Research Organization, Japan
Abstract:
In this research, power generation potential is estimatedusing overflow discharge for eight headworks (Inuyama,Meiji-yousui, Muromatsubara, Kansakawa, Furikusa,Onyu, Hosokawa and Okajima) located in Aichi and GifuPrefectures, and the characteristics of their power genera‐tion are clarified in order to evaluate the feasibility of smallhydropower plants. The results are as follows. Firstly, over‐flow discharge is more stable than the discharge of intakewater at the headworks, which suggests that power genera‐tion using overflow discharge is more suitable for actualpower generation. Secondly, maximum power outputs of43 kW to 2,002 kW, under a discharge utilization factor of60%, show great potential for power generation at theseeight headworks. Finally, fluctuations in monthly powergeneration are higher than that of annual power generationdue to the influences of irrigation and seasonal changes inprecipitation on water intake.
KEYWORDS small hydropower generation; headwork;overflow discharge; intake water; maximumpower output; discharge utilization factor
INTRODUCTION
Since the accident at the Fukushima Daiichi NuclearPower Plant in 2011, the Japanese government has empha‐sized the further development of renewable energy, such assolar, wind power, thermal power, small hydropower andbiomass, through the introduction of a feed-in tariff (FIT)(Goto et al., 2012). The FIT is a policy designed to acceler‐ate investments in renewable energy technologies by offer‐ing long-term contracts to renewable energy producers(Huenteler et al., 2012; Goto et al., 2012). As an alternativesource of energy, attention is increasingly being focused onsmall-scale hydropower generation in the agricultural sec‐tor.
There is no clear official definition exists for smallhydropower facilities in each country. However, smallhydropower generation is generally defined around theworld as a maximum power output of 10 MW (Paish, 2002;Bockman et al., 2008). Small hydropower generation isregarded in Japan as having power output from 1 MW to
Correspondence to: Masateru Senge, Faculty of Applied Biological Sci‐ence, Gifu University, 1-1 Yanagido, Gifu 501-1193, Japan. E-mail:[email protected]
10 MW (Ministry of the Environment, 2003). According tothe National Small Hydropower Promotion Council(Japanese Water Agency, 2019), power output of less than1 MW is recognized as new energy which is supported bymeasures in the Renewables Portfolio Standard. The pur‐pose of these measures are to promote the use of newenergy through the obligatory utilization of a certainamount of electricity obtained from new energy by powergeneration industries. Here, the global definition for themost widely accepted value of power output up to 10 MWis used; it is herein referred to as small hydropower genera‐tion (SHP).
In Japan, 95% of the water used in agriculture comesfrom rivers (Okuda, 2010). However, it is difficult to con‐trol the amount of water intake under natural river condi‐tions due to large changes in river water levels accompany‐ing changes in flow rate because Japanese rivers arecharacterized by steep gradients and short lengths (Ueda etal., 2013). Therefore, by installing headwork across a river,the stable water level necessary for water intake can besecured, and water demand for the entire beneficiary areacan be supplied downstream using gravitational potentialenergy. Since Japanese topography is steep, many dropworks, torrent works, etc. were constructed in agriculturalwaterways, and SHP has been actively introduced utilizingthese existing works. This kind of power generation iscalled the agricultural water-dependent type of power gen‐eration. It has many advantages, such as being carried outwithin the range of agricultural water, so it does not requirethe acquisition of new water rights for power generation,and it generates power using existing water supply facili‐ties, which save construction and other costs. However,because fluctuations in flow rate between irrigation andnon-irrigation periods is large with this type of power gen‐eration, it has low power generation efficiency. On theother hand, in order to maintain the river water level neces‐sary for water intake at the headwork, surplus water (here‐inafter called overflow discharge) will flow downstream byoverflowing the spillway. Thus, headworks can be consid‐ered as candidate sites for high-quality power generationthat can secure a certain flow rate throughout the year and astable water level. However, only two SHP facilities havebeen installed at headworks in Japan to date (Miyai et al.,2018), even though there are 8,250 headworks in the coun‐
Received 17 October, 2019Accepted 23 December, 2019
Published online 28 January, 2020
© The Author(s) 2020. This article is distributed under the terms of the Creative Commons Attribution 4.0 International License (http://creativecommons.org/licenses/by/4.0/), which permits unrestricted use, distribution, and reproduction in any medium, provided you give appropriate credit to the original author(s)and the source, provide a link to the Creative Commons license, and indicate if changes were made.
—23—
try (Ministry of Agriculture, Forestry and Fisheries, 2008).The two facilities are the Shintawaraizeki Power Plant inOkayama Prefecture, with a capacity of 2,400 kW, and theGojyo Power Plant in Niigata Prefecture, with a capacity of1,100 kW; they utilize the effective head and the down‐stream discharge (Miyai et al., 2018). The reason for thesmall number of SHP installations at headworks is that acertain procedure must be followed for obtaining waterrights for power generation: permission must be obtainedfrom the river manager to construct the SHP facility in theriver, and the river maintenance flow rate must be consid‐ered in the area of reduced water in the actual planning. Inrecent years, in order to promote SHP facilities, the proce‐dure for obtaining water rights for power generation, basedon the non-agricultural water-dependent type of power gen‐eration, has been simplified (Ministry of Agriculture,Forestry and Fisheries, 2014). As a result, active introduc‐tion of small hydropower generation facilities at more andmore headworks can be expected in the future. Therefore,the purpose of this research was to clarify the feasibility ofSHP generation at headworks by analyzing the power gen‐eration potential and the characteristics of seasonal fluctua‐tions at the eight representative headworks located in Aichiand Gifu Prefectures.
MATERIALS AND METHODS
Introduction of research sitesThe daily overflow discharge of eight headworks located
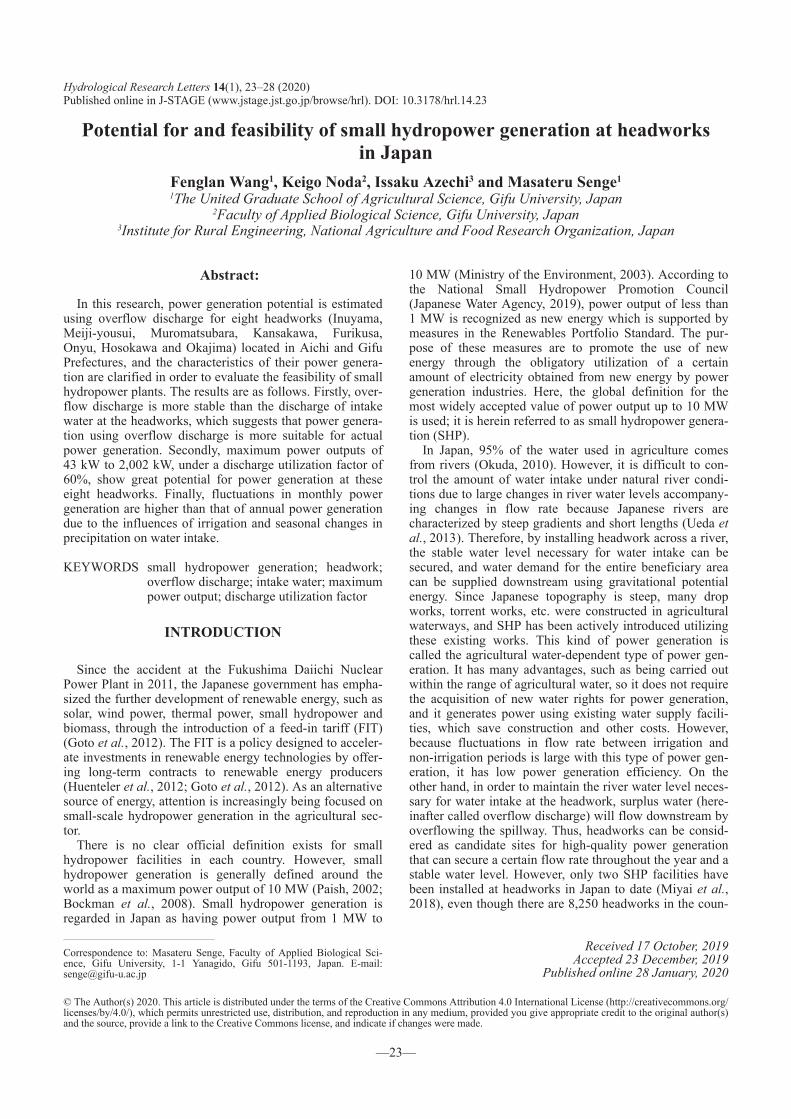
in Gifu and Aichi Prefectures has been recorded by theLand Improvement District for more than five years, asshown in Figure 1 and Table I.
Inuyama headwork (IY) is located about 59 km upstreamfrom the mouth of the Kiso River in Aichi Prefecture. Ittakes water (max: 51.06 m3/s) from the Kiso River to theKotsu, Hashima and Miyata irrigation districts (total of9,353 ha). Meiji-yousui headwork (MJ) is located about35 km upstream from the mouth of the Yahagi River inAichi Prefecture. It takes water (max: 42.19 m3/s) from theYahagi River to the Meiji-yousui district for agricultural,domestic and industrial use. No individual or entity isresponsible for using the amount of water being dischargedfrom MJ to the downstream of the Yahagi River; and there‐fore, it is possible for MJ to take the maximum amount of
water as is possible within the limits of the government’srules on water rights.
Five other headworks were constructed for the purposeof supplying water to the Toyokawa-yousui district in AichiPrefecture. The water of the Toyokawa-yousui district isbasically sourced from Ure and Oshima Dams. The waterreleased from these dams flows to the upstream of Ohnoheadwork (OH). The water demand of the Toyokawa-yousui district is taken by OH for agricultural, domesticand industrial use. Kansakawa headwork (KS) takes waterfrom the Toyokawa River to the upstream of OH. Further‐more, in the downstream of OH in the Toyokawa River,there is the Muromatsubara headwork (MM) which sup‐plies water to Toyohashi City and its surrounding area. Thecatchment area for Ure Dam is too small to supply thewater demand of the Toyokawa-yousui district. Thus, Onyuheadwork (ON) placed in the Onyu River and Furikusaheadwork (FK) placed in the Ochise River are integrated tosupply water to Ure Dam. Almost all the water taken byOH is used to meet the demand for water in the Toyokawa-yousui district, for which very little overflow dischargeoccurs, including fishways to the downstream of OH. Thisis the reason why OH was not selected for the analysis of
Figure 1. Locations of the test headworks
Table I. Details and available data for the 8 test headworks
HeadworkLocation (°) Weir height
(m)Weir length
(m)Effectivehead (m)
Max. intake(m3/s)
Analysis duration(y.m.d~y.m.d)
Availabledata (days)NL EL
Inuyama (IY) 35.39 136.94 4.5 420 5.8 51.06 2008.1.1~2017.12.31 3,329Meiji yousui (MJ) 35.05 137.18 5.6 167 5.6 42.19 1997.4.1~2018.03.31 7,669Muromatsubara (MM) 34.88 137.47 3.3 196 3.3 8.00 2002.1.1~2017.12.31 5,842Kansakawa (KS) 34.97 137.55 3.9 58 3.9 15.00 2002.1.1~2017.12.31 5,844Furikusa (FK) 35.08 137.68 2.5 34 2.5 15.00 2002.1.1~2017.12.31 5,691Onyu (ON) 35.14 137.70 3.8 30 3.8 5.00 2002.1.1~2017.12.31 5,429Hosokawa (HK) 35.03 137.18 2.1 64 2.1 18.71 2012.1.1~2017.12.31 2,188Okajima (OK) 35.48 136.57 3.3 162 3.3 21.70 2013.8.1~2018. 05.31 1,465
F. WANG ET AL.
—24—

power generation in this research.Hosokawa headwork (HK) is located in the Tomoe River
which is a tributary of the Yahagi River and takes water(max: 18.71 m3/s) for agricultural, domestic and industrialuse.
Okajima headwork (OK) is located about 60 kmupstream from the mouth of the Ibi River in Gifu Prefec‐ture, and takes water (max: 21.71 m3/s) from the Ibi Riverto the Seino irrigation district (5,332 ha).Methods
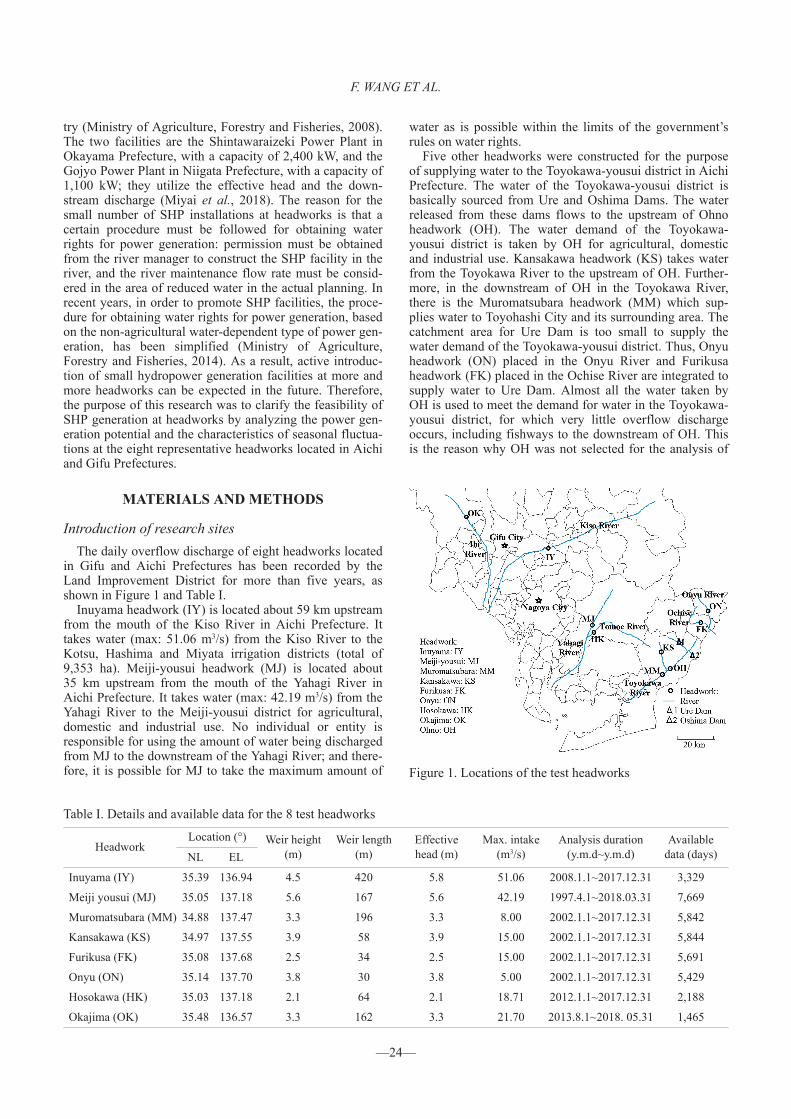
The daily overflow discharge is expressed as a percent‐age value which is defined as an exceedance probability(%). The relationship between the discharge utilization fac‐tor (%) and the exceedance probability of the overflow dis‐charge (%) was obtained as seen in Figure 2a when the cor‐responding daily overflow discharge was used as themaximum discharge for power generation.
Here, “discharge utilization factor” is an index expressedas the mean actual discharge divided by maximum dis‐
b
a
Figure 2. The discharge utilization factor and maximumpower output at each exceedance probability. a.Exceedance probability and discharge utilization factor. b.Exceedance probability and maximum power output ratio(circles show values for a discharge utilization factor of60%)
charge. The “mean actual discharge” is the average dailydischarge throughout the year under the upper limitation ofthe maximum discharge, while the “facility utilization fac‐tor” is represented by the actual power generation dividedby possible power generation. The “possible power genera‐tion” means the annual amount of power generation pro‐duced under the maximum power output (kW) throughoutthe year, and the “actual power generation” means theamount of power generation that is produced by the actualdischarge at the headwork under the limitation of theabove-mentioned maximum discharge. It is obvious that thefacility utilization factor increases with the decrease in themaximum power output produced by maximum discharge.According to the nonlinear relationship between the dis‐charge and the power output, the facility utilization factor is5% to 10% (median value: 7.5%) smaller than the dis‐charge utilization factor (New Energy Foundation, 2013).
In formulating the power generation plan, the facility uti‐lization factor is adopted as being from 45% to 60%(median value: 52.5%) (Ministry of Economy, Trade andIndustry Agency for Natural Resources and Energy, 2005).In this analysis, the discharge utilization factor wasassumed as the sum of the two median values, namely, 60%(= 52.5% + 7.5%), in order to obtain the maximum poweroutput. Power generation was estimated using this maxi‐mum power output.
The analytical method employed was used by Wang etal. (2018) to analyze the power generation potential, asdescribed below. Using the effective head and the dailyoverflow discharge (Table I), the power output was calcu‐lated with the following equation:
P = g × η × Q × H(P: power output [kW], g: gravitational acceleration [m/s2],η: general efficiency (= 0.72), Q: flow rate [m3/s] and H:effective head [m]).
Here, the effective head of IY and MJ was assumed to bethe difference between the upper and lower water levels,namely, 5.8 m and 5.6 m, respectively. For the other sixheadworks (MM, KS, FK, ON, HK and OK), the weirheight was used as the effective head (Table I). The generalefficiency is expressed by the product of the turbine effi‐ciency and the generator efficiency. According to the HydroValley Plan Guidebook (Ministry of Economy, Trade andIndustry Agency for Natural Resources and Energy, 2005),turbine efficiency is 0.75 to 0.90 (average value: 0.825) forsmall and medium hydraulic turbine generators and thegenerator efficiency is about 0.82 to 0.93 (average value:0.875); therefore, the general efficiency is 0.72 (= 0.825 ×0.875).
The maximum power output with a discharge utilizationfactor of 60% at each headwork is determined in the fol‐lowing two steps. Firstly, the exceedance probability of theoverflow discharge, corresponding to a discharge utilizationfactor of 60%, is obtained as shown in Figure 2a. Secondly,the maximum power output corresponding to eachexceedance probability of the discharge utilization factor(60%) is obtained as shown in Figure 2b. Furthermore, theexceedance probabilities for the intake discharge with a dis‐charge utilization factor of 60% were also obtained in orderto compare them with the exceedance probability of theoverflow discharge.
SMALL HYDROPOWER GENERATION AT HEADWORKS IN JAPAN
—25—
The annual and monthly power generation at each head‐work were estimated under the upper limitation of the max‐imum power output. The effective heads adopted in thisanalysis are assumed to be the difference between the upperand lower water levels and the weir heights at the head‐works, as previously mentioned, which could be consideredthe minimum values for SHP generation. This is because,when an SHP generation facility is actually installed at aheadwork, if the overflow discharge is taken at the head‐work and led downstream by a canal, the differencebetween the water surface heights of the canal and the rivernear the canal must be increased to a level higher than theeffective head of the headwork.
RESULTS AND DISCUSSION
Maximum power output with discharge utilization fac‐tor of 60%
Figure 2a shows the relationship between the exceedanceprobability and the discharge utilization factor, and Figure2b shows the relationship between the exceedance proba‐bility and the maximum power output. The exceedanceprobability of the overflow discharge corresponding to adischarge utilization factor of 60% varied from 18.2%(OK) to 32.0% (MJ). The maximum power output corre‐sponding to each exceedance probability of the dischargeutilization factor (60%) ranged widely from 43 kW (FK) to2,002 kW (IY). The results are summarized in Table II.However, even if the maximum output shown in Table IIwas adopted, the discharge utilization factor would be lessthan 60% when unexpected droughts with more than a 21-year return period occur.
The exceedance probabilities of the intake discharge witha discharge utilization factor of 60% were 57.2% (IY),31.3% (MJ), 36.7% (MM), 25.6% (HK) and 30.0% (OK),respectively. The intake discharge sat KS, FK and ONheadworks were quite small compared to those of the over‐flow discharge, so the exceedance probabilities of theintake discharge at these three headworks were not ana‐lyzed in this study. The exceedance probability of theintake discharge was almost equal to or greater than that ofthe overflow discharge, which shows that the overflow dis‐charge was more stable than the intake discharge, becausethe lower the exceedance probability, the greater the dis‐charge available for maximum power output. Based on theabove, it is supposed that the power generation using theoverflow discharge was more stable than that using theintake discharge; and thus, overflow discharge is more suit‐able for actual power generation at these headworks.
Annual and monthly power generation under the dis‐charge utilization factor of 60%
Table III shows the annual and monthly power genera‐tion at each headwork using the maximum power output.The maximum power output ranged widely from the small‐est value of 43 kW (FK) to the largest value of 2,002 kW(IY), which shows great potential for power generation atthese eight headworks. This is because the maximumpower output, due to the use of water for agriculture, wasless than 1,000 kW at around 90% of the SHP facilities thatwere installed from 1915 to 2015 (Miyai et al., 2018).Moreover, this maximum power output is directly related tothe amount of power generation. When the maximumpower output is larger, a greater amount of power genera‐tion can be obtained. It is shown in Table III that both theannual power generation and the monthly power generationwere the largest at IY followed by MJ, MM, HK, KS, OK,ON and FK.
The ratio of the standard deviation to the average of theannual power generation and the monthly power generationin Table III expresses the fluctuation rate of the power gen‐eration. For the annual power generation, the fluctuationrates fell in the range 0.14 to 0.39, with the average fluctua‐tion rate being 0.21. For the monthly power generation, thefluctuation rates fell in the range 0.25 to 0.39, with theaverage fluctuation rate being 0.32. The fluctuation in themonthly power generation is thus greater than that in theannual power generation.
The maximum monthly power generation of MJ, MMand HK occurred in October, that of IY in March and thatof OK in April (Table III). The irrigation period is gener‐ally from April/May to September/October, when theintake water from the headwork increases greatly due toirrigation. As a result, the amounts of overflow discharge atthe headworks reached their peak in the months just beforeand just after the irrigation period. The power generationamount also reaches its peak accordingly. The maximummonthly power generation at KS, FK and ON occurred inJuly (Table III), when the precipitation reached its peaklevel, and there was very little water intake from theseheadworks to the beneficiary area in the downstream rela‐tive to the overflow discharge.
The minimum monthly power generation occurs sepa‐rately in June (IY, MJ, HK and OK) and in January (MM,KS, FK and ON) (Table III). During the irrigation period,especially in June, a large amount of agricultural water istaken from the headworks, and the overflow discharge andpower generation are minimal compared to the othermonths. As for the other three headworks (KS, FK and ON)in Toyokawa-yousui, there is no direct water intake for thebeneficiary area downstream. Just a small amount of wateris led into the upstream of Ure Dam and OH headwork
Table II. Maximum power output (kW) for a discharge utilization factor of 60%
Headwork IY MJ MM KS FK ON HK OK
Exceedance probability (%) 23.7 32.0 26.0 27.7 24.6 26.6 27.6 18.2Overflow discharge (m3/s) 45.7 23.5 18.9 5.7 2.4 3.2 11.1 5.8Maximum power output (kW) 2002 947 468 168 43 91 167 143
F. WANG ET AL.
—26—
downstream. In addition, precipitation is the lowest in thewinter season, especially in January; consequently, theoverflow discharge and the power generation potential arethe smallest during this month.
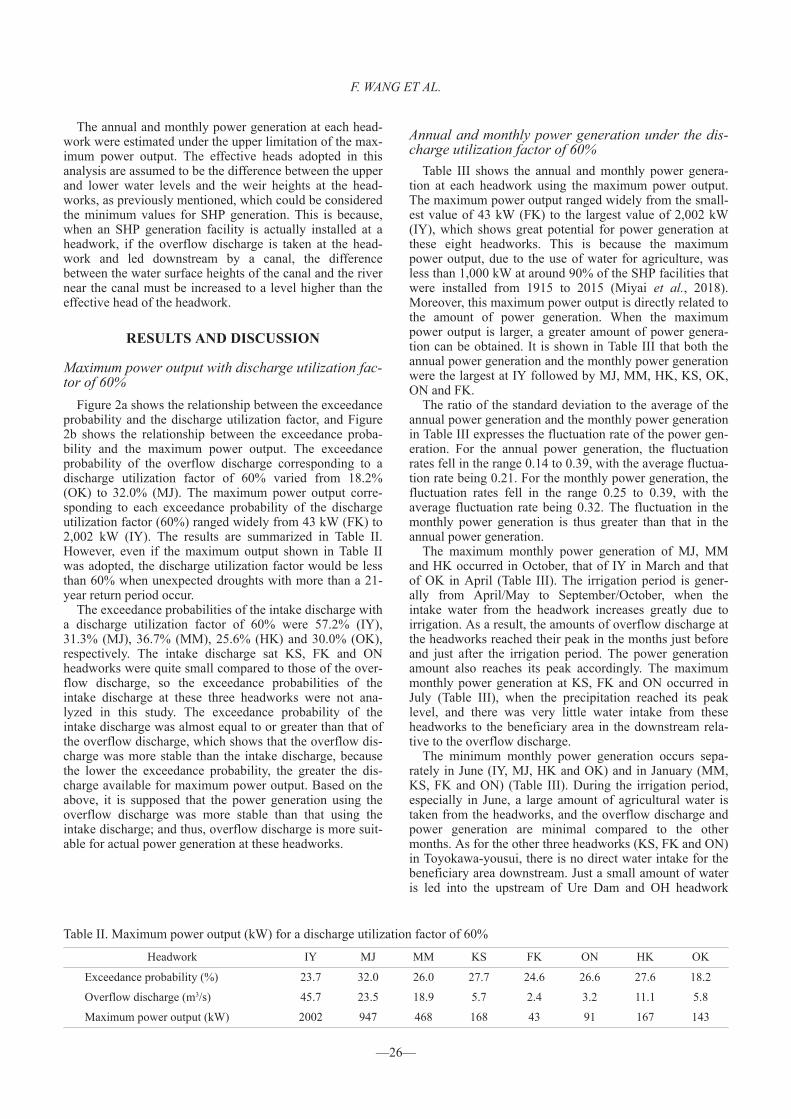
In order to clearly compare the fluctuation in monthlypower generation among the headworks, the ratio of theaverage power generation of each month (Gm) to the aver‐age annual power generation (Gy) is expressed in Figure 3,which shows that there are two types of monthly changes inpower generation. In the first, power generation in the irri‐gation period is lower than that in the non-irrigation period,such as for IY, MJ, MM, HK and OK headworks. In thesecond, power generation in the summer season is higherthan that in the winter season, as for KS, ON and FK head‐works. These two types of monthly changes are mainlyinfluenced by two factors, namely, the amount of waterintake in the irrigation period and seasonal rainfall fluctua‐tions.
CONCLUSIONS
There is potential for SHP generation at headworks inJapan because of the advantage of overflow discharge andexisting headwork infrastructure. In this research, eightheadworks located in Aichi and Gifu Prefectures wereselected (Inuyama, Meiji-yousui, Muromatsubara,Kansakawa, Furikusa, Onyu, Hosokawa and Okajima) foran evaluation of their power generation potential. The dif‐ference between the upstream and downstream water levelsand the weir heights at the headworks was assumed to rep‐resent the effective head. The maximum power output forthe SHP was determined under a discharge utilization fac‐tor of 60%, and annual and monthly power generation werecalculated. This revealed, firstly, that the exceedance proba‐
bilities of the overflow discharge ranged from 18.2% to32.0% and intake discharge from 25.6% to 57.2%. Thismeans that overflow discharge is more stable than theintake discharge usually applied to SHP generation. This isbecause a large amount of water is taken during the irriga‐tion period for paddy fields, but the intake discharge showsan extreme decrease and sometimes there is no intake dur‐ing the non-irrigation period. Meanwhile, the overflow dis‐charge at the headworks decreased mainly due to theamount of intake for irrigation, but it increased due to therunoff discharge from the upstream areas due to precipita‐tion. Furthermore, the overflow discharge sometimes func‐tions as a river maintenance discharge during the year andthe water is used for agricultural, domestic and industrial
(Gm: average monthly power generation; Gy: average annual power generation)
Figure 3. Monthly power generation at each headwork
Table III. Maximum power output, annual and monthly power generation at each headwork
Headwork IY MJ MM KS FK ON HK OK
Max power output kW 2002 947 468 168 43 91 167 143
Annual power generation
Max. MWh/Y(Year)
13,250(2010)
6,609(2011)
3,058(2003)
1,038(2010)
265(2003)
615(2015)
1,159(2015)
774(2017)
Min. MWh/Y(Year)
5,007(2012)
3,196(2002)
1,746(2005)
535(2005)
175(2005)
286(2008)
690(2012)
261(2014)
Ave. 1 MWh/Y 10,524 4,971 2,406 851 224 472 876 563SD 2 MWh/Y 2,343 927 355 139 32 105 183 221Ratio: 2/1 0.22 0.19 0.15 0.16 0.14 0.22 0.21 0.39
Monthly power generation
Max. MWh/M(Month)
1,315(Mar.)
577(Oct.)
264(Oct.)
91(Jul.)
25(Jul.)
55(Jul.)
107(Oct.)
85(Apr.)
Min. MWh/M(Month)
396(Jun.)
303(Jun.)
141(Jan.)
32(Jan.)
12(Jan.)
23(Jan.)
36(Jun.)
39(Jun.)
Ave. 1 MWh/M 942 414 200 71 19 41 73 59SD 2 MWh/M 232 161 57 23 6 14 23 19Ratio: 2/1 0.25 0.39 0.28 0.33 0.32 0.33 0.31 0.32
SD: Standard Deviation
SMALL HYDROPOWER GENERATION AT HEADWORKS IN JAPAN
—27—
purposes at the downstream area. Secondly, the maximumpower output ranged from 43 kW to 2,002 kW, whichdemonstrates great potential for power generation at theseeight headworks. However, fluctuations in both the annualand monthly power generation were evident, with theannual fluctuation smaller than the monthly. The monthlyfluctuations in power generation were mainly influenced bytwo factors: the amount of water intake during the irriga‐tion period and seasonal rainfall fluctuations. These factorscause two patterns in monthly power generation: (1) powergeneration that is smaller during the irrigation period whena large amount of agricultural water is taken and (2) powergeneration that is larger in the summer season becausethere is indirect water intake in the beneficiary areas andthe precipitation rate is higher in summer.
ACKNOWLEDGMENTS
This research was supported by the United LandImprovement District of Seinou-yousui, the Land Improve‐ment District of Meiji-yousui, Aichi Prefecture, and theJapan Water Agency Toyogawa Canal Management & Con‐struction Department.
REFERENCES
Bockman T, Fleten SE, Juliussen E, Langhammer HJ, Revdal I.2008. Investment timing and optimal capacity choice forsmall hydropower projects. European Journal of Opera‐tional Research 190: 255–267. DOI: 10.1016/j.ejor.2007.05.044.
Goto M, Ueda T, Namihira A, Hirose Y. 2012. A study on plan‐ning small-scale hydropower generation projects with irriga‐tion facilities. Technical Report of the National Institute forRural Engineering 212: 127–135 (in Japanese).
Huenteler J, Schmidt TS, Kanie N. 2012. Japan’s post-Fukushimachallenge-implications from the German experience onrenewable energy policy. Energy Policy 45: 6–11. DOI:10.1016/j.enpol.2012.02.041.
Japanese Water Agency. 2019. The introduction of smallhydropower. http://j-water.org/about/index.html. Last accessOctober 8, 2019.
Ministry of Agriculture, Forestry and Fisheries. 2008. Current sta‐tus of management of agricultural water supply facilities andimplementation status of the project. Ministry of Agricul‐ture, Forestry and Fisheries, Tokyo, Japan (in Japanese).
Ministry of Agriculture, Forestry and Fisheries. 2014. About pro‐motion of small hydroelectric power using agricultural watersupply facilities. Ministry of Agriculture, Forestry and Fish‐eries, Tokyo, Japan (in Japanese).
Ministry of Economy, Trade and Industry, Agency for NaturalResources and Energy. 2005. Hydro valley plan guidebook.Ministry of Economy, Trade and Industry, Agency for Natu‐ral Resources and Energy, Tokyo, Japan (in Japanese).
Ministry of the Environment. 2003. Information site of smallhydropower. https://www.env.go.jp/earth/ondanka/shg/page01.html. Last access October 8, 2019.
Miyai K, Noda K, Itou K, Senge M. 2018. Trends of smallhydropower generation using irrigation water in Japan.Water, Land and Environmental Engineering 86: 227–230(in Japanese).
New Energy Foundation. 2013. Guidebook of mid and smallhydropower generation. New Energy Foundation, Tokyo,Japan; 332.
Okuda S. 2010. Order of agricultural irrigation and water rights.Aoyama Law Journal 1: 107–131 (in Japanese).
Paish O. 2002. Small hydropower: technology and current status.Renewable and Sustainable Energy Reviews 6: 537–556.DOI: 10.1016/S1364-0321(02)00006-0.
Ueda T, Goto M, Namihira A, Hirose Y. 2013. Perspective ofsmall-scale hydropower generation using irrigation water inJapan. Japan Agricultural Research Quarterly: JARQ 47:135–140. DOI: 10.6090/jarq.47.135.
Wang FL, Noda K, Itou K, Onishi T, Senge M. 2018. Potentialanalysis of small hydraulic generation using irrigation facili‐ties – Case study of Meiji-yousui Land ImprovementDistrict –. Irrigation Engineering and Rural Planning Jour‐nal 306 (86-1): II_33–II_40 (in Japanese with English sum‐mary). DOI: 10.11408/jsidre.86.II_33.
F. WANG ET AL.
—28—