Embed Size (px)
Citation preview

Page 1
AL–FARABI http://dergipark.gov.tr/farabi
International Journal on Social Sciences ISSN 2564-7946
Arrival Date: 06.05.2020 Published Date: 19.10.2020
DOI: 10.46291/Al-Farabi.050401
Volume (5)
Issue (4)
Year (December 2020)
RESIDENCY COST ANALYSIS IN BIG CITIES COMPARE TO RURAL
AREAS ŞEHİR VE KIRSAL ALAN KONUT MALİYETİNİN KARŞILAŞTIRMALI ANALİZİ:
AFGANİSTAN ÖRNEĞİ
M. Akbar FARHANG1
ÖZET
Bu çalışmada, şehir ve kırsal alandaki (Kabil ve kırsal)
konut maliyetlerinin belirlenerek karşılaştırılması
amaçlanmaktadır. Veriler, ilgili kuruluşların birincil ve
ikincil kaynakları yoluyla toplanmıştır. Ayrıca, devlet
kurumundaki gerçek veri yokluğundan ötürü, yaşam
maliyetleri Afganistan'a benzer olan Hindistan ve
Nepal'deki ampirik araştırmalar kullanmıştır. Veriler
analiz edilerek grafik ve çizelgeler hâlinde
sunulmuştur. Bulgular, Kabil'deki 8,633 göçmenin
maliyetinin (eğitim, sağlık, ulaşım, su, elektrik, konut
kira, hane halkı gideri, çevre, belediye ve güvenlik)
toplam 72.296.065,40 milyon $ olduğunu
göstermektedir. Kırsal alanlardaki ikamet maliyetinin
yıllık 33.216.460.42 milyon $, kentsel-kırsal maliyet
farkının ise 39.079.604.98 $ olduğu belirlenmiştir.
Dolayısıyla, kırsal kesimde ikamet maliyetinin büyük
şehirlere (Kabil) kıyasla oldukça düşük olduğu açıkça
görülmektedir. Bu noktada hükümet yurt içindeki göçü
önleyerek yıllık 39.079.604.98 $ tasarruf edebilir.
Böylece Karez canlanması, çiftliklerin açılması,
tarımsal kalkınma ve çiftçilerin gelir elde ederek mali
açıdan bağımsız hale gelmesi sağlanabilir.
Anahtar Kelimeler: Konut maliyeti, Kentsel, kırsal ve
Hanehalkı maliyetler
ABSTRACT
This study aims to identify residential cost in big cities
compare to rural areas (Kabul vs Rural). The data was
collected through primary and secondary sources from
relevant entities and also utilized the empirical studies
and surveys conducted in India and Nepal due to
authentic data unavailability in governmental
organization and also because of their living cost are
similar to Afghanistan. Graph and charts are applied to
analyze the data. The finding shows that the total
residency cost which includes (education, health,
transportation, water, electricity, house rent, households
costs, environment, municipality and security) costs of
8,633 internally displaced households which are staying
in Kabul is $ 72,296,065.40 million per annum whereas
the cost of residency in rural areas are $33,216,460.42
million per annum and the difference of urban-rural cost
is $39,079,604.98. So, it can be clearly seen that, the cost
of residency in rural areas is quite low compared to big
cities (Kabul). Also by preventing internal displacement
the government can save $39,079,604.98 annually and
its indirect impact is that, preventing internal
displacement leads Karez revival, farms expansions,
agriculture development and farmers can generate
income and financially become independent.
Keywords: Residency cost, Urban, Rural and
Households
INTRODUCTION
Urbanization: On early 1900s, there were 6.7 rural dwellers per each urban dwellers globally;
nowadays its less than one and scholars projected that, there would be almost three urban dwellers to
two rural by 2025. This has taken place due to rapid industrialization (since most of factories and
service industries are in urban areas), due to transition of workforce from agriculture to manufacturing
and services, now hundred millions of urban dwellers suffering from under- nutrition which most of
them are due to lack of income rather than lack of capacity to produce food, because of food price
1 Dr., Economic Expert in the Office of Senior Advisor to the President on Agriculture and Development
Presidential Compound, Kabul-Afghanistan and faculty member of economic department at Dunyda University, Kabul-
Afghanistan. orcid.org/0000-0002-7416-3801 [email protected]

Al-Farabi International Journal on Social Sciences
Page 2
hiking globally a very large portion of low income urban population their health and nutrition are at
risk and hungers are raising steadily (David, Gordon & Cecilia, 2010). According to (CSO, 2020)
report, Afghanistan’s total population is estimated 32.9 million, which 23 million (%71) live in rural
areas and 8million (%24) in cities. Among the cities Kabul and Herat with the population of more
than 5 million and more than 2 million respectively are the most populated cities in the country. The
country’s population with the growth rate of 2.4 is expected to double within the next 15 years and
the urban population will make up 50% of the total population. Afghanistan’s urbanization rate is
among the highest in the region, its urban population is growing at 5 percent annually, more than
twice of the regional average (World Bank: Leveraging the urbanization dividend in Afghanistan,
2017). Cities are struggling to accommodate increasing numbers of persons seeking shelter and jobs.
These newcomers leaving rural agricultural employment and seeking service-based jobs in urban
areas. Over the same period, the country will also see a substantial increase in demand for
employment as slightly more than half of the current population is aged 15 or younger and will soon
be entering the workforce for years to come. This transformation for a country like Afghanistan which
is highly dependent on Agriculture and industries is not functioning well, and it will further weaken
the development of the agriculture sector. The big cities will become more polluted, the
unemployment and poverty rates will increase which will consequently leads to economic slowdown
as a whole.
OBJECTIVE
The main objective of this study is to identify the residential cost in big cities compare to rural areas
(Kabul vs Rural). And the specific objectives are;
To help and encourage policy makers to prevent rural to urban migration in order to decrease the
public costs.
Preventing internal displacement which leads to Karez revival, farms expansions, agriculture
development and farmers can generate income and financially become independent, and also by
preventing the internal displacement the city pollution, spiraling rent, criminal cases will be
reduced in the cities and finally declining ratio of food producers to food consumers and
unemployment rate will be decreased as well.
RESEARCH METHOD
The per capita cost on every sector related data is gathered through primary and secondary sources.
Some sectors’ related data which were not available in Afghanistan, are taken from the same empirical
studies which are conducted in India and Nepal, because the residency cost of those countries are
smeller to Afghanistan. The data are analyzed through excel using tables and charts.
SECTOR WISE COST ANALYSIS:
Environment: Unlike other polluted cities in the world, the air pollution in Kabul is a seasonal
pollution. During the winter, as the weather gets cold, the air pollution increases in the city due to the
use of low-quality fuel by the residents. More than 8,800 patients have visited government hospitals
in a week, suffering from health conditions, including lung problems, as air quality worsened in the
capital during the winter, where in summer this number is slightly lower (Aljazeera report, 2019:
People are killed due to hazardous levels of air pollution in Kabul).The city of Kabul was built with
the infrastructure for one million residents and a maximum circulation of 75,000 cars. But currently
there are around five million residents living in Kabul and 400,000 cars excluding buses are
circulating around city (Ministry of public health of Afghanistan, 2018).
According to The Health Effects Institute’s State of Global, air pollution caused 511,000 deaths in

Al-Farabi International Journal on Social Sciences
Page 3
Afghanistan during 2016. According to (Arab News report, 2019) annual rate of 406 deaths per
100,000, in Kabul due to air pollution is among the worst in the world. The source added that, because
of power shortages and hiking the gas prices. In 2013-2014, 95.1% of the national population used
solid fuels for heating and 75.9% for cooking. The use of solid fuels points to an urban and rural gap
with 90.7% of the rural population using these fuels for cooking and 97.7% for heating while 27.2%
in urban areas use solid fuels for cooking and 90.0% for heating (CSO, 2016). That can cause serious
respiratory issues, and has been linked to cancer, 16% of deaths are related to air pollution (Ministry
of public health of Afghanistan, 2018).
Based on the above information, the air quality and in Kabul is in alarming situation, so its proposed
that the government and policy makers need to prevent the internal migration to the Kabul and the
internally displaced households need to be resettled back to their natives in order to decrease the air
pollution, unemployment in Kabul, on the other hand their re-integration to the farms leads to
agriculture development and income generation and the farmers become financially independent.
Education: Education per capita cost in Urban vs. Rural ears.
Table1. Public per capita expenditure on education (us. $)
Urban Rural
61.05 16.47
Source: Central Bureau of Statistics of Nepal & UNDP 2015-16 Report.
Education cost in urban vs. rural, amount (us.$)
Total displaced families in Kabul (8633) (25899 school kids) Urban Rural
Education cost in Urban/Rural (25899*61.05), (25899*16.47) 1,581,133.95 426,556.5
The cost differences in urban compare to Rural 1,154,577.45
Source: Ministry of Refugees and Repatriation of Afghanistan, Department of Internal
Displacement, (2019)
14.84 vrey low
25.89 low
18.27 very low
17.86 very low
10.48 very low
0 5 10 15 20 25 30
Air quality
Drinking Water Quality and Acessibility
Garbage Disposal Satisfaction
Clean and Tidy
Water Quality
Comfortable to Spend Time in The City
Quality of Green and Parks
Figure1. Purity and cleanliness in Kabul

Al-Farabi International Journal on Social Sciences
Page 4
The above calculation is based on 8,633 internally displaced families which are staying in Kabul, the
average family size is assumed 7 persons and 3 Childs per family which total (25,899) children that
are going to school. Based on the above information, a comparative urban- rural cost differences
analysis is made.
The average government expenditure per pupil per annum in urban areas are ($ 61.05) compared to
rural areas which are only ($16.47). According to above graphical analysis for the total number of
25,899 internally displaced pupils, the government is pending ($ 1,581,133.95) per annum for their
education services in Kabul compared to rural education cost for the mentioned number of pupils ($
426,556.50). So if these displaced pupils return to their rural areas and get education there, the
government can save ($1,154,577) per annum.
Health: Government per capita expenditure on health-care in Urban vs. Rural ears.
Table2. Government per capita expenditure on health-care
(US $)
Urban Rural
31,815 24,72
Source: Central Bureau of Statistics of Nepal & UNDP 2015-16 Report.
Medical cost in urban vs. rural, amount (us.$)
Total displaced families in Kabul (8633), persons (60431) Urban Rural
Medical cost in urban/rural (60431*31.815), (60431*24.72) 1,922,612.26 1,493,854.3
cost differences in urban compare to rural 428,757.96
Source: Ministry of Refugees and Repatriation of Afghanistan, Department of internal displacement
(2019)
According to data sources the average family size is 7 persons and from 8,633 internally displaced
families the total number of displaced people is 60,431. Per capita medical cost in urban is ( US$
1.581.133,95
426.556,50
1.154.577,45
0,00
200.000,00
400.000,00
600.000,00
800.000,00
1.000.000,00
1.200.000,00
1.400.000,00
1.600.000,00
1.800.000,00
urban rural urban/rural cost
differences
Figure2. Public expenditure on education urban vs. rural (us $)
urban
rural
urban/rural cost
differences

Al-Farabi International Journal on Social Sciences
Page 5
1,922,612) in rural is (1,493,854) which result in a total urban-rural cost difference of (US$
428,757.96).
Based on the utilized sources the average per capita medical cost in urban areas are ($31,815) and per
capita cost in rural areas are ($2,472). As its shown on above chart, the government is spending
annually ($1,922,612.26) in order to provide health care services for 60,431 internally displaced
persons in Kabul, as compared to government spending ($428,757.96) for the same people in the rural
areas. The above analysis indicates that, if the government provides the health-care services to this
people in their rural areas, the government could save ($428,757.96) annually from health-care costs.
And a part from that, the likelihood of being affected by different disease compared to living in big
cities will be decreased, because of good weather in rural areas.
Water: Government per capita expenditure on drinkable water in urban vs. rural area
Table 3. Per capita consumption (litter)
Rural Urban
30-45 litter (24 hours) 90-100 litter (24 hours)
Annual per capita consumption ($)
30 50
Source: Rural Water Supply, Sanitation and Irrigation Program (MMRD)(2019)
Households drinkable water costs in urban vs. rural, amount (us.$)
Total displaced families in Kabul (8633), persons (60431) Urban Rural
Medical cost in urban/rural (60431*50), (60431*30) 3,021,550 1,812,930
Rural/urban cost differences 1,208,620
Based on 60,431 internally displaced persons which are staying in Kbul, a comparative urban-rural
cost differences on drinkable water consumption is made.
1.922.612,26
1.493.854,30
428.757,96
0,00
500.000,00
1.000.000,00
1.500.000,00
2.000.000,00
2.500.000,00
urban rural urban/rural cost
differences
Figure3. Households medical cost in urban vs. rural (us$)
urban
rural
urban/rural cost differences

Al-Farabi International Journal on Social Sciences
Page 6
According to the Rural Water Supply, Sanitation and Irrigation (MRRD), average per capita cost of
drinkable water in urban areas are ($50) per annum and per capita cost in rural areas are ($30), which
is much lower than urban areas. The above chart indicates that, in order to provide the drinkable water
for 60,431 internally displaced persons which are staying in Kbul, the government spending will be
($3,021,550.00) per annum, and for the same population size government will spend ($1,812,930.00)
per annum in the rural areas to provide drinkable water. So, if the government provides drinkable
water for the same size of population in their natives could save ($1,208,620.00) per annum.
Electricity: Government per capita spends on household electricity in urban vs. rural areas
Table 4. Annual household electricity consumption (kwh)
urban rural
900 kwh 648 kwh
Annual per capita consumption ($)
139.7 61.14
Source: World Bank Study, Power for All, Electricity Access Challenges in India (2017)
Household electricity cost in urban vs. rural, amount (us.$)
Total displaced families in kabul (8633) Urban Rural
Household electricity cost in urban/rural (8633*139.7), (8633*61.14) 1,206,030 527,821.62
Rural/urban cost differences 678,208.38
Based on given data, the internally displaced households (8,633) which are staying in Kabul, a
comparative urban-rural average electricity cost of households is made by the following chart.
3.021.550,00
1.812.930,00
1.208.620,00
0,00
500.000,00
1.000.000,00
1.500.000,00
2.000.000,00
2.500.000,00
3.000.000,00
3.500.000,00
urban rural urban/rural cost
differences
Figure 4. Households' drinkable water costs in urban vs. rural (us$)
urban
rural
urban/rural cost differences
Al-Farabi International Journal on Social Sciences
Page 7
According to the given data, the average per household electricity costs in urban areas are ($139.7)
and per household cost in rural areas are much lower ($61.14). As the above chart indicates that, the
government in order to provide electricity for the 8,633 internally displaced household spends
($1,206,030.00) per annum and the government spending for the same households’ size in the rural
areas are much lower compare to urban areas ($527,821.62). So if the displaced households return to
their locals, the government can save ($678,208.38) annually on electricity costs.
Public Transportation: Government per households’ expenditure on public transportation
Source: (Kaur and Kumar,2018)
Households’ public transportation expenditure per annum in urban vs. rural (us. $)
Total displaced families in Kabul (8633) Urban Rural
Transportation cost in urban/rural (8633*118.78), (8633*57) 1,025,427.74 492,081
Urban/rural cost differences 1,024,998.70
Based on above table, a comparative urban-rural transportation cost analysis of 8633 internally
displaced households is made by the following chart.
1.206.030,00
527.821,62
678.208,38
0,00
200.000,00
400.000,00
600.000,00
800.000,00
1.000.000,00
1.200.000,00
1.400.000,00
urban rural urban/rural cost
differences
Figure 5. Household electricity cost in urban vs. rural (us$)
urban
rural
urban/rural cost differences
Table 5. Per households’ transportation expenditure (us. $)
Urban Rural
118.78 57

Al-Farabi International Journal on Social Sciences
Page 8
With the reference of above information, the average per household transportation cost in urban areas
($118.78) and in rural areas are quit lower with $ 57 per household. According to the above chart, the
government spends annually ($1,025,427.74) to provide public transportation services for the 8,633
internally displaced households in Kabul, whereas the government spends quit lower for the same
population in rural areas ($492,081.00). By resettlement of these displaced households, the
government can save ($1,024,998.70) per annum on transportation cost. Apart from cost saving, by
resettlement of the displaced households air pollution and traffic jam will be decreased in cities.
Housing: Rent cost of houses per households in urban vs. rural.
Source: National Statistic and Information Authority, Kabul consumer price index(2019).
Rent cost of houses per households in urban vs. rural per annum (us.$)
Total displaced families in Kabul (8633) Urban Rural
House rent in urban/rural (8633*1433.7), (8633*750) 12,377,132.00 6,474,750
Urban/rural cost differences 5,902,382.00
Based on 8,633 inetenally displaced households which are staying in Kbul, a comparative urban-rural
cost differences on house renting cost is made.
1.025.427,74
492.081,00
1.024.998,70
0,00
200.000,00
400.000,00
600.000,00
800.000,00
1.000.000,00
1.200.000,00
urban rural urban/rural cost
differences
Figure 6. Households' public transportation expenditure per annum (US. $)
urban
rural
urban/rural cost differences
Table 6. House rent (4 bedrooms, non-concrete per annum (us. $)
Urban Rural
1,433.7 750
Al-Farabi International Journal on Social Sciences
Page 9
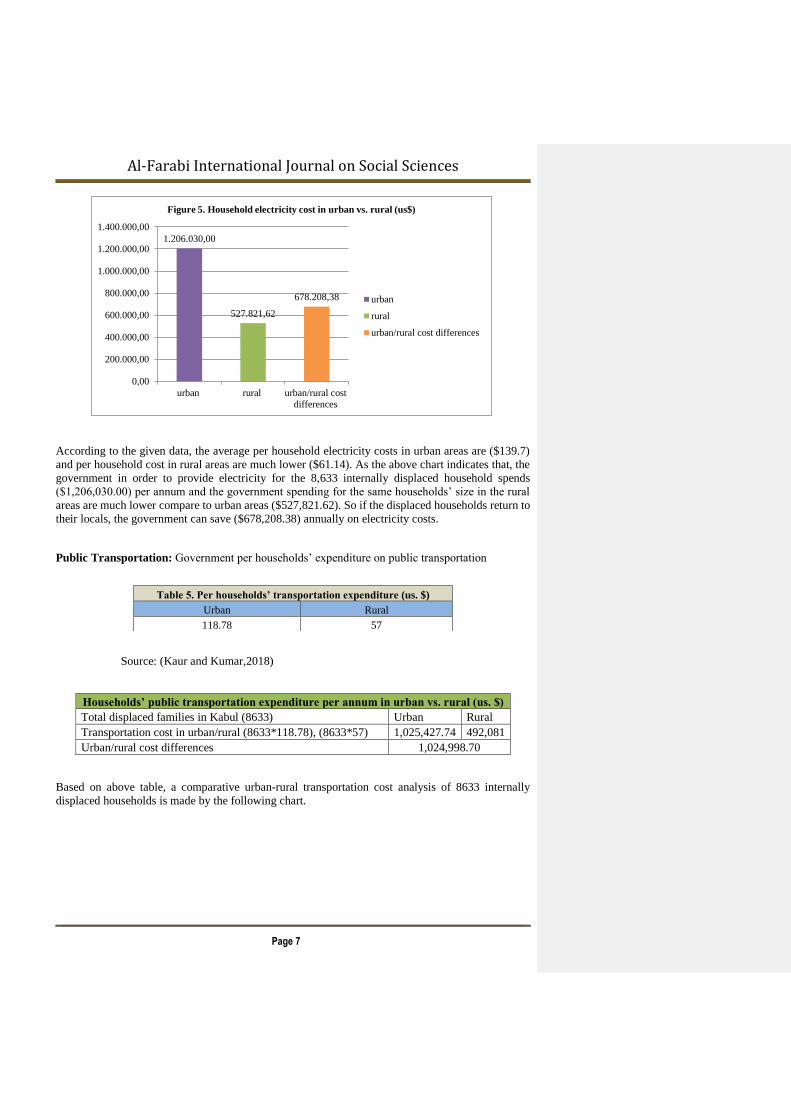
According to the sources, the average per households costs of house rent per annum in urban areas
are ($1,433.7) and per households costs in rural areas are just ($750) per annum. As the above chart
indicated, that the 8,633 internally displaced households spending’s on house rent in urban areas are
($12,377,132.00) annually which is quit lower as compared to rural areas ($6,474,750.00). And based
on the above graphical analysis, the urban- rural cost difference is ($5,902,382.00) annually and the
households could save that amount if they resettle to their locals.
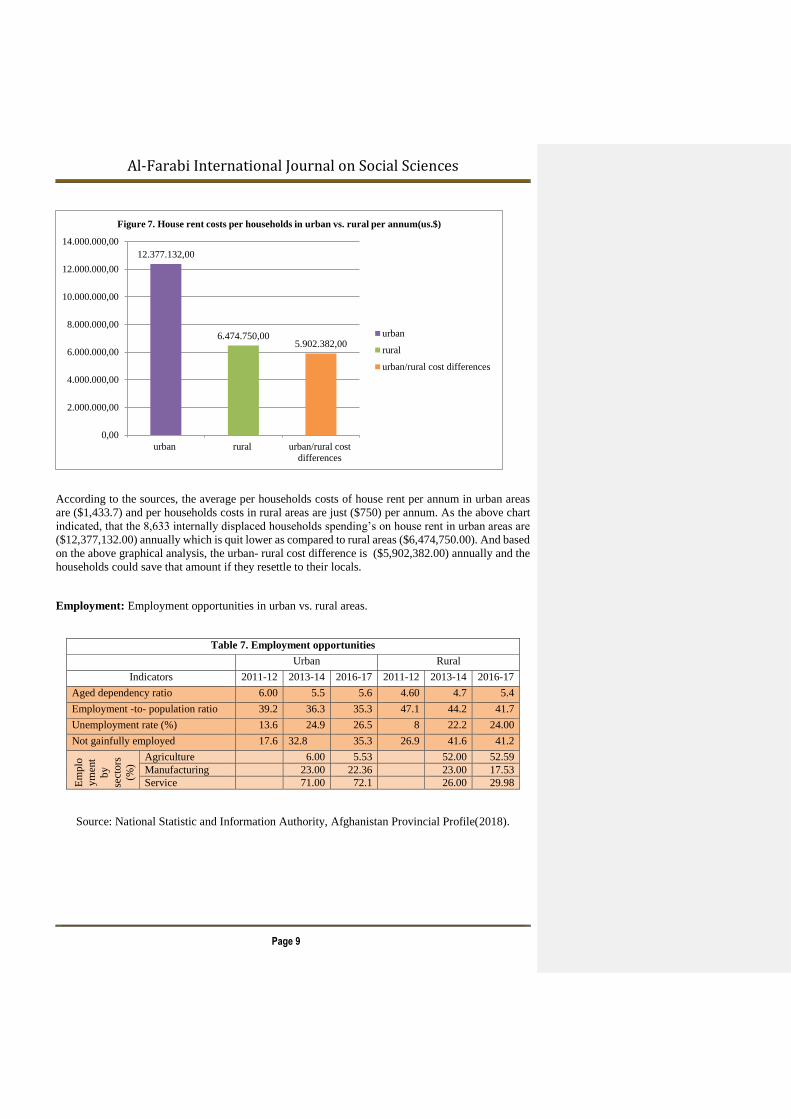
Employment: Employment opportunities in urban vs. rural areas.
Table 7. Employment opportunities
Urban Rural
Indicators 2011-12 2013-14 2016-17 2011-12 2013-14 2016-17
Aged dependency ratio 6.00 5.5 5.6 4.60 4.7 5.4
Employment -to- population ratio 39.2 36.3 35.3 47.1 44.2 41.7
Unemployment rate (%) 13.6 24.9 26.5 8 22.2 24.00
Not gainfully employed 17.6 32.8 35.3 26.9 41.6 41.2
Em
plo
ym
ent
by
sect
ors
(%)
Agriculture
6.00 5.53
52.00 52.59
Manufacturing
23.00 22.36
23.00 17.53
Service
71.00 72.1
26.00 29.98
Source: National Statistic and Information Authority, Afghanistan Provincial Profile(2018).
12.377.132,00
6.474.750,005.902.382,00
0,00
2.000.000,00
4.000.000,00
6.000.000,00
8.000.000,00
10.000.000,00
12.000.000,00
14.000.000,00
urban rural urban/rural cost
differences
Figure 7. House rent costs per households in urban vs. rural per annum(us.$)
urban
rural
urban/rural cost differences

Al-Farabi International Journal on Social Sciences
Page 10
Based on above chart the percentage of employment in manufacturing sector in the urban –rural is
almost the same. The service sector has the highest contribution in urban areas (70%) whereas the
agricultural sector the highest percentage in the rural areas. But overall, the employment percentages
by sectors in rural areas are higher as compared to urban areas. So the government needs to resettle
the internal displaced people to their local residence in order to reintegrate them to the farms to
improve agriculture sector, which in turn leads to decrease in unemployment and poverty rates.
Unemployment Types
Rural unemployment: Afghanistan is an agricultural country where 71% of the total population
living in rural areas. Agriculture is the main source of income in rural areas. But enough employment
opportunities are not available in rural areas due to lack of investment in agriculture, hence the
6
23
71
52
2326
5,53
22,36
72,1
52,59
17,53
29,98
0
10
20
30
40
50
60
70
80
Agriculture Manufacturing Service Agriculture Manufacturing Service
Employment by sectors (%) Employment by sectors (%)
Figure 9. Employment by sectores (%)
2013-14
2016-17
0,00
10,00
20,00
30,00
40,00
50,00
60,00 Figure 8. Urban/rural emloyment ındicators
2011-12
2013-14
2016-17
Urban Rural
Urban Rural

Al-Farabi International Journal on Social Sciences
Page 11
government needs to encourage the private sectors as well public entities to invest in agricultural
projects. Normally there are three types of unemployment in rural areas, which are open, seasonal
and disguised.
Open unemployment: The situation where residents of rural area are willing to and potentially able
to work but the employment opportunities are not available.
Seasonal Unemployment: On this situation workforce become unemployed for a particular season.
For instance, workers may be employed only during cultivation or harvest season and remained
unemployed for the remaining months of the year.
Disguised unemployment: This refers to a situation where more than required workforces are
engaged on the farm, which all them are not productive to generate income. So the marginal
productivity of many employed people is zero. This is the case when almost entire family engages
in farms.
Urban unemployment: The unemployment is a big challenge which exponentially increasing over
the year in urban areas. The unemployment in urban could also be in different forms which are as
follow:
Industrial unemployment: The low skill and illiterate workforce who are potentially able to work
in industries in urban but couldn’t find work comes under this category. Mostly this kind of
unemployment is due to rural-urban migration. In Afghanistan due to internal displacement and
fleeing local residents to cities specially Kabul apart from increasing the pollution and different type
of diseases, unemployment rate is very high as well.
Education unemployment: The most unwelcomed type of unemployment is when skilled and
educated young workforce are unable to find proper job to suit their qualifications. In Afghanistan,
due to increasing numbers of private universities, annually 1000s of youth workforce are joining to
the labor market but the number of available jobs has not increased. The main problem is that the
private sector has not boomed yet and the only source of employment is government, that’s why the
unemployment rate is very high.
Technological unemployment: This type of unemployment takes place due to up gradation of
technology due to which the existing labors are unable to meet the new technology requirements and
consequently unemployment increases.
Municipality:
Municipality per capita consumption in urban vs. rural
Source: National Institute of Public Finance, India Municipal Finance Report (IMFR)(2016).
Municipality services per capita consumption per annum (us.$)
Total displaced families in Kabul (8633)(60,431) Urban Rural
Municipality cost in urban/rural (60,431*22), (60,431*6.6) 1,329,482.00 398,844
Urban/rural cost differences 930,637.40
Table 8. Municipality service per capita consumption per annum (us. $)
Urban Rural
22 6.6
Açıklamalı [MSK1]: If possible, please states the rates of each type of unemployment
Açıklamalı [MSK2]: If possible, please state its rate.

Al-Farabi International Journal on Social Sciences
Page 12
Based on 60,431 internally displaced persons, a comparative per capita urban-rural cost differences
on municipality services is done by the following graphical analysis.
Based on the above mentioned data, the average municipality service per capita consumption in urban
and rural areas are $22 and $6 per annum respectively. Based on above graphical analysis, the
government spends annually (1,329,482.00) to provide municipality services for the 60,431 internally
displaced people in Kabul which is much bigger amount than that government spends to provide
municipality services for the same population size in rural areas ($398,844.00). According to above
justification, if the government resettle these internally displaced people to the their own local
residence, the government can save annually ($930,637.40) and apart from that their re- integration
to the farms leads to farm expansion and increase the agricultural production which is the main driver
of our national economy.
1.329.482,00
398.844,00
930.637,40
0,00
200.000,00
400.000,00
600.000,00
800.000,00
1.000.000,00
1.200.000,00
1.400.000,00
urban rural urban/rural cost
differences
Figure 10. Municipality consumption per annum (us.$)
urban
rural
urban/rural cost
differences

Al-Farabi International Journal on Social Sciences
Page 13
Households Costs: Per households cost analysis in urban
Source: National Statistic and Information Authority, Kabul Consumer Price Index (2019)
The above numerical data is gathered from primary and secondary sources in order to analysis the
households cost of 8,633 internally displaced families which are staying in Kabul. According to above
No Table 9. Households costs in big cities
Indicators Quantity Price
(Afs)
Cost per
person
Family/7persons
(cost)(AFs)
Internally
displaced families
(8633)(AFs)
(US $)
1 Wheat 165 kg 21.72 3,583 25,086 216,567,438.00 2,707,092.98
2 Rice /Person 17 kg 48.3 821 5,747 49,613,851.00 620,173.14
3 Black tea (ave
qty)
1.5 kg 252 378 2,464 21,271,712.00 265,896.40
4 Meat 6 kg 345 2,070 14,490 125,092,170.00 1,563,652.13
5 Chicken 13 kg 119 1,547 10,829 93,486,757.00 1,168,584.46
6 Water 90 litter/24 Hours 4000 4,000 28,000 241,724,000.00 3,021,550.00
7 Vegetable oil 17 kg 76 1,292 9,044 78,076,852.00 975,960.65
8 vegetable 20 kg 646 4,525 39,064,325.00 488,304.06
9 Fruit 41.7 Kg 40 1,668 11,676 100,798,908.00 1,259,986.35
10 Egg 8 kg 96 768 5,376 46,411,008.00 580,137.60
11 Potatoes 34 kg 20 680 4,760 41,093,080.00 513,663.50
12 fuel & Liquid gas 24kg 65 1,562.70 10,939 94,436,387.00 1,180,454.84
13 fire wood 560 kg 12.2 6,832 47,824 412,864,592.00 5,160,807.40
14 Rent. 4
bedroom(non
concrete )
4 bedroom 9,958
month
17,071 119,496 1,031,608,968.00 12,895,112.10
15 Health cost 720 720 5,040 43,510,320.00 543,879.00
Total 43,639 305,296 2,635,620,368 32,945,254.60
Donation by DRC with the Coordination of Ministry of Refugees and Repatriation per
family/Annum 375$
258,990,000.00 3,237,375
Donation by WFP with the Coordination of Ministry of Refugees and Repatriation per
family/Annum 103$
71,135,920.00 889,199
Total Cost of (8633 ) internally displaced households which are staying in Kabul 2,965,746,288.00 37,071,828.60
No Table 10. Households costs in rural areas
Indicators Quantity Price (Afs) Cost per
person
Family/7person
s cost Afs
internally displaced
families (8633)/Afs
(US $)
1 Wheat 165 kg 18 2,970 20,790 179,480,070 2,243,501
2 Rice /Person 17 kg 53 901 6,307 54,448,331 680,604
3 Black tea (ave
qty)
1.5 kg 270 405 2,835 24,474,555 305,932
4 Meat 6 kg 300 1,800 12,600 108,775,800 1,359,698
5 Chicken 13 kg 122 1,586 11,102 95,843,566 1,198,045
6 Water 45litter/24 Hours 2800 2,800 19,600 169,206,800 2,115,085
7 Vegetable oil 17 kg 80 1,360 9,520 82,186,160 1,027,327
8 vegetable 0 0 0 0 0 0
9 Fruit 41.7 Kg 20 834 5,838 50,399,454 629,993
10 Egg 8 kg 50 400 2,800 24,172,400 302,155
11 Potatoes 34 kg 15 510 3,570 30,819,810 385,248
12 fuel & Liquid gas 24 kg 70 1,680.00 11,760 101,524,080 1,269,051
13 fire wood 0 0 0 0 0 0
14 4bedroom(non
concrete )
4 bedroom 1500
month
2,571 18,000 155,394,000 1,942,425
15 Health cost 720 720 5,040 43,510,320 543,879
Total 18,537 129,762 1,120,235,346 14,002,942
Total Cost of (8633 ) displaced households in Kabul 2,965,746,288.00 37,071,828.60
Urban/Rural cost differences 1,845,510,942.00 23,068,886.78

Al-Farabi International Journal on Social Sciences
Page 14
two comparative tables, the household costs of these internally displaced families in Kabul is quit
higher than rural areas, because in rural households are normally consumed their own agro related
products and livestock’s or provide from the market in low prices. So that’s why, there is a big
difference of the urban - rural households cost ($23,068,886.78) annually.
Security Cost: The average security per capita cost is given bellow.
Its required to be considered that this security cost include only logistical cost of security which is
provided through budget of Ministry of Internal Affairs and it doesn’t include Off-Budget (weaponry,
vehicles, Training and education) which is provided by foreign countries.
Security per capita cost per annum (us.$)
Total displaced families in Kabul (60,431) Urban Rural
Security cost in Urban/Rural (60,431*28.35), (60,431*25) 1,713,218.85 1,510,77
5
Urban/Rural cost differences 202,443.85
Source: Ministry of Internal Affairs of Afghanistan, General Administrative Office(2019)
37.071.828,60
14.002.942
23.068.886,78
0,00
5.000.000,00
10.000.000,00
15.000.000,00
20.000.000,00
25.000.000,00
30.000.000,00
35.000.000,00
40.000.000,00
Households Costs
in Kabul
Households Costs
in Rural
Urban/Rural Cost
Differences
Figure 10. Households cost of 8633 Internally displaced famillies (us.$)
Households Costs in Kabul
Households Costs in Rural
Urban/Rural Cost Differences
Table 11. Security per capita cost (us$)
Urban Rural
28.35 25

Al-Farabi International Journal on Social Sciences
Page 15
Based on above provided information the security cost of 60,431 internally displaced people in Kabul
is $1,713,218.85 and the security cost of the same population size in rural areas is 1,510,775 and the
difference is $ 202,443.85which has a direct impact to the government budget and it’d indirect impact
is that resettlement of displaced households can reduce the pollution, disease and criminal cases in
the cities and on the other hand, their re-integration to the farms will lead to agriculture expansion
and income generation.
CONCLUSION
The objective of this study is to know the residential cost differences in big cities compare to rural
areas (Kabul vs rural). The required primary and secondary data was collected from the related
government’s agencies and due to lack of concise data availability, some related empirical researches
and surveys which were conducted in India and Nepal had also been utilized as secondary sources,
because their living costs are similar with Afghanistan.
Based on finding of this study the residency cost (education, health, transportation, water, electricity,
house rent, households costs, environment, municipality and security) of 8,633 internally displaced
households which are staying in Kabul is $ 72,296,065.40 million per annum whereas the cost of
residency in rural areas are $33,216,460.42 million per annum and the difference of urban-rural cost
is $39,079,604.98 million. It’s found that, the residency costs in rural areas are much lower than big
cities (Kabul). It’s concluded that by preventing internal displacement, the government cans save
$39,079,604.98 annually. Its recommended that, by investing this amount on rural community based
projects like; Karez revival, fish and chicken farms, green houses, introducing new farming methods,
building bridges, expanding village roads, improving water system, expanding rural transport
network and rural electrification will leads to renewed attention on agriculture sector, households
income increases, women are encouraged to initiate in small scale rural development projects, slow
the exodus to the cities and solving growing food supply problems, improving rural standard of living
and poverty reduction. For achieving these the farmers need to be placed at the center of national
strength and development and agriculture need to be considered as the center of modernization.
1.713.218,85
1.510.775 1.510.775,00
1.400.000,00
1.450.000,00
1.500.000,00
1.550.000,00
1.600.000,00
1.650.000,00
1.700.000,00
1.750.000,00
Urban Rural the Differences
Figure 11. Security cost per annum urban vs. rural
Al-Farabi International Journal on Social Sciences
Page 16
REFRENCES
Afghanistan National Statistic and Information Authority (2019), Kabul consumer price index report.
https://nsia.gov.af/services (14.11.2019)
Afghanistan National Statistic and Information Authority (2019), Afghanistan provincial profile
report. https://nsia.gov.af/services (17.11.2019)
Central Bureau of Statistics of Nepal & UNDP 2015-16 Report.
https://reliefweb.int/report/nepal/nepal-annual-household-survey-201516(22.11.2019)
David. S, Gordon .M, and Cecilia .T, (2010) Urbanization and its implications for food and farming,
The Royal Society, 365, (2809-2820).
Kaur, A. and Kumar, A., (2018) Structure and Pattern of Household Consumption in Punjab,
Scholars Journal of Economics, Business and Management (SJEBM), ISSN-2348-5302,(250-261).
Ministry of Internal Affairs of Afghanistan, General Administrative Office (2019), government
security per capita cost per annum.
Ministry of Public Health of Afghanistan, Department of Health Policy (2018), government per capita
expenditure on health-care.
Ministry of refugees and repatriation of Afghanistan. Department of internal displacement(2019),
government expenditure per capita on internal displacement.
National Institute of public finance of India, Municipal finance report (IMFR) (2016).
https://www.nipfp.org.in/media/medialibrary/2013/08/IMFR_final_report. pdf(24.11.2019)
Rural water supply, sanitation and irrigation program (MMRD),(2019). Households' drinkable water
costs in urban vs. rural areas.
TRT World (2019): Kabul air pollution on a par with world’s most polluted cities.
https://www.trtworld.com/magazine/kabul-air-pollution-on-a-par-with-world-s-most-polluted-
cities-23181(5.12.2019)
The Daily Outlook Afghanistan: The causes and effects of air pollution in
Kabul. http://outlookafghanistan.net/topics.php?post_id=4102#ixzz6Llx4Zm00 (17.12.2019)
World Bank (2017):Leveraging the urbanization dividend in Afghanistan.
https://blogs.worldbank.org/endpovertyinsouthasia/leveraging-urbanization-dividend-afghanistan
(10.12.2019)
World Bank (2017):World bank study, power for all, electricity access challenges in India.
http://documents.worldbank.org/curated/en/562191468041399641/pdf/Power-for-all-electricity-
access-challenge-in-India.pdf (13.12.2019)


![[Rescher Nicholas] Al-Farabi on Logical Tradition(BookFi.org)](https://img.pdfslide.us/doc/110x75/577cc0121a28aba7118ebeb0/rescher-nicholas-al-farabi-on-logical-traditionbookfiorg.jpg)


![Al-Farabi - Summary of Plato's Laws [Tr.mahdi]](https://img.pdfslide.us/doc/110x75/55cf9d2d550346d033ac8dc2/al-farabi-summary-of-platos-laws-trmahdi.jpg)


![[Leo Strauss] How Farabi Read Plato's Laws(BookZZ.org)](https://img.pdfslide.us/doc/110x75/5695d1661a28ab9b0296601e/leo-strauss-how-farabi-read-platos-lawsbookzzorg.jpg)


![Al farabi principles of the beings [hyman]](https://img.pdfslide.us/doc/110x75/579057071a28ab900c9ba9e5/al-farabi-principles-of-the-beings-hyman.jpg)