Embed Size (px)
Citation preview
Al Anwar Ceramic Tiles SAOG Research Initiation – 6th July 2010
This document is provided for assistance only and is not intended to be and must not alone be taken as the basis for an investment decision. Nothing in this document should be construed as investment or financial advice, and nothing in this document should be construed as an advice to buy or sell or solicitation to buy or sell the securities of companies referred to in this document. The intent of this document is not in recommendary nature. Each recipient of this document should make such investigations as it deems necessary to arrive at an independent evaluation of an investment in the securities of companies referred to in this document (including the merits and risks involved), and should consult its own advisors to determine the merits and risks of such an investment. National Bank of Oman has not independently verified all the information given in this document. Accordingly, no representation or warranty, express or implied, is made as to the accuracy, completeness or fairness of the information and opinions contained in this document. National Bank of Oman, their directors and the employees may from time to time, effect or have effected an own account transaction in, or deal as principal or agent in or for the securities mentioned in this document. They may perform or seek to perform investment banking or other services for, or solicit investment banking or other business from, any company referred toin this report. Each of these entities functions as a separate, distinct and independent of each other. The recipient should take this into account before interpreting the document. This report has been prepared on the basis of information, which is already available in publicly accessible media or developed through analysis of National Bank of Oman. This document is being supplied to you solely for your information and may not be reproduced, redistributed or passed on, directly or indirectly, to any other person or published, copied, in whole or in part, for any purpose. Neither National Bank of Oman, nor its directors or employees shall be liable for any damages whether direct or indirect, incidental, special or consequential including lost revenue or lost profits that may arise from or in connection with the use of the information.
MSM 30 AACT (CMP ) 12 Months Target
6,143.48 0.296 0.368
Key Figures 2008A 2009A 2010E 2011E
Net Sales 11,870 15,887 18,150 22,725
Operating Profit 3,930 5,624 6,201 8,380
EBITDA 4,704 6,409 6,949 9,292
Net Income 3,516 4,952 5,457 7,374
Key Ratios 2008A 2009A 2010E 2011E
NPM 30% 31% 30% 32%
ROE 26.0% 26.8% 22.9% 21.2%
ROA 19.9% 22.0% 16.8% 17.7%
Valuation 2008A 2009A 2010E 2011E
EPS 0.035 0.044 0.034 0.035
P/E(x) 8.5 6.7 8.8 8.5
P/BV(x) 2.2 1.8 2.0 1.8
Basic Stock Details
Market Price 0.296 52Wk high 0.482
Shares O/S ( In,000) 162,241.950 52Wk low 0.222
Market Cap 48023.620 YTD Change 26.35%
MSM Ticker AACT Bloomberg AACT OM
Reuters AACT. OM
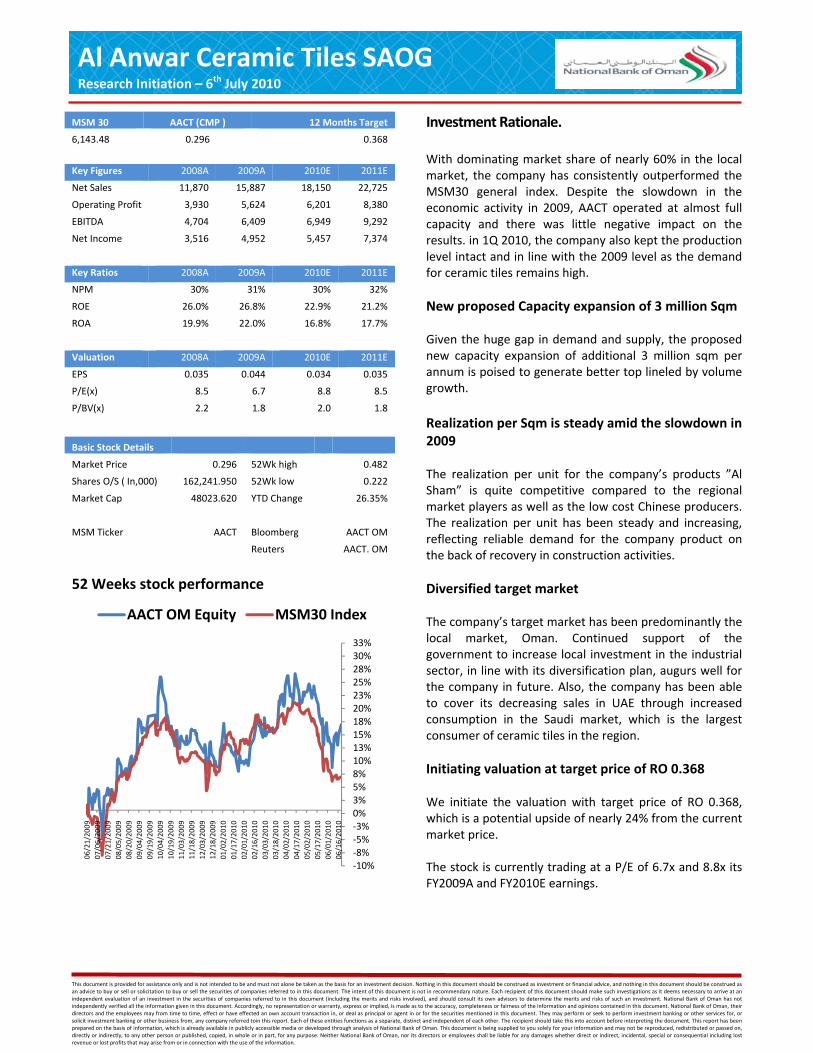
52 Weeks stock performance
Investment Rationale. With dominating market share of nearly 60% in the local market, the company has consistently outperformed the MSM30 general index. Despite the slowdown in the economic activity in 2009, AACT operated at almost full capacity and there was little negative impact on the results. in 1Q 2010, the company also kept the production level intact and in line with the 2009 level as the demand for ceramic tiles remains high. New proposed Capacity expansion of 3 million Sqm Given the huge gap in demand and supply, the proposed new capacity expansion of additional 3 million sqm per annum is poised to generate better top lineled by volume growth. Realization per Sqm is steady amid the slowdown in 2009 The realization per unit for the company’s products ”Al Sham” is quite competitive compared to the regional market players as well as the low cost Chinese producers. The realization per unit has been steady and increasing, reflecting reliable demand for the company product on the back of recovery in construction activities. Diversified target market The company’s target market has been predominantly the local market, Oman. Continued support of the government to increase local investment in the industrial sector, in line with its diversification plan, augurs well for the company in future. Also, the company has been able to cover its decreasing sales in UAE through increased consumption in the Saudi market, which is the largest consumer of ceramic tiles in the region. Initiating valuation at target price of RO 0.368 We initiate the valuation with target price of RO 0.368, which is a potential upside of nearly 24% from the current market price. The stock is currently trading at a P/E of 6.7x and 8.8x its FY2009A and FY2010E earnings.
‐10%‐8%‐5%‐3%0%3%5%8%10%13%15%18%20%23%25%28%30%33%
06/21/20
0907
/06/20
0907
/21/20
0908
/05/20
0908
/20/20
0909
/04/20
0909
/19/20
0910
/04/20
0910
/19/20
0911
/03/20
0911
/18/20
0912
/03/20
0912
/18/20
0901
/02/20
1001
/17/20
1002
/01/20
1002
/16/20
1003
/03/20
1003
/18/20
1004
/02/20
1004
/17/20
1005
/02/20
1005
/17/20
1006
/01/20
1006
/16/20
10
AACT OM Equity MSM30 Index
Al AnwResearch In
Equity Re
Company
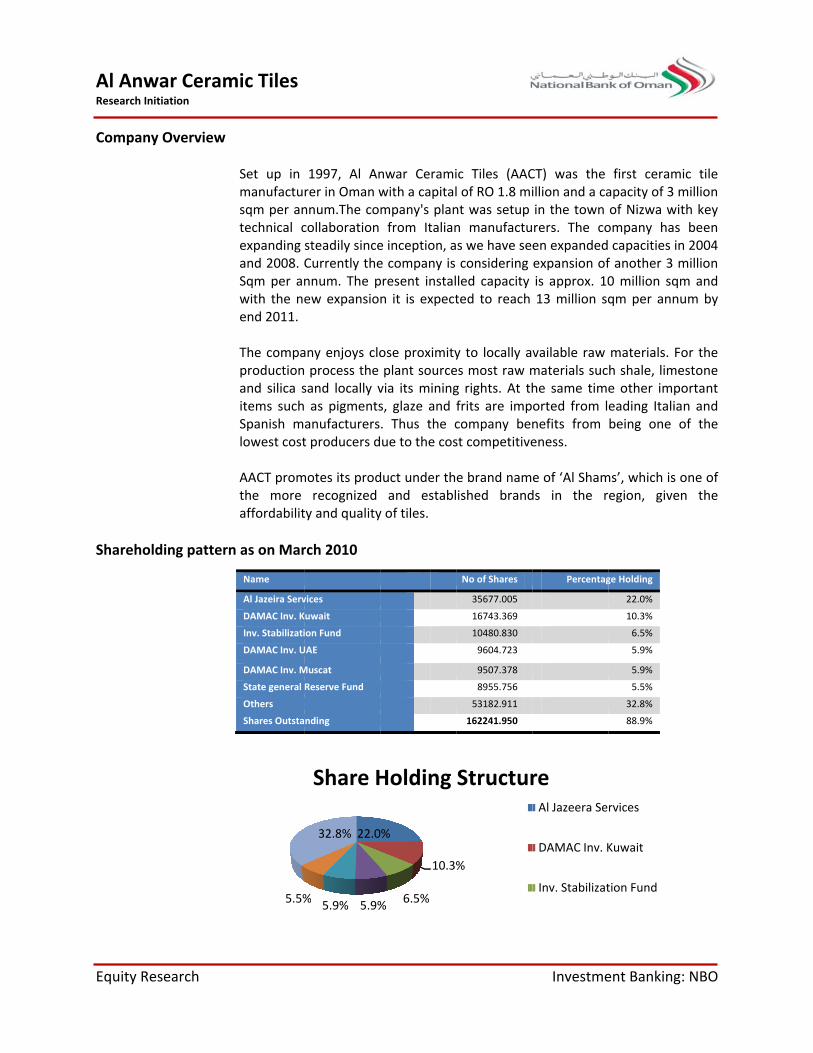
Sharehol
war Ceramnitiation
esearch
y Overview
lding patter
mic Tiles
Set up in manufactusqm per antechnical cexpanding and 2008. Sqm per anwith the nend 2011. The compaproductionand silica sitems suchSpanish mlowest cost AACT promthe more affordabilit
n as on Mar
5.5%
Name
Al Jazeira Serv
DAMAC Inv. K
Inv. Stabilizati
DAMAC Inv. U
DAMAC Inv. M
State general
Others
Shares Outsta
1997, Al Anrer in Oman wnnum.The cocollaboration steadily sinceCurrently thennum. The pew expansio
any enjoys clo process the sand locally v as pigmentsanufacturerst producers d
motes its prodrecognized
ty and quality
rch 2010
22.0
5.9%5.9%%
32.8%
Share H
vices
Kuwait
ion Fund
UAE
Muscat
Reserve Fund
nding
nwar Ceramiwith a capitalmpany's planfrom Italian
e inception, ae company is present instaln it is expect
ose proximityplant sourcevia its minings, glaze and . Thus the cue to the cos
duct under thand establ
y of tiles.
0%
10.3%
6.5%%
Holding
ic Tiles (AACl of RO 1.8 mint was setup n manufactus we have seconsidering led capacity ted to reach
y to locally aes most raw mg rights. At thfrits are impcompany benst competitive
e brand namished brand
%
Structur
No of Shares
35677.005
16743.369
10480.830
9604.723
9507.378
8955.756
53182.911
162241.950
Investme
CT) was the illion and a cain the town rers. The coen expandedexpansion ofis approx. 1013 million sq
vailable raw materials suche same timeorted from lnefits from eness.
e of ‘Al Shamds in the r
reAl Jazeera Se
DAMAC Inv. K
Inv. Stabilizat
Percentag
ent Banking:
first ceramiapacity of 3 mof Nizwa witompany has capacities inf another 3 m0 million sqmqm per annu
materials. Foh shale, limee other impoeading Italianbeing one o
ms’, which is oegion, given
rvices
Kuwait
tion Fund
ge Holding
22.0%
10.3%
6.5%
5.9%
5.9%
5.5%
32.8%
88.9%
NBO
c tile million th key been 2004
million m and um by
or the stone ortant n and of the
one of n the
Al Anwar Ceramic Tiles Research Initiation
Equity Research Investment Banking: NBO
Installed Capacity & Utilization
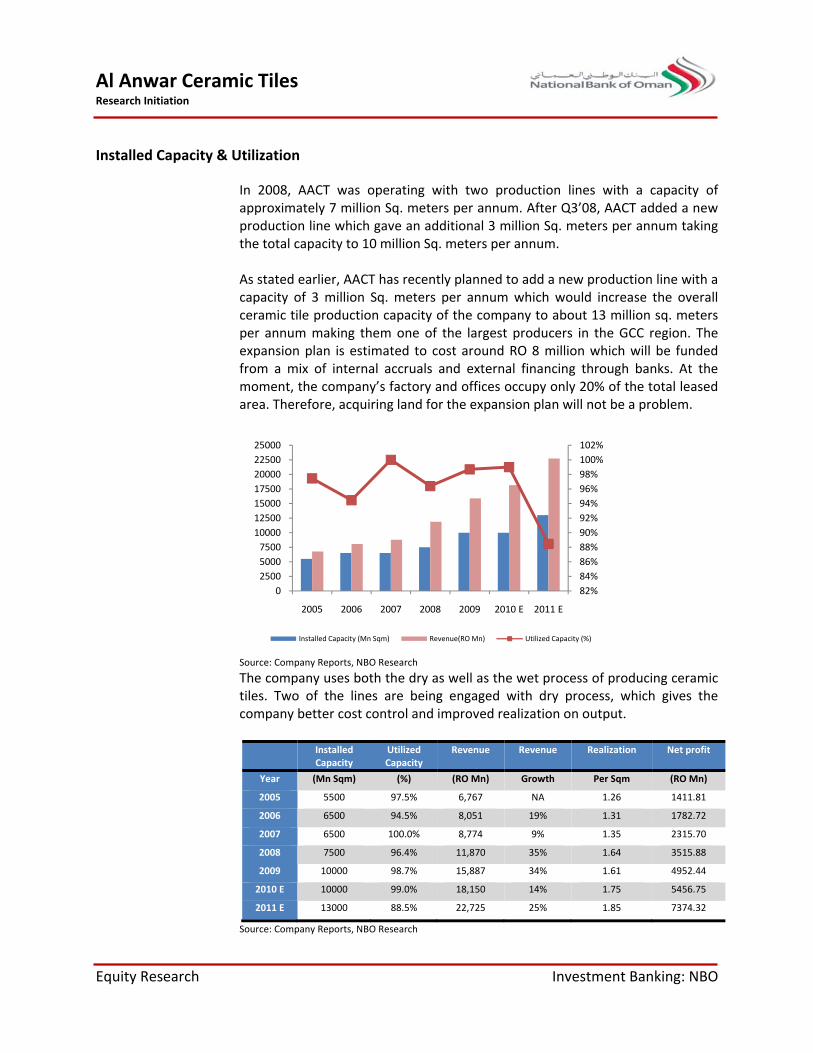
In 2008, AACT was operating with two production lines with a capacity of approximately 7 million Sq. meters per annum. After Q3’08, AACT added a new production line which gave an additional 3 million Sq. meters per annum taking the total capacity to 10 million Sq. meters per annum. As stated earlier, AACT has recently planned to add a new production line with a capacity of 3 million Sq. meters per annum which would increase the overall ceramic tile production capacity of the company to about 13 million sq. meters per annum making them one of the largest producers in the GCC region. The expansion plan is estimated to cost around RO 8 million which will be funded from a mix of internal accruals and external financing through banks. At the moment, the company’s factory and offices occupy only 20% of the total leased area. Therefore, acquiring land for the expansion plan will not be a problem.
Source: Company Reports, NBO Research The company uses both the dry as well as the wet process of producing ceramic tiles. Two of the lines are being engaged with dry process, which gives the company better cost control and improved realization on output.
Installed Capacity
Utilized Capacity
Revenue Revenue Realization Net profit
Year (Mn Sqm) (%) (RO Mn) Growth Per Sqm (RO Mn)
2005 5500 97.5% 6,767 NA 1.26 1411.81
2006 6500 94.5% 8,051 19% 1.31 1782.72
2007 6500 100.0% 8,774 9% 1.35 2315.70
2008 7500 96.4% 11,870 35% 1.64 3515.88
2009 10000 98.7% 15,887 34% 1.61 4952.44
2010 E 10000 99.0% 18,150 14% 1.75 5456.75
2011 E 13000 88.5% 22,725 25% 1.85 7374.32
Source: Company Reports, NBO Research
82%84%86%88%90%92%94%96%98%100%102%
0250050007500
10000125001500017500200002250025000
2005 2006 2007 2008 2009 2010 E 2011 E
Installed Capacity (Mn Sqm) Revenue(RO Mn) Utilized Capacity (%)
Al Anwar Ceramic Tiles Research Initiation
Equity Research Investment Banking: NBO
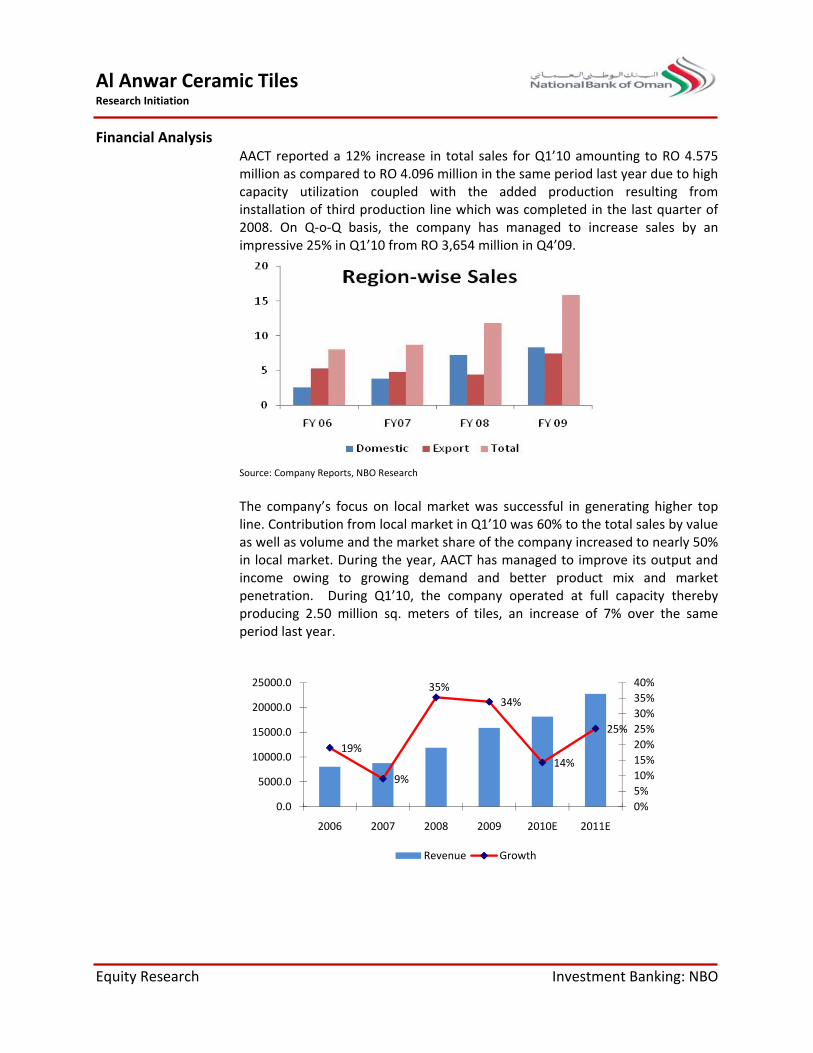
Financial Analysis AACT reported a 12% increase in total sales for Q1’10 amounting to RO 4.575 million as compared to RO 4.096 million in the same period last year due to high capacity utilization coupled with the added production resulting from installation of third production line which was completed in the last quarter of 2008. On Q‐o‐Q basis, the company has managed to increase sales by an impressive 25% in Q1’10 from RO 3,654 million in Q4’09.
Source: Company Reports, NBO Research
The company’s focus on local market was successful in generating higher top line. Contribution from local market in Q1’10 was 60% to the total sales by value as well as volume and the market share of the company increased to nearly 50% in local market. During the year, AACT has managed to improve its output and income owing to growing demand and better product mix and market penetration. During Q1’10, the company operated at full capacity thereby producing 2.50 million sq. meters of tiles, an increase of 7% over the same period last year.
19%
9%
35%34%
14%
25%
0%5%10%15%20%25%30%35%40%
0.0
5000.0
10000.0
15000.0
20000.0
25000.0
2006 2007 2008 2009 2010E 2011E
Revenue Growth
Al Anwar Ceramic Tiles Research Initiation
Equity Research Investment Banking: NBO
Cost Structure & profitability
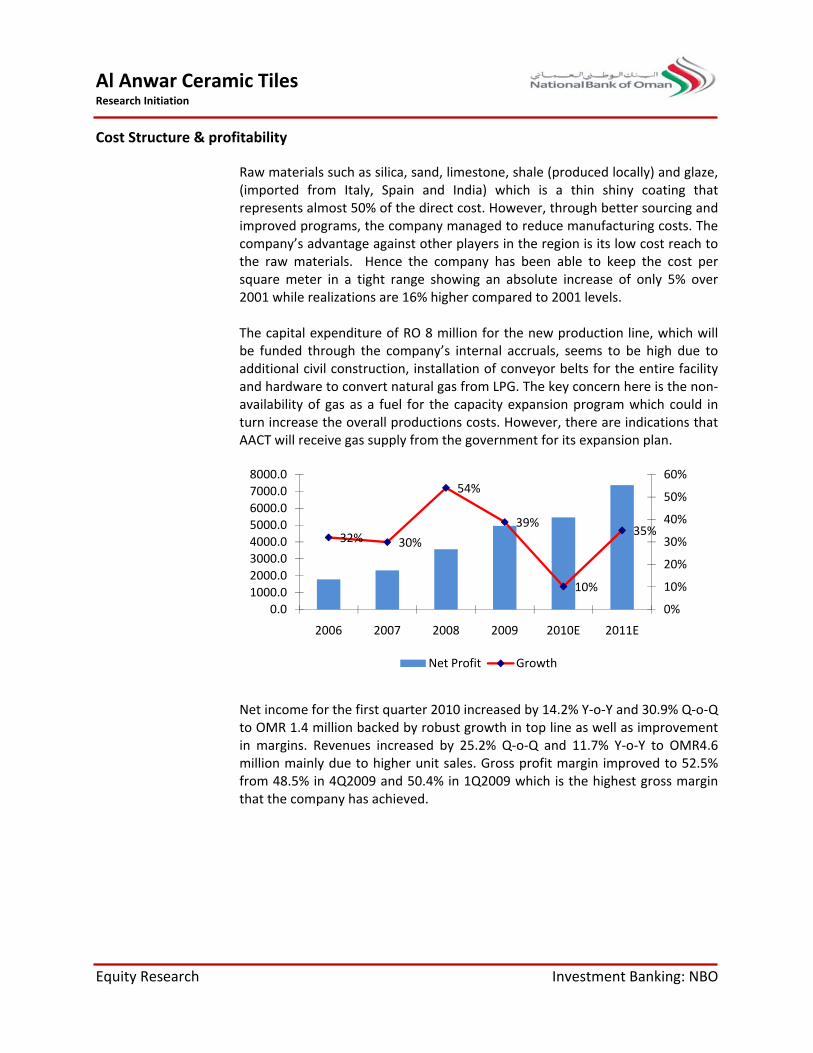
Raw materials such as silica, sand, limestone, shale (produced locally) and glaze, (imported from Italy, Spain and India) which is a thin shiny coating that represents almost 50% of the direct cost. However, through better sourcing and improved programs, the company managed to reduce manufacturing costs. The company’s advantage against other players in the region is its low cost reach to the raw materials. Hence the company has been able to keep the cost per square meter in a tight range showing an absolute increase of only 5% over 2001 while realizations are 16% higher compared to 2001 levels. The capital expenditure of RO 8 million for the new production line, which will be funded through the company’s internal accruals, seems to be high due to additional civil construction, installation of conveyor belts for the entire facility and hardware to convert natural gas from LPG. The key concern here is the non‐availability of gas as a fuel for the capacity expansion program which could in turn increase the overall productions costs. However, there are indications that AACT will receive gas supply from the government for its expansion plan.
Net income for the first quarter 2010 increased by 14.2% Y‐o‐Y and 30.9% Q‐o‐Q to OMR 1.4 million backed by robust growth in top line as well as improvement in margins. Revenues increased by 25.2% Q‐o‐Q and 11.7% Y‐o‐Y to OMR4.6 million mainly due to higher unit sales. Gross profit margin improved to 52.5% from 48.5% in 4Q2009 and 50.4% in 1Q2009 which is the highest gross margin that the company has achieved.
32% 30%
54%
39%
10%
35%
0%
10%
20%
30%
40%
50%
60%
0.01000.02000.03000.04000.05000.06000.07000.08000.0
2006 2007 2008 2009 2010E 2011E
Net Profit Growth
Al AnwResearch In
Equity Re
Ceramic
Domestic
Favorabl
Supply d
war Ceramnitiation
esearch
tiles market
c market
le demograp
eficiency cre
mic Tiles
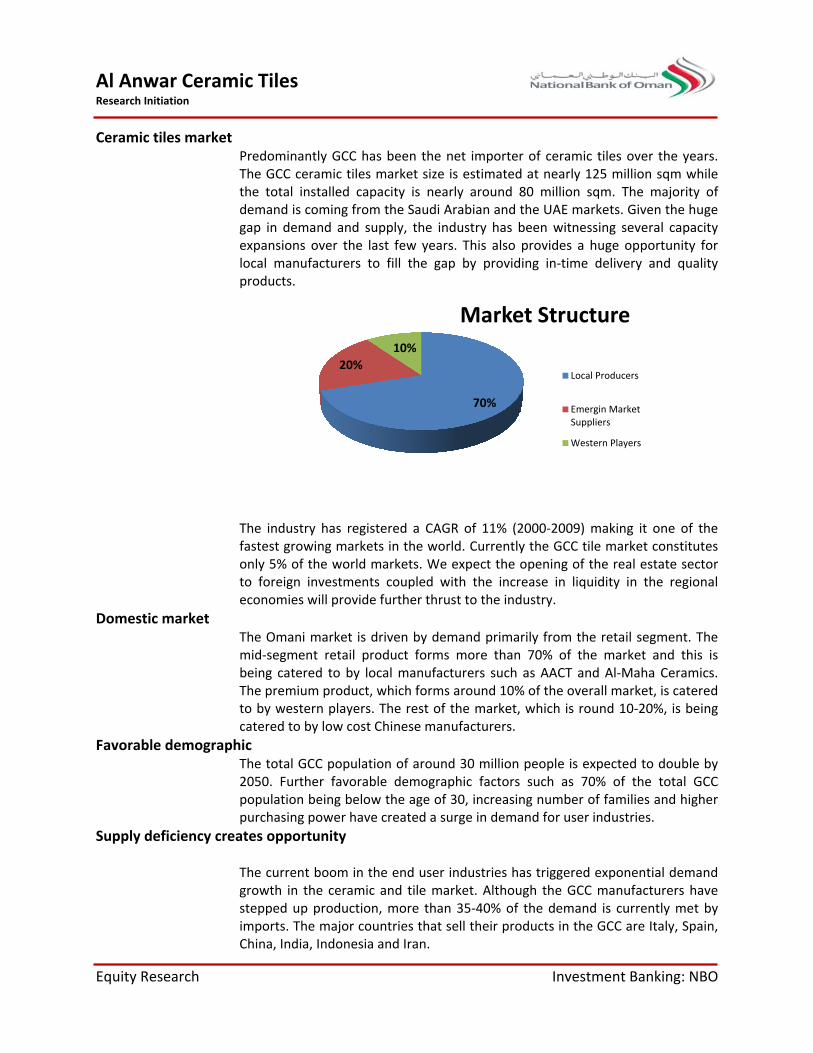
t PredominaThe GCC cethe total indemand is gap in demexpansionslocal manuproducts.
The industfastest growonly 5% of to foreign economies
The Omanimid‐segmebeing caterThe premiuto by westcatered to
phic The total G2050. Furtpopulation purchasing
eates oppor The currengrowth in tstepped upimports. ThChina, India
ntly GCC haseramic tiles mnstalled capacoming frommand and sups over the lasufacturers to
ry has registwing marketsthe world minvestments will provide f
i market is drent retail prored to by locum product, wern players. Tby low cost C
GCC populatioher favorablbeing below power have rtunity
t boom in ththe ceramic p production,he major coua, Indonesia a
20%
s been the nemarket size isacity is nearl the Saudi Arpply, the indst few years.fill the gap
ered a CAGRs in the world
markets. We ecoupled witfurther thrus
riven by demoduct forms cal manufactuwhich forms aThe rest of thChinese manu
on of around e demograph
w the age of 3created a sur
e end user inand tile mark, more than ntries that seand Iran.
10%
et importer os estimated ay around 80rabian and thustry has be This also prby providin
R of 11% (200d. Currently texpect the opth the increat to the indus
mand primarilymore than 7urers such asaround 10% ohe market, wufacturers.
30 million pehic factors s30, increasingrge in deman
ndustries has ket. Although35‐40% of thell their produ
70%
Market
Investme
of ceramic tilat nearly 125 0 million sqme UAE markeen witnessinrovides a hugg in‐time de
00‐2009) mathe GCC tile mpening of thease in liquidistry.
y from the re70% of the ms AACT and Aof the overall which is round
eople is expeuch as 70% number of fd for user ind
triggered exh the GCC mhe demand isucts in the GC
Structu
Local Pro
Emergin Suppliers
Western
ent Banking:
es over the ymillion sqm
m. The majorets. Given theg several capge opportunitelivery and q
king it one omarket const real estate sty in the reg
etail segmentmarket and tAl‐Maha Ceramarket, is cad 10‐20%, is
ected to doubof the totalamilies and hdustries.
ponential deanufacturers s currently mCC are Italy, S
ure
oducers
Market s
Players
NBO
years. while rity of huge pacity ty for uality
of the itutes sector gional
t. The this is amics. atered being
ble by l GCC higher
mand have
met by Spain,
Al Anwar Ceramic Tiles Research Initiation
Equity Research Investment Banking: NBO
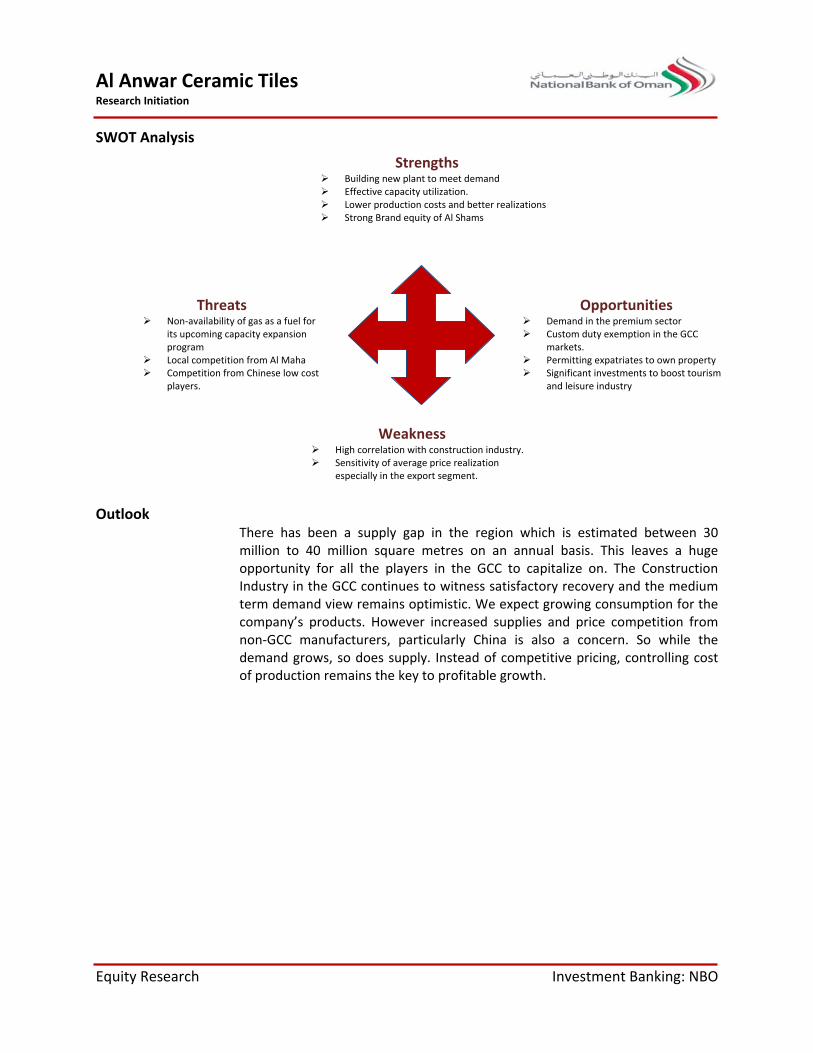
SWOT Analysis Outlook
There has been a supply gap in the region which is estimated between 30 million to 40 million square metres on an annual basis. This leaves a huge opportunity for all the players in the GCC to capitalize on. The Construction Industry in the GCC continues to witness satisfactory recovery and the medium term demand view remains optimistic. We expect growing consumption for the company’s products. However increased supplies and price competition from non‐GCC manufacturers, particularly China is also a concern. So while the demand grows, so does supply. Instead of competitive pricing, controlling cost of production remains the key to profitable growth.
Strengths Building new plant to meet demand Effective capacity utilization. Lower production costs and better realizations Strong Brand equity of Al Shams
Opportunities Demand in the premium sector Custom duty exemption in the GCC
markets. Permitting expatriates to own property Significant investments to boost tourism
and leisure industry
Threats Non‐availability of gas as a fuel for
its upcoming capacity expansion program
Local competition from Al Maha Competition from Chinese low cost
players.
Weakness High correlation with construction industry. Sensitivity of average price realization
especially in the export segment.
Al Anwar Ceramic Tiles Research Initiation
Equity Research Investment Banking: NBO
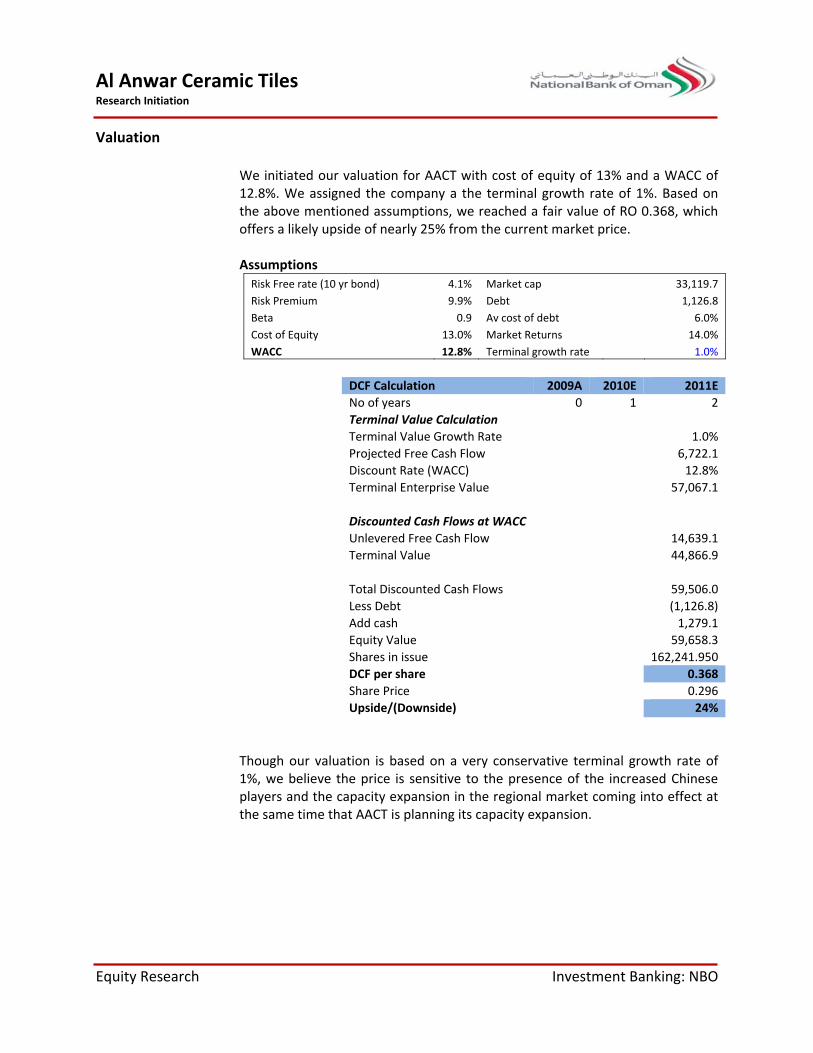
Valuation
We initiated our valuation for AACT with cost of equity of 13% and a WACC of 12.8%. We assigned the company a the terminal growth rate of 1%. Based on the above mentioned assumptions, we reached a fair value of RO 0.368, which offers a likely upside of nearly 25% from the current market price. Assumptions Risk Free rate (10 yr bond) 4.1% Market cap 33,119.7 Risk Premium 9.9% Debt 1,126.8 Beta 0.9 Av cost of debt 6.0% Cost of Equity 13.0% Market Returns 14.0% WACC 12.8% Terminal growth rate 1.0%
DCF Calculation 2009A 2010E 2011ENo of years 0 1 2Terminal Value Calculation Terminal Value Growth Rate 1.0%Projected Free Cash Flow 6,722.1Discount Rate (WACC) 12.8%Terminal Enterprise Value 57,067.1
Discounted Cash Flows at WACC Unlevered Free Cash Flow 14,639.1Terminal Value 44,866.9
Total Discounted Cash Flows 59,506.0Less Debt (1,126.8)Add cash 1,279.1Equity Value 59,658.3Shares in issue 162,241.950DCF per share 0.368Share Price 0.296Upside/(Downside) 24%
Though our valuation is based on a very conservative terminal growth rate of 1%, we believe the price is sensitive to the presence of the increased Chinese players and the capacity expansion in the regional market coming into effect at the same time that AACT is planning its capacity expansion.
Al Anwar Ceramic Tiles Research Initiation
Equity Research Investment Banking: NBO
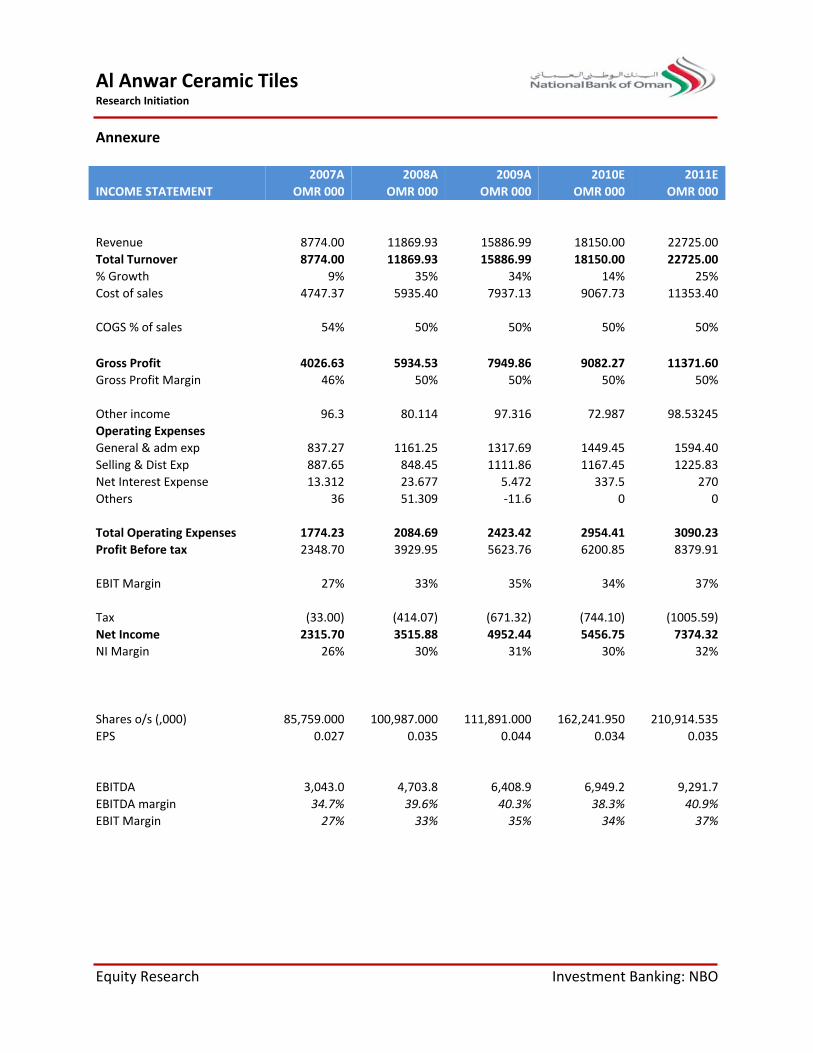
Annexure
2007A 2008A 2009A 2010E 2011EINCOME STATEMENT OMR 000 OMR 000 OMR 000 OMR 000 OMR 000 Revenue 8774.00 11869.93 15886.99 18150.00 22725.00Total Turnover 8774.00 11869.93 15886.99 18150.00 22725.00% Growth 9% 35% 34% 14% 25%Cost of sales 4747.37 5935.40 7937.13 9067.73 11353.40 COGS % of sales 54% 50% 50% 50% 50% Gross Profit 4026.63 5934.53 7949.86 9082.27 11371.60Gross Profit Margin 46% 50% 50% 50% 50% Other income 96.3 80.114 97.316 72.987 98.53245Operating Expenses General & adm exp 837.27 1161.25 1317.69 1449.45 1594.40Selling & Dist Exp 887.65 848.45 1111.86 1167.45 1225.83Net Interest Expense 13.312 23.677 5.472 337.5 270Others 36 51.309 ‐11.6 0 0 Total Operating Expenses 1774.23 2084.69 2423.42 2954.41 3090.23Profit Before tax 2348.70 3929.95 5623.76 6200.85 8379.91 EBIT Margin 27% 33% 35% 34% 37% Tax (33.00) (414.07) (671.32) (744.10) (1005.59)Net Income 2315.70 3515.88 4952.44 5456.75 7374.32NI Margin 26% 30% 31% 30% 32% Shares o/s (,000) 85,759.000 100,987.000 111,891.000 162,241.950 210,914.535EPS 0.027 0.035 0.044 0.034 0.035 EBITDA 3,043.0 4,703.8 6,408.9 6,949.2 9,291.7EBITDA margin 34.7% 39.6% 40.3% 38.3% 40.9%EBIT Margin 27% 33% 35% 34% 37%
Al Anwar Ceramic Tiles Research Initiation
Equity Research Investment Banking: NBO
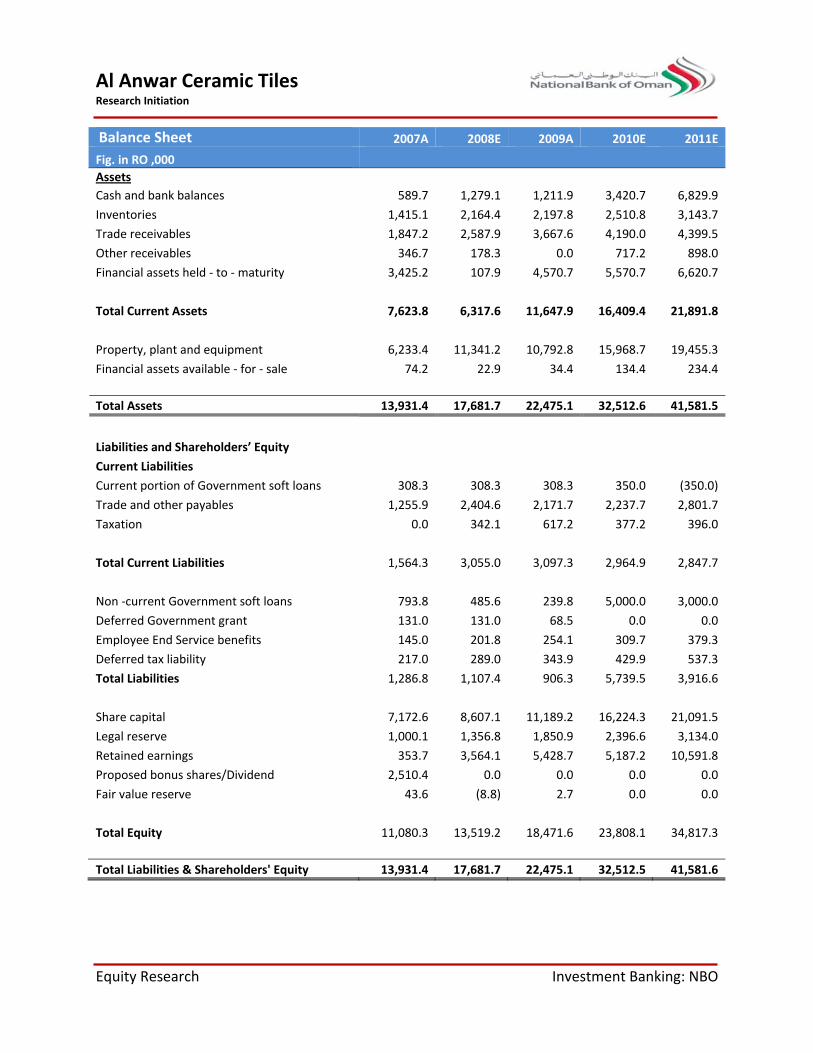
Balance Sheet 2007A 2008E 2009A 2010E 2011E
Fig. in RO ,000 Assets Cash and bank balances 589.7 1,279.1 1,211.9 3,420.7 6,829.9
Inventories 1,415.1 2,164.4 2,197.8 2,510.8 3,143.7
Trade receivables 1,847.2 2,587.9 3,667.6 4,190.0 4,399.5
Other receivables 346.7 178.3 0.0 717.2 898.0
Financial assets held ‐ to ‐ maturity 3,425.2 107.9 4,570.7 5,570.7 6,620.7
Total Current Assets 7,623.8 6,317.6 11,647.9 16,409.4 21,891.8
Property, plant and equipment 6,233.4 11,341.2 10,792.8 15,968.7 19,455.3
Financial assets available ‐ for ‐ sale 74.2 22.9 34.4 134.4 234.4 Total Assets 13,931.4 17,681.7 22,475.1 32,512.6 41,581.5
Liabilities and Shareholders’ Equity
Current Liabilities
Current portion of Government soft loans 308.3 308.3 308.3 350.0 (350.0)
Trade and other payables 1,255.9 2,404.6 2,171.7 2,237.7 2,801.7
Taxation 0.0 342.1 617.2 377.2 396.0
Total Current Liabilities 1,564.3 3,055.0 3,097.3 2,964.9 2,847.7
Non ‐current Government soft loans 793.8 485.6 239.8 5,000.0 3,000.0
Deferred Government grant 131.0 131.0 68.5 0.0 0.0
Employee End Service benefits 145.0 201.8 254.1 309.7 379.3
Deferred tax liability 217.0 289.0 343.9 429.9 537.3
Total Liabilities 1,286.8 1,107.4 906.3 5,739.5 3,916.6
Share capital 7,172.6 8,607.1 11,189.2 16,224.3 21,091.5
Legal reserve 1,000.1 1,356.8 1,850.9 2,396.6 3,134.0
Retained earnings 353.7 3,564.1 5,428.7 5,187.2 10,591.8
Proposed bonus shares/Dividend 2,510.4 0.0 0.0 0.0 0.0
Fair value reserve 43.6 (8.8) 2.7 0.0 0.0
Total Equity 11,080.3 13,519.2 18,471.6 23,808.1 34,817.3 Total Liabilities & Shareholders' Equity 13,931.4 17,681.7 22,475.1 32,512.5 41,581.6
Al Anwar Ceramic Tiles Research Initiation
Equity Research Investment Banking: NBO
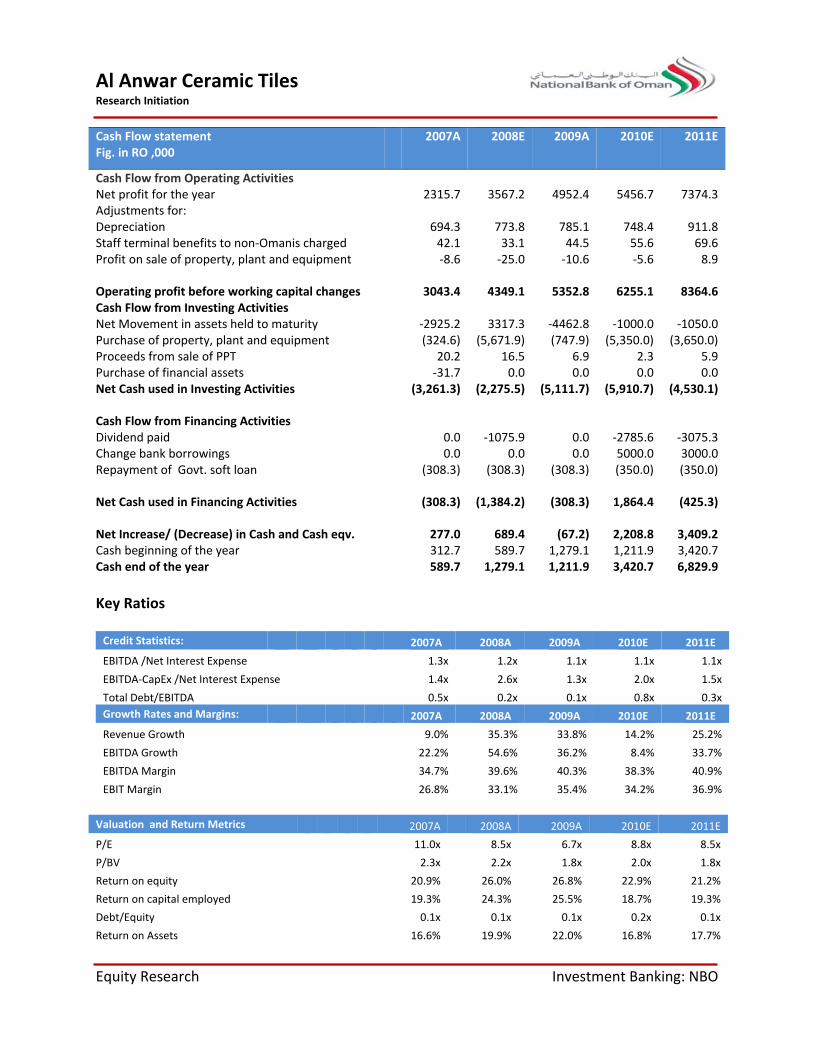
Cash Flow statement 2007A 2008E 2009A 2010E 2011EFig. in RO ,000
Cash Flow from Operating Activities Net profit for the year 2315.7 3567.2 4952.4 5456.7 7374.3Adjustments for: Depreciation 694.3 773.8 785.1 748.4 911.8Staff terminal benefits to non‐Omanis charged 42.1 33.1 44.5 55.6 69.6Profit on sale of property, plant and equipment ‐8.6 ‐25.0 ‐10.6 ‐5.6 8.9 Operating profit before working capital changes 3043.4 4349.1 5352.8 6255.1 8364.6Cash Flow from Investing Activities Net Movement in assets held to maturity ‐2925.2 3317.3 ‐4462.8 ‐1000.0 ‐1050.0Purchase of property, plant and equipment (324.6) (5,671.9) (747.9) (5,350.0) (3,650.0)Proceeds from sale of PPT 20.2 16.5 6.9 2.3 5.9Purchase of financial assets ‐31.7 0.0 0.0 0.0 0.0Net Cash used in Investing Activities (3,261.3) (2,275.5) (5,111.7) (5,910.7) (4,530.1) Cash Flow from Financing Activities Dividend paid 0.0 ‐1075.9 0.0 ‐2785.6 ‐3075.3Change bank borrowings 0.0 0.0 0.0 5000.0 3000.0Repayment of Govt. soft loan (308.3) (308.3) (308.3) (350.0) (350.0) Net Cash used in Financing Activities (308.3) (1,384.2) (308.3) 1,864.4 (425.3) Net Increase/ (Decrease) in Cash and Cash eqv. 277.0 689.4 (67.2) 2,208.8 3,409.2Cash beginning of the year 312.7 589.7 1,279.1 1,211.9 3,420.7Cash end of the year 589.7 1,279.1 1,211.9 3,420.7 6,829.9
Key Ratios
Credit Statistics: 2007A 2008A 2009A 2010E 2011E
EBITDA /Net Interest Expense 1.3x 1.2x 1.1x 1.1x 1.1x
EBITDA‐CapEx /Net Interest Expense 1.4x 2.6x 1.3x 2.0x 1.5x
Total Debt/EBITDA 0.5x 0.2x 0.1x 0.8x 0.3x Growth Rates and Margins: 2007A 2008A 2009A 2010E 2011E
Revenue Growth 9.0% 35.3% 33.8% 14.2% 25.2%
EBITDA Growth 22.2% 54.6% 36.2% 8.4% 33.7%
EBITDA Margin 34.7% 39.6% 40.3% 38.3% 40.9%
EBIT Margin 26.8% 33.1% 35.4% 34.2% 36.9%
Valuation and Return Metrics 2007A 2008A 2009A 2010E 2011E
P/E 11.0x 8.5x 6.7x 8.8x 8.5x
P/BV 2.3x 2.2x 1.8x 2.0x 1.8x
Return on equity 20.9% 26.0% 26.8% 22.9% 21.2%
Return on capital employed 19.3% 24.3% 25.5% 18.7% 19.3%
Debt/Equity 0.1x 0.1x 0.1x 0.2x 0.1x
Return on Assets 16.6% 19.9% 22.0% 16.8% 17.7%
Investment Banking Department National Bank of Oman SAOG National Bank of Oman SAOG, P.O. Box 751, Postal Code 112 Ruwi, Muscat, Sultanate of Oman, Telephone: +968‐
2477 8000, Fax: +968‐24778420;Email: [email protected] ; http://www.nbo.co.om
Analysts Tel Email Aziz Al‐Jahdhami (+968) 24 778329 [email protected]
Partha Sarathi (+968) 24 778425 [email protected]
Rand Al Shaikh (+968) 24 778180 [email protected]
Brokerage Unit Tel Email Khalid Al‐Sulaimi (+968) 24 778697 [email protected]
Hussain Al‐Lawati (+968) 24 778791 [email protected]
Murtadha Al‐Ajmi (+968) 24 778761 [email protected]
Amur Al Mashani (+968) 24 778790 [email protected]
Disclaimer: The information and opinions in this report were prepared by the Investment Banking Division of the National Bank of Oman (SAOG) (NBO). This document is for the information and use of the recipient only. It is not to be reproduced or copied or made available to others. Under no circumstances is this report to be considered as an offer to sell or a solicitation to buy any security. NBO from time to time may perform buying or selling operations in the stocks of, or provide investment banking or other services to companies discussed in this report. This report is based on publicly available information. NBO makes every effort to use reliable, comprehensive information, but makes no representation that it is accurate or complete. NBO does not accept any liability for any direct or consequential loss arising from any use of material contained in this report. This report does not provide individually tailored advice. It has been prepared without regard to the individual financial circumstances and objectives of the persons who receive it. NBO recommends that investors independently evaluate particular investments and strategies. Recipients should note that investments in equity shares, preferred shares, bonds similar investments are subject to risks derived from fundamental factors related to the business and interest rates, currency rates, and many other macroeconomic and market factors. This risk includes the risk of complete loss of capital invested. In case any recipient is considering making an investment in any stocks or shares, before doing so it should obtain independent advice from its financial or legal advisors. Opinions in the report are subject to change based on new fundamental information or new analysis of existing fundamental information emerging, or due to a change in market price of the security. NBO reserves the right to alter its views without prior notice and is not under any obligation to publish its revised views or inform the recipients about the same.


![[YM Cheng] Slope Stability Analysis and Stabilizat(Bookos.org)](https://img.pdfslide.us/doc/110x75/55cf9bc1550346d033a7440d/ym-cheng-slope-stability-analysis-and-stabilizatbookosorg.jpg)