Embed Size (px)
Citation preview
Akton Psychrometric ChartTutorial and Examples
December 1999
Akton Associates Inc.3600 Clayton Road, Suite DConcord, California 94521
(925) 688-0333http://www.aktonassoc.com
Copyright 1999 Akton Associates Inc.
APC Tutorial / Examples
2
Table of ContentsTutorial 4
Introduction...................................................................................................... 4Starting the program........................................................................................ 5Psychrometric properties................................................................................. 6Creating points ................................................................................................ 8The report window......................................................................................... 12Editing points ................................................................................................. 14Customizing the chart.................................................................................... 16
Example 1: Analysis of a point 18
Example 2: Moist air heating 22
Example 3: Moist air cooling 25
Example 4: Adiabatic mixing of moist air streams 29
Example 5: Adiabatic mixing of water injected into air 32
Example 6: Air conditioning a space 35
APC Tutorial / Examples
3
Tutorial / ExamplesThe tutorial is meant to be a series of exercises to demonstrate the essential features of theAkton Psychrometric Chart for Windows Version 4. By working through the tutorial instructions,you should have an understanding of the basic program elements and how they work together.This tutorial is meant to focus on the most basic elements of program operation.The example problems further demonstrate program usage, but also emphasize problem solvingtechniques. This set of examples are variations on examples presented in The ASHRAEHandbook of Fundamentals. ASHRAE is the American Society of Heating, Refrigeration and Air-Conditioning Engineers. Chapter 6 on psychrometrics presents examples involving the sametype of problems, along with the theory, principals, and calculations involved in solving theexamples manually using a psychrometric chart. The examples presented here, are for thepurpose of familiarizing the user with the use of the program. They are presented assuming theuser to have a basic understanding of psychrometrics. They where not intended to be asubstitute for the study of psychrometrics, that most engineers and many laymen haveundergone.The solutions to these examples as presented here are by no means the only way of solvingthese problems using this software. They may not even be the best way to solve these problems.They are just one possible way to solve these problems, and are presented in this form, to helpfamiliarize the user with some of the features of the program.
APC Tutorial / Examples
4
TutorialIntroductionThis tutorial is meant to demonstrate some of the essential features of the Akton Psychrometric Chart forWindows Version 4. By working through this tutorial you should gain a basic understanding of theessential program features necessary to begin applying the program to problems involving psychrometrics.The goal of the tutorial is to get you up and going so that you can begin to explore the program’scapabilities on your own, it does not go into any of the more advanced features of the program.
There is a general tendency through out this program, and often in other windows programs as well, toprovide a consistent interface by associating certain mouse events with conceptual actions. All of thewindows in the Akton Psychrometric Chart are interactive, and a variety of tasks can be accomplishedusing the mouse. It is generally useful to think of the following mouse events as described below.Left mouse clicks: select, createRight mouse clicks: edit, alter, modifyLeft mouse double clicks: activate, transfer, confirmed selectLeft mouse drag: move, size
APC Tutorial / Examples
5
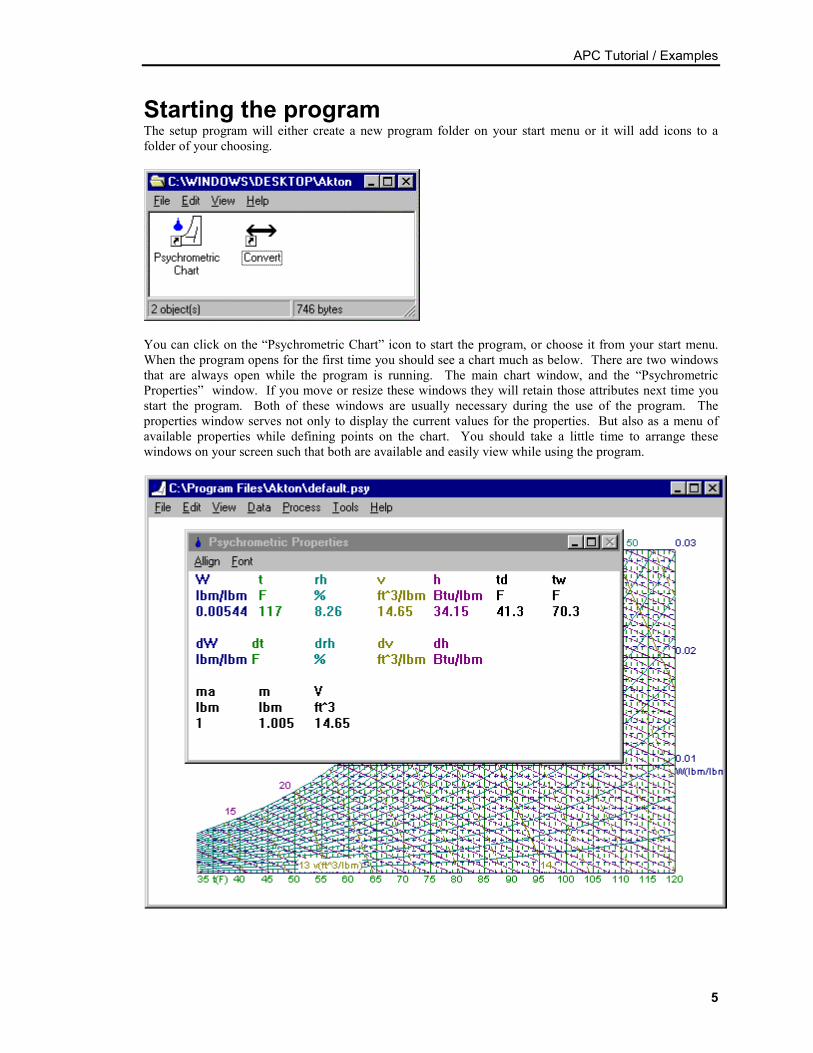
Starting the programThe setup program will either create a new program folder on your start menu or it will add icons to afolder of your choosing.
You can click on the “Psychrometric Chart” icon to start the program, or choose it from your start menu.When the program opens for the first time you should see a chart much as below. There are two windowsthat are always open while the program is running. The main chart window, and the “PsychrometricProperties” window. If you move or resize these windows they will retain those attributes next time youstart the program. Both of these windows are usually necessary during the use of the program. Theproperties window serves not only to display the current values for the properties. But also as a menu ofavailable properties while defining points on the chart. You should take a little time to arrange thesewindows on your screen such that both are available and easily view while using the program.
APC Tutorial / Examples
6
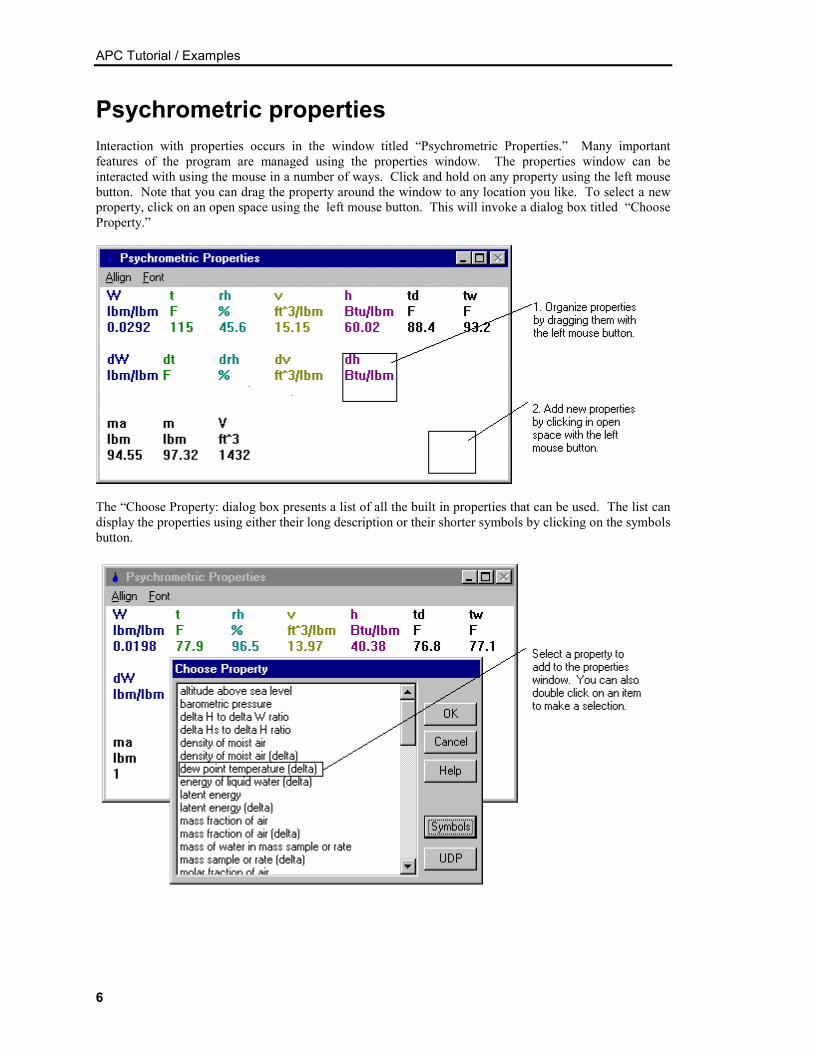
Psychrometric propertiesInteraction with properties occurs in the window titled “Psychrometric Properties.” Many importantfeatures of the program are managed using the properties window. The properties window can beinteracted with using the mouse in a number of ways. Click and hold on any property using the left mousebutton. Note that you can drag the property around the window to any location you like. To select a newproperty, click on an open space using the left mouse button. This will invoke a dialog box titled “ChooseProperty.”
The “Choose Property: dialog box presents a list of all the built in properties that can be used. The list candisplay the properties using either their long description or their shorter symbols by clicking on the symbolsbutton.
APC Tutorial / Examples
7
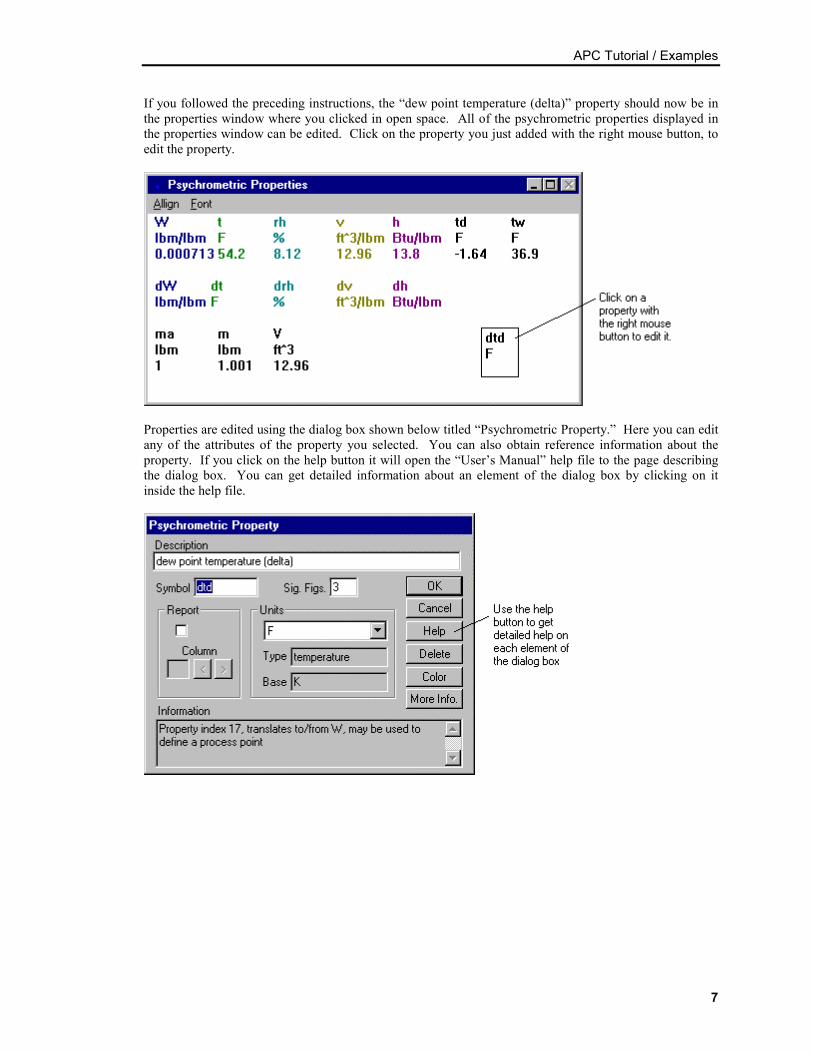
If you followed the preceding instructions, the “dew point temperature (delta)” property should now be inthe properties window where you clicked in open space. All of the psychrometric properties displayed inthe properties window can be edited. Click on the property you just added with the right mouse button, toedit the property.
Properties are edited using the dialog box shown below titled “Psychrometric Property.” Here you can editany of the attributes of the property you selected. You can also obtain reference information about theproperty. If you click on the help button it will open the “User’s Manual” help file to the page describingthe dialog box. You can get detailed information about an element of the dialog box by clicking on itinside the help file.
APC Tutorial / Examples
8
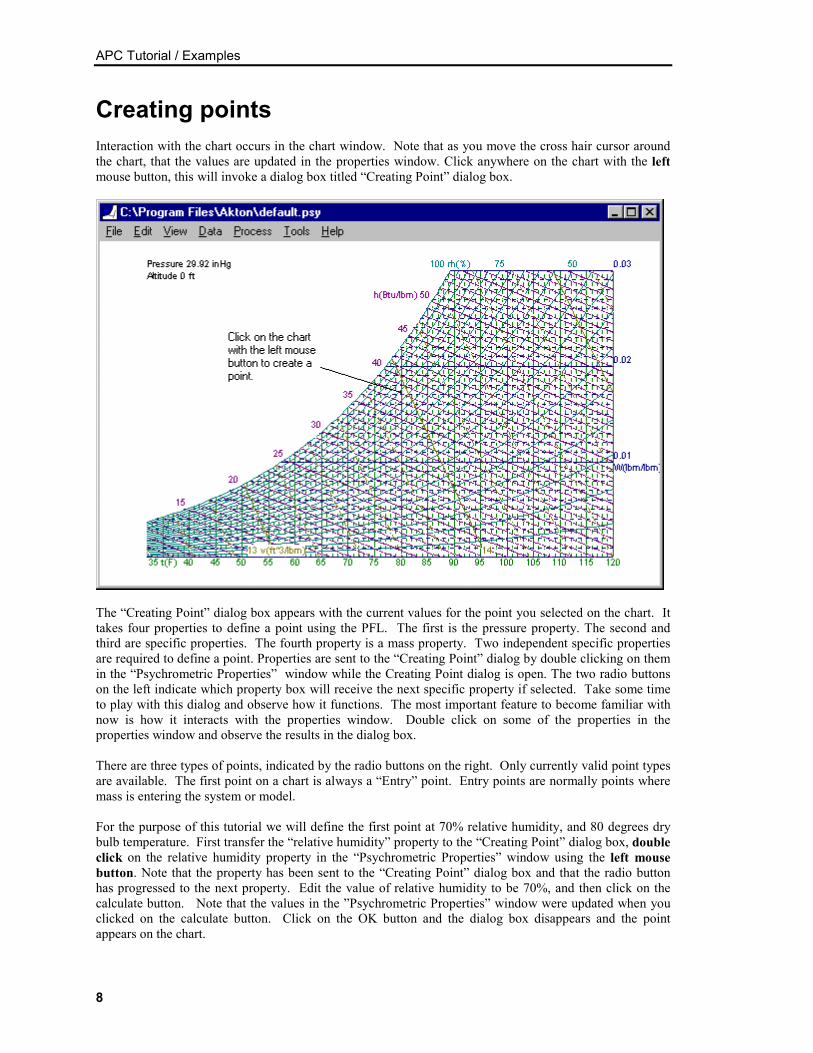
Creating pointsInteraction with the chart occurs in the chart window. Note that as you move the cross hair cursor aroundthe chart, that the values are updated in the properties window. Click anywhere on the chart with the leftmouse button, this will invoke a dialog box titled “Creating Point” dialog box.
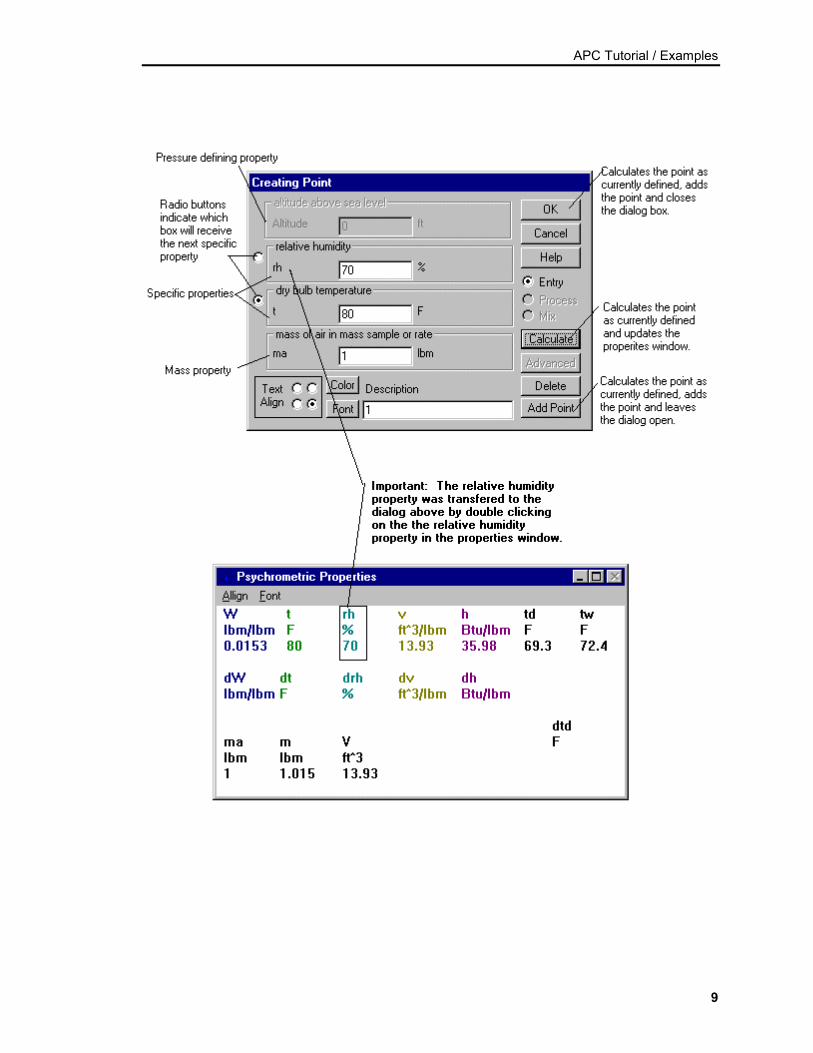
The “Creating Point” dialog box appears with the current values for the point you selected on the chart. Ittakes four properties to define a point using the PFL. The first is the pressure property. The second andthird are specific properties. The fourth property is a mass property. Two independent specific propertiesare required to define a point. Properties are sent to the “Creating Point” dialog by double clicking on themin the “Psychrometric Properties” window while the Creating Point dialog is open. The two radio buttonson the left indicate which property box will receive the next specific property if selected. Take some timeto play with this dialog and observe how it functions. The most important feature to become familiar withnow is how it interacts with the properties window. Double click on some of the properties in theproperties window and observe the results in the dialog box.
There are three types of points, indicated by the radio buttons on the right. Only currently valid point typesare available. The first point on a chart is always a “Entry” point. Entry points are normally points wheremass is entering the system or model.
For the purpose of this tutorial we will define the first point at 70% relative humidity, and 80 degrees drybulb temperature. First transfer the “relative humidity” property to the “Creating Point” dialog box, doubleclick on the relative humidity property in the “Psychrometric Properties” window using the left mousebutton. Note that the property has been sent to the “Creating Point” dialog box and that the radio buttonhas progressed to the next property. Edit the value of relative humidity to be 70%, and then click on thecalculate button. Note that the values in the ”Psychrometric Properties” window were updated when youclicked on the calculate button. Click on the OK button and the dialog box disappears and the pointappears on the chart.
APC Tutorial / Examples
9
APC Tutorial / Examples
10
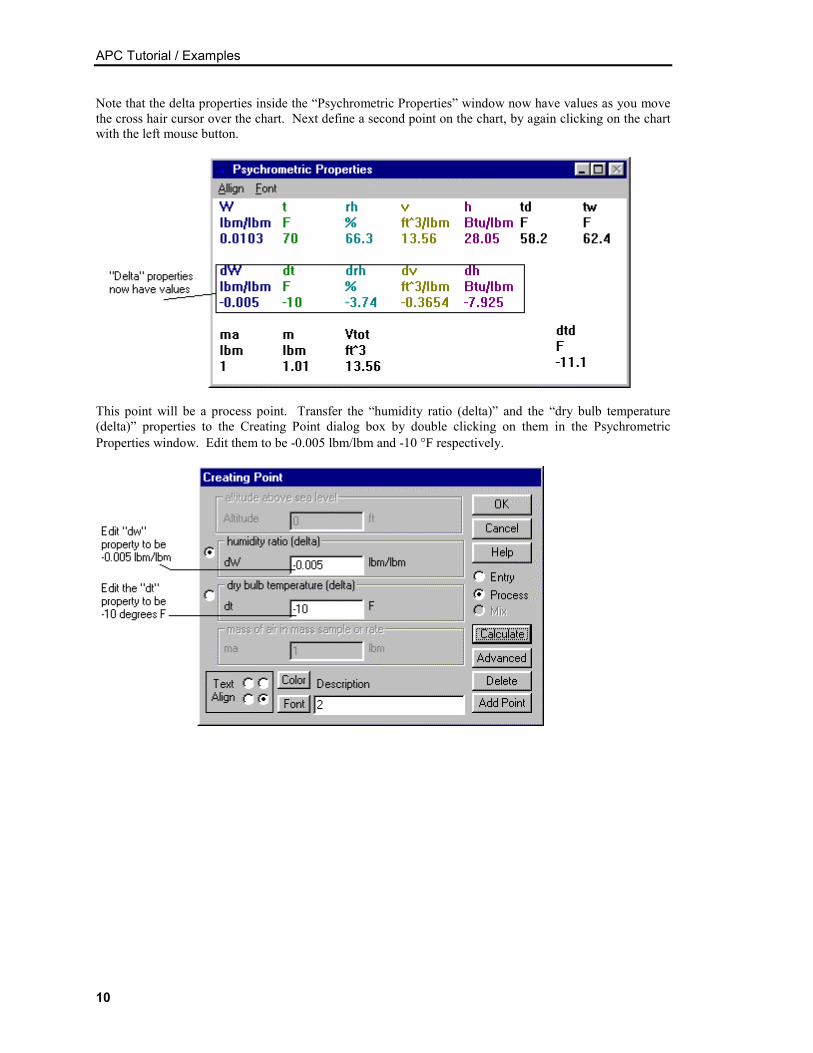
Note that the delta properties inside the “Psychrometric Properties” window now have values as you movethe cross hair cursor over the chart. Next define a second point on the chart, by again clicking on the chartwith the left mouse button.
This point will be a process point. Transfer the “humidity ratio (delta)” and the “dry bulb temperature(delta)” properties to the Creating Point dialog box by double clicking on them in the PsychrometricProperties window. Edit them to be -0.005 lbm/lbm and -10 °F respectively.
APC Tutorial / Examples
11
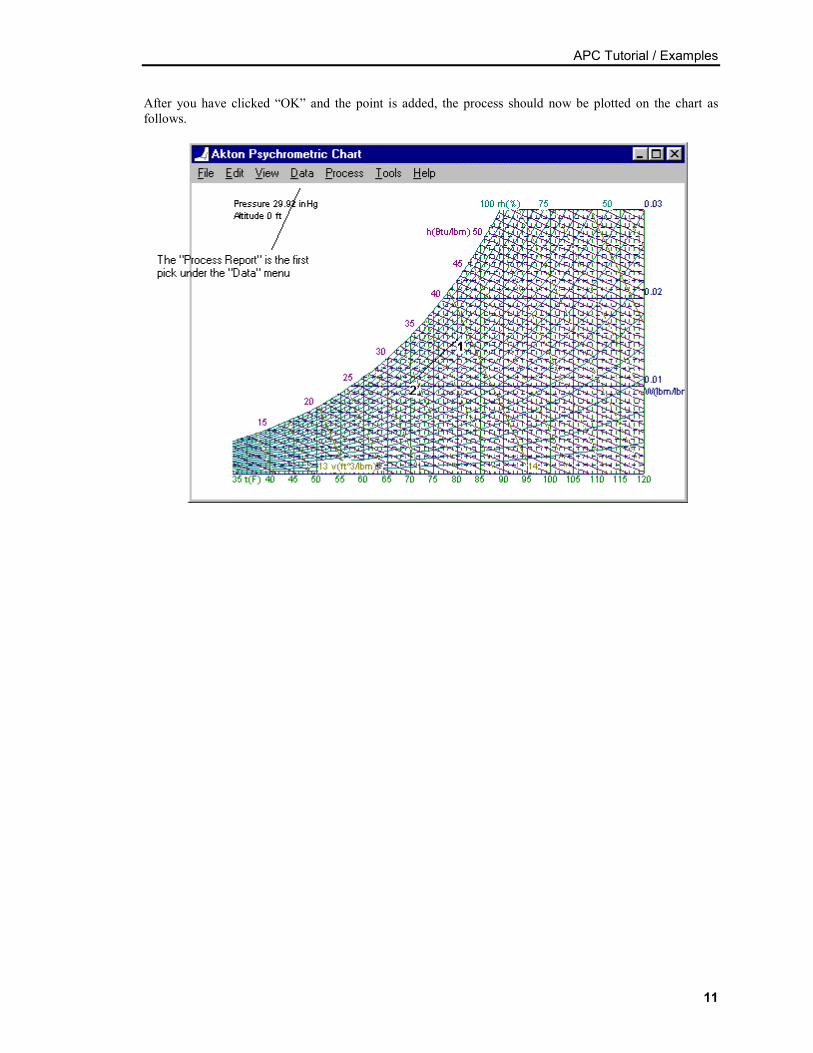
After you have clicked “OK” and the point is added, the process should now be plotted on the chart asfollows.
APC Tutorial / Examples
12
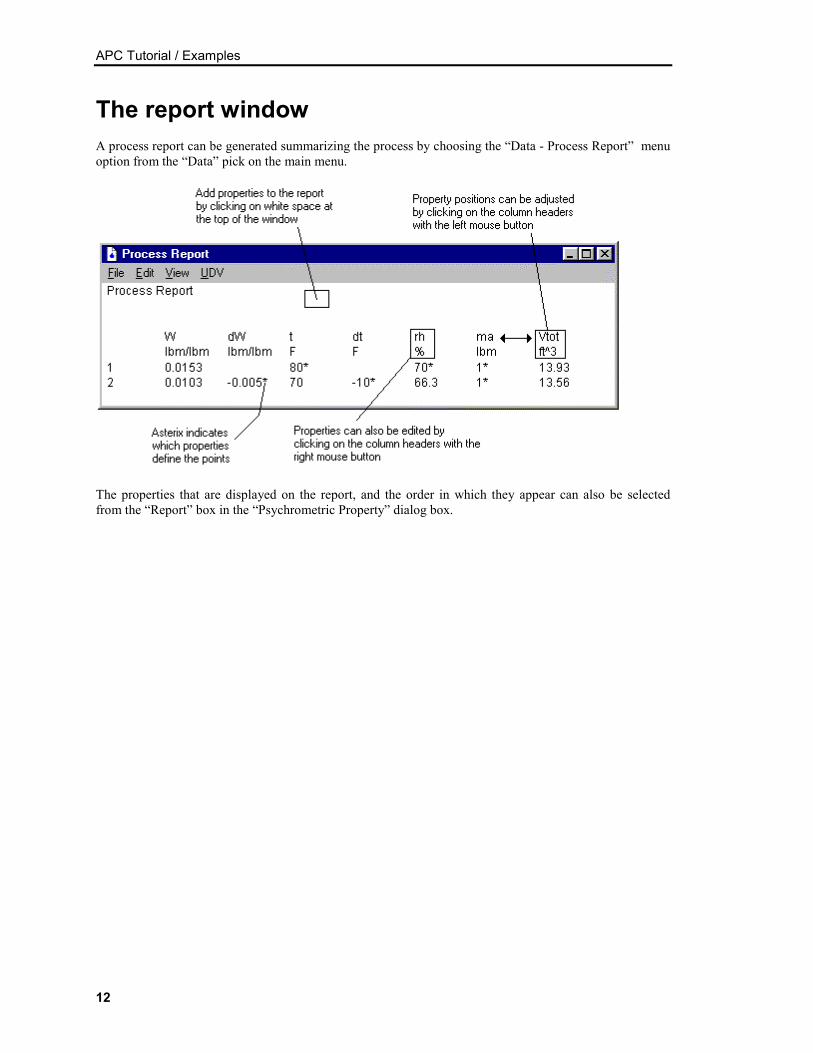
The report windowA process report can be generated summarizing the process by choosing the “Data - Process Report” menuoption from the “Data” pick on the main menu.
The properties that are displayed on the report, and the order in which they appear can also be selectedfrom the “Report” box in the “Psychrometric Property” dialog box.

APC Tutorial / Examples
13
APC Tutorial / Examples
14
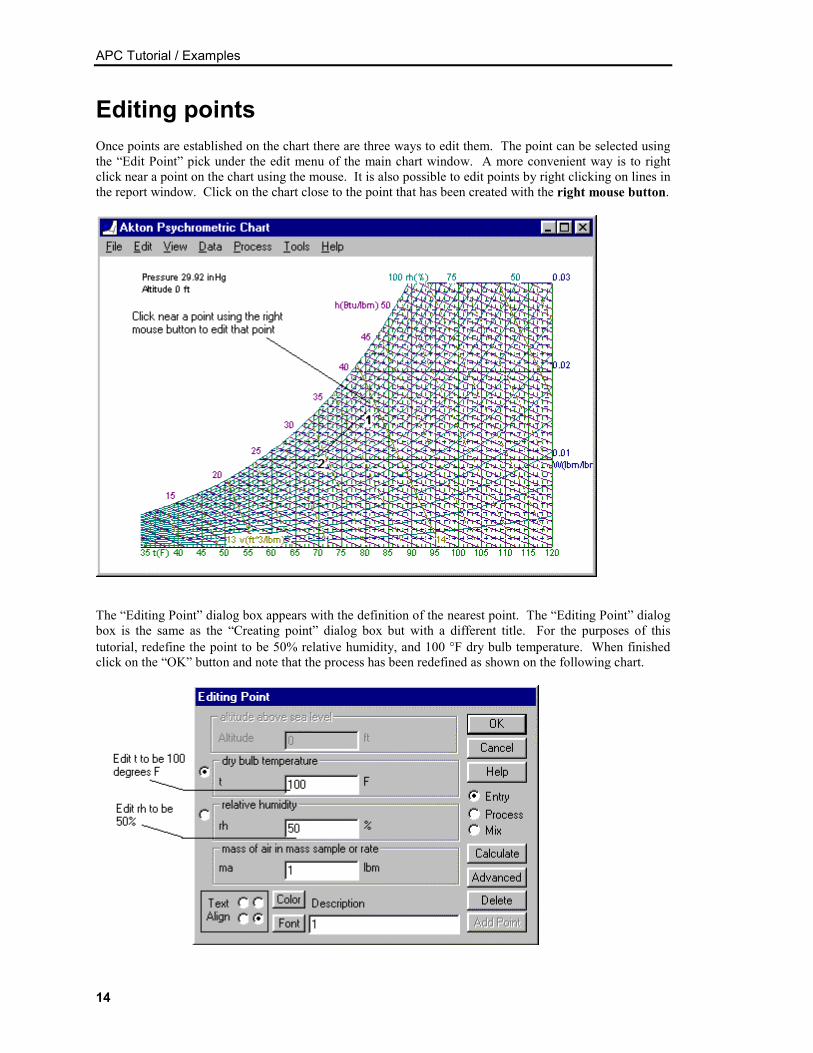
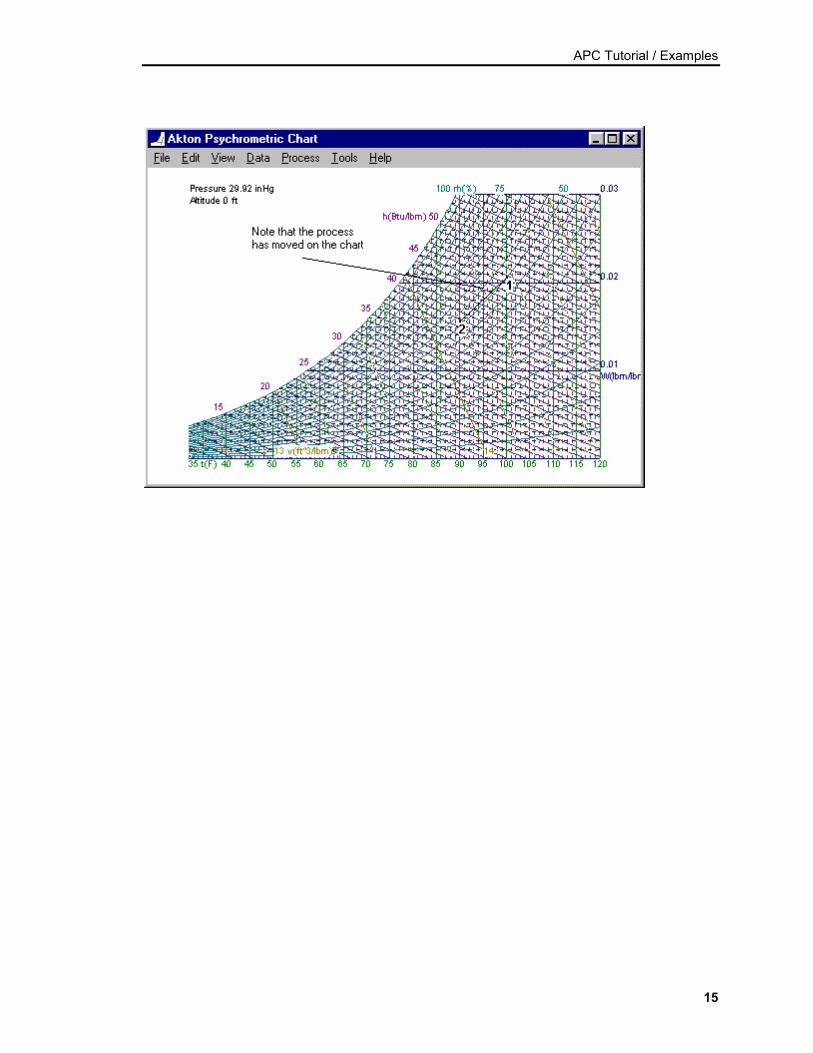
Editing pointsOnce points are established on the chart there are three ways to edit them. The point can be selected usingthe “Edit Point” pick under the edit menu of the main chart window. A more convenient way is to rightclick near a point on the chart using the mouse. It is also possible to edit points by right clicking on lines inthe report window. Click on the chart close to the point that has been created with the right mouse button.
The “Editing Point” dialog box appears with the definition of the nearest point. The “Editing Point” dialogbox is the same as the “Creating point” dialog box but with a different title. For the purposes of thistutorial, redefine the point to be 50% relative humidity, and 100 °F dry bulb temperature. When finishedclick on the “OK” button and note that the process has been redefined as shown on the following chart.
APC Tutorial / Examples
15
APC Tutorial / Examples
16
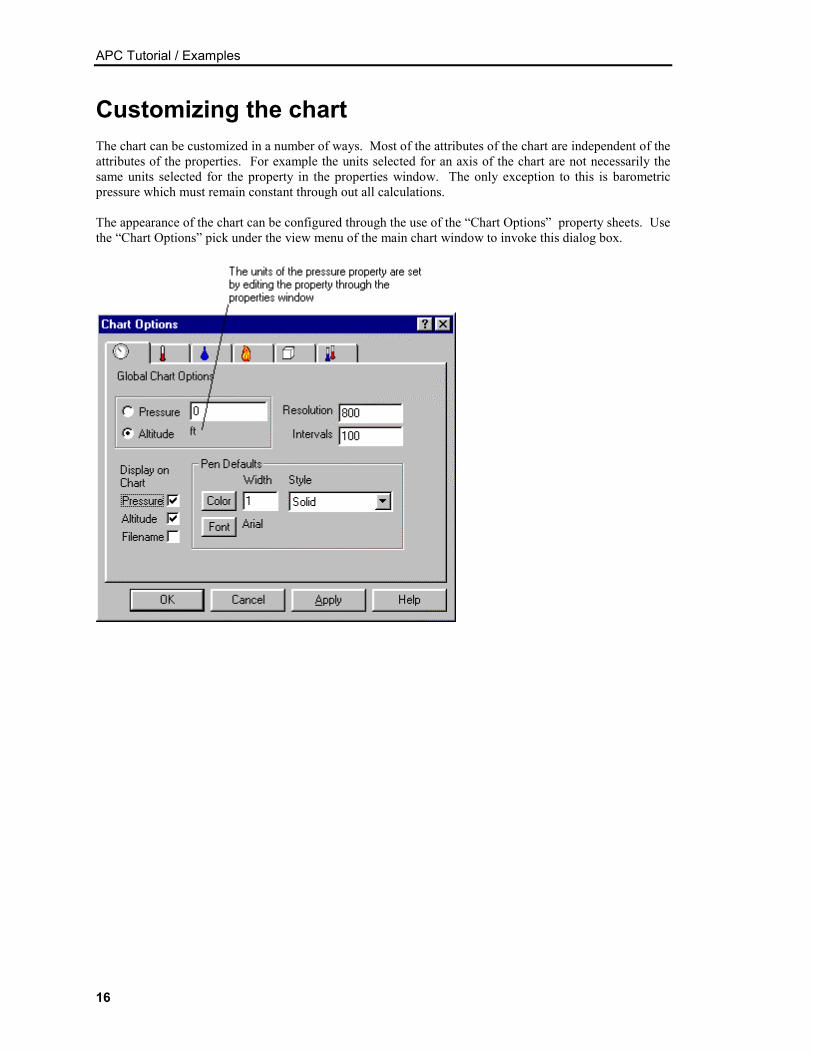
Customizing the chartThe chart can be customized in a number of ways. Most of the attributes of the chart are independent of theattributes of the properties. For example the units selected for an axis of the chart are not necessarily thesame units selected for the property in the properties window. The only exception to this is barometricpressure which must remain constant through out all calculations.
The appearance of the chart can be configured through the use of the “Chart Options” property sheets. Usethe “Chart Options” pick under the view menu of the main chart window to invoke this dialog box.
APC Tutorial / Examples
17
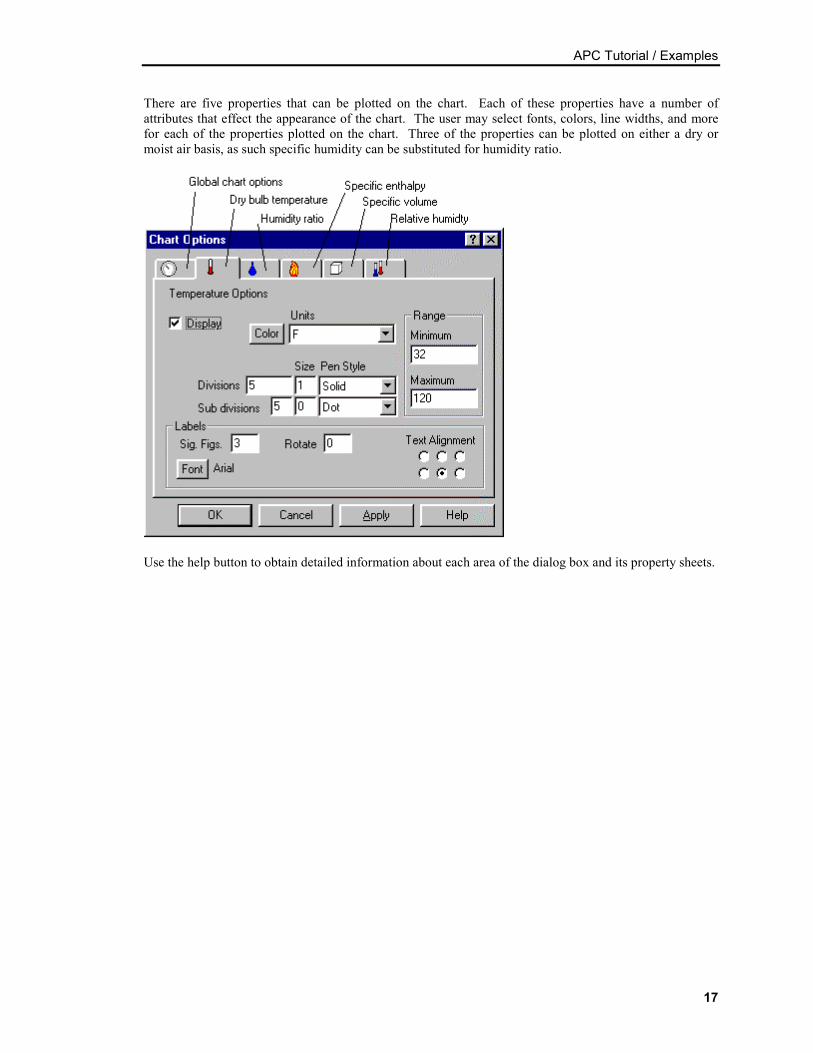
There are five properties that can be plotted on the chart. Each of these properties have a number ofattributes that effect the appearance of the chart. The user may select fonts, colors, line widths, and morefor each of the properties plotted on the chart. Three of the properties can be plotted on either a dry ormoist air basis, as such specific humidity can be substituted for humidity ratio.
Use the help button to obtain detailed information about each area of the dialog box and its property sheets.
APC Tutorial / Examples
18
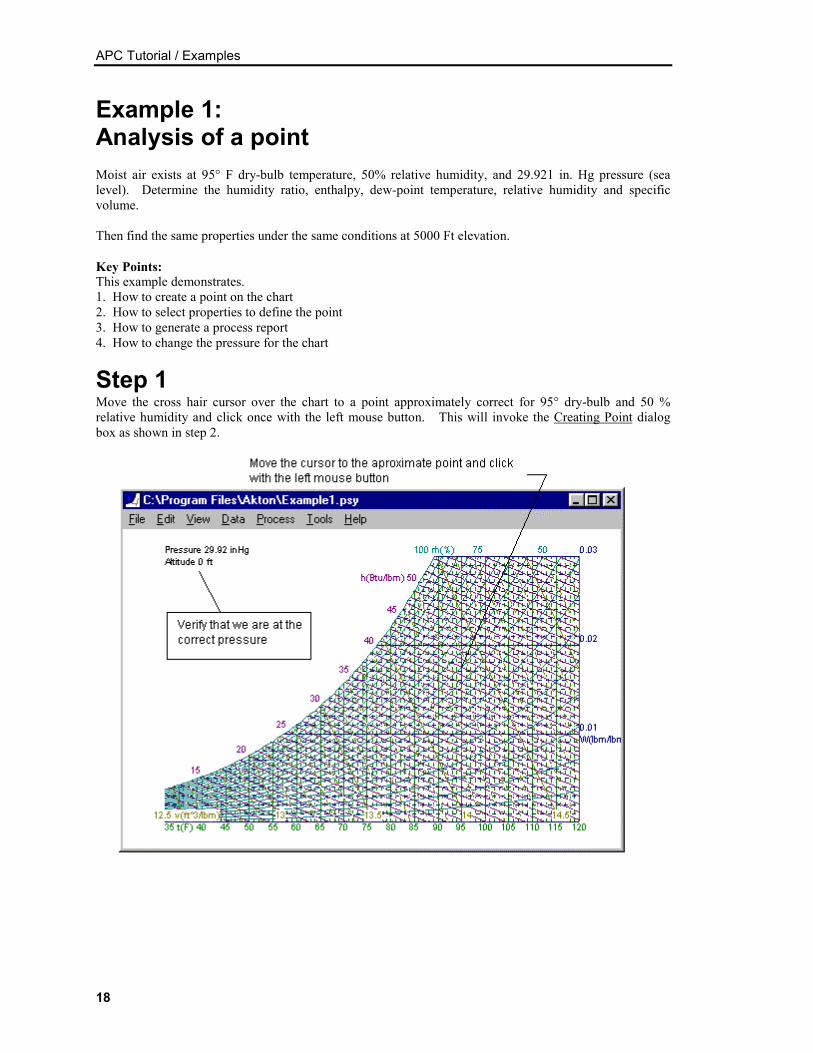
Example 1:Analysis of a pointMoist air exists at 95° F dry-bulb temperature, 50% relative humidity, and 29.921 in. Hg pressure (sealevel). Determine the humidity ratio, enthalpy, dew-point temperature, relative humidity and specificvolume.
Then find the same properties under the same conditions at 5000 Ft elevation.
Key Points:This example demonstrates.1. How to create a point on the chart2. How to select properties to define the point3. How to generate a process report4. How to change the pressure for the chart
Step 1Move the cross hair cursor over the chart to a point approximately correct for 95° dry-bulb and 50 %relative humidity and click once with the left mouse button. This will invoke the Creating Point dialogbox as shown in step 2.
APC Tutorial / Examples
19
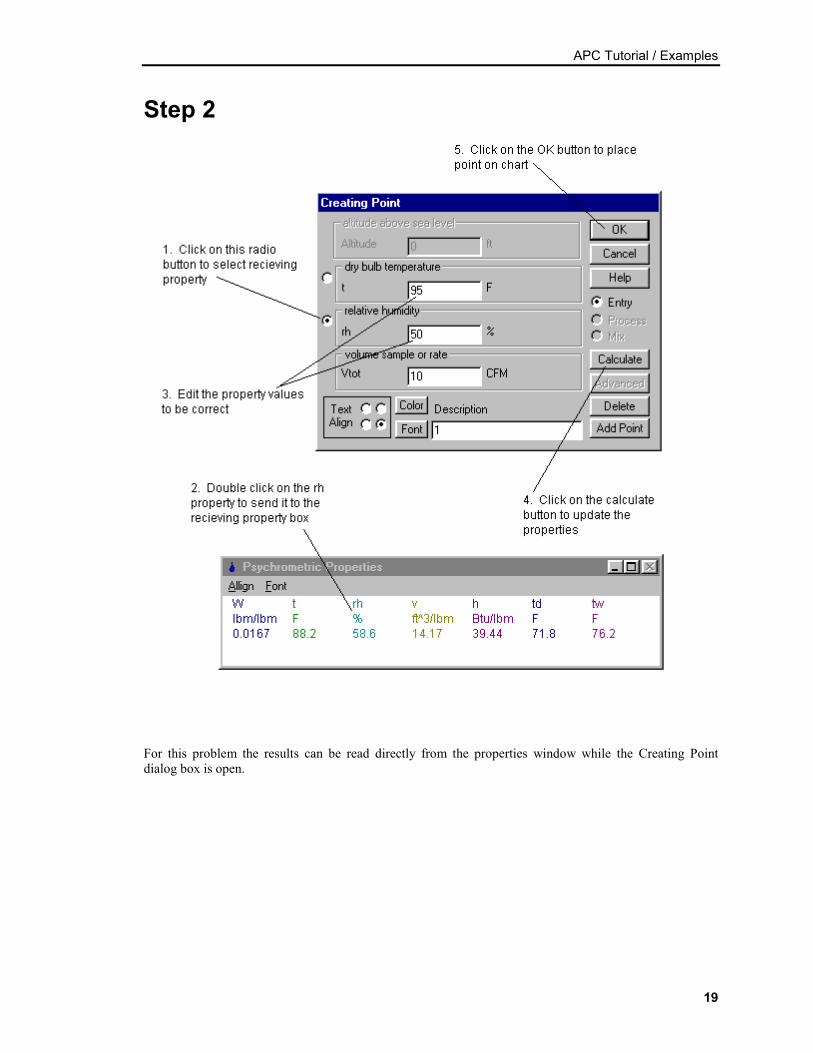
Step 2
For this problem the results can be read directly from the properties window while the Creating Pointdialog box is open.
APC Tutorial / Examples
20
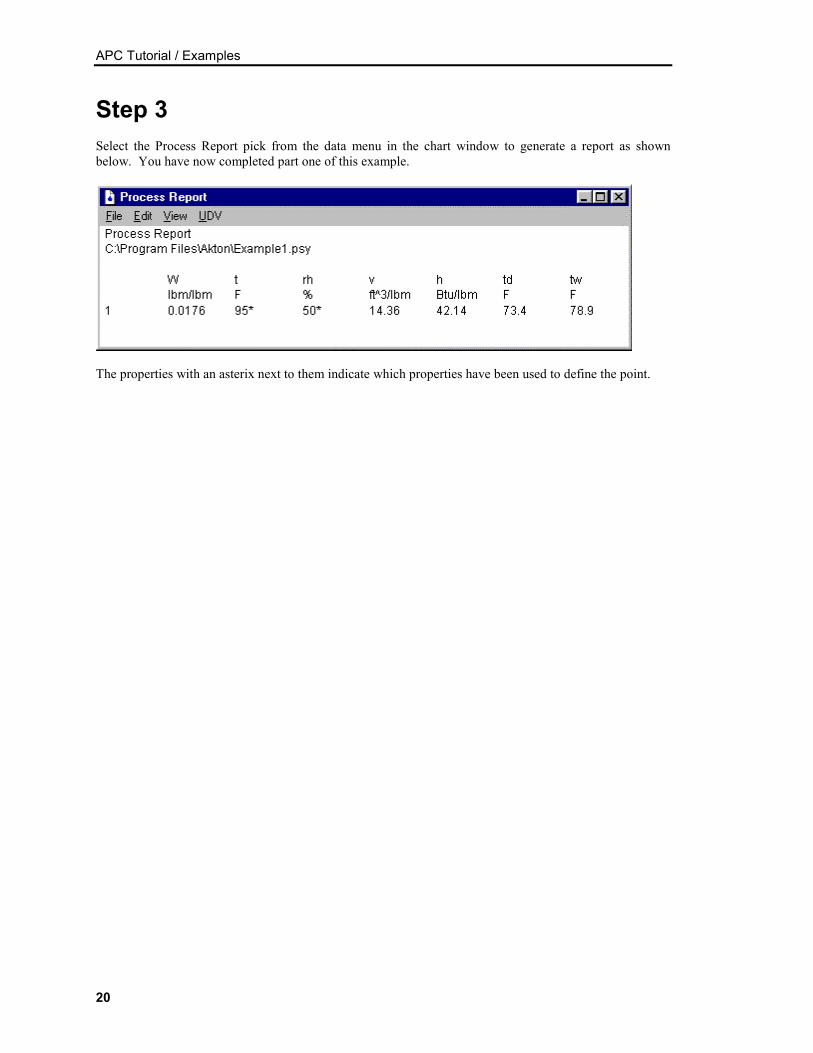
Step 3Select the Process Report pick from the data menu in the chart window to generate a report as shownbelow. You have now completed part one of this example.
The properties with an asterix next to them indicate which properties have been used to define the point.
APC Tutorial / Examples
21
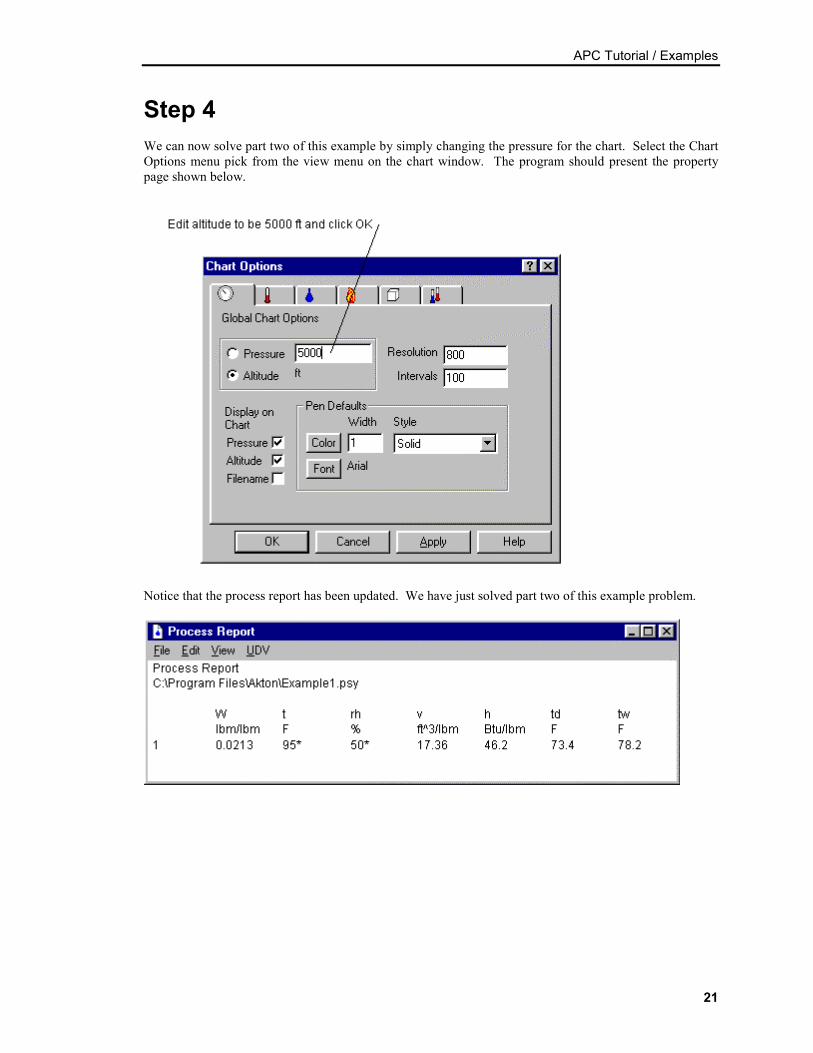
Step 4We can now solve part two of this example by simply changing the pressure for the chart. Select the ChartOptions menu pick from the view menu on the chart window. The program should present the propertypage shown below.
Notice that the process report has been updated. We have just solved part two of this example problem.
APC Tutorial / Examples
22
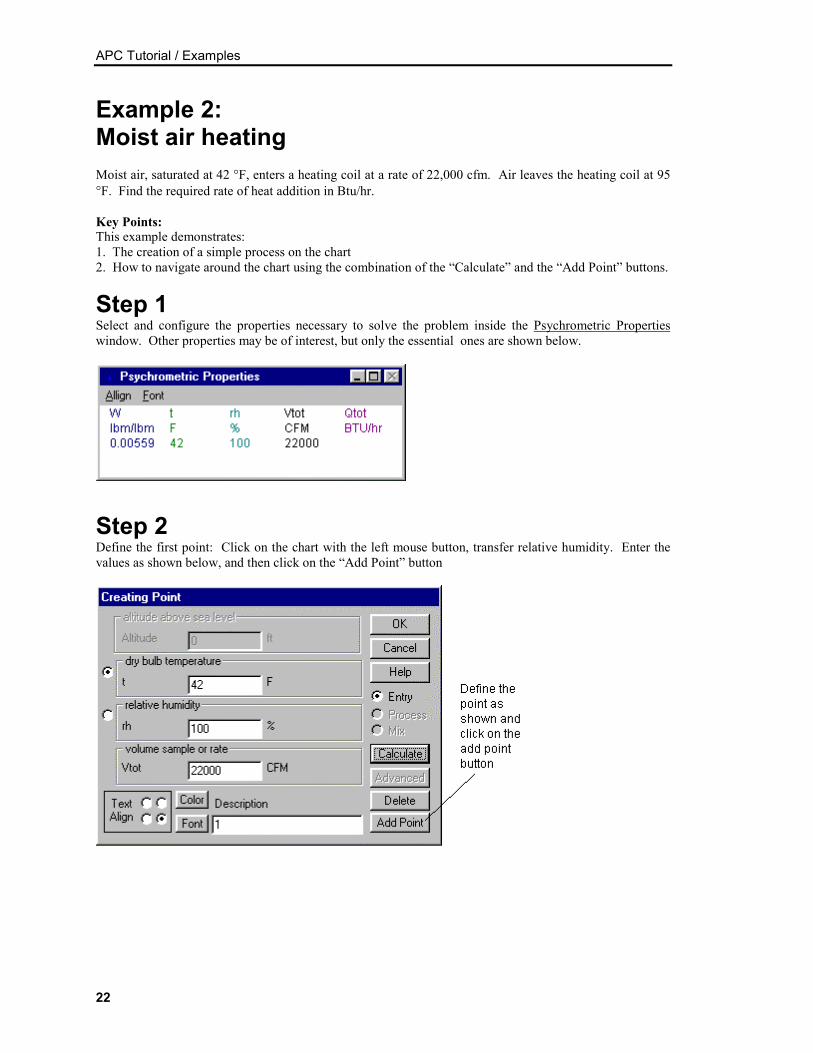
Example 2:Moist air heatingMoist air, saturated at 42 °F, enters a heating coil at a rate of 22,000 cfm. Air leaves the heating coil at 95°F. Find the required rate of heat addition in Btu/hr.
Key Points:This example demonstrates:1. The creation of a simple process on the chart2. How to navigate around the chart using the combination of the “Calculate” and the “Add Point” buttons.
Step 1Select and configure the properties necessary to solve the problem inside the Psychrometric Propertieswindow. Other properties may be of interest, but only the essential ones are shown below.
Step 2Define the first point: Click on the chart with the left mouse button, transfer relative humidity. Enter thevalues as shown below, and then click on the “Add Point” button
APC Tutorial / Examples
23
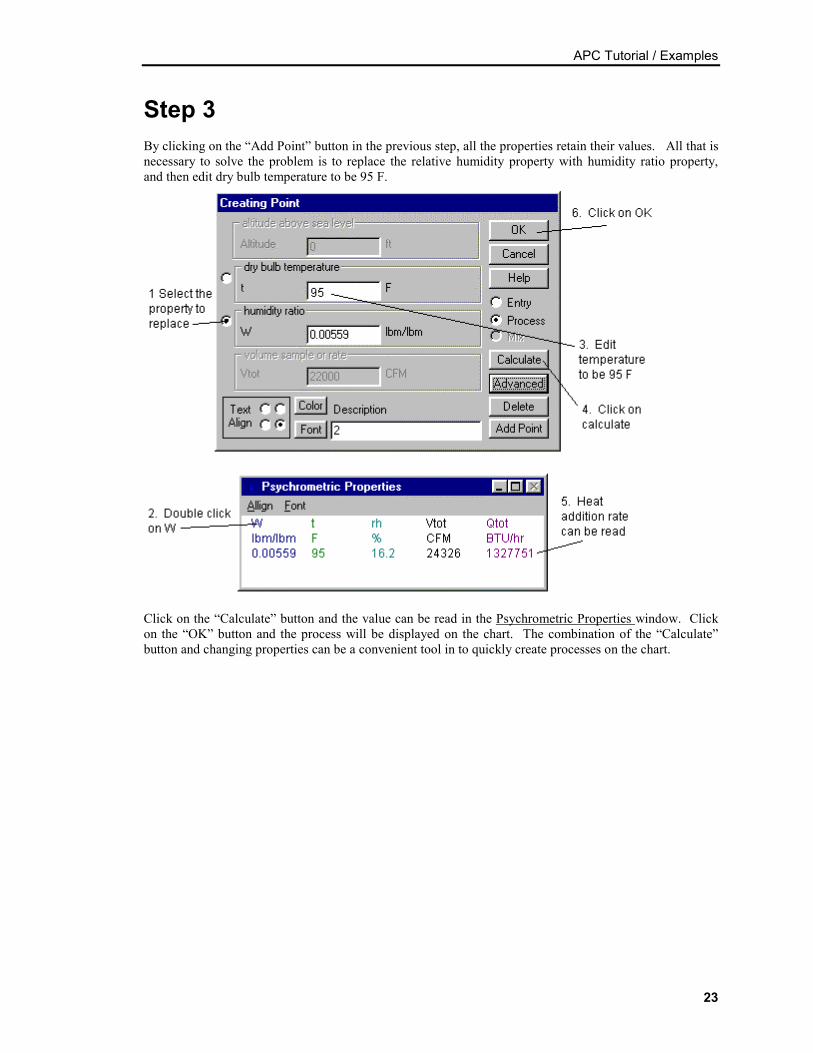
Step 3By clicking on the “Add Point” button in the previous step, all the properties retain their values. All that isnecessary to solve the problem is to replace the relative humidity property with humidity ratio property,and then edit dry bulb temperature to be 95 F.
Click on the “Calculate” button and the value can be read in the Psychrometric Properties window. Clickon the “OK” button and the process will be displayed on the chart. The combination of the “Calculate”button and changing properties can be a convenient tool in to quickly create processes on the chart.
APC Tutorial / Examples
24
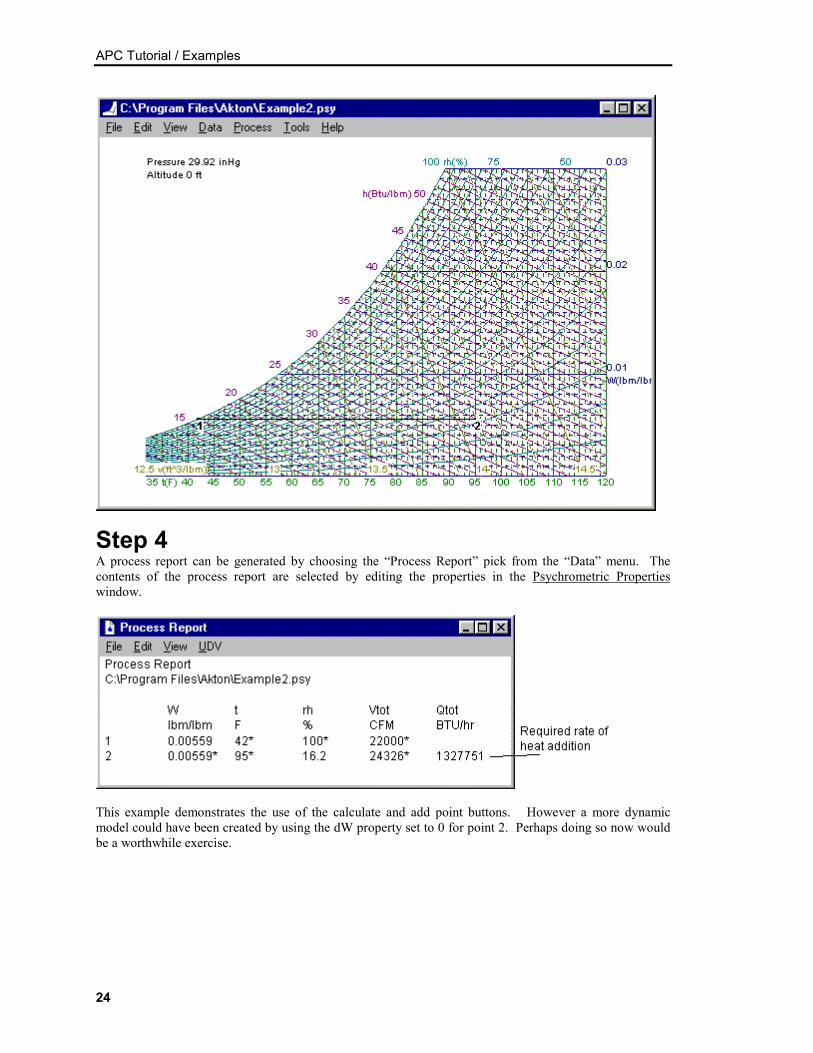
Step 4A process report can be generated by choosing the “Process Report” pick from the “Data” menu. Thecontents of the process report are selected by editing the properties in the Psychrometric Propertieswindow.
This example demonstrates the use of the calculate and add point buttons. However a more dynamicmodel could have been created by using the dW property set to 0 for point 2. Perhaps doing so now wouldbe a worthwhile exercise.
APC Tutorial / Examples
25
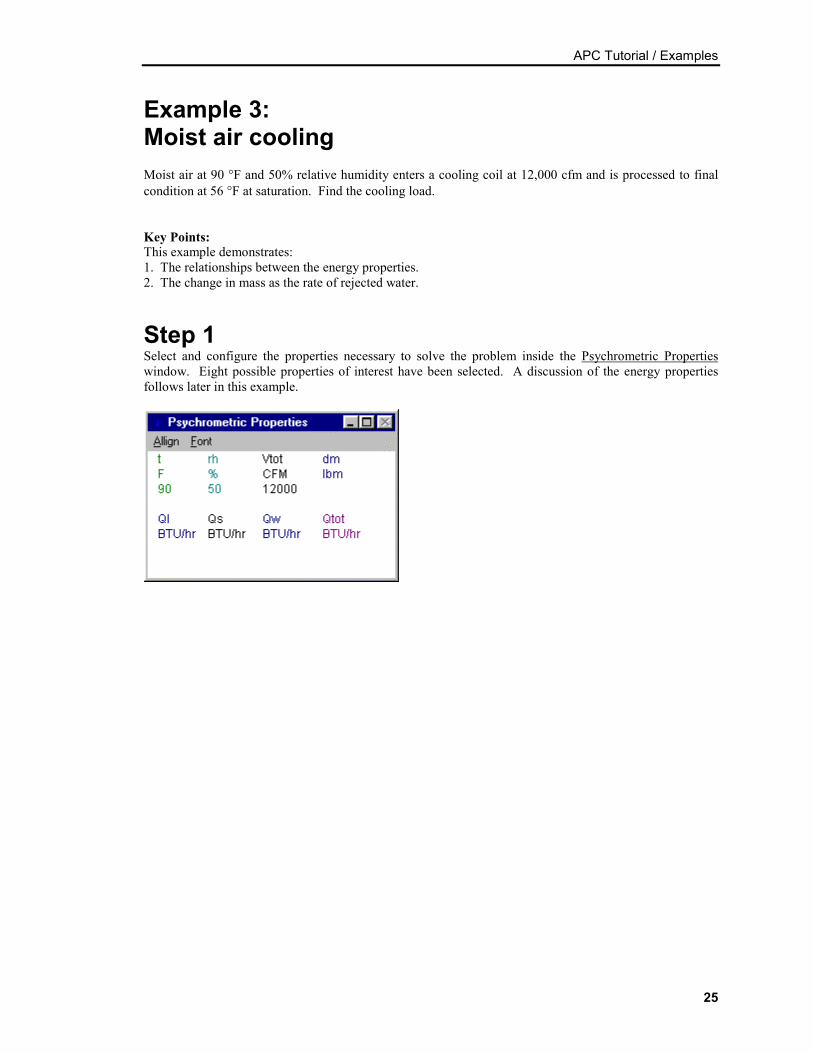
Example 3:Moist air coolingMoist air at 90 °F and 50% relative humidity enters a cooling coil at 12,000 cfm and is processed to finalcondition at 56 °F at saturation. Find the cooling load.
Key Points:This example demonstrates:1. The relationships between the energy properties.2. The change in mass as the rate of rejected water.
Step 1Select and configure the properties necessary to solve the problem inside the Psychrometric Propertieswindow. Eight possible properties of interest have been selected. A discussion of the energy propertiesfollows later in this example.

APC Tutorial / Examples
26
Step 2Define the first point: Click on the chart with the left mouse button, transfer relative humidity and volumerate to the Creating Point dialog box. Enter the values as shown below, and then click on the “OK” button
Step 3Define the second point: Click on the chart with the left mouse button. This time the relative humidity andvolume rate should already be selected in the Creating Point dialog box. Enter the values as shown below,and then click on the “Calculate” button.
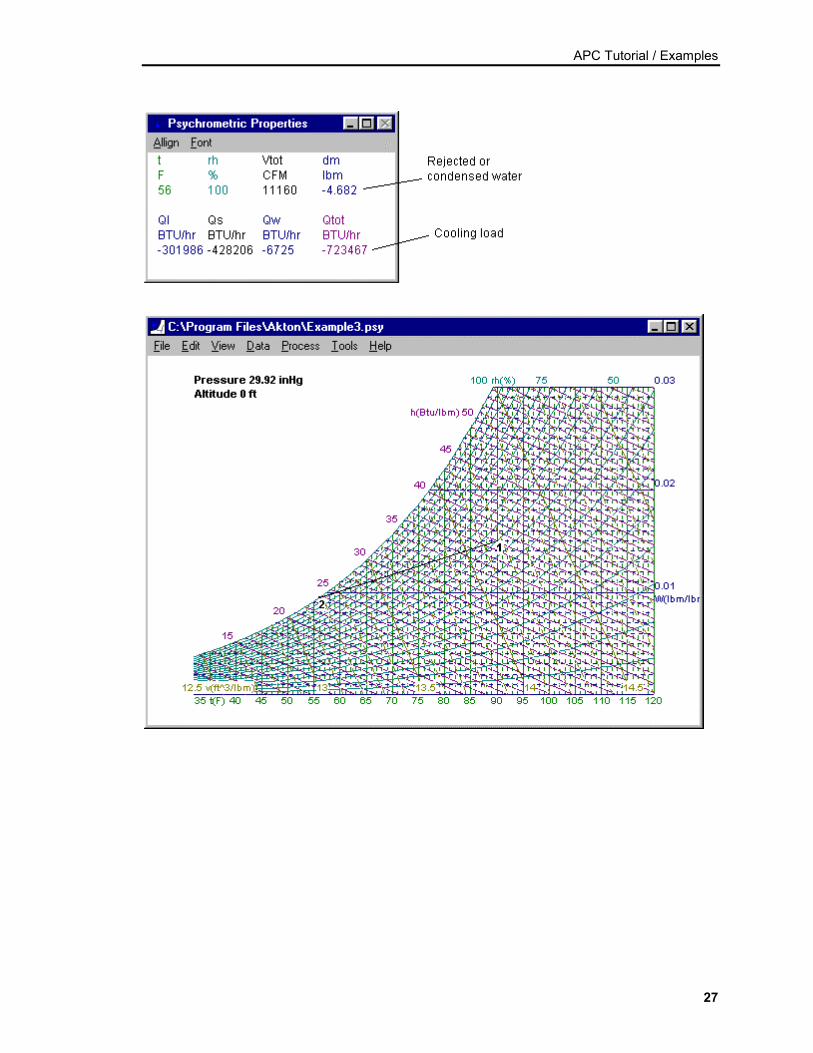
The answer can be read now in the Psychrometric Properties window. “Q” represents the total heat addedor removed. It is negative, indicating cooling. The change in total mass “dm” can be used to describe therejected water. Click on the “OK” button to have the process drawn on the chart.
APC Tutorial / Examples
27
APC Tutorial / Examples
28
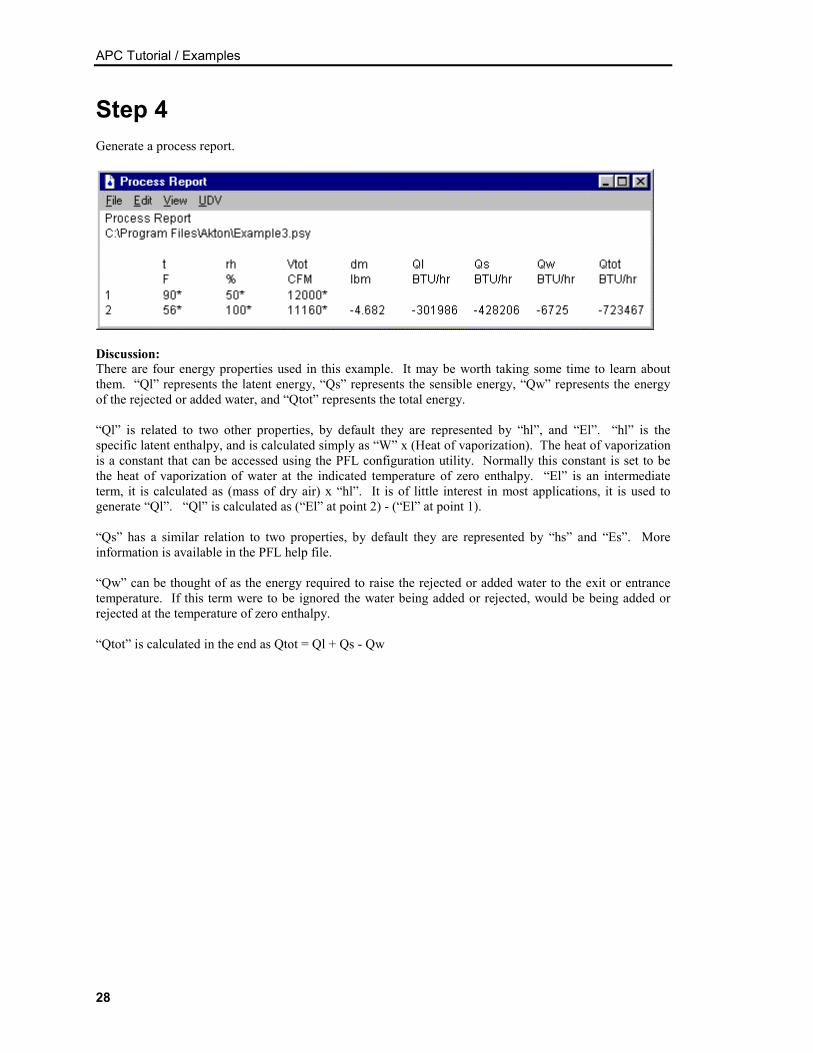
Step 4Generate a process report.
Discussion:There are four energy properties used in this example. It may be worth taking some time to learn aboutthem. “Ql” represents the latent energy, “Qs” represents the sensible energy, “Qw” represents the energyof the rejected or added water, and “Qtot” represents the total energy.
“Ql” is related to two other properties, by default they are represented by “hl”, and “El”. “hl” is thespecific latent enthalpy, and is calculated simply as “W” x (Heat of vaporization). The heat of vaporizationis a constant that can be accessed using the PFL configuration utility. Normally this constant is set to bethe heat of vaporization of water at the indicated temperature of zero enthalpy. “El” is an intermediateterm, it is calculated as (mass of dry air) x “hl”. It is of little interest in most applications, it is used togenerate “Ql”. “Ql” is calculated as (“El” at point 2) - (“El” at point 1).
“Qs” has a similar relation to two properties, by default they are represented by “hs” and “Es”. Moreinformation is available in the PFL help file.
“Qw” can be thought of as the energy required to raise the rejected or added water to the exit or entrancetemperature. If this term were to be ignored the water being added or rejected, would be being added orrejected at the temperature of zero enthalpy.
“Qtot” is calculated in the end as Qtot = Ql + Qs - Qw
APC Tutorial / Examples
29
Example 4:Adiabatic mixing of moist air streamsA 8000 cfm stream of moist outside air at 44 °F dry-bulb temperature and 36 °F thermodynamic wet-bulbtemperature is adiabatically mixed with 18,000 cfm of recirculated air at 78 °F dry-bulb temperature and50% relative humidity. Find the dry-bulb temperature and the thermodynamic wet-bulb temperature of theresulting mixture.
Key Points:This example demonstrates:1. How to create mix points and mix streams
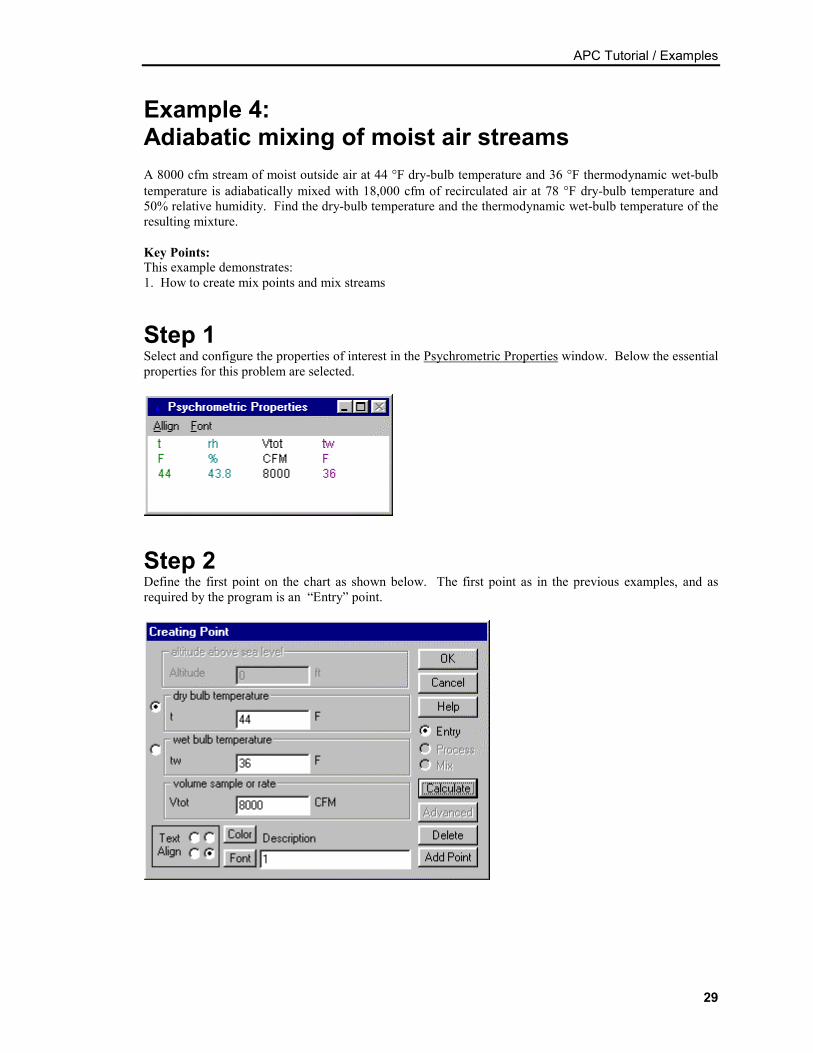
Step 1Select and configure the properties of interest in the Psychrometric Properties window. Below the essentialproperties for this problem are selected.
Step 2Define the first point on the chart as shown below. The first point as in the previous examples, and asrequired by the program is an “Entry” point.
APC Tutorial / Examples
30
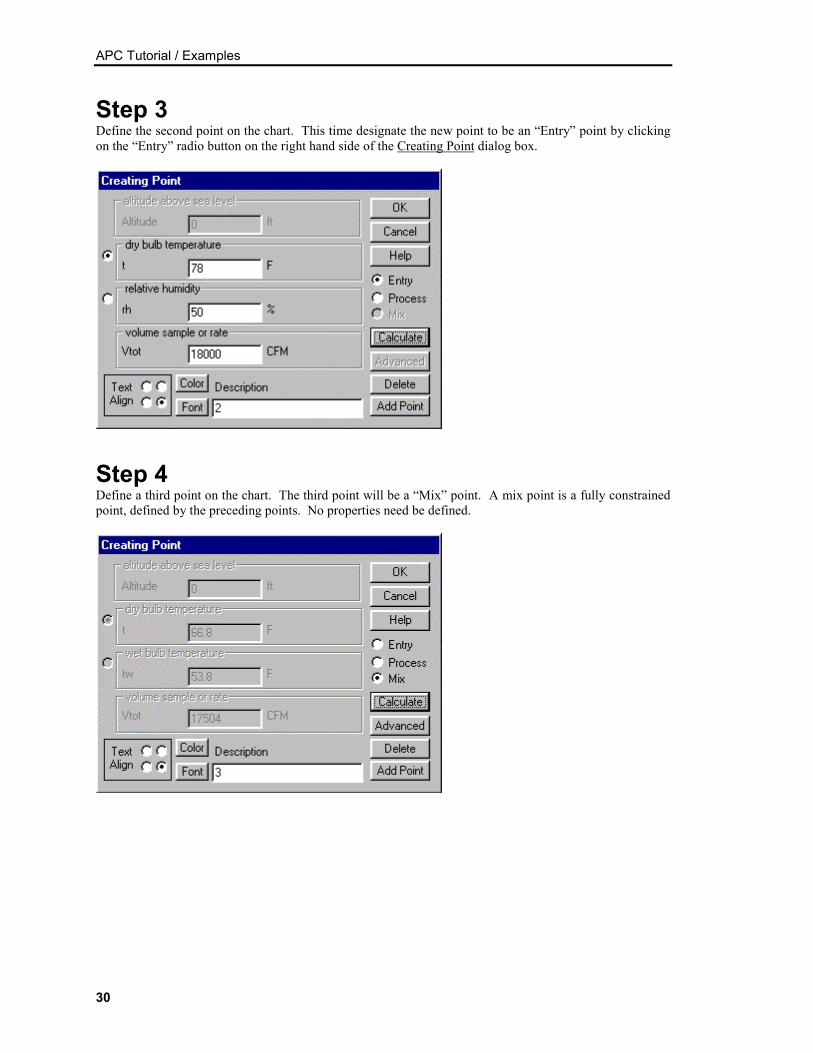
Step 3Define the second point on the chart. This time designate the new point to be an “Entry” point by clickingon the “Entry” radio button on the right hand side of the Creating Point dialog box.
Step 4Define a third point on the chart. The third point will be a “Mix” point. A mix point is a fully constrainedpoint, defined by the preceding points. No properties need be defined.
APC Tutorial / Examples
31
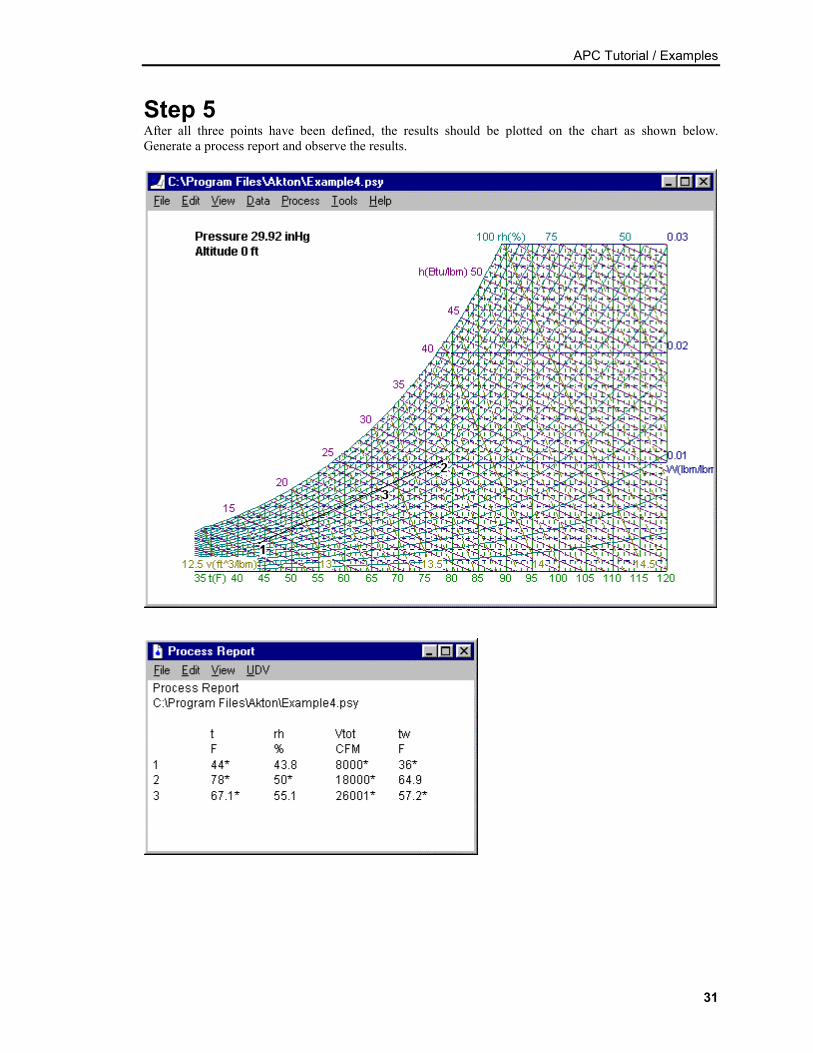
Step 5After all three points have been defined, the results should be plotted on the chart as shown below.Generate a process report and observe the results.
APC Tutorial / Examples
32
Example 5:Adiabatic mixing of water injected into airMoist air at 72 °F dry-bulb temperature and 50 °F thermodynamic wet-bulb temperature. is to be processedto a final dew point temperature of 55 °F by adiabatic injection of saturated steam. at 230 °F. The rate ofmoist air flow is 250 lbm/min. Find the dry-bulb temperature of the moist air and the rate of steam flowrequired.
Key Points:This example demonstrates1. Injection of saturated steam into moist air
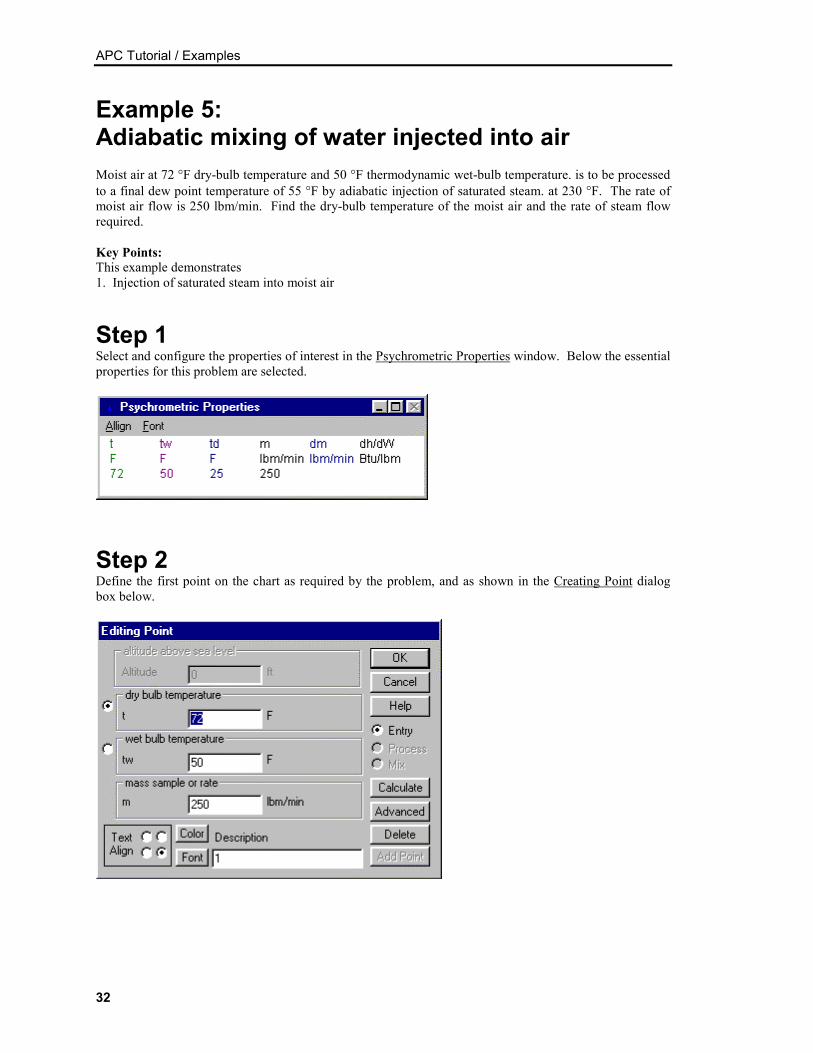
Step 1Select and configure the properties of interest in the Psychrometric Properties window. Below the essentialproperties for this problem are selected.
Step 2Define the first point on the chart as required by the problem, and as shown in the Creating Point dialogbox below.
APC Tutorial / Examples
33
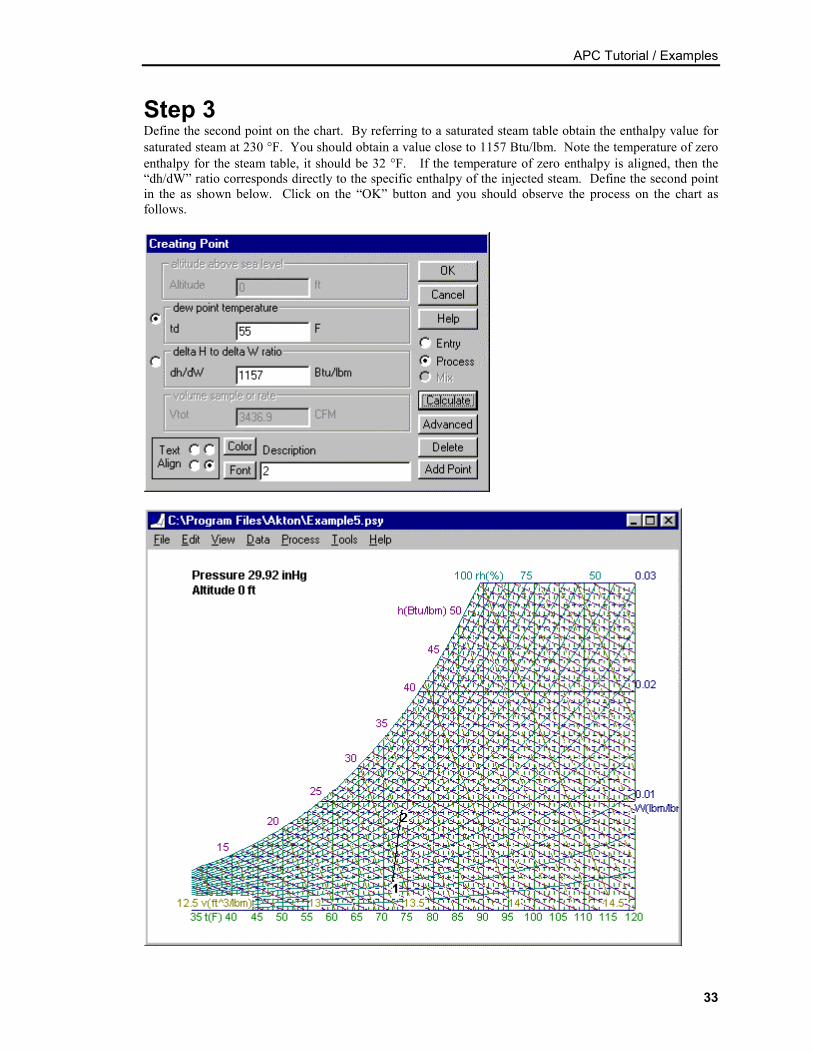
Step 3Define the second point on the chart. By referring to a saturated steam table obtain the enthalpy value forsaturated steam at 230 °F. You should obtain a value close to 1157 Btu/lbm. Note the temperature of zeroenthalpy for the steam table, it should be 32 °F. If the temperature of zero enthalpy is aligned, then the“dh/dW” ratio corresponds directly to the specific enthalpy of the injected steam. Define the second pointin the as shown below. Click on the “OK” button and you should observe the process on the chart asfollows.
APC Tutorial / Examples
34
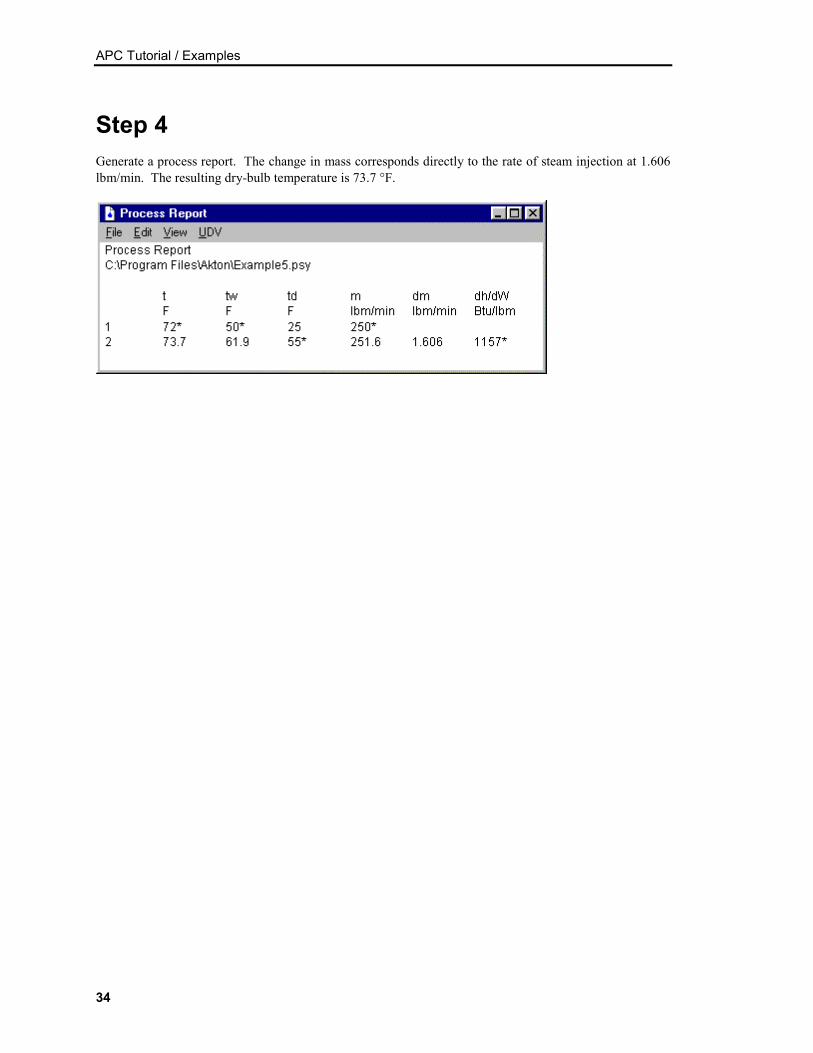
Step 4Generate a process report. The change in mass corresponds directly to the rate of steam injection at 1.606lbm/min. The resulting dry-bulb temperature is 73.7 °F.
APC Tutorial / Examples
35
Example 6:Air conditioning a spaceMoist air is with drawn from a room at 82 °F dry-bulb temperature and 65 °F thermodynamic wet-bulbtemperature. The sensible rate of heat gain for the space is 28,000 Btu/hr. A rate of moisture gain of 8lbm/hr occurs from the space occupants. This moisture is assumed as saturated water vapor at 88 °F. Moistair is introduced into the room at a dry-bulb temperature of 58 °F. Find the thermodynamic wet-bulbtemperature and volume flow rate of the supply air.
Key PointsThis example demonstrates1. Using the calculate button to find a solution by trial and error.
For the sake of demonstrating program capabilities we are going to solve this problem by trial and error.We will solve the problem backwards so to speak, defining the exit conditions before the entry conditions.In solving the problem this way we are neglecting any difference in the enthalpy of saturated water vaporbetween 58 °F and 88 °F (1086 vs. 1099 Btu/lbm). This is because the program assumes that water isalways added as vapor at entry conditions and removed as vapor at exit conditions, for any given processon the chart.
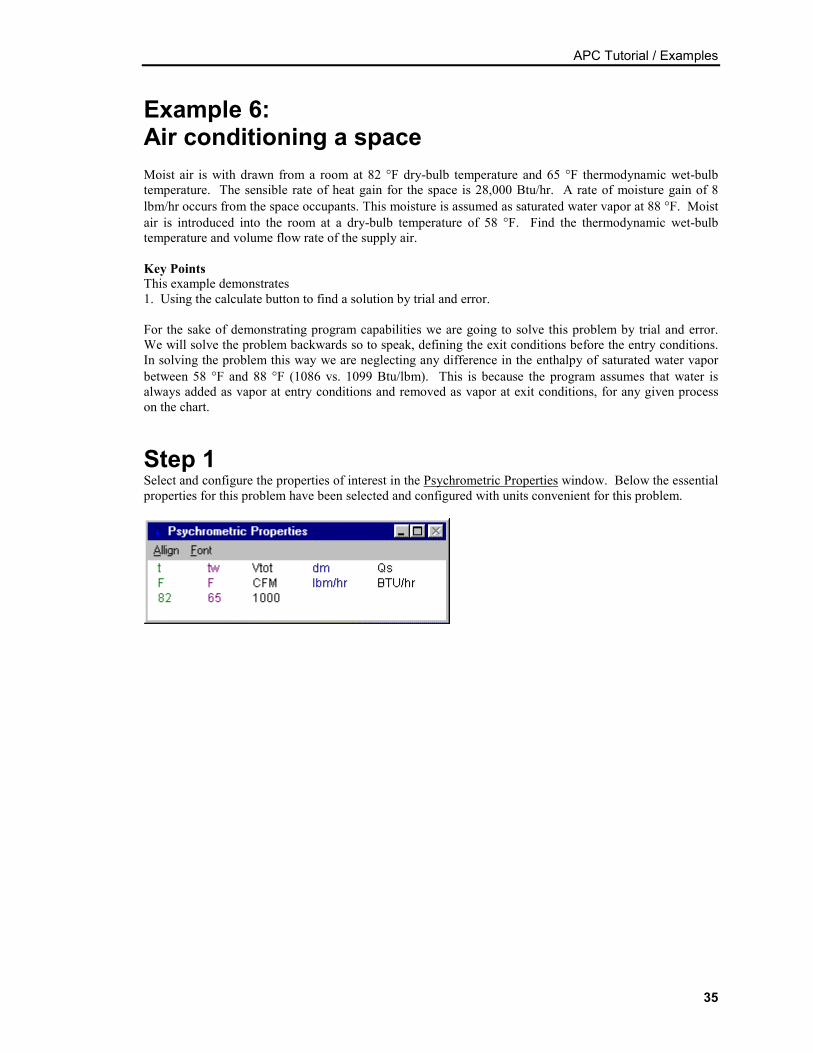
Step 1Select and configure the properties of interest in the Psychrometric Properties window. Below the essentialproperties for this problem have been selected and configured with units convenient for this problem.
APC Tutorial / Examples
36
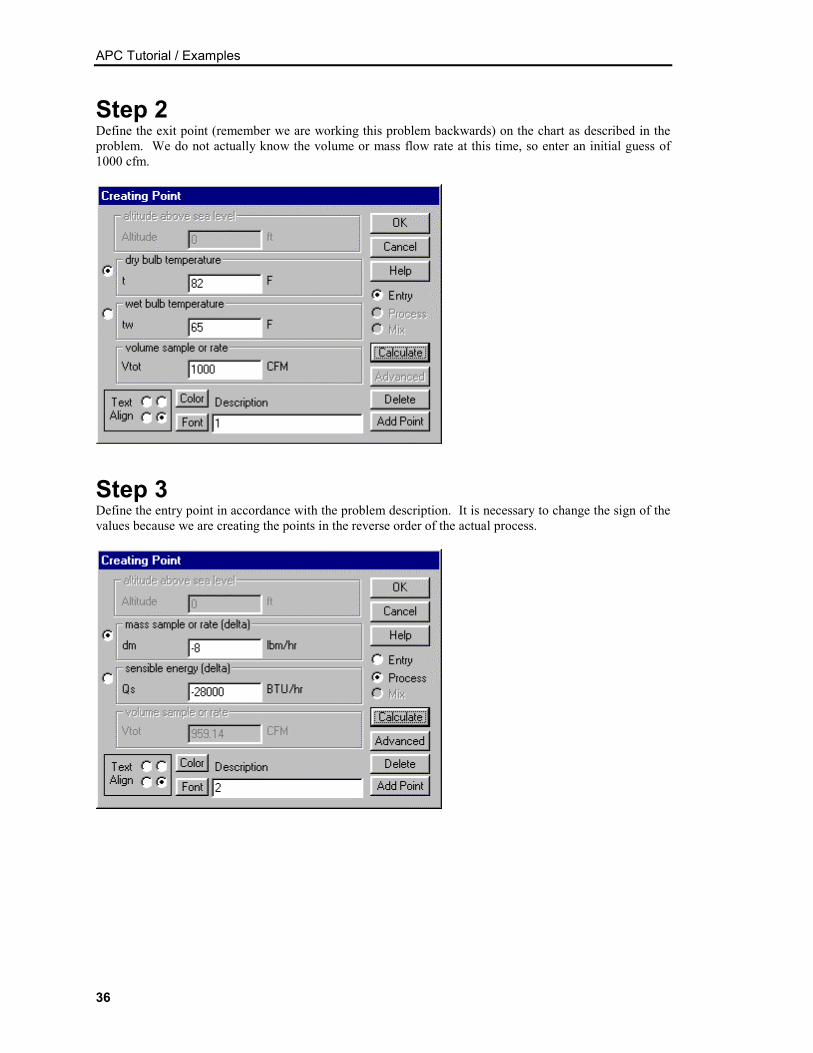
Step 2Define the exit point (remember we are working this problem backwards) on the chart as described in theproblem. We do not actually know the volume or mass flow rate at this time, so enter an initial guess of1000 cfm.
Step 3Define the entry point in accordance with the problem description. It is necessary to change the sign of thevalues because we are creating the points in the reverse order of the actual process.
APC Tutorial / Examples
37
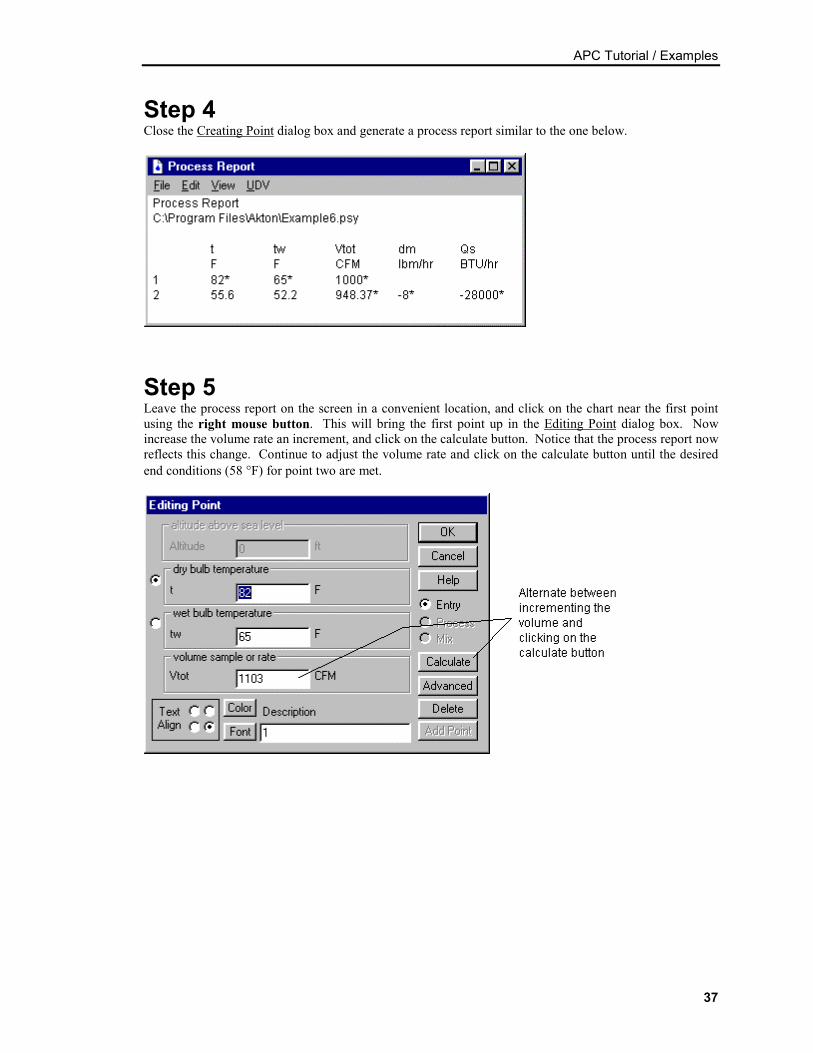
Step 4Close the Creating Point dialog box and generate a process report similar to the one below.
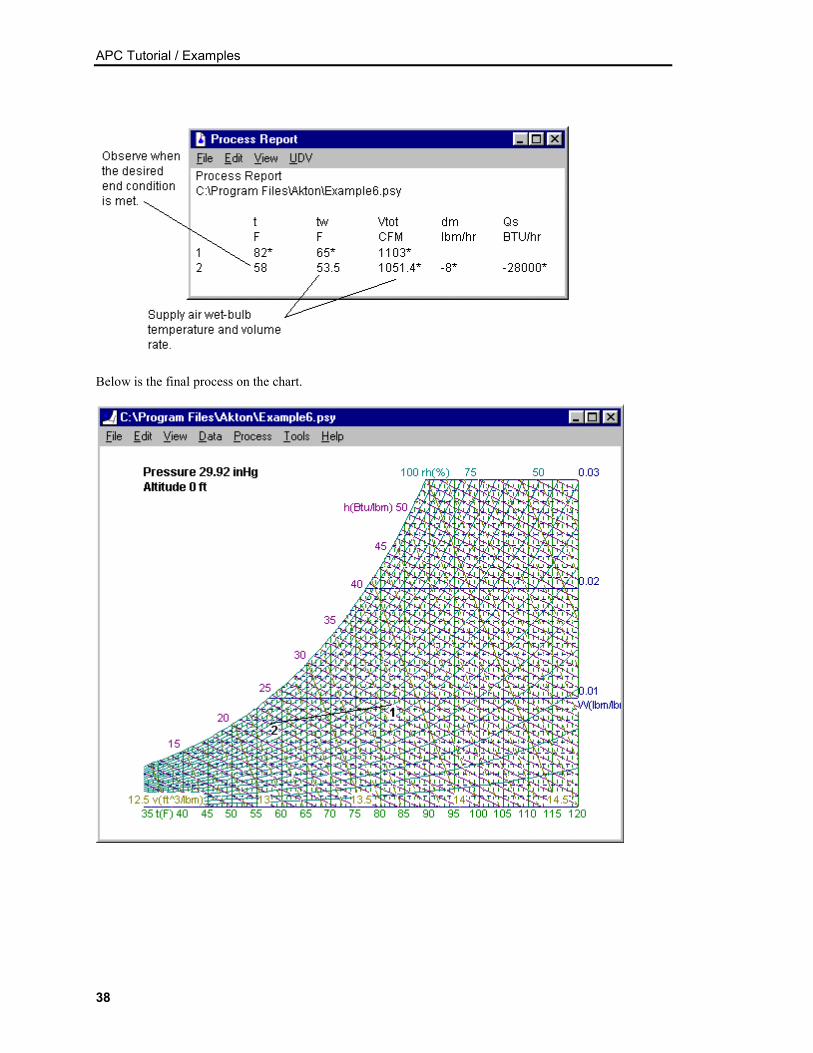
Step 5Leave the process report on the screen in a convenient location, and click on the chart near the first pointusing the right mouse button. This will bring the first point up in the Editing Point dialog box. Nowincrease the volume rate an increment, and click on the calculate button. Notice that the process report nowreflects this change. Continue to adjust the volume rate and click on the calculate button until the desiredend conditions (58 °F) for point two are met.
APC Tutorial / Examples
38
Below is the final process on the chart.