Embed Size (px)
Citation preview

The University of AkronCollege of Engineering
302 E Buchtel AveAkron, OH 44325
NASA Student Launch InitiativeNovember 3, 2017
A K R O NA U T SR o c k e t D e s i g n Te a m
P r e l i m i n a r y D e s i g n R e v i e w
P r o j e c t LAZARUS

2
TABLE OF CONTENTS
Section I. Summary of PDR Report .................................................................................... 8
1.1. Team Summary ...................................................................................................................8
1.1.1. Team Name and Mailing Address ........................................................................................................ 8
1.1.2. Mentor................................................................................................................................................. 8
1.1.3. Team Contacts ..................................................................................................................................... 8
1.1.4. Educational Advisors ........................................................................................................................... 8
1.2. Launch Vehicle Summary .....................................................................................................9
1.2.1. Size and Mass ...................................................................................................................................... 9
1.2.2. Motor Choice ....................................................................................................................................... 9
1.2.3. Recovery System ................................................................................................................................. 9
1.3. Payload Summary ...............................................................................................................9
1.4. Milestone Review Flysheet ................................................................................................ 10
Section II. Changes Made Since Proposal ......................................................................... 12
2.1. Vehicle Criteria Changes .................................................................................................... 12
2.2. Recovery Criteria Changes ................................................................................................. 12
Section III. Vehicle Criteria ................................................................................................ 13
3.1. Mission Statement ............................................................................................................ 13
3.2. Alternative Vehicle Designs ............................................................................................... 14
3.2.1. Nose Cone ......................................................................................................................................... 15
3.2.1.1. Nose Cone Materials ..................................................................................................................... 15
3.2.1.2. Nose Cone Designs ........................................................................................................................ 16
3.2.1.2.1. Von Karman Design ................................................................................................................ 17
3.2.1.2.2. LV-HAACK Design .................................................................................................................... 18
3.2.1.2.3. X1/2 Design ............................................................................................................................... 19
3.2.1.2.4. Parabolic Design ..................................................................................................................... 19
3.2.2. Fins .................................................................................................................................................... 20
3.2.2.1. Fin Materials ................................................................................................................................. 20
3.2.2.2. Fin Designs .................................................................................................................................... 21
3.2.2.2.1. Delta Design ............................................................................................................................ 22
3.2.2.2.2. Clipped Delta Design ............................................................................................................... 23
3.2.2.2.3. Trapezoidal Design .................................................................................................................. 23
3.2.2.2.4. Tapered Swept Design ............................................................................................................ 24
3.2.2.3. Fin Flutter Calculations ................................................................................................................. 24
3.2.2.4. Fin Attachment ............................................................................................................................. 26
3.2.3. Body Tubes and Couplers Materials .................................................................................................. 28
3.2.4. Bulkheads, Centering Rings and Thrust Plate Materials .................................................................... 29
3.2.5. Motor Mounting & Retention Materials ........................................................................................... 31

3
3.2.6. Stability Ballast .................................................................................................................................. 33
3.2.7. Airbrakes ........................................................................................................................................... 34
3.3. Final Vehicle Design........................................................................................................... 35
3.4. Motor Alternatives ............................................................................................................ 36
Section IV. Recovery Subsystem ........................................................................................ 39
4.1. Recovery System Overview ................................................................................................ 39
4.2. Alternative Recovery Designs ............................................................................................ 40
4.2.1. Recovery System Selection ................................................................................................................ 40
4.2.2. Canopy Material Selection ................................................................................................................ 43
4.2.3. Canopy Shape Selection .................................................................................................................... 44
4.2.4. Rope Material Selection .................................................................................................................... 45
4.2.1. Recovery Ejection Selection .............................................................................................................. 46
4.3. Preliminary Parachute Sizing Calculations .......................................................................... 48
4.4. Current Recovery Design ................................................................................................... 51
4.5. Redundancy Within the Recovery System .......................................................................... 52
Section V. Mission Performance Predictions ..................................................................... 53
5.1. Estimated Mass ................................................................................................................. 54
5.2. Stability Margin ................................................................................................................. 57
5.3. Flight Profile...................................................................................................................... 62
5.4. Thrust to Weight Ratio ...................................................................................................... 62
5.5. Flight Profile Performance ................................................................................................. 70
5.6. Kinetic Energy Calculations ................................................................................................ 71
5.7. Drift Calculations ............................................................................................................... 72
Section VI. Safety ............................................................................................................. 80
6.1. Impact of Risks and Delays ................................................................................................ 80
6.2. Preliminary Assembly Checklist and Launch Procedure ....................................................... 80
6.3. Preliminary Hazard Analysis .............................................................................................. 82
6.3.1. Personal Hazard Analysis ................................................................................................................... 82
6.3.2. Failure Mode & Effect Analysis (FMEA) ............................................................................................. 84
6.4. Environmental Concerns .................................................................................................... 86
6.4.1. Littering ............................................................................................................................................. 87
6.4.2. Pollution ............................................................................................................................................ 87
6.4.3. Physical Harm .................................................................................................................................... 87
6.5. Defined Risks .................................................................................................................... 87

4
6.5.1. Project Risks ...................................................................................................................................... 87
6.5.1.1. Mitigating Time Risks .................................................................................................................... 88
6.5.1.2. Mitigating Resource Based Risks ................................................................................................... 88
6.5.1.3. Mitigating Budget Risks ................................................................................................................. 88
6.5.1.4. Mitigating Scope Risks .................................................................................................................. 88
6.5.2. Launch Vehicle Risks .......................................................................................................................... 89
6.5.2.1. Motor Failure ................................................................................................................................ 89
6.5.2.2. Launch Failure ............................................................................................................................... 89
6.5.2.3. Recovery System Failure ............................................................................................................... 89
6.5.2.4. Fabrication/Assembly Risks........................................................................................................... 89
Section VII. Payload Criteria ........................................................................................... 90
7.1. Rover Payload Objective .................................................................................................... 90
7.2. Alternative Payload Designs .............................................................................................. 92
7.2.1. 4 Wheeled Design, IR Navigation, Spring Load Solar Deployment .................................................... 92
7.2.2. 3 Wheeled Design, Sonar Navigation, Linkage Solar Deployment .................................................... 93
7.2.3. Hamster Ball Design, IR Navigation, Spring Load Solar Deployment ................................................. 94
7.2.4. Tread Tank Design, Bump Sensor, Shrug ........................................................................................... 95
7.3. Primary Designs ................................................................................................................ 96
7.3.1. Failure Modes .................................................................................................................................... 97
7.3.2. Electronics Overview ......................................................................................................................... 98
7.4. Schematics, Drawings and Figures ..................................................................................... 99
7.5. Design Matrix .................................................................................................................. 110
7.5.1. Payload Ejection System Overview ................................................................................................. 110
Section VIII. 6. Project Plan ........................................................................................... 111
8.1. 6.1. Requirements Compliance ........................................................................................ 111
8.1.1. Vehicle Verification Plan .................................................................................................................. 111
8.1.2. Team Derived Vehicle Design Verification Plan............................................................................... 115
8.1.3. Recovery Verification Plan............................................................................................................... 116
8.1.4. Team Derived Recovery Verification Plan ....................................................................................... 119
8.1.5. Payload Verification Plan ................................................................................................................. 120
8.1.6. Team Derived Payload Verification Plan ......................................................................................... 121
8.2. Budget and Timeline ....................................................................................................... 122
8.2.1. Structure Budget ............................................................................................................................. 122
8.2.2. Subscale Rocket Budget .................................................................................................................. 123
8.2.3. Payload Budget ................................................................................................................................ 124
8.2.4. Recovery Budget.............................................................................................................................. 125
8.2.5. Travel Budget .................................................................................................................................. 125
8.2.6. Funding Plan .................................................................................................................................... 126
8.2.1. Total Budget .................................................................................................................................... 128
8.3. Timeline .......................................................................................................................... 129

5
8.3.1. Project Outline of Safety ................................................................................................................. 137
8.3.2. Project Outline of Aerostructure ..................................................................................................... 138
8.3.3. Project Outline of Recovery............................................................................................................. 139
8.3.4. Project Outline of Payload ............................................................................................................... 140
8.3.5. Project Outline of Propulsion .......................................................................................................... 140
8.3.6. Project Outline of Electronics .......................................................................................................... 141
8.3.7. Project Outline of K12-Outreach ..................................................................................................... 142

6
List OF Figures Figure 1 – Cesaroni L1350 motor thrust curve (source: Cesaroni Technology) .............................................................. 9
Figure 2 - Von Karman nose cone rendered using SolidWorks .................................................................................... 17
Figure 3 - Von Karman nose cone drawing (all dimensions are in inches) ................................................................... 17
Figure 4 – Transparent rendering of the preliminary nose cone tip using SolidWorks ................................................ 18
Figure 5 – LV-HAACK nose cone rendered using SolidWorks ....................................................................................... 18
Figure 6 - LV-HAACK nose cone drawing (all dimensions are in inches) ...................................................................... 18
Figure 7 – X1/2 nose cone rendered using SolidWorks .................................................................................................. 19
Figure 8 - X1/2 nose cone drawing (all dimensions are in inches) ................................................................................. 19
Figure 9 - Parabolic nose cone drawing (all dimensions are in inches) ........................................................................ 19
Figure 10 - Delta fin drawing (all dimensions shown are in inches)............................................................................. 22
Figure 11 - Clipped Delta fin drawing (all dimensions shown are in inches) ................................................................ 23
Figure 12 - Trapezoidal fin drawing (all dimensions shown are in inches) .................................................................. 23
Figure 13 - Tapered Swept fin drawing (all dimensions shown are in inches) ............................................................. 24
Figure 14 - Fin canister drawing (all dimensions shown are in inches) ........................................................................ 26
Figure 15 - Fin canister rendered photo using SolidWorks .......................................................................................... 27
Figure 16 - Threaded rod motor mounting method rendered photo ........................................................................... 31
Figure 17 - Thrust plate stress analysis constrained with hardware fasteners ............................................................ 32
Figure 18 - Thrust plate analysis constrained with epoxy ............................................................................................ 33
Figure 19 - Stability ballast rendered photo using SolidWorks .................................................................................... 34
Figure 20 – Airbrakes retracted (left) and extended (right) rendered photos using SolidWorks ................................. 34
Figure 21 - Cesaroni L1350 motor thrust curve (source: Cesaroni Technology) ........................................................... 36
Figure 22 – Aerotech L1420 motor thrust curve (source: Aerotech) ............................................................................ 38
Figure 23 - Drogue and Main Parachute deployed and attached to upper and lower bulkheads. .............................. 39
Figure 24 - The drogue parachute ............................................................................................................................... 40
Figure 25 - The main parachute. .................................................................................................................................. 40
Figure 26 – Parachute assembly fully deployed with rope lengths. ............................................................................. 51
Figure 27 - Drogue parachute with shroud line dimensions. ....................................................................................... 51
Figure 28 - Main Parachute with shroud line dimensions ............................................................................................ 51
Figure 29 – Image of a Missile Works RRC3 Altimeter ................................................................................................. 52
Figure 30 – Wiring Diagram for 1 altimeter ................................................................................................................ 52
Figure 31 – Full OpenRocket Model ............................................................................................................................. 53
Figure 32 – Full RASAero Model ................................................................................................................................... 53
Figure 33 – RASAero CG and CP Graph ........................................................................................................................ 57
Figure 34 – OpenRocket CG and CP Graph .................................................................................................................. 57
Figure 35 – OpenRocket Stability Versus Time Graph .................................................................................................. 61
Figure 36 – RASAero Stability Versus Time Graph ....................................................................................................... 61
Figure 37 – OpernRocket Thrust Versus Time Graph ................................................................................................... 63
Figure 38 – RASAero Thrust Versus Time Graph .......................................................................................................... 63
Figure 39 – OpenRocket Vertical Velocity Versus Time Graph ..................................................................................... 65
Figure 40 – RASAero Vertical Velocity Versus Time Graph .......................................................................................... 65
Figure 41 – OpenRocket Drag Coefficient Versus Mach Number Graph...................................................................... 68
Figure 42 – RASAero Drag Coefficient Versus Mach Number Graph ........................................................................... 68
Figure 43 – OpenRocket Vertical Velocity Versus Altitude ........................................................................................... 69
Figure 44- OpenRocket Flight Profile Graph ................................................................................................................ 70

7
Figure 45 – RASAero Flight Profile Graph .................................................................................................................... 70
Figure 46 - Drift and altitude over time with 0mph winds. .......................................................................................... 74
Figure 47 - Drift and altitude over time with 5mph winds. .......................................................................................... 75
Figure 48 - Drift and altitude over time with 10mph winds. ........................................................................................ 75
Figure 49 - Drift and altitude over time with 15mph winds. ........................................................................................ 76
Figure 50 - Drift and altitude over time with 20mph winds. ........................................................................................ 76
Figure 51 - Drift vs Altitude with 0mph winds. ............................................................................................................ 77
Figure 52 - Drift vs Altitude with 5mph winds. ............................................................................................................ 77
Figure 53 - Drift vs Altitude with 10mph winds ........................................................................................................... 78
Figure 54 - Drift vs Altitude with 15mph winds ........................................................................................................... 78
Figure 55 - Drift vs Altitude with 20mph winds ........................................................................................................... 79
Figure 56 – 4 wheeled alternative rover design rendered using SolidWorks ............................................................... 92
Figure 57 – 4 wheeled alternative rover design with self-righting arm engaged rendered using SolidWorks ............ 92
Figure 58 – 3 wheeled alternative rover design with 3rd “idler” wheel deployed rendered using SolidWorks ............ 93
Figure 59 – 3 wheeled alternative rover design rendered using SolidWorks ............................................................... 93
Figure 60 – Hamster Ball alternative rover design rendered using SolidWorks ........................................................... 94
Figure 61 – “Blinkd Tank” rover design rendered using SolidWorks ............................................................................ 95
Figure 62 – Primary Rover Design ................................................................................................................................ 96
Figure 63 – Primary Rover Design with removeable 3rd “Idle” wheel ......................................................................... 97
Figure 64 – Supporters name’s shown on one of the Akronauts rockets, Zion .......................................................... 126
Figure 65 – Flyer created and used by the Akronauts to encourage the community to eat at Pizza Fire, a local
pizzeria in Akron, Ohio. .............................................................................................................................................. 127
8
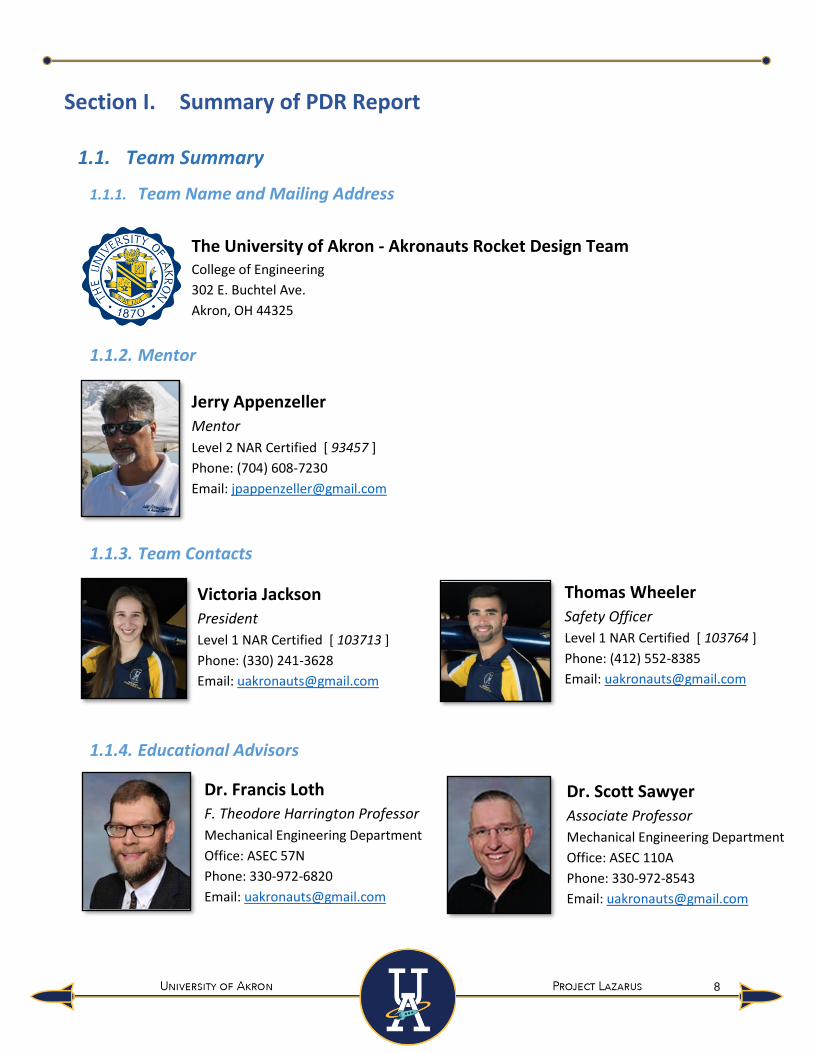
Section I. Summary of PDR Report
1.1. Team Summary
1.1.1. Team Name and Mailing Address
The University of Akron - Akronauts Rocket Design Team College of Engineering
302 E. Buchtel Ave.
Akron, OH 44325
1.1.2. Mentor
Jerry Appenzeller
Mentor
Level 2 NAR Certified [ 93457 ]
Phone: (704) 608-7230
Email: [email protected]
1.1.3. Team Contacts
1.1.4. Educational Advisors
Thomas Wheeler
Safety Officer
Level 1 NAR Certified [ 103764 ]
Phone: (412) 552-8385
Email: [email protected]
Victoria Jackson
President
Level 1 NAR Certified [ 103713 ]
Phone: (330) 241-3628
Email: [email protected]
Dr. Francis Loth
F. Theodore Harrington Professor
Mechanical Engineering Department
Office: ASEC 57N
Phone: 330-972-6820
Email: [email protected]
Dr. Scott Sawyer
Associate Professor
Mechanical Engineering Department
Office: ASEC 110A
Phone: 330-972-8543
Email: [email protected]

9
1.2. Launch Vehicle Summary
A summary of each system is listed below. More details of each system as well as interactive models
can be found on the Akronauts website at www.akronauts.org
1.2.1. Size and Mass
The launch vehicle is 83 inches in length. The dry weight of the entire launch vehicle and its payload
is 38 pounds. Currently, the predicted wet weight of the rocket including the payload and its
components is projected to be approximately 46 pounds.
1.2.2. Motor Choice
A Cesaroni L1350 will be used for Project Lazarus. The selected motor gives a total impulse of 958.4
lb∙s and displays a projected launch height of 5,299ft through the team’s simulations. The commercially
generated thrust curve of the motor can be found below in figure.
1.2.3. Recovery System
At apogee, a drogue parachute will be deployed via a black powder ejection system to slow the
descent of the vehicle to approximately 150ft/s. At 750ft, the main parachute will be pulled out of the
airframe by the drogue parachute, slowing the rocket to a descent of 13ft/s.
1.3. Payload Summary
The objective of the rover payload is to deploy a rover from the internal structure of the launch
vehicle that is then able to autonomously navigate 5 feet away from the landing site of the vehicle and
deploy a solar panel. Through the team’s implementation of a gyroscope, the rover will be able to
automatically adjust itself after deployment from the airframe of the rocket. With IR sensors
incorporated into the design, the rover will be able to navigate through a clear path at least 5 feet from
the landed vehicle. Once at the final destination, the rover’s servo/dc motor will release the torsion
spring loaded plate, deploying the solar panel.
Figure 1 – Cesaroni L1350 motor thrust curve (source: Cesaroni Technology)

10
1.4. Milestone Review Flysheet

11

12
Section II. Changes Made Since Proposal
2.1. Vehicle Criteria Changes
Multiple facets of the initial vehicle proposal have been modified in to accommodate the addition of
air brakes as well as design optimization. The modifications resulted in a choice of a new motor, as well
as new design for the nose cone and fins. To further improve the control of the launch vehicle flight
profile, stability ballast systems were implemented to the nosecone and thrust plate. With improved
drag performance in mind, the original parabolic nose cone design was changed to a Von Karman design
and the fin design transitioned from a clipped delta design to a delta design. To help maintain a similar
predicted apogee, the selected motor changed from the Cesaroni L1355 to the Cesaroni L1350. As a
product of the aforementioned changes, the launch vehicle length decreased from 99.25 to 83 inches,
while the dry weight increased from 31.5 to 38 pounds.
2.2. Recovery Criteria Changes
Previously, the main parachute had a deployment height of 800 ft.; due to the kinetic energy
requirements, the descent velocity was reduced which in turn required a reduction of the deployment
height of the main parachute to 725 ft. Additionally, the eyebolt that was initially chosen to be used as
the attachment hardware from the bulkhead to the shock cords has been changed to U-bolts. This is
because the two points of contact spreads the load over more area and has lesser propensity for
breakage and unscrewing.

13
Section III. Vehicle Criteria
3.1. Mission Statement
The mission is to design a launch vehicle that will travel to altitude of 5,280 ft, and recovery safely
back to the ground. After landing, the team will trigger the deployment of an autonomous rover that will
travel 5ft. from the launch vehicle. Once the rover has reached its final destination, it will autonomously
deploy a set of foldable solar cell panels. The vehicle must be reusable and able to fly immediately after
recovery. The following criteria must be met in order for the mission to be considered a success:
➢ The rocket must reach an altitude no less than 5,100 feet and no more than 5,300 feet.
➢ The rocket must leave the launch rail with a velocity greater than 52 feet per second.
➢ The rocket must travel at a speed less than Mach 0.8 before motor burnout.
➢ The recovery system ejects both drogue and main without causing any tangling of lines.
➢ The rocket lands without causing any damage to the rocket or its payload.
➢ The payload rover system must not malfunction at any point that the unit is in operation.
➢ The team follows all launch procedures and no one is injured.
➢ The avionics system collects data throughout the entirety of flight.

14
3.2. Alternative Vehicle Designs
The rocket will be subjected to up to 376 pounds of force from thrust during flight. In order to
achieve a stable, successful launch these forces during flight need to be addressed to determine the
type of material for the rocket’s construction. Major contending materials were considered for each
vehicle component. Material decisions were made regarding the body tubes, couplers, bulkheads,
centering rings, thrust plate, fins and the nose cone. The main materials considered for each component
option are listed below in the following tables along with their respective costs, tensile strengths and
densities.
Material Characteristics
Material Component Options Tensile
Strength (psi) Cost Density (lb/in3)
6061 T-6 Aluminum Bulkheads, Centering Rings, Fins 40,000 $6.14/lb 0.098
Fiberglass Reinforced Polyester Bulkheads, Centering Rings, Fins 24,000 $10.17/ft2 0.055
Polycarbonate Centering Rings, Fins 9,650 $2.10/lb 0.052
Wood (OSB )(7/16) Centering Rings 7,194 $0.50/ft2 0.018-0.028
Corrugated Cardboard Centering Rings, Couplers 101 $0.005/lb 0.025
Cast Stainless Steel Bulkheads, Centering Rings 160,000 $12.12/lb 0.284
6K Carbon Fiber Body Tubes, Couplers, Nose Cone 600,000 $89.50/ft 0.061
G12 Fiberglass Body Tubes, Couplers, Nose Cone 300,000 $53/ft 0.055
High Strength Bluetube Body Tubes, Couplers, Nose Cone 5,076 $14.27/ft 0.045
6K Carbon Fiber (winding) Body Tubes, Couplers, Nose Cone 822,000 $24/spool 0.064
Fiberglass Tow (winding) Body Tubes, Couplers, Nose Cone 220,000 $4/spool 0.064
ABS Plastic (3D Printing) Couplers, Nose Cone, Centering Rings 6,600 $13.18/lb 0.037
Table 1 – A table of materials with characteristics
After an initial assessment of the potential material choices for each component, specific pros and
cons lists along with design and material decision matrices were created for each launch vehicle
subsection.

15
3.2.1. Nose Cone
3.2.1.1. Nose Cone Materials
For the nose cone material, the team considered fiberglass, carbon fiber and aluminum. Shown
below are a Pros and Cons Table as well as a decision matrix for the material selection.
Nose Cone Material Pros and Cons
Material Pros Cons
G12 Fiberglass
➢ Affordable ➢ Student Wound ➢ Flexible ➢ Can transmit electronics
➢ Heavier than carbon fiber ➢ Weaker than carbon fiber and aluminum
6K Carbon Fiber
➢ High Tensile Strength ➢ Reflective of Heat ➢ Lightweight ➢ Student Wound
➢ Rigid ➢ Conductive ➢ Interferes with Avionics Communication ➢ Higher cost than fiberglass
6061 T-6 Aluminum
➢ High tensile strength ➢ Most precise
➢ High cost ➢ Complex and expensive manufacturing process ➢ Heavy
Table 2 - A pros and cons table for nose cone materials
Nose Cone Material Decision Matrix
Material Density Availability Cost Experience &
Manufacturability Strength
Electronics Compatibility
Total
Weighted Score: 0.1 0.1 0.3 0.1 0.25 0.15 1
G12 Fiberglass 7 10 8 5 4 7 5.75
6K Carbon Fiber 9 10 5 6 7 1 5.9
6061 T-6 Aluminum 5 4 2 1 9 8 4.9 Table 3 - A decision matrix for nose cone material (a score of 10 being the most desired)
Using Table 5 and Table 6 along with the team’s research, the team decided on a carbon fiber nose
cone. Carbon fiber presents a unique combination of strength and lightweight efficiency for the nose cone material choice. Although it is more expensive than fiberglass, the team determined the experience winding with carbon fiber and strength characteristics together were more important. Electronics compatibility was not a major design concern for the nose cone because it will not need to house electronics.

16
3.2.1.2. Nose Cone Designs
For the nose cone design, the team considered Parabolic, LV-HAACK, Von Karman, and X1/2. Shown
below are a Pros and Cons Table, Simulation Performance Table from the OpenRocket software, and
decision matrices for each of the design selections.
Nose Cone Design Pros and Cons
Design Pros Cons
Parabolic ➢ Low drag characteristic at lower speeds ➢ High drag characteristic at
speeds greater than 0.9 mach
LV-HAACK ➢ Low drag characteristic for speeds below 1.05 mach ➢ Similar drag characteristics to Von Karman
➢ Manufacturing complexity
Von Karman
➢ Best drag characteristic compared to other options for subsonic and transonic regions
➢ Team has past manufacturing experience ➢ Minimal pressure drag
➢ Manufacturing complexity ➢ High drag characteristics at
speeds above 0.9 Mach
X1/2 ➢ Low drag characteristic in transonic region (0.8-1.2
mach) ➢ High drag characteristic above
transonic region (>1.2 mach)
Table 4 - A pros and cons table for nose cone design
Nose Cone Simulation Performance
Design Apogee (ft) Max. Acceleration (ft/s2) Max. Velocity (ft/s) Mach Number Stability (Cal)
Parabolic 5295 218 587 0.52 2.2
LV-HAACK 5269 217 585 0.52 2.18
X1/2 5296 218 587 0.52 2.25
Von Karman 5306 218 588 0.52 2.24
Table 5 - A simulation table for nose cone designs with data from OpenRocket

17
Nose Cone Design Decision Matrix
Design Manufacturability Experience Simulation Performance Total
Weighted Score: 0.4 0.3 0.3 1
Von Karman 5 10 9 7.7
X1/2 5 5 8 5.9
Parabolic 5 6 8 6.2
LV-HAACK 5 9 6 6.5 Table 6 - A decision matrix for nose cone design (a score of 10 being the most desired)
Using Table 4, Table 5 and Table 6 along with research, the team determined the Von Karman design
was best mainly due to simulation performance and experience manufacturing this shape. The Von
Karman design also has superior drag characteristics, allowing the rocket to reach greater altitudes. Von
Karman equation for curvature is shown below with the variables outlined along with a drawing for
reference.
3.2.1.2.1. Von Karman Design
After thoroughly reviewing the team’s Design Matrix and the Pros and Cons of each design, the Von
Karman nosecone design was selected. Below is the optimized equation for the curvature of the
nosecone that the team will use during the manufacturing process.
𝑦 =𝑅
√𝜋√𝜃 −
sin(2𝜃)
2+ 𝐶𝑠𝑖𝑛3𝜃
𝜃 = 𝑐𝑜𝑠−1(1 −2𝑥
𝐿)
𝑦 = Radius of nose cone
𝑅 (Radius of base of nose cone) = 5.25 in
𝑥 = Any point through length L
𝐿 (Length of nose cone) = 26.25 in
𝐶 = 0 for Von Karman
Figure 3 - Von Karman nose cone drawing (all dimensions are in inches)
Figure 2 - Von Karman nose cone rendered using SolidWorks

18
The current Van Karman design includes a stability ballast location in the nose cone to allow for the
addition or removal of weight from the hollowed-out aluminum nose cone tip. This will allow the team
to adjust the stability margin to account for any differences in the rocket during the manufacturing
process and reach the desired altitude. A maximum of 1.75 lb has been allotted to the nose cone tip,
including any additional ballast weight. A transparent rendering of the nose cone tip is shown below for
clarity.
Figure 4 – Transparent rendering of the preliminary nose cone tip using SolidWorks
The team will also consider the effect of heat on the nose cone tip going forward, though it is not
foreseen to be a large concern given the launch vehicle’s projected velocity through the team’s
simulations and calculations.
3.2.1.2.2. LV-HAACK Design
The Von Karman design (which is part of the LV-Haack series) was selected over a traditional LV-
HAACK nose cone because of the more efficient drag characteristics at speeds below mach 1.05. The LV-
HAACK design is shown below with the equation of curvature and a drawing for reference.
𝑦 =𝑅
√𝜋√𝜃 −
sin(2𝜃)
2+ 𝐶𝑠𝑖𝑛3𝜃
𝜃 = 𝑐𝑜𝑠−1(1 −2𝑥
𝐿)
𝑦 = Radius of nose cone
𝑅 (Radius of base of nose cone) = 5.25”
𝑥 = Any point through length L
𝐿 (Length of nose cone) = 26.25”
𝐶 = 1/3 for LV-HAACK
Figure 6 - LV-HAACK nose cone drawing (all dimensions are in inches)
Figure 5 – LV-HAACK nose cone rendered using SolidWorks

19
3.2.1.2.3. X1/2 Design
The Von Karman design is far superior to the X1/2 nose cone due to the inefficient aerodynamics of
the X1/2. It has better drag characteristics for the transonic region. X1/2 design with its equation of
curvature is shown below.
𝑦 = 𝑅(𝑥
𝐿)𝑛
𝑦 = Radius of nose cone
𝑅 (Radius of base of nose cone) = 5.25”
𝑥 = Any point through length L
𝐿 (Length of nose cone) = 26.25”
0 < 𝑛 < 1 (𝑛 = 0.5 for this case)
3.2.1.2.4. Parabolic Design
Parabolic nose cone shape was another design considered from the proposal, but due to advantages
listed for the Von Karman design, the team decided to return to it. Shown below is the parabolic design
with the equation of curvature.
𝑦 = 𝑅(2 (
𝑥𝐿
) − 𝐾′(𝑥𝐿
)2
2 − 𝐾′)
𝑦 = Radius of nose cone
𝑅 (Radius of base of nose cone) = 5.25”
𝑥 = Any point through length L
𝐿 (Length of nose cone) = 26.25”
𝐾′ = 1 for a full parabola
Figure 9 - Parabolic nose cone drawing (all dimensions are in inches)
Figure 8 - X1/2 nose cone drawing (all dimensions are in inches)
Figure 7 – X1/2 nose cone rendered using
SolidWorks

20
3.2.2. Fins
Fins are another important factor in stabilizing the vehicle during flight. The team considered
fiberglass, polycarbonate, and aluminum as possible fin materials and their important characteristics:
flutter strength, cost, and density. Below are a Pros/Cons Table as well as a decision matrix for material
selection.
3.2.2.1. Fin Materials
Fin Materials Pros and Cons
Material Pros Cons
G12 Fiberglass ➢ Low density ➢ High tensile strength ➢ High manufacturability
➢ Weaker than aluminum
Polycarbonate ➢ Low density ➢ Least expensive
➢ Low tensile strength
6061 T-6 Aluminum ➢ High tensile strength ➢ High density ➢ Most expensive material
Table 7 – A pros and cons table for fin material
Fin Material Decision Matrix
Material Density Cost Experience Flutter Strength Total
Weighted Score: 0.45 0.2 0.05 0.3 1
6061 T-6 Aluminum 1 1 2 5 2.25
Polycarbonate 3 3 1 1 2.3
G12 Fiberglass 3 3 2 2 2.65
Table 8 - A decision matrix for fin material (a score of 10 being the most desirable)
From Table 7 and Table 8, fiberglass was chosen as the best material for the fins due to its
combination of flutter strength and low density. Polycarbonate has similar low weight characteristics,
but a low shear modulus which results in a low flutter strength. On the opposite side, aluminum has a
high flutter strength with high density. Fiberglass is also the least expensive of the materials considered,
although polycarbonate is comparable.

21
3.2.2.2. Fin Designs
The number of fins -three or four fins- was another vehicle design decision to be made for the
launch vehicle. In the past, the Akronauts have used a three-fin configuration for all of the team’s
rockets. With three fins, the interference drag is 33% less than a four-fin configuration. A fourth fin
would also add more weight. Therefore, a three-fin configuration was decided.
The team considered four common shapes for fin design: clipped delta, delta, tapered swept, and
trapezoidal. Flight simulations from OpenRocket were utilized to consider which design would result in
the least drag. Manufacturability and fin flutter were two other main factors considered. Shown below is
a Pros/Cons Table, Simulation Performance Table from OpenRocket, and a decision matrix for fin design.
Fin Design Pros and Cons
Design Pros Cons
Clipped Delta ➢ Simple to manufacture ➢ Prone to damage at touchdown
Trapezoidal ➢ Damage resistant on touchdown due
to trailing edge angle ➢ Difficult to manufacture
Delta ➢ Least drag ➢ Simple to manufacture
➢ Prone to damage at touchdown
Tapered Swept
➢ Increases stability margin further compared to other options
➢ Difficult to manufacture ➢ Prone to damage at touchdown
Table 9 - A pros and cons table for fin design
Fin Simulation Performance
Design Apogee
(ft) Max Acceleration
(ft/s^2) Max Velocity
(ft/s) Mach
Number Stability
(Cal)
Clipped Delta 5279 218 586 0.52 2.31
Trapezoidal 5258 217 585 0.52 2.32
Delta 5307 218 588 0.52 2.24
Tapered Swept 5267 217 585 0.52 2.34
Table 10 - A simulation table for fin designs with data from OpenRocket

22
Fin Design Decision Matrix
Design Manufacturability Cost Experience Fin Flutter Simulation Performance Total
Weighted Score: 0.2 0.05 0.1 0.3 0.35 1
Clipped Delta 5 3 3 4 4 4.05
Trapezoidal 3 1 3 5 1 2.8
Delta 6 4 1 1 7 4.25
Tapered Swept 1 2 1 5.5 3 3.1 Table 11 - A decision matrix for fin design (a score of 10 being most desirable)
From Table 9, Table 10 and Table 11 along with the team’s research, it was determined that the
delta fin would be best for Project Lazarus.
3.2.2.2.1. Delta Design
The delta fin produced the least drag, evidenced by the highest apogee in the simulation
performance table. It was also the easiest fin design to manufacture and has sufficient flutter strength
to withstand the launch vehicle’s maximum velocity. Below is a figure of the proposed delta fin.
Figure 10 - Delta fin drawing (all dimensions shown are in inches)

23
3.2.2.2.2. Clipped Delta Design
The second best option was the clipped delta which the team has used in the past and is similar to
the clipped delta. This style fin is also easily manufactural. A figure of the clipped delta fin is shown
below.
Figure 11 - Clipped Delta fin drawing (all dimensions shown are in inches)
3.2.2.2.3. Trapezoidal Design
Trapezoidal was the fin design for Project Zaphod at NASA last year. It is fairly difficult to construct
and induces the most drag although the angle of the trailing edge reduces the possibility of damage at
touchdown. The figure below shows an example of a trapezoidal fin design.
Figure 12 - Trapezoidal fin drawing (all dimensions shown are in inches)

24
3.2.2.2.4. Tapered Swept Design
Tapered swept fin design would be the most difficult to manufacture to to the angles of both edges.
It was also the most prone to damage at touchdown, but would increase stability margin the most.
Below is a figure of a tapered swept fin.
Figure 13 - Tapered Swept fin drawing (all dimensions shown are in inches)
3.2.2.3. Fin Flutter Calculations
When considering fin design, the team used a calculation method from NACA Technical Paper 4197
and Apogee Rockets to calculate the Fin Flutter. Calculations to find fin flutter speed were imperative in
order to choose a design that would not flutter mid-flight. Inputting root chord, tip chord, semi-span,
and fin thickness along with the height of maximum velocity and different shear moduli for each
material, the team calculated the maximum flutter speed for each design alternative.
Shown below is a sample calculation to demonstrate the current delta fin design with fiberglass will
not flutter. The height of maximum velocity was obtained from OpenRocket.
𝐶𝑟 (𝑅𝑜𝑜𝑡 𝐶ℎ𝑜𝑟𝑑) = 8”
𝐶𝑡 (𝑇𝑖𝑝 𝐶ℎ𝑜𝑟𝑑) = 0”
𝑡 (𝑇ℎ𝑖𝑐𝑘𝑛𝑒𝑠𝑠) = 0.125”
𝑏 (𝑆𝑒𝑚𝑖 − 𝑆𝑝𝑎𝑛) = 5”
𝐺 (𝑆ℎ𝑒𝑎𝑟 𝑀𝑜𝑑𝑢𝑙𝑢𝑠) = 1,160,340 𝑝𝑠𝑖
ℎ (𝐻𝑒𝑖𝑔ℎ𝑡 𝑜𝑓 𝑀𝑎𝑥𝑖𝑚𝑢𝑚 𝑉𝑒𝑙𝑜𝑐𝑖𝑡𝑦) = 1,089.057 𝑓𝑡
The fin flutter boundary equation is shown below.
𝑉𝑓 = 𝛼√
𝐺
(1.337(𝐴𝑅)3(𝑃)(𝜆 + 1)
2(𝐴𝑅 + 2)(𝑡𝑐)3
)

25
The first step to solving this equation is finding the surface area of the fins which can be calculated
by taking the average of the root and tip chords and multiplying by the semi-span. Plugging values into
equation (2), the following results for surface area are calculated.
𝑆 =(𝐶𝑟 + 𝐶𝑡)
2𝑏 =
(8 + 0)
25 = 20 𝑖𝑛2
The next step is to determine the aspect ratio, which is the ratio of the semi-span to the mean chord
length of a wing. The calculated surface area from equation (2), as well as the length of the semi-span of
our fins can be inserted into equation (3) below to obtain the aspect ratio.
𝐴𝑅 =𝑏2
𝑆=
52
20= 1.25
Using the ratio of tip chord to root chord allows the team to find the chord of a tapered wing at any
position along the span. Plugging in values of root and tip chord into equation (4) below to obtain the
ratio of tip to root chord.
𝜆 =𝐶𝑡
𝐶𝑟=
0
8= 0
The temperature and pressure are both formulated using the height at which our rocket achieves
maximum velocity. Using OpenRocket simulations, it was found the burnout height of the rocket occurs
at approximately 1089.0573 ft. Using a document from NASA on the Earth Atmosphere Model, the
equations for Temperature (5), Speed of Sound (6) and Pressure (7) could be developed.
𝑇 = 59 − 0.00356(ℎ) = 59 − 0.00356(1089.057) = 55.123 °𝐹
𝛼 = 1.4(1716.59)(𝑇 + 460) = 1.4(1716.59)(55.123 + 460) = 1112.635 𝑓𝑡/𝑠
𝑃 =2116
144(𝑇 + 459.7
518.6)5.256 =
2116
144(55.123 + 459.7
518.6)5.256 = 14.587 𝑙𝑏/𝑖𝑛2
The results from equations (2)-(6) can be inserted into the flutter equation (1) to calculate the
flutter speed.
𝑉𝑓 = 1112.635√
1160340
(1.337(1.25)3(14.587)(0 + 1)
2(1.25 + 2)(0.125
8 )3)
= 948.19 𝑓𝑡/𝑠
As shown, the fin flutter equation safely predicts the current delta fin design will not experience
flutter since the approximate flutter speed of 948.19 ft/s. This value yields a safety factor of just above
1.6 given the approximate maximum velocity of 587.21 ft/s obtained from OpenRocket.

26
3.2.2.4. Fin Attachment
For the attachment of the fins to the launch vehicle, a design similar to last year’s fin can model will
be implemented. The main difference will be that the 3D-printed canister parts will not be bolted to the
exterior of the rocket, but rather inside the rocket. The fin can will be attached between the inner
fuselage wall and the fiberglass centering rings around the motor. The flanges will then stick outside the
body tube, thus giving an attachment point for the fins to be mechanically fastened similar to last year’s
design. Below is a drawing of the proposed fin can attachment piece.
Figure 14 - Fin canister drawing (all dimensions shown are in inches)

27
There will be three fin canister pieces surrounding the fins as shown below in the rendered figure.
During the next phases of the design, the team will determine where and how many fastening points
there will be to ensure optimal stability of the fin canister and the fins while also taking into account the
weight and amount of hardware used for the fastenings.
Figure 15 - Fin canister rendered photo using SolidWorks
28
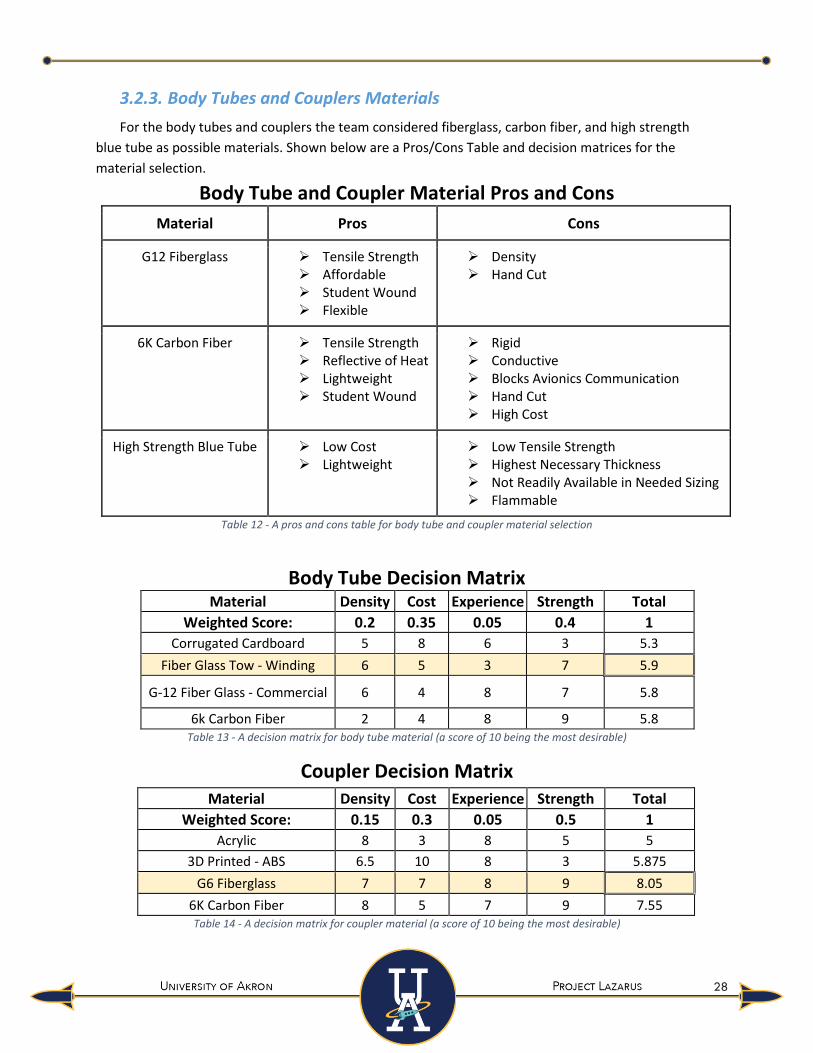
3.2.3. Body Tubes and Couplers Materials
For the body tubes and couplers the team considered fiberglass, carbon fiber, and high strength
blue tube as possible materials. Shown below are a Pros/Cons Table and decision matrices for the
material selection.
Body Tube and Coupler Material Pros and Cons
Material Pros Cons
G12 Fiberglass ➢ Tensile Strength ➢ Affordable ➢ Student Wound ➢ Flexible
➢ Density ➢ Hand Cut
6K Carbon Fiber ➢ Tensile Strength ➢ Reflective of Heat ➢ Lightweight ➢ Student Wound
➢ Rigid ➢ Conductive ➢ Blocks Avionics Communication ➢ Hand Cut ➢ High Cost
High Strength Blue Tube ➢ Low Cost ➢ Lightweight
➢ Low Tensile Strength ➢ Highest Necessary Thickness ➢ Not Readily Available in Needed Sizing ➢ Flammable
Table 12 - A pros and cons table for body tube and coupler material selection
Body Tube Decision Matrix Material Density Cost Experience Strength Total
Weighted Score: 0.2 0.35 0.05 0.4 1
Corrugated Cardboard 5 8 6 3 5.3
Fiber Glass Tow - Winding 6 5 3 7 5.9
G-12 Fiber Glass - Commercial 6 4 8 7 5.8
6k Carbon Fiber 2 4 8 9 5.8 Table 13 - A decision matrix for body tube material (a score of 10 being the most desirable)
Coupler Decision Matrix
Material Density Cost Experience Strength Total
Weighted Score: 0.15 0.3 0.05 0.5 1
Acrylic 8 3 8 5 5
3D Printed - ABS 6.5 10 8 3 5.875
G6 Fiberglass 7 7 8 9 8.05
6K Carbon Fiber 8 5 7 9 7.55 Table 14 - A decision matrix for coupler material (a score of 10 being the most desirable)

29
After comparing the available materials in Table 12, Table 13 and Table 14, the body tubes and
couplers preliminary material choice will be fiberglass. The team plans to utilize commercially available
couplers while winding the body tubes. Fiberglass meets the necessary strength requirements while
remaining affordable and relatively light in comparison to other options.
3.2.4. Bulkheads, Centering Rings and Thrust Plate Materials
When deciding on materials to use for the bulkheads and centering rings in the launch vehicle, a
Pros and Cons list was established and a decision matrix was set up with categories the team considered
most important: density, cost, experience, and strength. The materials considered for the bulkheads and
centering rings include aluminum, polycarbonate, corrugated cardboard, fiberglass, and OSB wood.
Below are the Pros and Cons Table and decision matrices.
Bulkhead, Centering Ring and Thrust Plate Pros and Cons
Material Pros Cons
6061 T-6 Aluminum ➢ High tensile strength ➢ Flame resistant ➢ Precisely machined ➢ Team has spare round stock
➢ High density ➢ Conductive ➢ High cost
Fiberglass Reinforced Polyester
➢ Low density ➢ Moderate tensile strength
➢ Poor for vibration application ➢ Difficult to precisely machine
Polycarbonate ➢ Similar tensile strength to fiberglass
➢ Heat resistant
➢ Difficult to precisely machine
Wood (OSB)(7/16) ➢ Low density ➢ Lightweight ➢ Low cost
➢ Flammable ➢ Low Tensile strength ➢ Hand Cut
Corrugated Cardboard ➢ Low cost ➢ Easily Replaceable
➢ Low strength characteristics ➢ Difficult to machine
Cast Stainless Steel ➢ Highest tensile strength ➢ Highest density ➢ High cost
Table 15 - A pros and cons table for bulkhead, centering ring and thrust plate material

30
Bulkhead Decision Matrix
Material Density Cost Experience Strength Total
Weighted Score: 0.35 0.2 0.05 0.4 1
6061 T-6 Aluminum 4 7 9 9 6.85
Polycarbonate 7 7 7 4 5.8
Corrugated Cardboard 8 10 7 1 5.55
Fiberglass Reinforced Polyester 6 5 7 9 7.05
Wood (OSB) 8 8 7 4 6.35 Table 16 - A decision matrix for bulkhead material
Centering Ring Decision Matrix
Material Density Cost Experience Strength Total
Weighted Score: 0.4 0.3 0.05 0.25 1
6061 T-6 Aluminum 4 7 9 9 6.4
Corrugated Cardboard 8 10 7 1 6.8
Fiberglass Reinforced Polyester 6 5 7 9 6.5
Wood (OSB) 8 8 7 4 6.95
Table 17 - A decision matrix for centering ring material
Based upon research of the materials and information from Table 15, Table 16 and Table 17, the
team decided that aluminum is best for the bulkheads and balsa wood and aluminum for centering
rings. Strength and machinability were the main reasons the team decided on aluminum over fiberglass
for bulkheads even though fiberglass had a higher score in the decision matrix. The aluminum has a
much greater strength factor than compared to OSB wood, polycarbonate, and corrugated plastic.
Although the strength of balsa wood may be sufficient for particular bulkheads within the rocket, finite
element analysis is still to confirm feasibility. The team also has an excess of aluminum from last year’s
rocket which would minimize cost moving forward.
The reason for choosing balsa wood for the majority of the centering rings came down to strength
and weight. The centering rings holding electronics and the fins will not be as load-bearing as the
bulkheads and finite element analysis will confirm our assumptions. The fiberglass has a greater strength
factor than that of corrugated plastic, OSB wood and polycarbonate. Two centering rings holding the
bottom of the motor must be aluminum due to strength requirements.
Below is a decision matrix used to determine thrust plate material. Aluminum and Stainless
Steel were the two materials the team considered applicable for the thrust plate.

31
Thrust Plate Decision Matrix
Material Density Cost Experience Strength Total
Weighted Score: 0.35 0.2 0.05 0.4 1
6061 T-6 Aluminum 8 3 7 6 6.15
Cast Stainless Steel 3 7 5 8 5.9 Table 18 - A decision matrix for thrust plate material
The thrust plate will experience 376 pounds of thrust during flight. The team determined
aluminum would be sufficient to take this load due to previous experience. Stainless steel is simply too
heavy and expensive for our use.
3.2.5. Motor Mounting & Retention Materials
The team put together a decision matrix shown below for motor mount ideas to secure the thrust
plate to the rest of the rocket. The main factors involved in this decision were weight, cost, experience,
strength and manufacturability. The possible ideas included hardware fastening, epoxy, or a threaded
rod system similar to last year’s NASA motor mount.
Motor Mounting Method Decision Matrix
Design Weight Cost Experience Strength Manufacturability Total
Weighted Score: 0.15 0.1 0.15 0.3 0.3 1
Hardware Fastened 7 7 6 7 5 6.25
Epoxy 7 3 3 5 5 4.8
Threaded Rods 1 5 8 9 2 5.15 Table 19 - A decision matrix for motor mounting method
The threaded rod system used previously proved to be challenging to assemble and heavy, but
strongest of the given options. Shown below is a rendering of the threaded rod assembly idea.
Figure 16 - Threaded rod motor mounting method rendered photo

32
Epoxy was considered, but would be significantly weaker than hardware fastening. The decision was
made to use hardware fasteners due to lightweight and being stronger than the equivalent-weight
epoxy. Finite element analysis will be considered moving toward the CDR in hopes of reducing weight in
several areas of the rocket. Below are two samples of thrust plate analysis for the 0.5” thrust plate. The
first figure shows analysis using hardware fastening constraints while the second figure shows analysis
using the epoxy constraints.
Figure 17 - Thrust plate stress analysis constrained with hardware fasteners
A finite element simulation of a mounting method for the thrust plate using six bolts is shown
above. The maximum stress in the thrust plate is 15.9 ksi. The tensile strength of aluminum is 40 ksi. This
results in a safety factor of nearly 3:1 for the bulkhead.

33
Figure 18 - Thrust plate analysis constrained with epoxy
A finite element simulation of mounting the thrust plate using epoxy is shown above. The most
amount of compressive stress the thrust plate experiences in this case is approximately 1 ksi. The results
show a safety factor of nearly 40:1, although the epoxy strength must also be considered for this case.
Finite element analysis similar to the examples above will be a focus as the team moves toward the
CDR. Moving forward with hardware fastening of the thrust plate, the team calculated the fastener size
necessary to withstand the thrust force of the motor. The fasteners will be M4-14 similar to last year.
Below are the fastener calculations.
3.2.6. Stability Ballast
Previous rocket builds have shown that the estimated masses produced by predictions and
OpenRocket vary from the real world weight of the final launch vehicle build. Therefore there will be a
stability ballast placed mounted above the thrust plate with threaded rods in order to balance the
launch vehicle. The previously mentioned nose cone tip ballast will aid in bringing the stability margin
back to the desired value after a certain weight has been added. It will consist of an aluminum ballast
base plate that will be placed above the trust place resting on bolts fastened to the threaded rods.
Thinner ballast disks made of incremental weights of aluminum will be guided into place by three
threaded aluminum rods running through the system until the desired weight is reached. A maximum of
2.75 lbs of added mass will be applicable in this location. The plates will be fastened by tightened nuts
and washers above the incremental weights. Shown on the following page is a rendered image of the
stability ballast without added aluminum plates.

34
Figure 19 - Stability ballast rendered photo using SolidWorks
3.2.7. Airbrakes
The overall goal of the airbrakes are to prevent the rocket from going beyond its desired point of
apogee. Using an actuating system, the brakes will deploy from within a coupler just above the
electronics area and extend out, creating an increase in the surface area of the rocket. Shown below is
an image of the current airbrake design in the retracted position.
Figure 20 – Airbrakes retracted (left) and extended (right) rendered photos using SolidWorks
The brake fins are connected to a triangular rotor that will activate and rotate, which will cause a
synchronized actuation of the three fins. The triangular rotor will be connected to a servo motor which
will fluidly and precisely deploy the airbrake system. Controlling the servo motor will be a Raspberry Pi
3. This will lead to an increase in the drag acting upon the rocket and will in turn, slow the ascent. The
design of the brakes allows for the electronics within the rocket to function without any issues, having
three open cells for wiring to pass through undisturbed by the moving parts within the brakes. The
Raspberry Pi 3 will incorporate a feedback loop in the code signaling when to deploy the system.
35
Velocity, height, and acceleration of the rocket are three factors the Raspberry Pi 3 will have to
process simultaneously. Once these values are processed and parameters are met, the system will
activate the brakes and induce drag. An additional feature under consideration is adding a retractable
sequence in the case of error. This will allow for the brake system to deactivate and retract back into the
rocket.
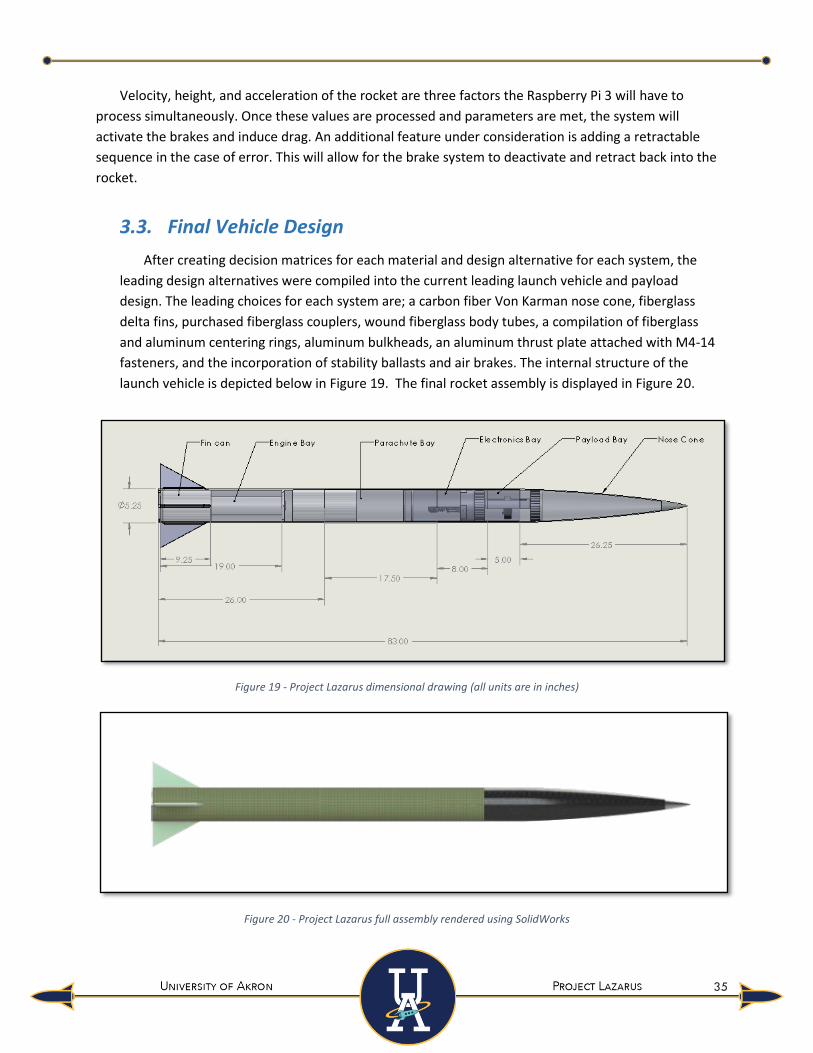
3.3. Final Vehicle Design
After creating decision matrices for each material and design alternative for each system, the
leading design alternatives were compiled into the current leading launch vehicle and payload
design. The leading choices for each system are; a carbon fiber Von Karman nose cone, fiberglass
delta fins, purchased fiberglass couplers, wound fiberglass body tubes, a compilation of fiberglass
and aluminum centering rings, aluminum bulkheads, an aluminum thrust plate attached with M4-14
fasteners, and the incorporation of stability ballasts and air brakes. The internal structure of the
launch vehicle is depicted below in Figure 19. The final rocket assembly is displayed in Figure 20.
Figure 19 - Project Lazarus dimensional drawing (all units are in inches)
Figure 20 - Project Lazarus full assembly rendered using SolidWorks
36
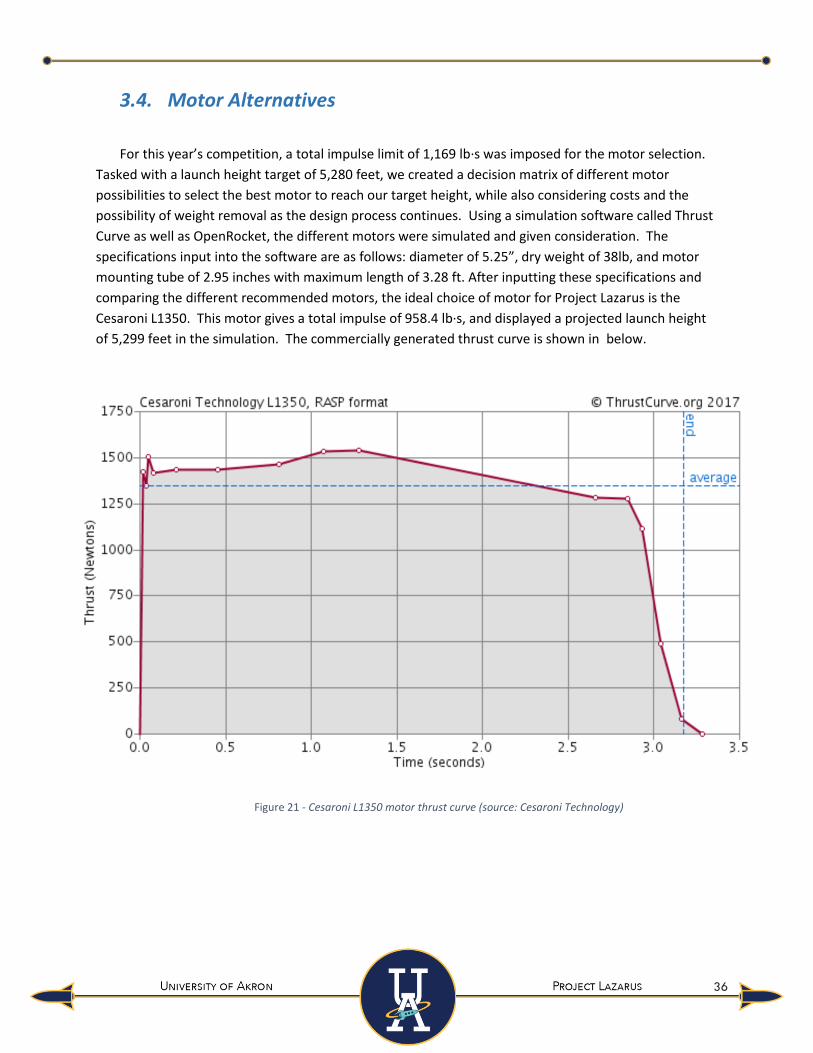
3.4. Motor Alternatives
For this year’s competition, a total impulse limit of 1,169 lb∙s was imposed for the motor selection.
Tasked with a launch height target of 5,280 feet, we created a decision matrix of different motor
possibilities to select the best motor to reach our target height, while also considering costs and the
possibility of weight removal as the design process continues. Using a simulation software called Thrust
Curve as well as OpenRocket, the different motors were simulated and given consideration. The
specifications input into the software are as follows: diameter of 5.25”, dry weight of 38lb, and motor
mounting tube of 2.95 inches with maximum length of 3.28 ft. After inputting these specifications and
comparing the different recommended motors, the ideal choice of motor for Project Lazarus is the
Cesaroni L1350. This motor gives a total impulse of 958.4 lb∙s, and displayed a projected launch height
of 5,299 feet in the simulation. The commercially generated thrust curve is shown in below.
Figure 21 - Cesaroni L1350 motor thrust curve (source: Cesaroni Technology)

37
Data on each motor considered was collected to be compared and modeled. This information,
shown in the table below was then used to develop a decision matrix to make the best possible
selection.
Motor Specifications
Motor
Total
Weight (lbm)
Average
Thrust (lbf)
Max
Thrust (lbf)
Total Impulse
(lbf)
Burn
Time (s)
Specific
Impulse (s)
Cesaroni L1355 10.9 304.8 402.9 905.0 3 136
Cesaroni L1720 7.4 398.1 437.5 822.8 2 213
Gorilla L1065 11.8 239.5 434.3 946.4 4 -
Cesaroni L1350 7.9 303.4 376.0 958.4 3.2 228
Aerotech L1420 10.1 319.2 407.8 1034.8 3.2 183
Table 20 – Specifications for different motors under consideration
The decision matrix, shown below, was created using the data provided by Thrust Curve to help
make the best possible choice. Variables included in the decision include cost, altitude, and weight of
the motor. Designated weight by importance of the variables was split up as follows: Altitude (50%),
weight (20%), and cost (30%). Values were assigned using a scale in which a value of 5 is considered best
for Project Lazarus and a value of 1 is considered worst. By performing a weighted average calculation,
the best motor choice can be shown.
Motor Decision Matrix
Motor Projected Altitude Weight Cost Total
Weighted Score: 0.5 0.2 0.3 1
Cesaroni L1355 3 2 2 2.5
Cesaroni L1720 2 4 4 3
Gorilla L1065 4 1 1 2.5
Cesaroni L1350 5 4 5 4.8
Aerotech L1420 4 3 3 3.5
Table 21 – A decision matrix for motor selection (a score of 10 being most desirable)
Displayed above, these motors were selected as the top options for use in the rocket. The Cesaroni
L1350, with a price of $190 was chosen for purchase, while the Aerotech L1420 was chosen as a
potential backup motor. The Aerotech L1420 has a total impulse of 1,034.8lb∙s, with a simulated altitude
of 4,995 feet. A thrust curve for this motor is displayed below. The Aerotech L1420 also features a
longer length at 26.18 inches while the Cesaroni L1350 measures 19.13 inches. The price of the L1420 is
also higher, costing $249.99 while the L1350 costs $189.95. Because of the lower price, better
dimensional fit for the rocket, and better projected altitude, the Cesaroni L1350 was selected as the
optimal choice.

38
The rocket will be subjected to about 395 pounds of force from thrust during flight. In order to
achieve a stable, successful launch these forces during flight need to be addressed to determine the
type of material for the rocket’s construction. Major contending materials were considered for each
vehicle component. Material decisions were made regarding the body tubes, couplers, bulkheads,
centering rings, thrust plate, fins and the nose cone. The main materials considered for each component
option are listed below in the following tables along with their respective costs, tensile strengths and
densities.
Figure 22 – Aerotech L1420 motor thrust curve (source: Aerotech)

39
Section IV. Recovery Subsystem
4.1. Recovery System Overview
The launch vehicle will be a single compartment, dual deployment recovery system using black
powder for the ejection. At apogee (5,298 ft.), a drogue parachute will be deployed from the lower
body tube. Upon reaching an altitude that is safe for main parachute deployment (725 ft.), the
drogue will be detached from the lower bulkhead and function as a pilot parachute for the main.
The main and drogue parachutes will be connected to the upper and lower bulkheads of the
launch vehicle, as seen in
Figure 23. Upon reaching the main deployment altitude, the drogue will be unlinked from the
bulkheads and used as a pilot parachute to pull out the main. U-bolts will be used as fasteners for
each parachute in order to maintain a firm connection to the bulkheads. The linked deployment
system will be a redundant system in order to ensure that the main parachute is deployed at the
determined altitude.
Figure 23 - Drogue and Main Parachute deployed and attached to upper and lower bulkheads.

40
The gores of both parachutes, as well as their shock cords, will be made of ripstop nylon. The
material will be purchased from vendors and then assembled into two separate parachutes, the
parachutes can be seen in in Figure 24 and Figure 25. This method has been immensely successful at
previous team launches.
.
The recovery system will follow a strict sequence of events. Refer to Table 22 for the sequence
of events and the altitudes at which they will occur. Note that the Main Deployment altitude is
subject to change on launch day to a viable altitude as deemed necessary by either the Akronauts
Safety Officer or RSO due to wind and weather constraints or other issues that may cause caution.
Recovery System Event List
Sequence Event Altitude
1 Drogue Deployment 5,298 ft
2 Main Deployment 725 ft
Table 22 - A list of the recovery system event sequences
4.2. Alternative Recovery Designs
4.2.1. Recovery System Selection
The initial options for recovery setups consisted of: a streamer setup, a parachute setup, a
tumble or featherweight setup, a lifting body setup, a drag setup, a back-slider setup, a parawing
setup, a rotachute setup, and a horizontal spin setup. These options were carefully researched and a
brief summary of each can be found below along with the decision matrix found in Table 24.
Ultimately, we chose parachutes as our preferred recovery device. Once that was established we
researched how many parachutes would be needed as can be seen in Table 25 and decided on the
drogue/main combo.
Figure 24 - The drogue parachute Figure 25 - The main parachute.
41
Recovery Device Comparison
Device Function Examples of Use
Streamers
Streamers are ejected from the rocket and used to
create sufficient drag to slow the rocket for safe
landing.
Small, model rockets (under 30
grams) and when the rocket has
a likelihood of drifting far
Tumble/
Featherweight
Achieved when the center of pressure is ahead of the
center of gravity; the rocket loses stability and starts
tumbling. A reversal of CP and CG can be achieved
through the relocation of mass during the descent.
Short, wide rockets
Parawing Using retractable wings to guide the rocket back to
land, similar to lifting body. Paragliding
Parachutes
Parachutes are ejected from the rocket and used to
create sufficient drag to slow the rocket for safe
landing.
All scenarios, high-powered
rockets
Lifting Body The design of the rocket is such that it creates enough
lift upon its own to slow the rocket. Landings desired to be plane-like
Drag The shape of the rocket is used to create sufficient
drag to slow the rocket upon descent. Small, wide rockets
Back-Slider
Upon reaching apogee, the rocket begins to descend
as is, before beginning a horizontal recovery at a lower
altitude where the fins catch the air, safely landing the
rocket.
Tall, skinny rockets
Rotachute
Involves the spinning or rotating of a parachute during
descent, most commonly done with angled gores. The
spinning helps guide the rocket.
Recovering missiles
Horizontal
Spin
Achieved by spinning a body tube, sufficient drag can
be created to slow the rocket enough for safe landing. Small rockets
Table 23 - Recovery Device Summaries

42
Recovery Device Decision Matrix
Device Ease of
Fabrication Reliability Experience Cost Total
Weighted Score: 0.4 0.3 0.1 0.2 1
Streamers 9 9 1 9 8.2
Parachutes 10 10 10 10 10
Tumble/Feather Weight 8 8 1 7 7.1
Lifting Body 2 3 1 3 2.4
Drag 3 2 1 4 8.2
Back-Slider 1 3 1 3 2
Parawing 2 4 1 2 2.5
Rotachute 10 2 1 10 6.7
Horizontal Spin 3 3 1 4 3
Table 24 - Ways of Slowing a Rocket, (a score of 10 being most desirable)
Number of Parachutes Decision Matrix
Number of Parachutes Ease of
Fabrication Simplicity Experience Cost Total
Weighted Score: 0.2 0.4 0.3 0.1 1
Reefed 3 2 1 8 2.5
Drogue and Main 8 10 10 6 9.2
Drogue, Main, and Pilot 7 8 7 5 7.2
Table 25 - Number of Parachutes, 10 is most desirable

43
4.2.2. Canopy Material Selection
Various materials were researched when it came to canopy material selection. Pros and cons such
as price and strength were compiled and listed in Table 26 and the decision matrix can be found in
Table 27. The team ended up selecting nylon ripstop due to the cost effectiveness and familiarity when
in fabrication.
Canopy Material Pro and Cons List
Material Pros Cons Price
Nylon
➢ Cheap
➢ Easily obtainable
➢ Lightweight
➢ Strong
➢ Melts at high
temperatures $2.2/yard
Dacron
➢ Cheap
➢ Easily obtainable
➢ Lightweight
➢ Strong
➢ Does not stretch
➢ Shrinks at high
temperatures
$2.5/yard
Polytetra-
fluoroethylene ➢ Very strong ➢ Expensive $4/yard
Nomex
➢ High temperature resistance
➢ Durable
➢ Electrical laminate
➢ Rigid $11-13/yard
Kevlar
➢ Strong
➢ Flame and temperature resistant
➢ No Tear
➢ Difficult to fabricate with
➢ Heavy
➢ Not easily packed
➢ Expensive
$18/yard
Spectra ➢ High Strength
➢ Low coefficient of friction
➢ loses strength
➢ Difficult to fabricate with
➢ Unavailable in small
quantities
$11-20/yard
Vectran-LCP
➢ Excessively Strong
➢ Heat resistant
➢ Chemically stable
➢ Difficult to obtain
➢ Expensive
➢ New technology
$11-111/gram
Zylon ➢ Excessively Strong ➢ Unavailable in small
quantities $22/yard
Table 26 - A list of pros, cons, and unit prices for various canopy materials.

44
Canopy Material Decision Matrix
Material Ease of Use
(Sewing) Reliability Experience Cost Total
Weighted Score: 0.2 0.4 0.1 0.3 1
Nylon 10 8 10 9 8.9
Dacron 9 9 1 10 8.5
Polytetrafluoroethylene 2 10 6 4 6.2
Nomex 8 6 7 7 6.8
Kevlar 4 7 1 8 6.1
Spectra 6 5 1 3 4.2
Vectran-LCP 1 6 1 1 3
Zylon 8 7 1 2 5.1
Table 27 - Parachute Material, (a score of 10 being most desirable)
4.2.3. Canopy Shape Selection
After finalizing the fabric material for both the drogue and main parachutes, the team began
researching different designs for the parachute. It was decided that a toroidal design be used for the
main parachute and an elliptical design be used for the drogue parachute. All of the designs that were
compared included toroidal, panel, elliptical, cross, flat sheet, parafoil, and others. The team narrowed
the choices down to the elliptical and annular parachutes.
The pros and cons for the parachute designs came down to two main factors: the drag coefficient,
and whether or not the team had created the design in the past. Refer to Table 28 for the drag
coefficients (Cd) of toroidal and elliptical parachutes and for the complete decision matrix for all of the
parachute shapes considered.
Coefficients of Drag for Toroidal and Elliptical Parachutes
Toroidal Elliptical
Coefficient of Drag 1.86 1.3
Table 28 - A comparison of the coefficient of drag of toroidal and elliptical parachutes.

45
Canopy Shape Decision Matrix
Canopy Shape Ease of
Fabrication
Drag
Coefficient Experience Cost Total
Weighted Score: 0.3 0.4 0.2 0.1 1
X-Form 7 1 3 10 4.1
Torodial 7 10 10 8 8.9
Elliptical 8 8 8 7 7.9
Hemispherical 8 7 7 7 7.3
Octagon 6 3 1 9 4.1
Table 29 - Parachute Shape, 10 is most desirable
The team is experienced in fabricating both of the designs, because they have been used in
previous competitions. Thus, an elliptical design for the drogue parachute will be used; however,
due to the required total kinetic energy of 75 ft-lbf upon landing, the main parachute will need to be
very large if the team were to select the elliptical design for the main parachute. Therefore,
different designs with higher drag coefficients than the elliptical design were researched. The team’s
budget was the deciding factor when finalizing the parachute selection. The toroidal parachute has a
higher drag coefficient than the elliptical, which results in less material required to fulfill the landing
kinetic energy requirement. Therefore, a toroidal design will be used for the main parachute.
4.2.4. Rope Material Selection
The material options listed above for the canopy materials, was narrowed down to nylon, kevlar,
and stainless-steel cable (not previously listed), as can be seen in Table 31. Nylon was chosen as
webbing and flat tubular nylon ropes for the shock cords, shroud lines, and suspension lines.
Parachute Rope Pros and Cons Material Pro Con
Nylon
➢ Inexpensive
➢ Non-abrasive
➢ Light
➢ Not Heat Resistant
Kevlar
➢ Heat resistant
➢ Flame resistant
➢ Strong
➢ Expensive
➢ Abrasive
➢ Difficult to fabricate with
Steel Cable ➢ Strong
➢ Corrosion resistant
➢ Heavy
➢ Inflexible
➢ Expensive
Table 30 - Rope Pros and Cons
46
Parachute Rope Decision Matrix
Material Reliability Experience Cost Strength Damage
Potential Total
Weighted Score: 0.3 0.3 0.1 0.1 0.2 1
Nylon 10 10 10 9 10 9.9
Kevlar 9 8 9 10 6 8.2
Steel Cable 5 1 5 10 5 4.3
Table 31 - Parachute rope (a score of 10 being most desirable)
4.2.1. Recovery Ejection Selection
Various methods of ejecting parachutes and were researched and will be summarized below.
Additionally, Ultimately, black powder ejection charges were the chosen method due to its reliability
and ease of use, as can be seen in.
Ejection Method Pros and Cons
Ejection Method Pro Con
Deployment Bag ➢ Parachute line management
➢ Protects from heat
➢ Bulky
➢ Delays chute inflation
Drogue Gun ➢ Gets drogue airborne
➢ Opens drogue rapidly
➢ Expensive
➢ Complex to integrate into
design
Tractor Rocket ➢ Gets main airborne
➢ Opens main rapidly
➢ Expensive
➢ Complex to integrate into
design
Reefing Cutter ➢ Great for delayed deployment
➢ Great for linked deployments
➢ Complex to integrate into
design
Mortar
➢ Reliable
➢ Great for extremely large
parachutes
➢ Cumbersome
CO2
➢ Safe to handle
➢ previous team experience
➢ reliable at higher altitudes
➢ Takes up a lot of space
➢ Heavy
Black Powder ➢ Highly effective, easy to obtain ➢ Requires wadding protection
➢ Combustible
Table 32 - Ejection Method pros and cons list

47
Ejection Method Decision Matrix
Method Ease of
Fabrication Reliability Experience Cost Total
Weighted Score: 0.2 0.4 0.2 0.2 1
Deployment Bag 8 7 3 9 6.8
Drogue Gun 2 6 1 1 3.2
Tractor Rocket 1 5 1 4 3.2
Reefing Cutter 4 6 1 2 3.8
Mortar 3 4 1 3 3
CO2 10 9 10 9 9.4
Black Powder 9 10 9 10 9.6
Table 33 - Deployment methods, 10 is most desirable

48
4.3. Preliminary Parachute Sizing Calculations
The selection of the parachute sizing was a tedious process. Many different equations were
used to verify the diameter was acceptable per NASA guidelines. Ultimately, the following
process was the deciding method of sizing selection.
The following equations will be used throughout this process:
Kinetic Energy Equation 𝑲𝑬 = 𝟏
𝟐𝒎𝒗𝟐
Equation 1 - Kinetic Energy Equation
Where
𝐾𝐸 = 𝑘𝑖𝑛𝑒𝑡𝑖𝑐 𝑒𝑛𝑒𝑟𝑔𝑦 (𝑓𝑡𝑙𝑏𝑓)
𝑚 = 𝑚𝑎𝑠𝑠 (𝑠𝑙𝑢𝑔𝑠)
𝑣 = 𝑡𝑒𝑟𝑚𝑖𝑛𝑎𝑙 𝑣𝑒𝑙𝑜𝑐𝑖𝑡𝑦 (𝑓𝑡/𝑠)
Drag Force Equation 𝑾 =𝟏
𝟐𝑪𝒅𝑨𝝆𝒗𝟐
Equation 2 - Drag Force Equation
Where
𝑊 = 𝑤𝑒𝑖𝑔ℎ𝑡 𝑜𝑓 𝑡ℎ𝑒 𝑠𝑦𝑠𝑡𝑒𝑚 (𝑙𝑏)
𝐶𝑑 = 𝑐𝑜𝑒𝑓𝑓𝑖𝑐𝑖𝑒𝑛𝑡 𝑜𝑓 𝑑𝑟𝑎𝑔
𝐴 = 𝑎𝑓𝑓𝑒𝑐𝑡𝑖𝑣𝑒 𝑎𝑟𝑒𝑎
𝜌 = 𝑎𝑡𝑚𝑜𝑠𝑝ℎ𝑒𝑟𝑖𝑐 𝑑𝑒𝑛𝑠𝑖𝑡𝑦 = 0.002376 𝑠𝑙𝑢𝑔/𝑓𝑡3
𝑣 = 𝑡𝑒𝑟𝑚𝑖𝑛𝑎𝑙 𝑣𝑒𝑙𝑜𝑐𝑖𝑡𝑦 (𝑓𝑡/𝑠)
Area of a Circle Equation 𝑨 = 𝝅𝒓𝟐 Equation 3 - Area of a Circle Equation
Where
𝐴 = 𝑎𝑟𝑒𝑎 𝑜𝑓 𝑎 𝑐𝑖𝑟𝑐𝑙𝑒 (𝑓𝑡2)
𝑟 = 𝑟𝑎𝑑𝑖𝑢𝑠 𝑜𝑓 𝑎 𝑐𝑖𝑟𝑐𝑙𝑒 (𝑓𝑡)

49
Given that the maximum weight of the rocket is to be 41.985 lb., this will be the assumed weight
throughout all recovery equations to ensure worst-case scenarios are considered.
𝑾𝒕𝒐𝒕𝒂𝒍 = 𝟒𝟏. 𝟖𝟗𝟓 𝒍𝒃 (1)
Converting the weight into mass gives:
𝒎𝒕𝒐𝒕𝒂𝒍 = 𝟒𝟏. 𝟖𝟗𝟓 𝒍𝒃
𝟑𝟐. 𝟐 𝒔𝒍𝒖𝒈/𝒍𝒃
= 𝟏. 𝟑𝟎
(2)
Prior to size selection, the design of the parachutes was carefully selected. Their drag coefficients are as
follows:
𝑪𝒅,𝒅𝒓𝒐𝒈𝒖𝒆 = 𝟏. 𝟑 (3)
𝑪𝒅,𝒎𝒂𝒊𝒏 = 𝟏. 𝟖𝟔 (4)
The launch vehicle will only be traveling to an altitude of 5,298 ft. Therefore; changes in density are
considered negligible and will remain constant for all equations.
𝝆 = 𝟎. 𝟎𝟎𝟐𝟑𝟕𝟔 𝒔𝒍𝒖𝒈/𝒇𝒕𝟑 (5)
Each independent section of the vehicle must have a kinetic energy of less than 75 ftlbf.
𝑲𝑬 = 𝟕𝟓 𝒇𝒕𝒍𝒃𝒇 (6)
The heaviest section of the rocket will be taken into consideration. The heaviest section of the rocket is
the upper section, weighing an approximate 26.898 lb.
𝑾𝒖𝒑𝒑𝒆𝒓 = 𝟐𝟔. 𝟖𝟗𝟖 𝒍𝒃
Converting the weight into mass gives:
𝒎𝒖𝒑𝒑𝒆𝒓 =
𝟐𝟔. 𝟖𝟗𝟖 𝒍𝒃
𝟑𝟐. 𝟐 𝒔𝒍𝒖𝒈/𝒍𝒃= 𝟎. 𝟖𝟑𝟓 𝒔𝒍𝒖𝒈 (7)
Plugging variables (6) and (7) into (eq. 1) and rearranging to solve for velocity gives:
𝒗 = √𝟐(𝟕𝟓𝒇𝒕𝒍𝒃𝒇)
𝟎. 𝟖𝟑𝟓 𝒔𝒍𝒖𝒈
= 𝟏𝟑. 𝟒 𝒇𝒕/𝒔

50
Now that the heaviest section’s velocity is known, the radius of an appropriate parachute size will be
calculated by plugging (eq. 3) into (eq. 2) and rearranging to solve for A.
𝑟𝑚𝑎𝑖𝑛 = √2(41.895𝑙𝑏)
𝜋(1.86)(0.002376𝑠𝑙𝑢𝑔/𝑓𝑡3)(13.4𝑓𝑡/𝑠)2= 5.80𝑓𝑡
The diameter was then found from the radius and converted into inches and rounded up by 3 inches.
𝐷 = 2(5.80𝑓𝑡) (12𝑖𝑛
𝑓𝑡) = 139.1𝑖𝑛 ≈ 142𝑖𝑛 𝐷𝑖𝑎𝑚𝑒𝑡𝑒𝑟 𝑀𝑎𝑖𝑛 𝐶ℎ𝑢𝑡𝑒
Now that the diameter of the parachute is known, convert the diameter back into a radius in terms of
feet.
𝑟 =142𝑖𝑛/2
12𝑖𝑛/𝑓𝑡= 5.92𝑓𝑡
The velocity at which the entire launch vehicle will descend can be found by plugging (eq. 3) into (eq. 2)
and solve for v.
𝑣𝑚𝑎𝑖𝑛 = √2 ∗ 41.895𝑙𝑏
1.86(0.002376𝑠𝑙𝑢𝑔/𝑓𝑡3)(𝜋(5.92𝑓𝑡)2)= 13.394𝑓𝑡/𝑠
A 142 in. parachute will ensure that the heaviest component (25.898 lb.) of a 41.895 lb. launch vehicle
will land with a kinetic energy of less than 75 ft-lb. The terminal velocity at which the 142 in. parachute
will allow the launch vehicle to reach is 13.394 ft./s.
To calculate the diameter of the drogue, first the terminal velocity was taken from the competition
requirements.
𝑣𝑡,𝑑𝑟𝑜𝑔𝑢𝑒 = 150 𝑓𝑡/𝑠
Next, (eq. 3) was plugged into (eq. 2) and rearranged to solve for diameter. The diameter is found to be
15 in.
𝑑𝑑𝑟𝑜𝑔𝑢𝑒 = 2√2(41.895 𝑙𝑏)
1.3(0.002376 𝑠𝑙𝑢𝑔/𝑓𝑡3)(150𝑓𝑡/𝑠)2𝜋= 1.24 𝑓𝑡 = 14.87 𝑖𝑛
≈ 15 𝑖𝑛 𝐷𝑖𝑎𝑚𝑒𝑡𝑒𝑟 𝐷𝑟𝑜𝑔𝑢𝑒 𝐶ℎ𝑢𝑡𝑒

51
4.4. Current Recovery Design
After research, the team surmised that the current leading contenders are a parachute recovery
system made of Nylon Ripstop. For the ropes tubular nylon with a protective layer of Kevlar is ideal for
ropes and shock cords but the team will be using flat tubular nylon for the shroud lines and nylon
webbing for the shock cords and suspension lines. The main parachute will be a 142 in diameter toroidal
parachute and the drogue will be a 15 in diameter elliptical parachute. Black powder will be used to
eject the parachutes due to the cost and efficiency of the system.
Figure 26 – Parachute assembly fully deployed with rope lengths.
Figure 27 - Drogue parachute with shroud line
dimensions.
Figure 28 - Main Parachute with shroud line dimensions

52
Figure 30 – Wiring Diagram for 1 altimeter
4.5. Redundancy Within the Recovery System
The recovery system will contain a redundant altimeter-activated deployment system in which the
main and redundant setup will have its own power source. Each altimeter setup uses a RRC2+ Altimeter
System capable of controlling the ejection of both the drogue and the main parachutes. Both altimeters
are capable of reporting the maximum altitude reached through a series of audible beeps. In terms of
ejection, the lower recovery bulkhead will be equipped with two black powder ejection charges. Each of
these charges will be able to eject its parachute independent of its pair. Also, one of each pair of
ejection charge will be connected to a different altimeter setup, this way if one fails, the parachutes will
still eject.
Figure 29 – Image of a Missile Works RRC3 Altimeter
Two of these setups will exist within the
launch vehicle with separate power
sources for redundancy.
Two separate altimeters will be used for redundancy.

53
Section V. Mission Performance Predictions
The mission performance predictions for previous rockets have come entirely from the OpenRocket
simulation software. Efforts have been made this year to obtain more accurate flight simulations for
Project Lazarus. The team has begun utilizing RASAero as an alternate flight simulation software, which
seems to utilize a more accurate drag coefficient than OpenRocket. Hand calculations will be utilized as
a third prediction method. The goal of utilizing multiple simulation software is to better predict the flight
path of the launch vehicle. The accuracy of each method will be verified through the upcoming subscale
and test launches. The mission performance predictions used in this document are obtained from
OpenRocket due to our familiarity and experience with the software. The main noticeable differences in
each program are that OpenRocket calculates weight and center of gravity while the two values need to
be assigned manually in RASAero. The models created and used in the OpenRocket and RASAero
simulations are found in Figure 31 and Figure 32 respectively.
Figure 31 – Full OpenRocket Model
Figure 32 – Full RASAero Model

54
Certain performance and vehicle characteristics are needed to meet or exceed required values to
achieve a successful and safe flight. These requirements are outlined in the verification plans located in
Section VI. Some important vehicle performance and safety factors are stability margin, thrust to weight
ratio, rail exit velocity, maximum velocity, and target altitude. The methods used to obtain each
characteristic, along with the final values, are depicted in the following section.
5.1. Estimated Mass
The total mass of the rocket is estimated to be 45.79lb. The estimated masses of each
section’s component were obtained from the use of information learned from component masses
utilized in previous rockets, estimations derived from densities, and estimations provided by the
simulation software OpenRocket. Previous experiences have proven that along with the addition of
weight from hardware and epoxy, actual masses will vary from the initial estimations. With the
inevitable variations of masses in mind, the stability ballasts can and will be altered to adjust the weight
and stability of the rocket to values necessary to reach the target altitude. The estimated mass of each
component along with the estimated total rocket weight is located in Table 34 – Table of estimated
component masses (table continued on next page).
Estimated Component Masses
Section Component Mass (lb)
Nose Cone
Nose Cone Body 2.19
Bulkhead 0.44
Nose Cone Tip 1.75
Nose Cone Shoulder
Nose Cone Shoulder 0.65
Payload 5
Table 34 – Table of estimated component masses (table continued on next page)

55
Estimated Component Masses Continued
Section Component Mass (lb)
Electronics Bay
Electronics Body Tube 1.08
Electronics 3
Ejection Charge 0.13
Recovery bulkhead 0.43
Upper Coupler 2.21
Airbrakes 3
Payload ejection system 1
Parachute Bay
Parachute Body Tube 2.35
Ejection Charge 1
Recovery Bulkhead 0.48
Shock Cord 1.35
Main Parachute 0.6
Drogue Chute 0.05
Centering Ring 0.2
Table 34– Table of estimated component masses (table continued from previous page and continues on next page)

56
Estimated Component Masses Continued
Section Component Mass (lb)
Motor Tube
Motor Body Tube 3.5
Lower Coupler 1.23
Launch Lug 0.03
Launch Lug 0.03
Centering Ring (balsa) 0.01
Centering Ring (balsa) 0.01
Thrust Plate 0.87
Centering Ring (aluminum) 0.3
Centering Ring (aluminum) 0.3
Bulkhead 0.43
Fin Can 1.04
Stability Ballast 2.75
Motor
Casing 3.67
Fuel 4.2
Fins
Fin (x3) 0.52
Total Mass 45.79
Table 34– Table of estimated component masses (table continued from previous page and continues on next page)

57
5.2. Stability Margin
The stability margin of the rocket must be designed to prevent both under and oversteering. To
prevent both instances, the stability margin needs to be at least 2.0 while not exceeding the minimum
threshold indicating over-stability. The team’s desired stability margin range is between 2.2 and 2.4 for
Project Lazarus The dictating components of stability margin, center of pressure (CP) and center of
gravity (CG), were determined using both simulation programs as well as hand calculations. CP and CG
locations output from each software are shown in Error! Reference source not found. and Error!
Reference source not found..
Figure 34 – OpenRocket CG and CP Graph
Figure 33 – RASAero CG and CP Graph

58
Each program utilized by the team generates similar values for the location of CP as well as the CG
location change due to motor burnout. In order to ensure the accuracy of the calculations, the CP and
CG were calculated by hand. The equations used to obtain the CG and CP locations are shown below.
CP Equation:
𝐶𝑃 =(𝐶𝑁)𝑁 𝑋𝑁+(𝐶𝑁)𝐹𝑋𝐹
(𝐶𝑁)𝑆
Where:
𝐶𝑃 = 𝐶𝑒𝑛𝑡𝑒𝑟 𝑜𝑓 𝑃𝑟𝑒𝑠𝑠𝑢𝑟𝑒 (𝑚𝑒𝑎𝑠𝑢𝑟𝑒𝑑 𝑓𝑟𝑜𝑚 𝑡ℎ𝑒 𝑛𝑜𝑠𝑒𝑐𝑜𝑛𝑒 𝑡𝑖𝑝) (𝐶𝑁)𝑁 = 𝑁𝑜𝑠𝑒 𝐶𝑜𝑛𝑒 𝐶𝑜𝑒𝑓𝑓𝑖𝑐𝑖𝑒𝑛𝑡
(𝐶𝑁)𝐹 = 𝐹𝑖𝑛 𝐶𝑜𝑒𝑓𝑓𝑖𝑐𝑖𝑒𝑛𝑡 (𝐶𝑁)𝑆 = 𝑆𝑢𝑚 𝑜𝑓 𝐶𝑜𝑒𝑓𝑓𝑖𝑐𝑖𝑒𝑛𝑡𝑠
𝑋𝑁 = 𝐷𝑖𝑠𝑡𝑎𝑛𝑐𝑒 𝑡𝑜 𝑁𝑜𝑠𝑒 𝐶𝑜𝑛𝑒 𝐶𝑒𝑛𝑡𝑟𝑜𝑖𝑑 𝑋𝐹 = 𝐷𝑖𝑠𝑡𝑎𝑛𝑐𝑒 𝑡𝑜 𝐹𝑖𝑛 𝐶𝑒𝑛𝑡𝑟𝑜𝑖𝑑
Fin Coefficient Calculation:
(𝐶𝑁)𝐹 = [1 +𝑅
𝑆 + 𝑅][
4𝑁(𝑆/𝑑)2
1 + √1 + (2 𝐿𝐹
𝐿𝑅 + 𝐿𝑅)2
]
Where:
𝑅 = 𝑅𝑎𝑑𝑖𝑢𝑠 𝑜𝑓 𝐵𝑜𝑑𝑦 𝑎𝑡 𝐴𝑓𝑡 𝐸𝑛𝑑 𝑁 = 𝑁𝑢𝑚𝑏𝑒𝑟 𝑜𝑓 𝐹𝑖𝑛𝑠
𝑆 = 𝐹𝑖𝑛 𝑆𝑒𝑚𝑖𝑠𝑝𝑎𝑛 𝑑 = 𝑁𝑜𝑠𝑒 𝐶𝑜𝑛𝑒 𝐵𝑎𝑠𝑒 𝐷𝑖𝑎𝑚𝑒𝑡𝑒𝑟
𝐿𝐹 = 𝐹𝑖𝑛 𝑅𝑜𝑜𝑡 𝐶ℎ𝑜𝑟 𝐿𝑒𝑛𝑔𝑡ℎ 𝐿𝑅 = 𝐹𝑖𝑛 𝑅𝑜𝑜𝑡 𝐶ℎ𝑜𝑟 𝐿𝑒𝑛𝑔𝑡ℎ
Distance to Fin Centroid:
𝑋𝐹 = 𝑋𝐵 + 𝑋𝑅
3∗
(𝐿𝑅 + 2𝐿𝑇)
(𝐿𝑅 + 𝐿𝑇)+
1
6 [(𝐿𝑅 + 𝐿𝑇) −
𝐿𝑅 ∗ 𝐿𝑇
(𝐿𝑅 + 𝐿𝑇)]
Where:
𝑋𝐵 = 𝑁𝑜𝑠𝑒 𝐶𝑜𝑛𝑒 𝑇𝑖𝑝 𝑡𝑜 𝐹𝑖𝑛 𝐿𝑒𝑎𝑑𝑖𝑛𝑔 𝐸𝑑𝑔𝑒 𝐷𝑖𝑠𝑡𝑎𝑛𝑐𝑒 𝑋𝑅 = 𝐹𝑖𝑛 𝑙𝑒𝑎𝑑𝑖𝑛𝑔 𝐸𝑑𝑔𝑒 𝑡𝑜 𝐹𝑖𝑛 𝑎𝑓𝑡 𝐸𝑑𝑔𝑒
59
Nose Cone Coefficient Assumption:
(𝐶𝑁)𝑁 = 2
Distance to Nosecone Centroid:
𝑋𝑁 =𝐿𝑁
3
Sum of Coefficients:
(𝐶𝑁)𝑆 = (𝐶𝑁)𝑁 + (𝐶𝑁)𝐹 The numeric terms for each variable were inserted into each respective equation to obtain the following values.
(𝐶𝑁)𝐹 = 5.702
(𝐶𝑁)𝑁 = 2 (𝐶𝑁)𝑆 = 7.702
𝑋𝑁 = 8.741 𝑖𝑛𝑐ℎ𝑒𝑠 𝑋𝐹 = 79 𝑖𝑛𝑐ℎ𝑒𝑠
The obtained values were then used in the CP equation shown below.
𝐶𝑃 =(2)(8.741)+(5.702)(79)
(7.702)
𝐶𝑃 = 60.755 𝑖𝑛𝑐ℎ𝑒𝑠
Center of Gravity Equation: 𝐶𝐺 =𝑑𝑛𝑊𝑛+𝑑𝑛𝑠𝑊𝑛𝑠+𝑑𝐸𝐵
𝑊𝐸𝐵+𝑑𝑅𝐵
𝑊𝑅𝐵+𝑑𝑀𝐵
𝑊𝑀𝐵+𝑑𝐹𝑊𝐹
∑𝑊

60
Where:
𝐶𝐺 = 𝐶𝑒𝑛𝑡𝑒𝑟 𝑜𝑓 𝐺𝑟𝑎𝑣𝑖𝑡𝑦 (𝑚𝑒𝑎𝑠𝑢𝑟𝑒𝑑 𝑓𝑟𝑜𝑚 𝑡ℎ𝑒 𝑛𝑜𝑠𝑒𝑐𝑜𝑛𝑒 𝑡𝑖𝑝) 𝑑𝑛 = 𝐷𝑖𝑠𝑡𝑎𝑛𝑐𝑒 𝑡𝑜 𝑡ℎ𝑒 𝑁𝑜𝑠𝑒𝑐𝑜𝑛𝑒 𝐶𝑒𝑛𝑡𝑟𝑜𝑖𝑑
𝑊𝑛 = 𝑊𝑒𝑖𝑔ℎ𝑡 𝑜𝑓 𝑁𝑜𝑠𝑒𝑐𝑜𝑛𝑒 𝑑𝑛𝑠
= 𝐷𝑖𝑠𝑡𝑎𝑛𝑐𝑒 𝑡𝑜 𝑡ℎ𝑒 𝑁𝑜𝑠𝑒𝑐𝑜𝑛𝑒 𝑆ℎ𝑜𝑢𝑙𝑑𝑒𝑟 𝐶𝑒𝑛𝑡𝑟𝑜𝑖𝑑
𝑊𝑛𝑠= 𝑊𝑒𝑖𝑔ℎ𝑡 𝑜𝑓 𝑡ℎ𝑒 𝑁𝑜𝑠𝑒𝑐𝑜𝑛𝑒 𝑆ℎ𝑜𝑢𝑙𝑑𝑒𝑟
𝑑𝐸𝐵= 𝐷𝑖𝑠𝑡𝑎𝑛𝑐𝑒 𝑡𝑜 𝑡ℎ𝑒 𝐸𝑙𝑒𝑐𝑡𝑟𝑜𝑛𝑖𝑐𝑠 𝐵𝑎𝑦 𝐶𝑒𝑛𝑡𝑟𝑜𝑖𝑑 𝑊𝐸𝐵
= 𝑊𝑒𝑖𝑔ℎ𝑡 𝑜𝑓 𝑡ℎ𝑒 𝐸𝑙𝑒𝑐𝑡𝑟𝑜𝑛𝑖𝑐𝑠 𝐵𝑎𝑦
𝑑𝑅𝐵= 𝐷𝑖𝑠𝑡𝑎𝑛𝑐𝑒 𝑡𝑜 𝑡ℎ𝑒 𝑅𝑒𝑐𝑜𝑣𝑒𝑟𝑦 𝐵𝑎𝑦 𝐶𝑒𝑛𝑡𝑟𝑜𝑖𝑑
𝑊𝑅𝐵= 𝑊𝑒𝑖𝑔ℎ𝑡 𝑜𝑓 𝑡ℎ𝑒 𝑅𝑒𝑐𝑜𝑣𝑒𝑟𝑦 𝐵𝑎𝑦
𝑑𝑀𝐵= 𝐷𝑖𝑠𝑡𝑎𝑛𝑐𝑒 𝑡𝑜 𝑡ℎ𝑒 𝑀𝑜𝑡𝑜𝑟 𝐵𝑎𝑦 𝐶𝑒𝑛𝑡𝑟𝑜𝑖𝑑
𝑊𝑀𝐵= 𝑊𝑒𝑖𝑔ℎ𝑡 𝑜𝑓 𝑡ℎ𝑒 𝑀𝑜𝑡𝑜𝑟 𝐵𝑎𝑦
𝑑𝐹 = distance to the Fins Centroid 𝑊𝐹 = 𝑊𝑒𝑖𝑔ℎ𝑡 𝑜𝑓 𝑡ℎ𝑒 𝐹𝑖𝑛𝑠
𝐸𝐵 = 𝐸𝑙𝑒𝑐𝑡𝑟𝑜𝑛𝑖𝑐𝑠 𝐵𝑎𝑦 𝑅𝐵 = 𝑅𝑒𝑐𝑜𝑣𝑒𝑟𝑦 𝐵𝑎𝑦
𝑀𝐵 = 𝑀𝑜𝑡𝑜𝑟 𝐵𝑎𝑦 ∑𝑊 = 𝑆𝑢𝑚 𝑜𝑓 𝑤𝑒𝑖𝑔ℎ𝑡
The values for each variable are listed below.
𝑑𝑛 = 13.125 𝑖𝑛𝑐ℎ𝑒𝑠 𝑊𝑛 = 4.381 𝑝𝑜𝑢𝑛𝑑𝑠 𝑑𝑛𝑠
= 28.75 𝑖𝑛𝑐ℎ𝑒𝑠
𝑊𝑛𝑠= 5.647 𝑝𝑜𝑢𝑛𝑑𝑠
𝑑𝐸𝐵 = 35.25 𝑖𝑛𝑐ℎ𝑒𝑠 𝑊𝐸𝐵
= 10.847 𝑝𝑜𝑢𝑛𝑑𝑠
𝑑𝑅𝐵= 48 𝑖𝑛𝑐ℎ𝑒𝑠
𝑊𝑅𝐵= 6.023 𝑝𝑜𝑢𝑛𝑑𝑠
𝑑𝑀𝐵= 69.75 𝑖𝑛𝑐ℎ𝑒𝑠
𝑊𝑀𝐵= 18.372 𝑝𝑜𝑢𝑛𝑑𝑠
𝑑𝐹 = 80.33 inches 𝑊𝐹 = .522 𝑝𝑜𝑢𝑛𝑑𝑠
Substituting the know values into the CG equation resulted in:
𝐶𝐺 =(13.125)(4.381) + (28.75)(5.647) + (35.25)(10.847) + (48)(6.023) + (69.75)(18.372) + (80.33)(.522)
(4.381 + 5.647 + 10.847 + 6.023 + 18.372)
𝐶𝐺 = 49.0002 𝑖𝑛𝑐ℎ𝑒𝑠 𝑓𝑟𝑜𝑚 𝑛𝑜𝑠𝑒 𝑐𝑜𝑛𝑒 𝑡𝑖𝑝 (𝑤𝑒𝑡)

61
After mathematically confirming the accuracy of the CG and CP locations, OpenRocket and
RASAero produced information on the stability margin during each phase of flight. Each stability margin
graph is shown below in Figure 35 and Figure 36.
Figure 35 – OpenRocket Stability Versus Time Graph
Figure 36 – RASAero Stability Versus Time Graph

62
Table 35 displays the numerical values for the CP, CG and stability margin using each method and
the precision of the three methods.
Stability Calculations
Stability Characteristic OpenRocket Simulation RASAero Simulation Hand Calculation
CP Wet (in) 60.436 60.18 61.66
CP Post Burnout (in) 60.968 60.18 61.66
CG Wet (in) 48.677 48.68 49.0
CG Post Burnout (in) 46.033 46.03 46.5
Stability Margin on Launch Rail 2.24 2.24
Stability Margin Post Burnout 2.83 2.72
Table 35 – Stability Values Obtained Each Calculation Method
5.3. Flight Profile
Flight performance criteria are in place to further ensure a safe and successful flight. An acceptable
thrust to weight ratio indicates that the rocket will successfully lift off of the launch pad and reach an
adequate speed early enough in flight. The resulting speed upon exit of the launch rail needs to exceed
the minimum requirement of 52 ft/s. The maximum vertical velocity during flight must not exceed Mach
0.7.
5.4. Thrust to Weight Ratio
The thrust to weight ratio was found through OpenRocket, RASAero and hand calculations. The
thrust-to-weight ratio of a vehicle is a dimensionless ratio that indicates the performance of the rocket.
To calculate thrust to weight ratio, the team used the thrust to weight equation, using the average
thrust from the motor of choice (Cesaroni L1350) and the total wet weight formulated from the
estimated masses. The thrust outputs over time generated by both programs are displayed inFigure 37
and Figure 38.

63
Figure 37 – OpernRocket Thrust Versus Time Graph
Figure 38 – RASAero Thrust Versus Time Graph

64
The thrust to weight ratio was calculated using the the following equation.
Thrust to Weight Ratio Equation:
𝑇
𝑊= 𝑅
Where:
𝑇 = 𝐴𝑣𝑒𝑟𝑎𝑔𝑒 𝑇ℎ𝑟𝑢𝑠𝑡
𝑊 = 𝐶𝑎𝑙𝑐𝑢𝑙𝑎𝑡𝑒𝑑 𝑊𝑒𝑡 𝑅𝑜𝑐𝑘𝑒𝑡 𝑊𝑒𝑖𝑔ℎ𝑡 𝑅 = 𝑇ℎ𝑟𝑢𝑠𝑡 𝑡𝑜 𝑊𝑒𝑖𝑔ℎ𝑡 𝑅𝑎𝑡𝑖𝑜
Substituting the known values into the Thrust to Weight Ratio Equation resulted in:
1349.6
203.798= 6.62
𝑅 = 6.62
While variance occurred between each thrust to weight ratio calculation method for each motor,
each obtained ratio is sufficient for successfully lifting off and reaching adequate rail exit velocity.
The maximum vertical velocity predictions were produced using OpenRocket, RASAero, as well as
hand calculations. The produced vertical velocity profiles from each software are shown in Figure 39 and
Figure 40.

65
Figure 39 – OpenRocket Vertical Velocity Versus Time Graph
Figure 40 – RASAero Vertical Velocity Versus Time Graph
To obtain the maximum velocity using hand calculations, we first need to define the variables listed
below. RASAero has proven to have a more accurate drag coefficient given the results of last year’s
NASA rocket flight simulations, therefore it was chosen as the drag coefficient for the hand calculations.
The equation used to calculate the burnout vertical velocity is depicted on the following page.
66
Burnout Vertical Velocity Equation:
𝑣 = 𝑣𝑏
1 − 𝑒−𝑥𝑡
1 + 𝑒−𝑥𝑡
Where:
𝑣𝐵 = 𝐵𝑢𝑟𝑛𝑜𝑢𝑡 𝑉𝑒𝑙𝑜𝑐𝑖𝑡𝑦 𝐶𝑜𝑒𝑓𝑓𝑖𝑐𝑖𝑒𝑛𝑡 𝑥 = 𝐵𝑢𝑟𝑛𝑜𝑢𝑡 𝑉𝑒𝑙𝑜𝑐𝑖𝑡𝑦 𝐷𝑒𝑐𝑎𝑦 𝐶𝑜𝑒𝑓𝑓𝑖𝑐𝑖𝑒𝑛𝑡
𝑡 = 𝑀𝑜𝑡𝑜𝑟 𝐵𝑢𝑟𝑛𝑜𝑢𝑡 𝑇𝑖𝑚𝑒
Burnout Velocity Coefficient:
𝑣𝑏 = √𝑇−𝑚𝑔
𝑘
Where:
𝑇 = 𝐴𝑣𝑒𝑟𝑎𝑔𝑒 𝑇ℎ𝑟𝑢𝑠𝑡
𝑚𝐴 = 𝐴𝑣𝑒𝑟𝑎𝑔𝑒 𝑉𝑒ℎ𝑖𝑐𝑙𝑒 𝑀𝑎𝑠𝑠 𝑔 = 𝐴𝑐𝑐𝑒𝑙𝑒𝑟𝑎𝑡𝑖𝑜𝑛 𝐷𝑢𝑒 𝑡𝑜 𝐺𝑟𝑎𝑣𝑖𝑡𝑦
𝑘 = 𝐴𝑒𝑟𝑜𝑑𝑦𝑛𝑎𝑚𝑖𝑐 𝐷𝑟𝑎𝑔 𝐶𝑜𝑒𝑓𝑓𝑖𝑐𝑖𝑒𝑛𝑡
The value for each variable is listed below:
𝑇 = 1349.6 𝑁
𝑚𝑎 = 19.854 𝑘𝑔
𝑔 = 9.81 𝑚 𝑠2⁄
𝑘 = 0.003 𝑘𝑔/𝑚
Substituting the known values for each variable in the Burnout Velocity Coefficient Equation
resulted in:
𝑣𝑏 = √1349.6 − (19.854)(9.81)
0.003
𝑣𝑏 = 595.823 𝑚 𝑠⁄
Burnout Velocity Decay Coefficient:
𝑥 = 2𝑘𝑣𝐵
𝑚

67
Substituting the known values for each variable in the Burnout Velocity Decay Coefficient Equation
resulted in:
𝑥 =2(0.003)(595.823)
19.854
𝑥 = 0.180 1/s
Average Motor Thrust:
𝑇 = 1349.6𝑁
After Obtaining the Necessary Values, the Burnout Velocity Equation can be solved below.
𝑣 = (595.823)(1 − 𝑒−(0.180)(3.2)
1 + 𝑒−(0.180)(3.2))
𝑣 = 173.56 𝑚 𝑠⁄
The velocity was then converted to Mach number using the following equation.
Mach Number Equation:
𝑀 =𝑣
𝑐
Where:
𝑀 = 𝑀𝑎𝑐ℎ 𝑛𝑢𝑚𝑏𝑒𝑟 𝑐 = 𝑠𝑝𝑒𝑒𝑑 𝑜𝑓 𝑠𝑜𝑢𝑛𝑑
Speed of Sound:
𝑐 = 343 𝑚/𝑠
Substituting the known values into the Mach Number Equation resulted in:
𝑀 =172.63
343
𝑀 = .51

68
The relationship between drag coefficient and Mach number was graphed using both software
tools. After obtaining similar values for vertical velocity from each calculation method, the graphs were
used to estimate the variation of the drag coefficient during each stage of flight. Each graph is displayed
below in Figure 41 and Figure 42.
Figure 41 – OpenRocket Drag Coefficient Versus Mach Number Graph
Figure 42 – RASAero Drag Coefficient Versus Mach Number Graph

69
Rail exit velocity was obtained from each simulation software. To account for the difference in
height of launch rails, the velocities for both eight and 12 foot launch rails were recorded. RASAero is
unable to produce a Velocity vs Altitude graph, therefore the velocity values were taken from a table
produced in RASAero. The velocity versus altitude profile for OpenRocket is shown in Figure 43.
Figure 43 – OpenRocket Vertical Velocity Versus Altitude
Resulting numerical values for the flight profile calculations are shown in Table 36. The team hopes
to utilize the subscale and full scale test flights to determine drag coefficient by hand. The team will also
consider rail exit velocity calculations by hand in the future.
Flight Profile Calculations
Flight Profile Characteristic OpenRocket Simulation RASAero Simulation Hand Calculation
Thrust to Weight Ratio 7.16 6.92 6.63
Maximum Vertical Velocity (ft/s) 587.2 595.8 569.4
Drag Coefficient at Max Velocity 0.395 0.35
Rail Exit Velocity (8 ft.) (ft/s) 55.8 56.2
Rail Exit Velocity (12 ft.) (ft/s) 70.2 69.9
Table 36 – Flight Profile Values for Each Calculation Method

70
5.5. Flight Profile Performance
The flight profile performance predictions for the launch vehicle were calculated using OpenRocket
and RASAero. The graphs produced by both simulation software are shown respectively in Figure 44 and
Figure 45.
Figure 44- OpenRocket Flight Profile Graph
Figure 45 – RASAero Flight Profile Graph

71
Resulting numerical values for the launch vehicle’s flight performance predictions are located in
Table 37.
Flight Performance Predictions
Flight Performance Characteristic OpenRocket RASAero
Max Vertical Velocity (Mach) 0.52 0.53
Max Vertical Acceleration (ft/s) 218.2 220.0
Apogee (ft) 5,298 5,515
Table 37 – OpenRocket and RASAero Flight Profile Performance Predictions
5.6. Kinetic Energy Calculations
The following equation was used to calculate the kinetic energy at landing for each independent
and tethered section of the launch vehicle. A descent velocity of 13.4 ft./s and the mass of each
component, located in the table below, was used to ensure that each section had landing kinetic
energy that was less than or equal to 75 ft-lbf .
Kinetic Energy Equation 𝑲𝑬 = 𝟏
𝟐𝒎𝒗𝟐
Where
𝐾𝐸 = 𝑘𝑖𝑛𝑒𝑡𝑖𝑐 𝑒𝑛𝑒𝑟𝑔𝑦 (𝑓𝑡𝑙𝑏)
𝑚 = 𝑚𝑎𝑠𝑠 (𝑠𝑙𝑢𝑔𝑠)
𝑣 = 𝑡𝑒𝑟𝑚𝑖𝑛𝑎𝑙 𝑣𝑒𝑙𝑜𝑐𝑖𝑡𝑦 (𝑓𝑡/𝑠) = 13.4 𝑓𝑡/𝑠
Kinetic Energy of Independent Sections
Component Weight (lb) Mass (slug) Kinetic Energy (ft-lbf)
Upper Rocket Body 26.898 0.835 74.99
Lower Rocket Body 15.087 0.469 42.07
System Total 41.985 1.304 117.06
Table 38 - Kinetic Energy of Independent Sections
72
5.7. Drift Calculations
Each event of the rocket will experience different drift distances due to their independent
terminal velocities. To calculate the total displacement achieved, both drift distances will have
to be added together.
For the drogue parachute, it was assumed that 𝑌drogue is the vertical distance traveled by the
drogue chute. The drogue is released at 5,298 ft and will remain active until the main parachute
is deployed (725 ft). Therefore,
𝑌𝑑𝑟𝑜𝑔𝑢𝑒 = 5,298 𝑓𝑡 − 725 𝑓𝑡 = 4,573 𝑓𝑡
Allowing 𝑣𝑑𝑟𝑜𝑔𝑢𝑒 to be the terminal velocity achieved by the drogue as previously determined
𝑣𝑑𝑟𝑜𝑔𝑢𝑒 = 150 𝑓𝑡/𝑠
The time the drogue spends being active was then calculated by dividing 𝑌𝑑𝑟𝑜𝑔𝑢𝑒 by 𝑣𝑑𝑟𝑜𝑔𝑢𝑒
4574 𝑓𝑡
150 𝑓𝑡/𝑠= 30.49 𝑠
Now multiply this time spent active by the speed of the winds to find the drift distance. See the
list of calculated wind speeds for the drogue parachute in the below
Drogue Parachute Drift
Vw (wind speed mph) Vw (wind speed ft/s) Time (sec) Drift (ft)
0 0 30.49 0
5 7.333 30.49 223.58
10 14.667 30.49 447.19
15 22 30.49 670.78
20 29.333 30.49 894.37
Table 39 - Drogue drift calculations

73
Next, the main parachute drift distances were calculated using the same method as the drogue
parachute.
For the main parachute, it was assumed that 𝑌main is the vertical distance traveled by the main
chute. The main is released at 725 ft and will remain active until contact with the ground.
Therefore,
𝑌𝑚𝑎𝑖𝑛 = 725 𝑓𝑡
Allowing 𝑣𝑚𝑎𝑖𝑛 to be the terminal velocity achieved by the main parachute as previously
calculated
𝑣𝑚𝑎𝑖𝑛 = 13.4 𝑓𝑡/𝑠
The time the main parachute spends being active was then calculated by dividing 𝑌main by 𝑣𝑚𝑎𝑖𝑛
725 𝑓𝑡
13.4 𝑓𝑡/𝑠= 54 𝑠
Now multiply this time spent active by the speed of the winds to find the drift distance. See the
list of calculated drift distances for the main parachute in the below table.
Main Parachute Drift
Vw (wind speed mph) Vw (wind speed ft/s) Time (sec) Drift (ft)
0 0 54 0
5 7.333 54 396
10 14.667 54 791.99
15 22 54 1187.99
20 29.333 54 1583.99
Table 40 - Main Drift Calculations
The total system drift distance is then calculated by summing the corresponding results
between the main and drogue parachutes. Those results can be found in the table below.
Total System Drift
Vw (wind speed mph) Vw (wind speed ft/s) Time (sec) Drift (ft)
0 0 84.49 0
5 7.333 84.49 619.59
10 14.667 84.49 1239.19
15 22 84.49 1858.78
20 29.333 84.49 2478.37
Table 41 - Main and drogue drift summed

74
The total system drift was also simulated and plotted with open rocket the results can be found
in the table below. Also, individual plots of the drift distance and altitude over time can be
found in Figure 46, Figure 47, Figure 48, Figure 49, and Figure 50.
OpenRocket Drift
Vw (wind speed mph) Vw (wind speed ft/s) Time (sec) Drift (ft)
0 0 118.929 8.5885
5 7.333 118.719 406
10 14.667 118.859 938.84
15 22 117.966 1382.30
20 29.333 117.298 1894.70
Table 42 - OpenRocket drift totals
Figure 46 - Drift and altitude over time with 0mph winds.
75
Figure 47 - Drift and altitude over time with 5mph winds.
Figure 48 - Drift and altitude over time with 10mph winds.

76
Figure 49 - Drift and altitude over time with 15mph winds.
Figure 50 - Drift and altitude over time with 20mph winds.

77
OpenRocket takes into account more variables than a basic motion equation includes. Not
only is the altitude of the launch site and the length of launch rail included, but also there is a 1
sec delay after apogee before the drogue is ejected. Because OpenRocket strives for a more
realistic simulation and as such it also simulates the rocket drifting in both a left and right lateral
direction resulting in the final numbers produced differ greatly as seen in the drift vs altitude
plots found below.
Figure 51 - Drift vs Altitude with 0mph winds.
Figure 52 - Drift vs Altitude with 5mph winds.

78
Figure 53 - Drift vs Altitude with 10mph winds
Figure 54 - Drift vs Altitude with 15mph winds

79
Figure 55 - Drift vs Altitude with 20mph winds

80
Section VI. Safety
6.1. Impact of Risks and Delays
The goal of the Akronauts Rocket Design Team is to ensure the safety of all parties involved and
mitigating all safety concerns while successfully completing all launch objectives. Accidents and
malfunctions are always a possibility in rocketry. It is every team member's responsibility to uphold the
team’s safety agreement. These are signed by members and kept on file by the Safety Officer. Should
someone be seriously injured, activity will cease until the situation has been assessed and resolved. If an
incident remains unaddressed, more accidents may occur as a result. The team thus operates under a
safety first, safety always mentality.
While students are operating in a machine shop there will always be trained university staff member
and/or the team Safety Officer supervising. All students will abide by machine shop rules. During all tests
and active system engagements, proper protective safety equipment will be worn. When any system is
active such as a motor test, there will be a Safety Officer present as well as at least two other team
members. It is against the safety agreement for any member work alone. The team understands that a
severe injury or death, unless professionally assessed to be considered an “act of God,” will result in
severe voluntary sanctions on involved parties and a complete investigation. The responsible parties will
take full responsibility and the entire team understands that unsafe actions are cause for dismissal from
competition(s) and potentially dismissal from the team.
6.2. Preliminary Assembly Checklist and Launch Procedure
System Procedure Initials
Payload Install and secure power supply
Payload Ensure that the method of activating the rover is prepared for activation
Payload Load rover into body tube
Payload Ensure the security of the payload in the rocket upon insertion into the
body tube
Main and Drogue
Parachutes If parachutes are already folded, unfold parachutes.
Main and Drogue
Parachutes Expel any debris within the parachutes.
Main and Drogue
Parachutes
Inspect all harnesses, suspension lines, shroud lines, and canopies for any
defects.
Main and Drogue
Parachutes
Recovery lead will properly fold the main and drogue chutes and place
them into the body tubes

81
System Procedure Initials
Recovery Electronics Prep rocket, install engine, and do not install engine igniter.
Recovery Electronics Make sure altimeter power switch is OFF.
Recovery Electronics Install black powder ejection charges.
Recovery Electronics Connect ejection charge leads to avionics bay’s ejection charge terminals,
making sure that wires do not short together or short to anything else.
Recovery Electronics Have your rocket inspected by RSO if applicable, install engine igniter, and
place rocket on launch pad.
Recovery Electronics Put on Safety glasses.
Recovery Electronics
Turn altimeter power switch ON. If you hear a repeating error siren, turn
altimeter OFF and do not launch until problem is corrected. The altimeter’s
settings will be reported; confirm that the preset number and main
deployment altitude are set properly. Last flight altitude will then be
reported, followed by battery voltage. Make sure battery voltage is within
your expectations.
Recovery Electronics
Next, ejection charge continuity will be annunciated by a series of one, two,
or three beeps. Do not launch if continuity status is not as expected!
Ejection charges are “armed” at this point: Keep body parts clear!
Recovery Electronics If continuity is being reported as expected, attach launch system leads to
engine igniter and launch.

82
6.3. Preliminary Hazard Analysis
Likelihood
Consequences/Severity
Minimal
A
Marginal
B
Critical
C
Catastrophic
D
Rare – 1 Low Low Low Low
Unlikely – 2 Low Low Low Moderate
Probable – 3 Low Low Moderate Moderate
Likely – 4 Low Moderate Moderate High
Almost certain – 5 Moderate Moderate High High
The above Risk Assessment Code (RAC) is to be used in the analysis of hazards, failure modes and all
other matrix-style decisions. Implementation of a standard code across the board allows for easier risk
analysis in a complex system, as well as serves as a standard guide for resource allocation for risk
mitigation.
6.3.1. Personal Hazard Analysis
Personal Hazard Analysis
Hazard Cause Effect Pre-
RAC Mitigation Verification
Post-
RAC
Launchpad
Topple Over
Improperly
Secured
Laceration / Blunt force
injury C3
Launchpad will be
anchored to ground
Use a second
(trained) member to
verify
C1
Launchpad
Vehicle
Explosion
Motor Failure
Rocket is severely
damaged and risk of
injuring personnel
D4
Range Officer
(Certified)
Supervision,
Minimum distance
kept by all members
Range Officer and
team Safety Officer
Enforced
D1
Launch Hang
Fire
Electronic
ignition
failure,
thermite or
charge
improperly
mounted
Launch delay, possible
personal Injury B4
Only certified
(NAR/TRA) level 3
rocketeers or Range
Officers are to
approach the launch
pad.
Range Officer and
team Safety Officer
Enforced
B1

83
Mid-Flight
explosion
Catastrophic
system failure
Falling debris, shrapnel-
possible death or severe
injury
C5
Team of spotters
watching entire flight
sequence
Range Officer, team
Safety Officer, all
present
members/spectators
B2
Uncontrolled
Descent
Recovery
System Failure
Rocket ballistic descent,
drift to populated area D3
See below FMEA
Table for failure-
specific risk
mitigations
Test recovery system
to verify prior to
launch
C1
Fabrication
Injury
Member
inexperienced,
untrained,
unprepared to
work
Personal Injury B5
Members will be
trained with all
machine, tools, or
chemicals prior to
use.
Have two or more
(trained) members
at all times
A2
Assembly
Injury
Lack of
familiarity with
assembly
procedure or
completed
design
Personal Injury or rocket
failure B4
All members
responsible for
assembly will be
heavily trained to be
familiar with
assembly procedure
and overall design of
rocket
Follow written
assembly instruction
checklist
A1
84
6.3.2. Failure Mode & Effect Analysis (FMEA)
The below table, Table 19 contains the FMEA of our proposed vehicle and payload systems. These
are ranked based on our defined Risk Assessment Code (RAC) from Table 18 in above Section 4.3. These
values were assigned based on common standards for FMEA and previous team experience at the
Experimental Sounding Rocket Association’s (ESRA) Intercollegiate Rocket Engineering Competition.
FMEA Hazard Analysis
Hazard Effect Pre-
RAC Cause Mitigation Verification
Post-
RAC
Rocket Deviates
from nominal
flight path and
comes in
contact with
personnel at
high speed
Death or
severe
injury to
personnel
Fin detaches
from launch
vehicle
Fin alignment fixture will be
built. Fins are to be thru- walled
attached
Design Review
1C
Rocket is
Unstable
CG and CP to be correctly
calculated. CG will be measured
and fins will be designed for any
future variations in weight that
could reduce the distance
between CG and CP
Design Review
1E
Rocket recovery
system fails to
deploy, rocket
comes into
contact with
personnel
Death or
severe
injury to
personnel
Avionics armed
incorrectly Create an arming sequence
Use a second
(trained) member
verify sequence
Avionics
improperly
programmed
Avionics will not be sending
signals to recovery system
Test to verify prior
to launch
1C Nose cone does
not detach from
launch vehicle
Correct shear pin size will be
used
Test to verify prior
to launch 1E
Black Powder charges will be
large enough for overcompens
ation
Test to verify prior
to launch
Parachute gets
stuck in body of
rocket
Black Powder charges will be
large enough for overcompens
ation
Test to verify prior
to launch

85
Recovery
system deploys
during assembly
or prelaunch
Personnel
injury 2C
Avionics sends a
current to
recovery system
Will design avionics to not have
parasitic voltage
Test to verify prior
to launch 1E
Main parachute
deploys at or
near apogee,
rocket drifts
Risk of
landing in
municipal
areas and
difficult
recovery
of launch
vehicle
3D
Main parachute
is not attached
properly
Connection to be checked
before taking to launch pad
Test to verify prior
to launch 1E
Hang Fire upon
ignition
command, then
ignites upon
personnel
approach
Personnel
injury 2D
Ignitor is
connected to
battery
Disconnect wires leading from
arming switch to ignitor
Use a second
(trained) member or
Range Officer to
verify
1E
Rocket falls
from launch rail
during
prelaunch
Personnel
injury 2C
Rail buttons are
incorrectly sized
Check the rail buttons for
compatibility of launch rail
Use a second
(trained) member to
verify
Rail buttons are
torn from body
of launch vehicle
Rail buttons will be fastened
with proper hardware
Rail buttons to be
checked prior to
launch
1E
Motor explodes
on the launch
pad
Rocket is
severely
damaged
and risk of
injuring
personnel
1E Faulty Motor Buy a commercial motor
Make sure motor
system is free of any
visible defects
1E
Rocket doesn't
leave launch rail
above 52 feet
per second
Rocket
becomes
unstable
2D
Too much
friction between
rocket and
launch pad,
Rocket weighs
too much, or
motor doesn't
produce enough
thrust
Use simulations and test results
to verify; use lubricant on
launch rail to reduce friction
Design Review 1E

86
Member gets
hurts while
manufacturing a
part of the
rocket
Personnel
Injury 2D
Not following
the safety plan
Members will be trained with all
machine, tools, or chemicals
they plan to use.
Have two or more
(trained) members
at all times
2D
6.4. Environmental Concerns
The goal is not only to mitigate all possible safety issues but to also decrease negative
environmental impacts. The team does this with the same risk assessment matrix as above and applied
to the following table:
FMEA Environmental Hazard Analysis
Hazard Effect Pre-RAC
Cause Mitigation Verification Post-RAC
Littering of launch area
Physical damages to the environment itself and
potential injury to nearby organisms
Loose materials
attached to the rocket
Ensure all components are securely attached to the
rocket
Have multiple trained teammates check to
ensure this
3C 1C
Motor Atmosphere
pollutant
Increased carbon footprint on the
atmosphere
3C
Home-made fuels
Fuel will be made commercially to all governing bodies'
standards
Verify certifications among officers prior to motor purchase
1A
Ballistic impact upon an
organism’s habitat
Destruction of an organism's dwelling or destruction of a local
ecosystem
2C Recovery
system fails to deploy
Testing ejections and verification of properly packing the recovery
system
Test verify prior to launch with multiple trained teammates
1A

87
6.4.1. Littering
The Akronauts’ is not only to mitigate all possible safety issues but to also decrease negative
environmental impacts. The first of which is littering. Materials used will be tested to insure no ripping
or tearing off will occur. One item is the harness that connects the rocket to the parachute. This will be
made of 5/8" webbed tubular nylon. Testing will contribute to the decision. The motor also provides a
concern. Unintended discharge of the motor from rocket could lead to catastrophic failure leading to
littering of the launch zone. If something is jettisoned from the rocket unintentionally, the Safety Officer
will visually inspect and make sure the zone is clear for other teams and all possible injury and damage
risks are eliminated.
6.4.2. Pollution
The engine used has been certified and shall meet all pollution requirements recommended by all
applicable safety organizations. Ejection tests of parachutes will be done to ensure no debris will exit the
launch vehicle and pollute the launch site. Similarly, ejection tests of the rover payload will be done to
ensure no damage will be done to the environment and that no debris will be left on the launch field.
6.4.3. Physical Harm
It is possible that the rocket may cause physical harm to the environment or ecosystem. If the
recovery system does not work as designed, there will be a crash that may disturb wildlife severely. The
rocket is thus designed to have redundant recovery systems to ensure this is not an issue. In addition,
should there be a recovery system failure, a warning signal will be sent out to all other teams in the
area. It is also a concern that the rocket may be harmed by the environment upon impact. Should there
be harsh weather conditions such as extreme heat, high wind, heavy rain, thunderstorm, lightning, etc.
the launch will be delayed and the rocket will be wrapped in a protective tarp or taken to a protective
shelter.
6.5. Defined Risks
Hazard Analysis tables from sections 6.3.2 and 6.3.1 have risk-specific mitigation implementations
and verification processes. The following risks have a broader scope to the risk definition. This allows us
to address these risks with an initial common mitigation before further investigation.
6.5.1. Project Risks
As the team goes through the design process, there are bound to be risks that may cause time
delays, deplete resources, stretch the team budget, or may cause a distraction of the scope from the
project. To prevent these, we have developed the following solutions.

88
6.5.1.1. Mitigating Time Risks
To mitigate time based risks such as not completing reports or finishing designs by design reviews
with team leads and the Chief Engineer, the Project Manager has developed detailed timelines for each
sub-system within Microsoft Project that allows for intermediate deadlines before major reviews and
submissions with some built in flexibility to ensure that projects are finished on time.
6.5.1.2. Mitigating Resource Based Risks
As one of the newest design teams on The University of Akron campus, our resources (building
materials, machine shop access etc.) are growing yet still limited. To maximize these resources and
reduce the chance of dwindling the supply, we have Bill-of-Material (BOM) sheets due at multiple points
throughout the review process in the timelines mentioned previously. This will prevent the team from
overusing material based resources. For machining, maximizing this requires the team to train as many
members as possible in university machine shops so that if the time comes where the team needs
something manufactured quickly, there is a high chance of a trained teammate being available to
perform the task.
6.5.1.3. Mitigating Budget Risks
To mitigate monetary concerns, once budget from the university is assigned to the team, the system
leads and officers then take the developed BOM’s to verify that the current plan is feasible with the
budget supplied from the university and extra assistance from sponsorships. Once this occurs, the
officers will determine a percentage of the budget that each sub-system will receive. There will be a
percentage of the budget (amount to be determine upon receiving the final budget) that will be set
aside should something occur where components or machinery break and new items need to be
purchased. This will ensure that the team is under budget despite potential errors in manufacturing or
testing.
6.5.1.4. Mitigating Scope Risks
To eliminate the possibility of loss of scope, first there are the timelines in Microsoft Project
mentioned above. Then there are also weekly meetings between leads and officers to discuss project
status. This allows the leads to ensure the sub-systems remain focused on the task at hand and stay
within the design criteria. Lastly, there are design reviews with the Chief Engineer. This is a final check
that the project has been completed within the assigned timeframe and meets all design criteria set
forth by both competition guidelines and by the officers.

89
6.5.2. Launch Vehicle Risks
6.5.2.1. Motor Failure
High impact risk, with low likelihood due to this system being a purchased, certified solid motor.
Purchasing a commercial motor has many benefits, including time saving, short term budget savings and
near-perfect functionality. These motors are tested rigorously with resources that would difficult or
costly to come across for a student design team.
6.5.2.2. Launch Failure
Medium to High impact risk, with a medium likelihood of occurrence. Launch failure can be defined
as anything other than a “perfect” launch, meaning an ignition hang fire, not reaching off-the-rail
required speeds or an immediate unplanned incorrect trajectory. A hang fire is to be addressed by the
Range Officer, and would result in minimal time loss and launch delay.
dynamic launch failure is a much higher risk and is addressed by inspection of launch pad &
connections, and proper ignitor insertion.
6.5.2.3. Recovery System Failure
Medium to High impact risk, with a low to medium likelihood of occurrence. Failure can be defined
as anything other than a “perfect” touchdown speed of over 12 ft/s, under full parachute canopy open
and operational, within the designated recovery area. Failure can occur due to avionics communication,
incorrect chute release altitude, ripcord damage or incorrect chute packing and mounting. See FMEA
Table 20 for specifics. Expensive failure possibility due to vehicle destruction upon impact.
6.5.2.4. Fabrication/Assembly Risks
Low impact, low to medium likelihood of failure occurrence. This is our all-encompassing general
risk mitigation technique. Fabrication/Assembly risks stem from team members being uninformed, ill-
equipped or untrained for the attempted task. To address this, we will perform “Welcome 101” training
to our new members over all aspects of design and fabrication over the competition year. Skilled
upperclassmen will lead lectures and training for all members new to a process or software. Before
fabrication begins, all working members will have a meeting with the team President and Safety Officer,
as well as University Officials and EOHS Officers to ensure personal safety. All work to be done with at
least a second fully trained member present at all times, with all members in full, proper PPE.

90
Section VII. Payload Criteria
7.1. Rover Payload Objective
➢ Teams will design a custom rover that will deploy from the internal structure of the launch vehicle
➢ At landing, the team will remotely activate a trigger to deploy the rover from the rocket
➢ After deployment, the rover will autonomously move at least 5 ft. (in any direction) from the launch vehicle
➢ Once the rover has reached its final destination, it will deploy a set of foldable solar cell panels.
It is by the requirements above, by which we designed our autonomous rover. The first bullet point requirement is more of a formality than anything else, specifically due to our rover design and geometry. A customized, original rover not only is a pride and ethics requirement for a competition; but a necessity in any specialized, precision application.
An “off the shelf” autonomous robot wouldn’t be equipped or optimized to handle the terrain,
conditions and solar energy availability it would encounter. Especially with a rover as small as ours, battery power and the space for mounting is at a premium. An unknown terrain means unknown loading on the motors, and therefore power supply. A proper design would move with a purpose, without a large amount unnecessary motions, sequences or steps.
A launch vehicle serves the purpose of any ground-laden vehicle, transportation of precious cargo.
Sometimes that cargo is satellites, relays or resupply provisions for the ISS; other times it’s human astronauts or yes, even rovers. Once the rocket has a successful flight and landing, the vehicle will have done its purpose. It is upon this safe delivery back to solid ground that the team will remotely activate the rover’s deployment; and it will begin its terrain mapping journey.
On the following page is the pseudocode by which the rover’s operating script will be written. This has served as an excellent resource and reference document during these initial design phases. It has allowed us to easily describe the functionality and action sequences with Akronauts members on other sub-teams.
The experiment, and rover mission success is determined by the below sequence of steps. The
sequence is written such that each step task could be accomplished by variety of mechanisms, allowing for alternative designs.
91
NASA Mars Rover Pseudocode Sequence:
1. Rocket Touchdown, come to rest, a. Rocket altimeters, GPS, redundant verification required
2. Eject rover command given/received remotely a. Phone ping, Bluetooth or WIFI communication command method.
3. Rover ejects, and comes to rest a. “Rest” verified by rover on-board chip. Arbitrary 3sec for 0 movement wait time?
4. Deploy 3rd Idle wheel. [ Optional design feature step, best alternative to Primary model] a. If spring loaded, may automatically deploy once clear of payload bay/friction sheath
5. Rover gets its bearings – 360deg rotation of rover a. Discovers rocket location (ping transmitter in electronics bay?) b. Discovers own location relative to rocket c. Grid coordinate map created. d. Gradient map of local terrain made for navigation- avoid high grade hill/ terrain
6. Rover plots “runaway” plan a. As close to 180deg turn from rocket location as possible
7. Traverse Terrain a. Constantly ping electronics bay for updated location. Think opposite of “Marco Polo”. b. Ping every 2-5 sec c. Re-correct course to “B-Line away”
i. Power supplied to drive servos dependent on load and battery constraints ii. Travel speed can be slow, must not have battery die from loading
8. Come to Stop a. Rover determined minimum distance covered from Rocket (electronics bay transmitter)
5ft min for NASA, 10ft min for Internal Leads b. 360deg rotation again (to ensure best level terrain to come to rest) c. If light sensor equipped, determine highest lumen value (associated to an angle degree
from 12noon pointed at the rocket) 9. Deploy Solar Panels
a. Light sensor [Optional]: Orient self to brightest possible light hitting sensor/ solar panel b. Deploy solar panel (activate latch mechanism release)
i. Primary design is spring loaded, with servo actuated release 10. Hibernation Mode
a. Rover set to battery saving hibernation mode b. Solar panel not required to charge main battery --- Will be charging “backup battery”
i. This gives two distinct circuits, hits constraint of solar panel functionality ii. Eliminates concern of latent charge/ parasitic voltage of solar panel system on
rover power supply

92
7.2. Alternative Payload Designs
7.2.1. 4 Wheeled Design, IR Navigation, Spring Load Solar Deployment
The Four wheeled design was our second ranked alternative for transportation method. The benefits being the sheer power behind the four-wheeled design. With a drive system connected on all four wheels provides a higher torque than fewer wheeled designs. They also offer greater contact area with the terrain benefited. A softer tilled soil (like the farms of last year’s NASA SL launch site), sand or a similar terrain benefit from the greater surface area, in distributing load and preventing the wheels to sink into the ground.
A major downside of this design is the geometry and “real estate” the body of the rover would take up. More wheels mean higher motor loading and required torque output, due to the added weight requirements. This would need larger (or more) batteries, adding more weight in a relative vicious circle.
This alternative would require correct orientation at all times to operate and transport across terrain. An arm was designed to “right” the rover in the event it is tipped over, or deployed from the payload bay upside down.
Figure 56 – 4 wheeled alternative rover design rendered using SolidWorks
Figure 57 – 4 wheeled alternative rover design with self-righting arm engaged rendered using SolidWorks

93
7.2.2. 3 Wheeled Design, Sonar Navigation, Linkage Solar Deployment
The above deployable 3rd wheel design is a similar concept to our primary, self-balancing
design. It features the same overall body components, as well as drive system and current main wheel
design. The variance comes in the deployment methods of the solar panels and 3rd balancing “Idler”
wheel. This design also features a Sonar navigation system, which will be adapted to the primary design
via an Ultrasonic Range Finder. This alternative uses the ultrasonic system as the primary sensor input.
The downside is the additional servo motor, or power transmission requirements due to the
added actuation features. The solar panel linkage would need wither an entirely dedicated servo, or
controllable PTO (power take off) for arm control. It would need another, stronger servo to deploy and
rotate the 3rd wheel from its closed position, at least 180deg to open. It would then require constant
input to hold locked in place in its “deployed” orientation. This would again add a massive load on
power consumption, requiring more battery power, adding weight and again going around in a vicious
circle of power optimization.
Figure 59 – 3 wheeled alternative rover design rendered using SolidWorks
Figure 58 – 3 wheeled alternative rover design with 3rd “idler” wheel deployed rendered using SolidWorks

94
7.2.3. Hamster Ball Design, IR Navigation, Spring Load Solar Deployment
The hamster ball alternative design as an interesting concept presented, but traction, mobile
transportation issues, limited deployment methods and sensor depth of vision prevented further
development of this alternative.
The benefits to this design were its’ guaranteed self-righting functionality. With a low CG, and
only contact with the inside walls, the rover would inherently want to be right side up during travel.
Concerns arose with the ball material opacity, and continued opacity over travel. If the sensor couldn’t
“see” though the material (whether clean or caked with debris from the terrain), the design would be a
failure. This material, if unable to convey IR sensor inputs would also be unable to charge the solar
panels well, yet again being a design failure.
Another issue with the design is that the solar panels are located inside of the rover. Light passing
through the walls of the ball -although transparent- will decrease the efficiency of the solar panels,
causing another mode of failure.
There were also the issues of terrain transportation. The low torque servos, lack of contact area for
traction, and easy opportunity to be “dug in” with soft soil. The con’s outweighed to pro’s on pursuing
this prototype design.
Figure 60 – Hamster Ball alternative rover design rendered using SolidWorks

95
7.2.4. Tread Tank Design, Bump Sensor, Shrug
The bump sensor, and tread design earned the nickname “blind tank”. While not actually
traveling blind, due to the two additional IR sensors, the primary input would be large area bump sensor
at the front of the rover.
This rover platform, would have practically no clearance and could be beached on a hill, as well
as being incredibly heavy and influencing overall aerostructure design of the launch vehicle itself.
This was designed to be a powerhouse, with a large amount of “real estate” on the rover frame for large
servos and the required power supply to move.
Overall, with the limited navigation method and overall un-refined transport method of “bump and
turn” as the primary iterative loop; we deceived to not pursue this rover platform further.
Figure 61 – “Blinkd Tank” rover design rendered using SolidWorks

96
7.3. Primary Designs
Figure 62 – Primary Rover Design
After evaluating all of the main design features using the Payload Design Matrix (Found later in
document), we concluded with what we felt to be the strongest platform for our Rover.
This design is a two-wheeled, self-balancing rover with the option for a third, deployable idle wheel.
This design platform is our primary for a few reasons, chief among them being surface contact and
interacting with an unknown terrain and surface. A mobile vehicle’s success depends upon its ability to
navigate the terrain it is found in, if that terrain is unknown then the vehicle must be able to
accommodate any and all reasonable possibilities.
In terms of physical geometry, the design’s surface interaction is two, “soil tread” 1.5” wide wheels.
These are lightweight, 3D printed material, with tread features conductive to climbing gradient terrain
hills of light density material “underfoot”. They are 4.75” diameter, and fill the entirety of useable space
on the inner diameter of the payload bay of the rocket. The bay’s current design actually has a 5”
diameter at the base of the bay to accommodate the ejection system, but there is a coupler between
the nosecone and payload ejection area at the top of the bay to account for.

97
The rover frame and body are the highest of our alternative designs, at about two inches. This
clearance distance is the biggest benefit to the large-wheeled, small bodied rover design. This gives us
the ability to travel over tougher unknown terrain, with larger and more debris to travel around. A high
clearance allows our rover to be a “rock climber” if need be, with the best avoidance chance of being
beached on a hill or surface edge.
The solar panel deployment mechanism will be a torsion spring loaded plate, rotating around a thin
steel axel. The latching mechanism will be a small servo/dc motor with a small aluminum piece holing
down the solar panel plate. This will be released following the Rover Pseudocode once it has traveled
the required distance. The navigation system and sensor array are discussed under the Electronics
Overview.
7.3.1. Failure Modes
All designs have challenges to overcome, and to operate as if the design was perfect would be naive.
The lightweight nature of the rover, and mobility platform leads to a few concerns that must be
addressed.
Due to the self-balancing nature of the bot, the current design only has a few ways it could be
rendered immobile. One simple way is debris in the wheel spoke. If launched at the same farm as last
year’s NASA SL event, there could likely be twigs and objects that could be lodged in the rover.
Another is rover ability to climb a steep grade hill. If at the farm, there could be freshly tilled ground,
with steep terrain for the rover to traverse. A light rover body, rotating free around an axis could simply
spin around the wheels if that offers less resistance than climbing a hill. The current primary rover
design is estimated to weigh, at max around 5lbs. When balancing the CG close to the rotary axis as we
are, there is little moment arm and little resistive inertia to rotation. Testing will determine the
likelihood of this event and concern. If found to be an issue, a fix is already in development.
The body has a cavity designed to accommodate a free rotating spring-damper system to support a
third “Idle” unpowered wheel depicted below. This wheel would spring out and deploy as the rover
ejects and clears the payload bay. This wheel system, with the added weight would help the gyroscope
keep the rover orientated, as well as traction.
Figure 63 – Primary Rover Design with removeable 3rd
“Idle” wheel

98
This body cavity for the spring-damper shocks would limit movement, while the shocks
themselves would be held in place with a tension spring. This system would inherently make the third
wheel always “want” to be fully deployed, while the spring-damper would offer some “give” for bumpy
terrain transport. This extended arm features also offers a contact point for the drive servos to torque
against, allowing for higher grade terrain climbing abilities.
This design is being developed to address a specific mobility concern, as a secondary attachment
that would not need included on all rover missions. A simple installation, and running an adapted
program and the rover would accomplish the same mission.
7.3.2. Electronics Overview
A Raspberry Pi 3 Model B is the core key to the success of the payload rover. It will control the self-
balancing rover. All chips and sensors will feed into the Raspberry Pi at which processing will occur.
The MinIMU-9 v5 Gyro, Accelerometer, and Compass chip will help the rover balance. Input from
this chip will be sent to the Raspberry Pi. The Raspberry Pi will process this information and data will be
sent to the motors to keep the rover balanced.
Both an ultrasonic sensor along with IR sensors will be used to determine a path clear of obstacles
and are compatible for use with a Raspberry Pi 3.
The onboard ultrasonic sensor will use sound waves to measure distance from objects. By
knowing the speed of sound in meters per second is 340, we can convert the units and gather the
distance away from an object by using the following formula: Distance = (Time x Speed of Sound)/2.

99
Two onboard IR sensors will provide additional support for obstacle avoidance in front of the
rover. The IR sensors can sense a maximum distance of 40 cm away and a minimum distance of 2cm
away. This will provide a more accurate depiction of shorter distance sensing.
After receiving the data from the onboard chip and sensors, the device will make smart
decisions on where to travel based on the behind the scenes code written for the device. The code for
the autonomous rover will be written in python.
7.4. Schematics, Drawings and Figures
Remainder of page intentionally left blank.

100

101

102
MiniIMU-9 v5 Gyro Accelerometer Compass Schematic

103

104

105

106

107
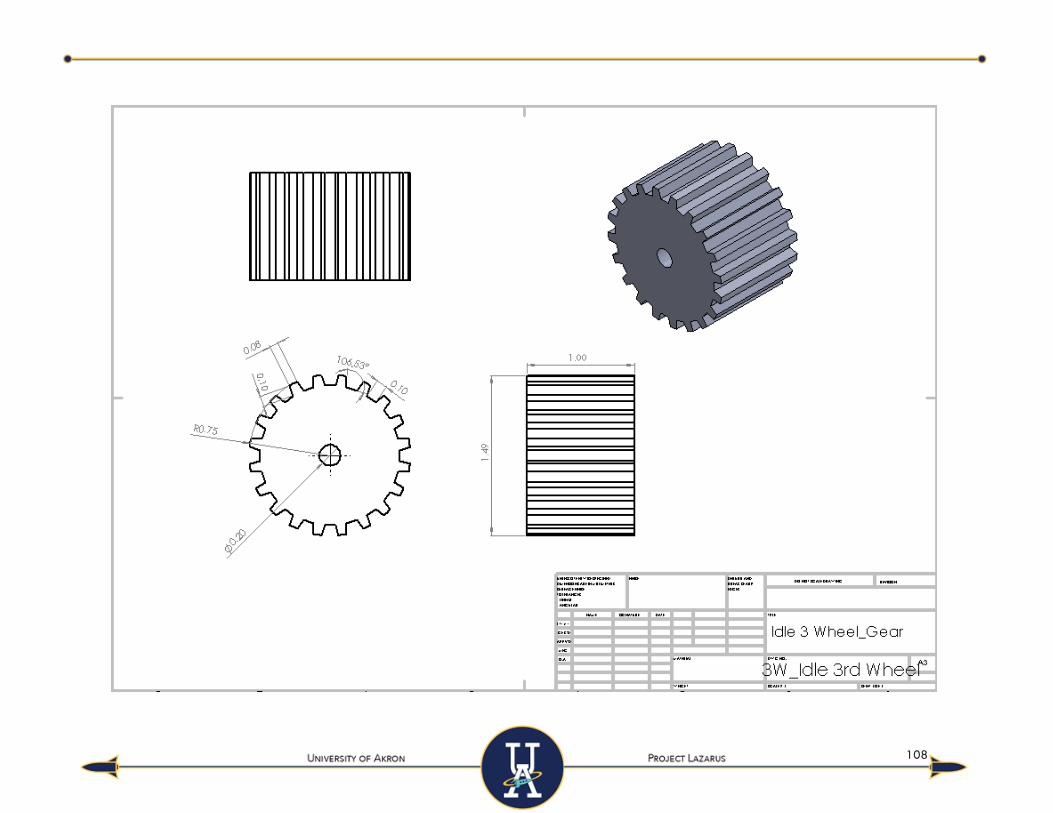
108

109
Ease of
Electronics
design
Ease of
Fabrication Experience Reliability
Space
Effeciency Total
Lead
Rank Tech Lead Decision
0.3 0.3 0.1 0.1 0.2 1
2 Wheel (Self
Balancing) 1 6 6 7 9 5.2 * 1Drive and control wheels
3 or 4 Wheel 6 3 10 6 4 5.1 ** 2 Third wheel "idler" as stop point
Treads 5 2 1 6 6 4
Skates/sleds 3 4 1 4 4 3.4
Hamster Ball 1 5 5 7 10 5 *** 3 would be tough with constantly reversing servos/ stepper servos
Ease of
Electronics
design
Ease of
Fabrication Experience Reliability
Space
Effeciency Total
Lead
Rank Tech Lead Decision
0.5 0.1 0.2 0.2 1
IR 7 8 10 6 7.5 * 1 Used in reference drone, best option
Kinect 2 2 1 10 3.4 *** no redunant...uses IR
Bump Sensors 7 1 10 1 5.8 ** 2 good secondary sensor for physical impedance
LIDAR 1 2 1 10 2.9
Sonar 1 1 1 10 2.8 3 Another good broadcast sensor for an "array"
Ease of
Electronics
design
Ease of
Fabrication Experience Reliability
Space
Effeciency Total
Lead
Rank Tech Lead Decision
0.2 0.5 0.3 1
Spring Loaded 10 10 10 10 ** would need a physical latch to hold...latch to be controlled via
Servo 10 8 9 8.7 1
Magnetic 7 10 9 9.1 2
Hydraulic 5 5 8 5.9 no hydraulic system requires pressure vessel, pressure/load rated lines, tough troubleshooting
Linkage 9 7 9 8 these two are redundant,and simply power transmission
Pulley 5 5 7 5.6
Gravity 10 3 10 6.5 no Not controlable/ positive lock feature
***10 is most desireable
AKRONAUTS NASA ROVER DESIGN MATRIX
Method of
Transportation
Navigation System
Solar Panel
Deployment

110
7.5. Design Matrix
The above Payload Design Matrix was how decisions were made between alternative rover features.
The key factors were weighted out of one, as not all constraints are as critical to base function. While
space efficiency, reliability and experience are all important factors, our ability to fabricate and code the
component were the highest weighted. Final decisions were ranked and commented on, before primary
designs were finalized.
7.5.1. Payload Ejection System Overview
The ejection system for the rover deployment from the rocket is currently based around are
relatively large compression spring. This spring will be mounted to the payload bay’s lower bulkhead and
provide a base to be thrust against for rover ejection. The spring will have a thin aluminum thrust plate
in flush contact with the rover’s wheel side when stowed in the payload bay. The thrust plate and
spring’s compressed overall length will be no more than two inches to properly fit in the payload bay.
The payload itself must be ejected through the nosecone coupler, which lessens the clearance ID for
deployment. We will likely extend this coupler ID through the whole payload bay to ensure a smooth
bore, and easy deployment of the Rover.
As the black powder charge goes off and pressurizes the payload bay, the nosecone will eject
and separate from the rest of the landed rocket body. This release of the nosecone will release the
compressed spring and allow the thin thrust plate to push the rover out of the top of the bay. It is once
deployed and the rover recognizes, “stationary” that it will begin its mission and maiden voyage on an
unknown surface.

111
Section VIII. 6. Project Plan
8.1. 6.1. Requirements Compliance
8.1.1. Vehicle Verification Plan
Requirement Verification Plan
The vehicle will deliver the payload to an apogee altitude of 5,280 feet above ground level (AGL).
Document all weights for all parts of the launch vehicle for center of gravity calculations. Team will use hand calculations along with OpenRocket and RASAero for accurate flight simulations. Test flights will aid in verifying the precision. The option of air brakes will be researched and two stability ballast locations have been established in effort to minimize the error in achieving the target apogee.
The vehicle will carry one commercially available, barometric altimeter for recording the official altitude used in determining the altitude award winner. Teams will receive the maximum number of altitude points (5,280) if the official scoring altimeter reads a value of exactly 5280 feet AGL. The team will lose one point for every foot above or below the required altitude.
Launch vehicle will carry at least two commercial barometric altimeters for redundancy. Launch vehicle will be designed with the goal of achieving the desired altitude of 5,280 feet AGL.
Each altimeter will be armed by a dedicated arming switch that is accessible from the exterior of the rocket airframe when the rocket is in the launch configuration on the launch pad.
Launch vehicle will have opening on the body tube in line with the internally mounted switches to arm the altimeters while in the launch configuration on the launch pad.
Each altimeter will have a dedicated power supply. Each altimeter will have its own 9 volt battery.
Each arming switch will be capable of being locked in the ON position for launch (i.e. cannot be disarmed due to flight forces).
The arming switches will be able to be locked to prevent flight forces from changing their orientation.
The launch vehicle will be designed to be recoverable and reusable. Reusable is defined as being able to launch again on the same day without repairs or modifications.
Launch vehicle will utilize GPS trackers to aid in recovery during flight and landing. Parachutes will be designed to allow a low speed, damage free landing that would allow the launch vehicle to be reused without repairs or modifications.

112
The launch vehicle will have a maximum of four (4) independent sections. An independent section is defined as a section that is either tethered to the main vehicle or is recovered separately from the main vehicle using its own parachute.
The launch vehicle will comprise of two independent sections. payload section and booster section. These two sections will be tethered together. The nose cone will separate upon landing to allow the payload to eject from the upper body of the rocket.
The launch vehicle will be limited to a single stage. Launch vehicle motor selection will allow for target altitude of 5280 feet AGL to be reached with only one stage.
The launch vehicle will be capable of being prepared for flight at the launch site within 3 hours of the time the Federal Aviation Administration flight waiver opens.
A clear launch procedure checklist will be created and practiced to ensure that the launch vehicle setup can be completed within the required amount of time.
The launch vehicle will be capable of remaining in launch-ready configuration at the pad for a minimum of 1 hour without losing the functionality of any critical on-board components.
All batteries and power supplies will be selected to allow for successful powering of all electronic systems for an extended period of time.
The launch vehicle will be capable of being launched by a standard 12-volt direct current firing system. The firing system will be provided by the NASA-designated Range Services Provider.
Launch vehicle will use commercial igniters provided by Cesaroni utilizing a standard 12 volt direct current firing system.
The launch vehicle will require no external circuitry or special ground support equipment to initiate launch (other than what is provided by Range Services).
Launch vehicle will be designed without the requirement of external circuitry or special ground support equipment to initiate launch.
The launch vehicle will use a commercially available solid motor propulsion system using ammonium perchlorate composite propellant (APCP) which is approved and certified by the National Association of Rocketry (NAR), Tripoli Rocketry Association (TRA), and/or the Canadian Association of Rocketry (CAR).
Launch vehicle will use a Cesaroni L1350 motor for its full-scale launch vehicle.

113
Pressure vessels on the vehicle will be approved by the RSO and will meet the following criteria:
➢ The minimum factor of safety (Burst or Ultimate pressure versus Max Expected Operating Pressure) will be 4:1 with supporting design documentation included in all milestone reviews.
➢ Each pressure vessel will include a
pressure relief valve that sees the full pressure of the valve that is capable of withstanding the maximum pressure and flow rate of the tank.
➢ Full pedigree of the tank will be described, including the application for which the tank was designed, and the history of the tank, including the number of pressure cycles put on the tank, by whom, and when.
The current vehicle design does not include any pressure vessels. If the design is modified to include a pressure vessel in the future, NASA and the RSO will be notified and the outlined criteria will be met.
The total impulse provided by a College and/or University launch vehicle will not exceed 5,120 Newton-seconds (L-class).
Launch vehicle will utilize a Cesaroni L1350 motor with total impulse of 4263.1 Newton seconds.
The launch vehicle will have a minimum static stability margin of 2.0 at the point of rail exit. Rail exit is defined at the point where the forward rail button loses contact with the rail.
Launch vehicle static stability margins of at least 2.0 will be verified with hand calculations, OpenRocket and RASAero. The current launch vehicle design has a static stability margin of 2.24 in both OpenRocket and RASAero.
The launch vehicle will accelerate to a minimum velocity of 52 fps at rail exit.
The current estimated 8ft rail exit velocity is 55.8 fps using OpenRocket and 56.2 fps using RASAero.
All teams will successfully launch and recover a subscale model of their rocket prior to CDR. Subscales are not required to be high power rockets.
The team plans to design a 3:5 scaled model of the full scale launch vehicle for verification of stability and integration of systems.

114
All teams will successfully launch and recover their full-scale rocket prior to FRR in its final flight configuration. The rocket flown at FRR must be the same rocket to be flown on launch day. The purpose of the full-scale demonstration flight is to demonstrate the launch vehicle’s stability, structural integrity, recovery systems, and the team’s ability to prepare the launch vehicle for flight. A successful flight is defined as a launch in which all hardware is functioning properly (i.e. drogue chute at apogee, main chute at a lower altitude, functioning tracking devices, etc.).
The full-scale rocket test flight will be flown with all final flight configuration systems and payload with the goal of a successful flight as outlined. This test flight will be treated exactly like the competition flight.
Any structural protuberance on the rocket will be located aft of the burnout center of gravity.
The launch vehicle will be designed so that any protuberance will be located aft of the burnout center of gravity. The burnout center of gravity will be verified using hand calculations, OpenRocket and RASAero. Current burnout CG is 46.033 in. using OpenRocket and 46.5 in from hand calculations.
Vehicle Prohibitions: ➢ The launch vehicle will not utilize forward
canards. ➢ The launch vehicle will not utilize forward
firing motors. ➢ The launch vehicle will not utilize motors
that expel titanium sponges (Sparky, Skidmark, MetalStorm, etc.)
➢ The launch vehicle will not utilize hybrid motors.
➢ The launch vehicle will not utilize a cluster of motors.
➢ The launch vehicle will not utilize friction fitting for motors.
➢ The launch vehicle will not exceed Mach 1 at any point during flight.
➢ Vehicle ballast will not exceed 10% of the total weight of the rocket.
The current launch vehicle is designed while adhering to the list of Vehicle Prohibitions.

115
8.1.2. Team Derived Vehicle Design Verification Plan
Requirement Verification Plan
The launch vehicle must reach an apogee altitude within 50 feet of the team’s best guidance simulation for all test flights and competition flights.
Document all weights for all parts of the launch vehicle for center of gravity calculations. Team will use hand calculations along with OpenRocket and RASAero for accurate flight simulations. Test flights will aid in verifying the precision of each flight software and hand calculations. The two stability ballast locations will be utilized in achieving the target apogee.
The launch vehicle must be analyzed at both a component and assembly level in effort to reduce components to efficient sizes and strengths within given safety factors.
Finite element analysis will be conducted on each component or sub-assembly of concern to determine required sizes and materials. A sample finite element analysis of the thrust plate has been included in this report.
The launch vehicle must be analyzed for drag coefficient and boundary layer.
A 1:10 scale of the launch vehicle will be 3D printed for wind tunnel testing in the University of Akron’s wind tunnel to analyze drag coefficient and possibly boundary layer. Test flight data will also be utilized to determine drag coefficient.
The launch vehicle will utilize air brakes with a feedback loop to determine deployment near apogee if it is determined that the launch vehicle will overshoot its target.
Team will test air brake system in flight readiness review along with drag and boundary layer characteristics from wind tunnel testing.
The launch vehicle must utilize student-built body tubes and nose cone.
Team will research best winding strategies to utilize the team’s X-winder to manufacture the launch vehicle’s body tubes and nose cone. Fracture testing will be considered to determine tube strength depending on team budget and timeline.
The launch vehicle nose cone must resist heat deformation due to high temperatures reached at max speed.
The team will research temperatures the nose cone will reach during flight and determine if the aluminum nose cone tip is sufficient. This research may be more applicable for higher speed rockets, but will serve as a useful resource.
Launch vehicle will be designed for easy assembly of components.
Team will consider methods to design modular systems and components. Team will consider order of assembly in any design decisions. Team will create and follow detailed assembly instructions.

116
8.1.3. Recovery Verification Plan
Requirement Verification Plan
The launch vehicle will stage the
deployment of its recovery
devices, where a drogue
parachute is deployed at apogee
and a main parachute is deployed
at a lower altitude. Tumble or
streamer recovery from apogee to
main parachute deployment is
also permissible, provided that
kinetic energy during drogue-
stage descent is reasonable, as
deemed by the RSO.
Tests are required to verify this requirement. In order to verify
that the launch vehicle will stage the deployment of a drogue
parachute at apogee and a main parachute at a lower attitude,
subscale and full-scale test launches will be conducted with
altimeters that have events set up to ensure that the events for
each parachute occurs at the correct time.
Each team must perform a
successful ground ejection test for
both the drogue and main
parachutes. This must be done
prior to the initial subscale and
full-scale launches.
Tests are required to perform successful ground tests for both
the drogue and main parachutes.
At landing, each independent
sections of the launch vehicle will
have a maximum kinetic energy of
75 ft-lbf.
Analysis is required to determine that each independent section
of the launch vehicle will have a maximum kinetic energy of 75
ft-lbf. In order to determine if the sections will land with the
maximum kinetic energy being 75 ft-lbf, the mass and descent
velocities for the launch vehicle has to be determined. Each
independent section of the rocket will be weighed and the
descent velocities will be calculated to ensure the kinetic energy
is below 75 ft-lbf. If the kinetic energy is over, parachute sizing
will be changed to allow the kinetic energy does not exceed 75
ft-lbf.
The recovery system electrical
circuits will be completely
independent of any payload
electrical circuits.
Inspection is required to verify that the recovery system
electrical circuits will be completely independent of any payload
electrical circuits. Wires will be inspected to ensure that
recovery wires do not cross with any payload wires.
All recovery electronics will be
powered by commercially
available batteries.
Inspection is required to verify that all recovery electronics will
be powered by commercially available batteries. To ensure all
batteries are commercial, batteries will be inspected to see that
the labels are from commercial companies.
The recovery system will contain
redundant, commercially available
Inspection is required to verify that the recovery system will
contain redundant, commercially available altimeters. Two

117
altimeters. The term “altimeters”
includes both simple altimeters
and more sophisticated flight
computers.
RRC2+ Altimeters will be placed in the avionics bay to ensure
that there is redundancy in the recovery system.
Motor ejection is not a
permissible form of primary or
secondary deployment.
Analysis is required to verify that the motor will not be used as a
form of primary or secondary deployment. To ensure the motor
is not used for primary or secondary deployment, black powder
ejection, which will be triggered by the altimeters at the desired
altitudes. The motor will be mechanically fastened to the launch
vehicle and unable to move for the duration of the flight.
Removable shear pins will be used
for both the main parachute
compartment and the drogue
parachute compartment.
Inspection is required to verify that removable shear pins will be
used for the main and drogue parachute compartment. The
launch vehicle will be inspected to ensure that the shear pins are
used. The main and drogue parachutes share the same
compartment, so the shear pins will be in the compartment that
shares the main and drogue parachutes.
Recovery area will be limited to a
2500 ft. radius from the launch
pads.
Analysis is required to ensure that the recovery area is limited to
a 2500 ft. radius. Hand calculations and OpenRocket simulations
will ensure that wind speeds of 0 -mph, 5 -mph, 10 -mph, 15 -
mph, and 20 -mph will not cause the launch vehicle from drifting
more than the 2500 ft. radius from the launch pads.
An electronic tracking device will
be installed in the launch vehicle
and will transmit the position of
the tethered vehicle or any
independent section to a ground
receiver.
Testing is required to ensure an electronic device will be
installed in the launch vehicle and will transmit the position of
the tethered vehicle or any independent section to the ground
receiver. Tests will occur prior to competition to verify tracking
devices are properly configured and protected during the flight
of the rocket. A quick verification of the system will be
performed prior to launch ensuring GPS satellites are locked
before loading into the rocket. A quick voltage test will be
performed on the battery to verify the battery is charged and in
a suitable level to maintain contact during the launch and
recovery phases.
Any rocket section, or payload
component, which lands
untethered to the launch vehicle,
will also carry an active electronic
tracking device.
Inspection is required to ensure that any of the rocket section,
or payload component, which lands untethered to the launch
vehicle will also carry an active electronic tracking device. The
current design does not have any section or component that is
untethered from the rocket. If the design changes, in order to
ensure this requirement, any section that lands untethered to
the launch vehicle will have an active electronic tracking device.
The recovery system electronics
will not be adversely affected by
Tests are required to ensure that the recovery system
electronics will not be adversely affected by any other on-board

118
any other on-board electronic
devices during flight (from launch
until landing).
electronic devices during flight (from launch until landing).
Ground ejection tests will be conducted to ensure recovery
electronics will not be affected by any other on-board electronic
devices.
The recovery system altimeters
will be physically located in a
separate compartment within the
vehicle from any other radio
frequency transmitting device
and/or magnetic wave producing
device.
Analysis is required to ensure that the recovery system
altimeters will be physically located in a separate compartment
within the vehicle from any other radio frequency transmitting
device and/or magnetic wave producing device. The avionics bay
is constructed to ensure that the altimeters will not be
interfered with radio frequency transmitting devices and/or
magnetic wave producing device.
The recovery system electronics
will be shielded from all onboard
transmitting devices, to avoid
inadvertent excitation of the
recovery system electronics.
Tests are required to ensure the recovery system electronics will
be shielded from all on board transmitting devices, to avoid
inadvertent excitation on the recovery system electronics. Tests
are performed and proper shielding will be given to onboard
transmitters. Prior testing will ensure no adverse effects will
occur such as inadvertently exciting the recovery system
electronics. Therefore, removing the issue of setting off the
recovery system mid-flight.
The recovery system electronics
will be shielded from all onboard
devices which may generate
magnetic waves (such as
generators, solenoid valves, and
Tesla coils) to avoid inadvertent
excitation of the recovery system.
Tests are required to ensure the recovery system electronics will
be shielded from all onboard devices which may generate
magnetic waves to avoid inadvertent excitation of the recovery
system. Tests are performed and proper shielding will be given
to all onboard devices which generate magnetic waves or
produce a magnetic field. Testing will ensure no adverse effects
will occur to the recovery system electronics.
The recovery system electronics
will be shielded from any other
onboard devices which may
adversely affect the proper
operation of the recovery system
electronics.
Tests are required to ensure the recovery system electronics will
be shielded from any other onboard devices which may
adversely affect the proper operation of the recovery system
electronics. In doing so, removing the possibility of magnetic
interference due to waves. Recovery system electronics will be
electrically isolated from other systems to ensure no
interference with the essential recovery system.
Table 43 - Recovery System Design Verification Plan

119
8.1.4. Team Derived Recovery Verification Plan
Requirement Verification Plan
Objective The recovery system will need to be tested to verify a safe and reliable
recovery is achieved.
Verification Calculations have been performed to determine the minimum amount of
necessary force to eject the parachutes for both stages of deployment.
Calculations have also been performed to ensure that the parachutes are
large enough to reduce the descent to a safe speed. These calculations have
been verified through peer-reviews.
Verification Methods Prior to the sub-scale launch, a ground test will be done. The main and
drogue black powder ejection systems will be artificially triggered to verify
the amount of black powder calculated will be a sufficient amount for each
system’s full deployment. To verify the calculations are accurate for the
descent of the launch vehicle, the sub-scale rocket will be launched and data
will be collected through on-board altimeters.
Inspection After the launching of the sub-scale rocket, all lines and canopies will be
inspected for any signs of damage: tangling, debris, burns, or any other
defects that may have been caused during the launch.
Success All sections of the rocket impact the ground without causing damage to the
launch vehicle.
Failure The launch vehicle is damaged.
Table 44 – Recovery System Design Team Derived Requirements

120
8.1.5. Payload Verification Plan
Requirement Verification Plan Each team will choose one design experiment option from the following list.
Option 1 Target Detection
Option 2 Deployable Rover
Option 3 Landing Coordinates via Triangulation
The team plans to design and launch a deployable rover.
Teams will design a custom rover that will deploy from the internal structure of the launch vehicle.
A demonstration is required to verify this requirement. We plan to design a rover and deployment system that will fit inside the internal structure of the launch vehicle. We plan to meet this requirement by creating full scale 3D models of the payload, ejection system, and launch vehicle and then digitally assembling them to ensure that the rover and ejection system can be housed internally in the launch vehicle before the rover is constructed. Following the fabrication of the rover, ejection system, and launch vehicle, the components will be assembled to ensure that they will be housed internally and then an ejection test will be performed to verify that the rover will deploy from the internal structure of the launch vehicle. At the Launch Readiness Review, a demonstration will be done to verify that the assembled components meet the requirement.
At landing, the team will remotely activate a trigger to deploy the rover from the rocket.
A demonstration is required to verify this requirement. We plan to do an ejection test after the fabrication/acquisition of the required components, and before each launch that the rover will be involved in. These ejection tests will be done with no direct connections to the launch vehicle, payload, or ejection system components. At the launch site, a demonstration of an ejection test will be done to verify that the rover will be remotely deployed.
After deployment, the rover will autonomously move at least 5 ft. (in any direction) from the launch vehicle.
A demonstration is required to verify this requirement. We plan to equip the rover with sensors and code it to avoid the launch vehicle and other large objects, and to travel a distance greater than 5 feet from deployment or

121
the last object was detected, whichever is most recent. This will be verified through demonstration at the launch site, following the recovery of the launch vehicle.
Once the rover has reached its destination, it will deploy a set of foldable solar cell panels.
A demonstration is required to verify this requirement. We plan to code the rover to fold open a panel lined with solar panels after traveling the desired distance. This will be verified through demonstration at the launch site, following the recovery of the launch vehicle.
Table 45 - Experiment Requirements Verification Plan
8.1.6. Team Derived Payload Verification Plan
Requirement Verification Plan The payload must be capable of traversing a 30% incline or decline.
A test is required to verify this requirement. We anticipate that the site at which the rover will be deployed will not be entirely level. As such, we plan to make the rover capable of traversing any incline or decline up to 30%. To verify this capability, we will do autonomous tests on terrain with varied topography that meets our slope requirements.
The payload must be capable of avoiding large objects.
A test is required to verify this requirement. To ensure that the payload meets the experiment requirement of traversing at least 5 feet from the deployment point, we plan on incorporating sensors and coding that enables the rover to detect and avoid large obstacles such as parts of the launch vehicle. This capability will be verified through testing by placing large objects around the rover and letting it autonomously navigate through them.
Table 46 –Team Derived Payload Requirements
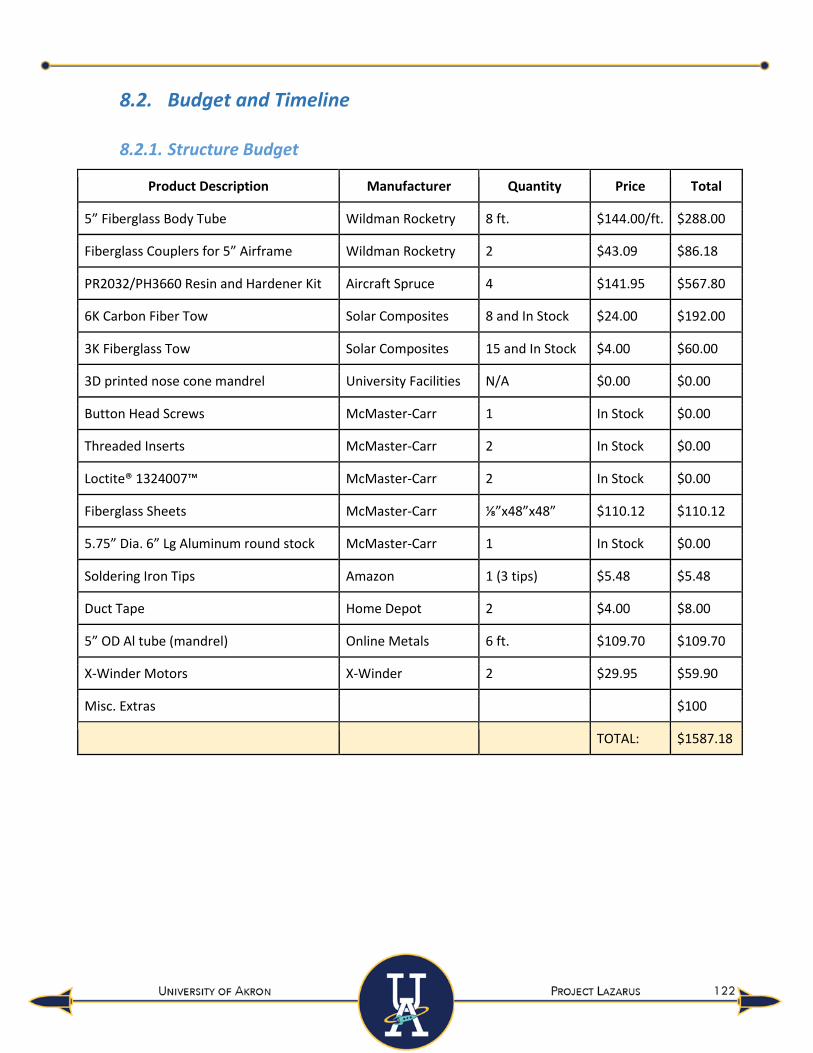
122
8.2. Budget and Timeline
8.2.1. Structure Budget
Product Description Manufacturer Quantity Price Total
5” Fiberglass Body Tube Wildman Rocketry 8 ft. $144.00/ft. $288.00
Fiberglass Couplers for 5” Airframe Wildman Rocketry 2 $43.09 $86.18
PR2032/PH3660 Resin and Hardener Kit Aircraft Spruce 4 $141.95 $567.80
6K Carbon Fiber Tow Solar Composites 8 and In Stock $24.00 $192.00
3K Fiberglass Tow Solar Composites 15 and In Stock $4.00 $60.00
3D printed nose cone mandrel University Facilities N/A $0.00 $0.00
Button Head Screws McMaster-Carr 1 In Stock $0.00
Threaded Inserts McMaster-Carr 2 In Stock $0.00
Loctite® 1324007™ McMaster-Carr 2 In Stock $0.00
Fiberglass Sheets McMaster-Carr ⅛”x48”x48” $110.12 $110.12
5.75” Dia. 6” Lg Aluminum round stock McMaster-Carr 1 In Stock $0.00
Soldering Iron Tips Amazon 1 (3 tips) $5.48 $5.48
Duct Tape Home Depot 2 $4.00 $8.00
5” OD Al tube (mandrel) Online Metals 6 ft. $109.70 $109.70
X-Winder Motors X-Winder 2 $29.95 $59.90
Misc. Extras $100
TOTAL: $1587.18

123
8.2.2. Subscale Rocket Budget
Product Description Manufacturer Quantity Price Total
Cesaroni Pro54 1364-K454-19A Cesaroni Technologies 1 $114.99 $114.99
3” fiberglass body tube Wildman Rocketry 6 ft. $123.06 $123.06
Fiberglass Couplers for 3” Airframe Wildman Rocketry 2 $13.85 $27.70
Button Head Screws McMaster-Carr 1 $8.71 $8.71
Threaded Inserts McMaster-Carr 2 In Stock $0.00
Loctite® 1324007™ McMaster-Carr 2 In Stock $0.00
1/4x6x36 Balsawood Sheets Balsa Wood Inc. 2 $4.94 $9.88
5.75” Dia. 6” Lg Aluminum round stock McMaster-Carr 1 In Stock $0.00
6K Carbon Fiber Tow Solar Composites 4 In Stock $0.00
3K Fiberglass Tow Solar Composites 5 $4.00 $20.00
PR2032 Resin Aircraft Spruce 1 $99.75 $99.75
PH3660 Hardener Aircraft Spruce 1 In Stock $0.00
3D printed Nose Cone mandrel University Facilities N/A $0.00 $0.00
TOTAL: $404.09

124
8.2.3. Payload Budget
Product Description Manufacturer Quantity Price Shipping Total
Raspberry Pi 3 Model B Seeed Technology Co., Ltd 2 $44.63 $3.39 $92.65
Breadboard with Jumper wires PAXCOO 2 $11.99 $0.00 $23.98
Extra Tall 2x13 Female Header Adafruit 4 $1.75 $4.53 $104.53
Brass M2.5 Standoffs for Pi HATS 2-Pack Adafruit 4 $0.75
Adafruit DC & Stepper motor HAT for Raspberry Pi - Mini kit
Adafruit 4 $22.50
DC Motor RobotShop 8 $1.79 $2.99 $17.29
IR Sensor for Raspberry Pi 2-Pack Keyestudio 2 $6.95 $3.39 $17.29
HC-SR04 Ultrasonic Range Sensor ModMyPi 2 $6.37 $0.00 $12.74
MinIMU-9 v5 Gyro, Accelerometer Pololu 2 $15.95 $3.95 $35.85
22 AWG (Red) Consolidated Electronic 1 $7.95 $5.00 $20.90
22 AWG (Black) Consolidated Electronic 1 $7.95
Resistor Variety Pack Misc 2 $12.00 $3.00 $27.00
Solar Panels Sundance Solar 4 $6.95 $0.00 $27.80
Spring Lee Spring 1 $23.76 $9.16 $32.92
Black Powder (in grams) In Stock (Recovery) 6 $0.00 $0.00 $0.00
Rechargeable AA Batteries 4-Pack Energizer 2 $9.59 $0.00 $19.18
Torsion spring (10-Pack) Witbot 1 $6.99 $0.00 $6.99
Small Metal Rod (3ft) McMaster-Carr 1 $2.89 $0.00 $2.89
Thin aluminum plate McMaster-Carr 1 $13.37 $0.00 $13.37
3D Printed Wheels University Facilities 2+ $0.00 $0.00 $0.00
3D Printed Body University Facilities 1+ $0.00 $0.00 $0.00
3D Printed Solar Panel Plate University Facilities 1+ $0.00 $0.00 $0.00
TOTAL: $455.40
Table 47 - Payload Budget

125
8.2.4. Recovery Budget
Product Description Manufacturer Quantity Unit Cost Total Cost
RipStop Nylon Material Ripstop By The Roll 60 $6/yd $360
Sewing Kit (Needle, Thread, Etc.) JoAnn Fabrics 3 $5 $15
¾” Shock Cord Strapworks 68 $0.35/ft $24
½” Harness Fruity Chutes 2 $42 $84
Shroudlines Fruity Chutes 289 $0.20/ft $58
⅜” Connection Line Strapworks 20 $0.23/ft $5
RRC2+ Altimeter Missile Works 2 $45 $90
U-Bolt Fruity Chutes 2 $9 $18
Small Swivel (3 pack) Fruity Chutes 1 $9 $9
Large Carabiner McMaster 2 $18.10 $36.20
Small Carabiner McMaster 5 $4.10 $20.50
Black Powder Bass Pro Shop 1 $30 $30
TOTAL: $749.70
Table 48 - Recovery Budget
8.2.5. Travel Budget
Product Description Quantity Unit Cost Total Cost
Campground Expenses 4 $250/night $1,000
Van Rental 3 $280/van $840
Truck Rental 1 $280/truck $280
Gas 4 $600/car $2,400
Fuel Shipment 1 $150 $150
TOTAL: $4,670

126
8.2.6. Funding Plan
The Akronauts Rocket Design Team’s major source of funding comes from the University of Akron’s
College of Engineering. The Akronauts give a Budget Request to the University’s department at the very
beginning of the fall semester, requesting funds for the entirety of the academic year. This year, the
team expects to receive about $6,500 from the University to support the launch vehicle and its payload.
On top of this funding, the Akronauts applied for travel funds from the University’s Student Organization
Resource Center (SOuRCe). The request was for a total of $2,000 that may be applied to the student’s
travel.
On top of The University’s support, the team strives to gain extra funds in scenarios where they may
upgrade tools and equipment for their facility or bring more students to competitions. In this case, the
team sells space on the rocket for smaller supporters such as family members or friends. The space sold
is then used for a decal of the supporter’s name. Rocket Space is typically sold for between $50-$100
and can raise a total of between $250-$1,000.
Figure 64 – Supporters name’s shown on one of the Akronauts rockets, Zion

127
The Akronauts also host several fundraising events; including partnering with local restaurants.
Because the Akronauts have such a large presence on campus and because the team has done
exceptional community outreach and community service for the Akron/Cleveland area, the team is able
to invite many members of the public to engage in a local restaurant fundraiser. See the flyer below as a
reference.
Figure 65 – Flyer created and used by the Akronauts to encourage the community to eat at Pizza Fire, a local
pizzeria in Akron, Ohio.

128
At this moment in the Akronauts’ design phase, the team is only able to anticipate the amount of
funding that will be received. The team will know exact amounts gifted from the University -the team’s
largest sponsor- by the end of November 2017.
Funding Requested Amount
The University of Akron College of Engineering $6,500
The University of Akron SOuRCe $2,000
Fundraising $500
Sponsorships $2,000
TOTAL: $11,000
8.2.1. Total Budget
System Total Cost
Structure (-$1,587.18)
Subscale Rocket (-$404.09)
Payload (-$455.40)
Recovery (-$749.70)
Travel (-$4,670.00)
Anticipated Funding $11,000.00
TOTAL: $3,133.63
After all expenses and funding have been taken into consideration, the Akronauts are projected to
have $3,133.63 left over. This funding will be used for the team’s research and development as well as
replacing any broken tools or equipment. This funding will also be accessed in the cases of an
emergency, such as an unsuccessful test launch in which the team must hastily repair any damaged
parts of the launch vehicle and its payload.

129
8.3. Timeline
Task Name Duration Start Finish
NASA Student Launch 156 days Mon 9/11/17 Mon 4/16/18
Safety 156 days Fri 9/15/17 Fri 4/20/18
Compliance/Requirements 2 days Fri 9/15/17 Mon 9/18/17
Unmanned Rocket Launches 1 day Fri 9/15/17 Fri 9/15/17
Procedures for NAR/TRA Personnel 1 day Fri 9/15/17 Fri 9/15/17
NAR Safety Requirements 1 day Fri 9/15/17 Fri 9/15/17
Hazard Recognition 112 days Thu 9/14/17 Fri 2/16/18
Accident Avoidance 2 days Fri 9/15/17 Sun 9/17/17
Pre-Launch Briefings 3 days Thu 9/14/17 Sun 9/17/17
Personnel Hazard Analysis 6 days Mon 9/18/17 Mon 9/25/17
Hazards Ranking w/Likelihood and Severity 11 days Mon 10/2/17 Mon 10/16/17
MSDSs 11 days Mon 10/2/17 Mon 10/16/17
Data Justifying Rankings 11 days Mon 10/2/17 Mon 10/16/17
FMEA of Proposed Design 6 days Mon 10/16/17 Mon 10/23/17
Warning of Hazards from Missing a Step 47 days Wed 11/1/17 Thu 1/4/18
Update Fail Modes and Effects Analysis 25 days Mon 1/15/18 Fri 2/16/18
Environmental Concerns 111 days Mon 9/18/17 Mon 2/19/18
List all Environmental Concerns 26 days Mon 9/18/17 Mon 10/23/17
Final Hazards 6 days Mon 2/12/18 Mon 2/19/18
Functional Risks 21 days Mon 9/18/17 Mon 10/16/17
Time Risk 1 day Mon 9/18/17 Mon 9/18/17
Resource Risk 1 day Mon 9/18/17 Mon 9/18/17
Budget Risks 1 day Mon 9/18/17 Mon 9/18/17
Mitigation Technique for each Risk 1 day Mon 9/18/17 Mon 9/18/17
Launch Procedures 49 days Mon 10/30/17 Thu 1/4/18
Recovery Preparation 1 day Mon 10/30/17 Mon 10/30/17
Motor Preparation 1 day Mon 10/30/17 Mon 10/30/17
Setup on Launcher 1 day Mon 10/30/17 Mon 10/30/17
Igniter Installation 1 day Mon 10/30/17 Mon 10/30/17
Troubleshooting 1 day Mon 10/30/17 Mon 10/30/17
Post-Flight Inspection 1 day Mon 10/30/17 Mon 10/30/17
PPE 3 days Thu 9/14/17 Sun 9/17/17
General PPE 3 days Thu 9/14/17 Sun 9/17/17
PPE for Each Step in Procedure 47 days Wed 11/1/17 Thu 1/4/18
Motor Transportation Plan 3 days Thu 9/14/17 Sun 9/17/17
Methods for Verifying Controls/Mitigations 20 days Mon 1/29/18 Fri 2/23/18
Aero-structure 156 days Fri 9/15/17 Fri 4/20/18

130
Aero-structure Meeting 171 days Thu 9/14/17 Thu 5/10/18
Vehicle Dimensions 137 days Wed 9/13/17 Thu 3/22/18
General Vehicle Dimensions 4 days Wed 9/13/17 Sun 9/17/17
Proposal 25 days Wed 9/13/17 Tue 10/17/17
Material Selection 4 days Wed 9/13/17 Mon 9/18/17
Open Rocket Model 4 days Wed 9/13/17 Sun 9/17/17
Aero-structure Info 4 days Wed 9/13/17 Sun 9/17/17
Vehicle Dimensions Drawing 25 days Wed 9/13/17 Tue 10/17/17
Facilities Info 4 days Wed 9/13/17 Sun 9/17/17
BoM 4 days Wed 9/13/17 Sun 9/17/17
Motor Selection 4 days Wed 9/13/17 Sun 9/17/17
Final Vehicle Design 49 days Mon 10/30/17 Thu 1/4/18
Size and Mass 34 days Wed 11/1/17 Sun 12/17/17
Rail Size 34 days Wed 11/1/17 Sun 12/17/17
Suitablity of Fin Design 24 days Mon 10/30/17 Thu 11/30/17
CAD Drawings of Final Launch Video 49 days Mon 10/30/17 Thu 1/4/18
Materials for Bulkheads 18 days Mon 10/30/17 Wed 11/22/17
Justification for Material Selection 25 days Mon 10/30/17 Fri 12/1/17
Integrity Discussion 29 days Mon 10/30/17 Thu 12/7/17
Provide Justification for Design Selection 49 days Mon 10/30/17 Thu 1/4/18
Final Motor Choice 49 days Mon 10/30/17 Thu 1/4/18
Launch Vehicle Summary 20 days Fri 9/22/17 Thu 10/19/17
Describe Each
Subsystem/Components
26 days Mon 9/18/17 Mon 10/23/17
Estimated Masses for Each Subsystem 15 days Thu 10/5/17 Wed 10/25/17
Motor Mounting and Retention 1 day Mon 9/18/17 Mon 9/18/17
Design Options 19 days Mon 9/18/17 Thu 10/12/17
PDR With Chief Engineer 1 day Thu 10/19/17 Thu 10/19/17
Provide a CAD Drawings 24 days Mon 9/18/17 Thu 10/19/17
Modeling Session 1 1 day Tue 10/10/17 Tue 10/10/17
Modeling Session 2 1 day Tue 10/17/17 Tue 10/17/17
Body Tubes & Couplers 24 days Mon 9/18/17 Thu 10/19/17
Nose Cone 24 days Mon 9/18/17 Thu 10/19/17
Fins 24 days Mon 9/18/17 Thu 10/19/17
Centering Rings and Bulkheads 24 days Mon 9/18/17 Thu 10/19/17
Full Model 37 days Mon 9/18/17 Tue 11/7/17
Design Review 18 days Thu 9/21/17 Mon 10/16/17
3D Models - PDR 12 days Thu 10/12/17 Mon 10/23/17
Nose Cone Options 12 days Thu 10/12/17 Fri 10/27/17
Body Tubes 12 days Thu 10/12/17 Fri 10/27/17
Couplers 12 days Thu 10/12/17 Fri 10/27/17

131
Centering Ring & Bulkheads 12 days Thu 10/12/17 Fri 10/27/17
Motor Mount Options 12 days Thu 10/12/17 Fri 10/27/17
Fin Options 12 days Thu 10/12/17 Fri 10/27/17
Fin Mount Options 12 days Thu 10/12/17 Fri 10/27/17
Full Assembly 12 days Thu 10/12/17 Fri 10/27/17
Decision Matrices 5 days Thu 10/19/17 Mon 10/23/17
Nose Cone Shape 5 days Thu 10/19/17 Wed 10/25/17
Nose Cone Material 5 days Thu 10/19/17 Wed 10/25/17
Body Tubes 5 days Thu 10/19/17 Wed 10/25/17
Couplers 5 days Thu 10/19/17 Wed 10/25/17
Centering Rings 5 days Thu 10/19/17 Wed 10/25/17
Bulkheads 5 days Thu 10/19/17 Wed 10/25/17
Motor Mount - Thrust Plate 5 days Thu 10/19/17 Wed 10/25/17
Motor Mount - Mounting 5 days Thu 10/19/17 Wed 10/25/17
Fin Material 5 days Thu 10/19/17 Wed 10/25/17
Fin Attachment 5 days Thu 10/19/17 Wed 10/25/17
Fin Design 5 days Thu 10/19/17 Wed 10/25/17
Discuss Alternative Designs 1 day Thu 9/21/17 Thu 9/21/17
Design Review with Chief Engineer 1 day Thu 10/19/17 Thu 10/19/17
Evaluate Pro's/Cons of each Alternative 1 day Thu 9/21/17 Thu 9/21/17
Body Tubes and Couplers 16 days Thu 9/21/17 Thu 10/12/17
Nose Cone 16 days Thu 9/21/17 Thu 10/12/17
OpenRocket Sims with Each Alternative 16 days Thu 9/21/17 Thu 10/12/17
Design Options 16 days Thu 9/21/17 Thu 10/12/17
Fins 16 days Thu 9/21/17 Thu 10/12/17
OpenRocket Sims with each
Alternative
16 days Thu 9/21/17 Thu 10/12/17
Design Options 16 days Thu 9/21/17 Thu 10/12/17
Attachment Options 16 days Thu 9/21/17 Thu 10/12/17
Centering Rings & Bulkheads 16 days Thu 9/21/17 Thu 10/12/17
Material Options 16 days Thu 9/21/17 Thu 10/12/17
Stress Analysis for Screw Size 16 days Thu 9/21/17 Thu 10/12/17
Flight Simulations 136 days Thu 9/14/17 Thu 3/22/18
PDR Simulations 6 days Sun 10/1/17 Fri 10/6/17
Finalize PDR OpenRocket Model 6 days Sun 10/1/17 Fri 10/6/17
Thrust to Weight Ratio 19 days Sun 10/1/17 Thu 10/19/17
From OpenRocket 19 days Sun 10/1/17 Wed 10/25/17
From RASAero 19 days Sun 10/1/17 Wed 10/25/17
Hand Calculations 19 days Sun 10/1/17 Wed 10/25/17
Rail Exit Velocity 15 days Sun 10/1/17 Thu 10/19/17
From OpenRocket 19 days Sun 10/1/17 Wed 10/25/17
From RASAero 19 days Sun 10/1/17 Wed 10/25/17

132
Hand Calculations 15 days Sun 10/1/17 Thu 10/19/17
Altitude Predictions with Vehicle Data 15 days Sun 10/1/17 Thu 10/19/17
From OpenRocket 19 days Sun 10/1/17 Wed 10/25/17
From RASAero 19 days Sun 10/1/17 Wed 10/25/17
Hand Calculations 15 days Sun 10/1/17 Thu 10/19/17
Stability Margin 15 days Sun 10/1/17 Thu 10/19/17
From OpenRocket 19 days Sun 10/1/17 Wed 10/25/17
From RASAero 19 days Sun 10/1/17 Wed 10/25/17
Hand Calculations 15 days Sun 10/1/17 Thu 10/19/17
Simulated CP/CG Locations 19 days Sun 10/1/17 Thu 10/19/17
From OpenRocket 19 days Sun 10/1/17 Wed 10/25/17
CP from RASAero 19 days Sun 10/1/17 Wed 10/25/17
Hand Calculations 19 days Sun 10/1/17 Wed 10/25/17
Flight Profile 15 days Sun 10/1/17 Thu 10/19/17
Vertical Motion vs. Time 19 days Sun 10/1/17 Wed 10/25/17
Stability vs. Time 19 days Sun 10/1/17 Wed 10/25/17
Drag Coefficient vs. Mach Number 19 days Sun 10/1/17 Wed 10/25/17
CDR Simulations 49 days Mon 10/30/17 Thu 1/4/18
Subscale 49 days Mon 10/30/17 Thu 1/4/18
OpenRocket Model 49 days Mon 10/30/17 Thu 1/4/18
Model Created 9 days Mon 10/30/17 Thu 11/9/17
Flight Predictions 14 days Mon 10/30/17 Thu 11/16/17
Record Results 11 days Thu 12/21/17 Thu 1/4/18
RASAero Model 49 days Mon 10/30/17 Thu 1/4/18
Model Created 9 days Mon 10/30/17 Thu 11/9/17
Flight Predictions 14 days Mon 10/30/17 Thu 11/16/17
Record Results 11 days Thu 12/21/17 Thu 1/4/18
Simulated Motor Thrust Curve 24 days Mon 10/30/17 Thu 11/30/17
Altitude Prediction 24 days Mon 10/30/17 Thu 11/30/17
OpenRocket 24 days Mon 10/30/17 Thu 11/30/17
RASAero 24 days Mon 10/30/17 Thu 11/30/17
Final Design Sims 37 days Thu 1/4/18 Fri 2/23/18
Flight Profile 1 day Thu 1/4/18 Thu 1/4/18
Altitude Predictions 1 day Thu 1/4/18 Thu 1/4/18
Stability Margin 1 day Thu 1/4/18 Thu 1/4/18
Landing Kinetic Energy 1 day Thu 1/4/18 Thu 1/4/18
Thrust to Weight Ratio 1 day Thu 1/4/18 Thu 1/4/18
Rail Exit Velocity 1 day Thu 1/4/18 Thu 1/4/18
Construction 47 days Wed 11/1/17 Thu 1/4/18
Subscale 47 days Wed 11/1/17 Thu 1/4/18
Budget 1 day Thu 10/26/17 Thu 10/26/17

133
BoM 7 days Wed 11/1/17 Thu 11/9/17
Build 37 days Wed 11/1/17 Thu 12/21/17
Construction Methods 36 days Mon 10/30/17 Sun 12/17/17
Final Assembly Description 22 days Fri 1/5/18 Sun 2/4/18
Detailed Outline 22 days Fri 1/5/18 Sun 2/4/18
Test Assembly 22 days Fri 1/5/18 Sun 2/4/18
Itemized List 22 days Fri 1/5/18 Sun 2/4/18
Discussion on Deviations 6 days Mon 2/19/18 Sat 2/24/18
Mass Statement 1 day Wed 11/1/17 Wed 11/1/17
Safety 11 days Mon 1/1/18 Mon 1/15/18
Recovery 156 days Fri 9/15/17 Fri 4/20/18
Recovery Meeting 171 days Fri 9/15/17 Fri 5/11/18
Final Recovery System 49 days Mon 10/30/17 Thu 1/4/18
Identify/Justify Final Design 49 days Mon 10/30/17 Thu 1/4/18
Describe Parachute 49 days Mon 10/30/17 Thu 1/4/18
Describe Harness 49 days Mon 10/30/17 Thu 1/4/18
Describe Bulkheads/Attachment Hardware 49 days Mon 10/30/17 Thu 1/4/18
Mass Statement and Mass Margin 49 days Mon 10/30/17 Thu 1/4/18
Parachute Sizes 49 days Mon 10/30/17 Thu 1/4/18
Recovery Harness Type 49 days Mon 10/30/17 Thu 1/4/18
Size, Length, Descent Rates 49 days Mon 10/30/17 Thu 1/4/18
Tests of Staged Recovery 49 days Mon 10/30/17 Thu 1/4/18
Parachute Design 156 days Fri 9/15/17 Fri 4/20/18
Projected Parachute System Design 4 days Wed 9/13/17 Mon 9/18/17
Preliminary Design Review 21 days Wed 9/20/17 Wed 10/18/17
Review Each Component's
Design/Alternatives
21 days Wed 9/20/17 Wed 10/18/17
Evaluate Pros/Cons of Alternatives 21 days Wed 9/20/17 Wed 10/18/17
Chose Leading Components/Explain 21 days Wed 9/20/17 Wed 10/18/17
Prove Redundancy Exists within the System 21 days Wed 9/20/17 Wed 10/18/17
Parachute Dimensions 90 days Fri 9/15/17 Thu 1/18/18
Preliminary Analysis on Parachute Sizing 21 days Wed 9/20/17 Wed 10/18/17
Size Required for Safe Descent 21 days Wed 9/20/17 Wed 10/18/17
As Built Parachute Sizes 17 days Thu 1/4/18 Fri 1/26/18
Descent Rates 6 days Fri 1/26/18 Fri 2/2/18
Calculations 84 days Mon 9/11/17 Thu 1/4/18
Drift Calculations 6 days Wed 10/18/17 Wed 10/25/17
Adjacent Drift Calculations 6 days Wed 10/18/17 Wed 10/25/17
Calculated Kinetic Energy 6 days Sun 10/1/17 Fri 10/6/17

134
Kinetic Energy at Landing 50 days Sun 10/29/17 Thu 1/4/18
CDR Drift Calculations 27 days Sun 10/29/17 Mon 12/4/17
Final Drift Calculations 20 days Mon 1/29/18 Fri 2/23/18
System Defense 27 days Thu 1/4/18 Fri 2/9/18
Recovery Preparation 15 days Mon 2/5/18 Fri 2/23/18
Communication With Electronics 21 days Thu 1/25/18 Thu 2/22/18
Payload 156 days Fri 9/15/17 Fri 4/20/18
Payload Meeting 171 days Wed 9/13/17 Wed 5/9/18
Payload Description 4 days Fri 9/15/17 Wed 9/20/17
Payload Summary 26 days Mon 9/18/17 Mon 10/23/17
Objective/Experiment Description 6 days Tue 9/26/17 Tue 10/3/17
Design Review 11 days Tue 9/26/17 Tue 10/10/17
Alternatives Review 11 days Tue 9/26/17 Tue 10/10/17
Mass Estimate of all Payload Components 5 days Wed 10/11/17 Tue 10/17/17
Electronics Schematics 5 days Wed 10/11/17 Tue 10/17/17
3D Drawings 51 days Fri 10/27/17 Fri 1/5/18
Drawings and Specs for Each Component 10 days Wed 10/11/17 Tue 10/24/17
Entire Payload Assembly 15 days Wed 10/25/17 Tue 11/14/17
Payload Integration into Launch Vehicle 15 days Wed 11/15/17 Tue 12/5/17
Payload Optimization 31 days Thu 1/4/18 Thu 2/15/18
Final Ejection Testing 30 days Wed 12/6/17 Tue 1/16/18
Changes to Assembly 14 days Wed 1/17/18 Mon 2/5/18
Final Dimensions/Drawings 11 days Tue 2/6/18 Tue 2/20/18
Communication With Electronics 61 days Wed 12/6/17 Wed 2/28/18
Propulsion 156 days Fri 9/15/17 Fri 4/20/18
Propulsion Meeting 171 days Mon 9/11/17 Mon 5/7/18
NASA Motor 83 days Mon 9/18/17 Wed 1/10/18
Motor Choice 0 days Mon 9/18/17 Mon 9/18/17
Review Motor Choices 21 days Mon 9/18/17 Mon 10/16/17
PDR Writeup for Propulsion 13 days Mon 10/16/17 Wed 11/1/17
Final Motor Choice 22 days Wed 11/1/17 Thu 11/30/17
Simulated Motor Thrust Curve 9 days Mon 10/16/17 Thu 10/26/17
Motor Preparation 1 day Fri 9/22/17 Fri 9/22/17
Set-up Plan on Launcher 5 days Mon 2/12/18 Fri 2/16/18
Igniter Installation 27 days Thu 1/4/18 Fri 2/9/18
Launch Procedure 15 days Mon 2/5/18 Fri 2/23/18
Communication with Electronics 21 days Thu 1/25/18 Thu 2/22/18
Electronics 156 days Fri 9/15/17 Fri 4/20/18
Electronics Meeting 171 days Wed 9/13/17 Wed 5/9/18

135
Establish Member Skills 6 days Fri 9/15/17 Fri 9/22/17
Onboard System to Collect Flight Data 21 days Thu 1/4/18 Thu 2/1/18
Recovery 49 days Mon 10/30/17 Thu 1/4/18
Critical Design Review 49 days Mon 10/30/17 Thu 1/4/18
Electrical Components 1 day Mon 10/30/17 Mon 10/30/17
Drawings of all Electrical Component 1 day Mon 10/30/17 Mon 10/30/17
Block Diagrams and Electrical Schematics 1 day Mon 10/30/17 Mon 10/30/17
Operating Frequency of Locating Tracker 1 day Mon 10/30/17 Mon 10/30/17
FRR 40 days Mon 1/1/18 Fri 2/23/18
Altimeters/computers/switches 21 days Mon 1/8/18 Mon 2/5/18
Complete Redundancy Features 30 days Mon 1/8/18 Fri 2/16/18
Transmitters + Discussion 17 days Fri 1/19/18 Mon 2/12/18
Drawings/Schematics 40 days Mon 1/1/18 Fri 2/23/18
Electronics/Recovery Interference 36 days Mon 1/1/18 Mon 2/19/18
Payload 130 days Fri 9/15/17 Thu 3/15/18
Preliminary Design Review 26 days Mon 9/18/17 Mon 10/23/17
Electrical Schematics for All Elements of Preliminary Payload
1 day Mon 9/18/17 Mon 9/18/17
Estimated Masses for Electrical Components 1 day Mon 9/18/17 Mon 9/18/17
Justify Electrical Component Selection 1 day Mon 9/18/17 Mon 9/18/17
Preliminary Interfaces between Payload and
Launch Vehicle
1 day Mon 9/18/17 Mon 9/18/17
Critical Design Review 49 days Mon 10/30/17 Thu 1/4/18
Discussion of Electronics/Safety
Switches/Indicators
1 day Mon 10/30/17 Mon 10/30/17
Drawings/Block Diagrams 1 day Mon 10/30/17 Mon 10/30/17
Battery Choice/Justification 1 day Mon 10/30/17 Mon 10/30/17
Switch/Indicator Wattage and Location 1 day Mon 10/30/17 Mon 10/30/17
Justification for Electronics Selection 1 day Mon 10/30/17 Mon 10/30/17
Aero-structure 31 days Mon 1/8/18 Mon 2/19/18
Wiring 1 day Mon 1/8/18 Mon 1/8/18
Switches 1 day Mon 1/8/18 Mon 1/8/18
Retention of Avionics Boards 1 day Mon 1/8/18 Mon 1/8/18
Post-Flight Inspection Safety Plan 31 days Mon 1/8/18 Mon 2/19/18
Communication with Electronics 21 days Thu 1/25/18 Thu 2/22/18
Educational Engagement 156 days Fri 9/15/17 Fri 4/20/18
Outreach to Schools 95 days Mon 9/18/17 Fri 1/26/18
STEM After-School 60 days Mon 9/18/17 Fri 12/8/17
Activity Development 14 days Mon 9/18/17 Thu 10/5/17
Background Clearances 7 days Thu 10/5/17 Fri 10/13/17

136
Team Training 10 days Mon 10/16/17 Fri 10/27/17
Program Execution 15 days Mon 11/20/17 Fri 12/8/17
Physics Discussions 15 days Mon 1/8/18 Fri 1/26/18
Various Event Outreach 105 days Mon 10/2/17 Fri 2/23/18
Women’s’ Soccer Event 1 day Thu 10/19/17 Thu 10/19/17
Elementary School Rocket Launch 6 days Thu 10/12/17 Thu 10/19/17
Inquire! Innovate! Invent! 1 day Sat 10/21/17 Sat 10/21/17

137
8.3.1. Project Outline of Safety

138
8.3.2. Project Outline of Aerostructure

139
8.3.3. Project Outline of Recovery

140
8.3.4. Project Outline of Payload
8.3.5. Project Outline of Propulsion

141
8.3.6. Project Outline of Electronics

142
8.3.7. Project Outline of K12-Outreach