Embed Size (px)
Citation preview

FORNEBU, 30 OCTOBER 2017
Q32017
QUARTERLY REPORT FOR AKER BP ASA

2QUARTERLY REPORT Q3 2017
KEY EVENTS IN
Q3 2017
13 July: The Board declared a quarterly dividend of USD 0.185 per share to be paid out in August 201731 July: The company repaid its USD 300 million DETNOR03 subordinated bond 10 August: The company announced a rig contract to Odfjell Drilling for exploration and development drilling in the Norwegian Sea and the Barents Sea in 201825 August: The company cancelled its USD 550 million revolving credit facility4 September: The partners in the Johan Sverdrup development reported further project improvements, including a NOK 5 billion reduction in Phase 1 investment costs
KEY EVENTS AFTER THE QUARTER 24 October: Aker BP entered into an agreement to acquire Hess Norge24 October: The Board proposed to increase the annual dividend level by USD100milliontoUSD350million,withfirstuplift expected for fourth quarter 2017 (payable in February 2018)27 October: The Board declared a quarterly dividend of USD 0.185 per share to be paid in November

3
Unit Q3 2017 Q3 2016 2017 YTD 2016 YTD
Operating income USDm 596 248 1 837 709
EBITDA USDm 395 179 1 277 483
Net result USDm 112 63 241 102
Earnings per share (EPS) USD 0.33 0.31 0.71 0.50
Production cost per barrel USD/boe 11 6 10 6
Depreciation per barrel USD/boe 14 21 14 21
Cashflowfromoperations USDm 730 251 1 613 573
Cashflowfrominvestments USDm -285 164 -867 -392
Total assets USDm 9 116 10 280 9 116 10 280
Net interest-bearing debt (book value) USDm 1 941 2 380 1 941 2 380
Cash and cash equivalents USDm 81 786 81 786
Unit Q3 2017 Q3 2016 2017 YTD 2016 YTD
Alvheim (65%) boepd 47 259 41 045 57 747 39 800
Bøyla (65%) boepd 4 276 6 191 4 584 7 727
Gina Krog (3.3%) boepd 1 453 - 490 -
Hod (37.5%) boepd 500 - 549 -
Ivar Aasen (34.8%) boepd 16 574 - 16 284 -
Skarv (23.8%) boepd 24 518 - 28 458 -
Tambar / Tambar East (55.0%/46.2%) boepd 2 145 - 2 275 -
Ula (80%) boepd 6 468 - 6 629 -
Valhall (36.0%) boepd 11 132 - 12 989 -
Vilje (46.9%) boepd 5 063 7 381 5 485 6 727
Volund (65%) boepd 12 316 4 195 4 325 5 553
Other boepd 175 1 026 112 1 154
SUM boepd 131 880 59 839 139 928 60 961
Oil price USD/bbl 55 47 53 45
Gas price USD/scm 0.20 0.15 0.20 0.17
SUMMARY OF FINANCIAL RESULTS
SUMMARY OF PRODUCTION

4QUARTERLY REPORT Q3 2017
SUMMARY OF THE QUARTERAker BP ASA (“the company” or “Aker BP”) reported total income of USD 596 (248) million in the third quarter of 2017. Production in the period was 131.9 (59.8) thousand barrels of oil equivalent per day (“mboepd”), realising an average oil price of USD 55 (47) per barrel, while gas revenues were recognized at market value of USD 0.20 (0.15) per standard cubic metre (scm). Production cost per barrel of oil equivalents (“boe”) was USD 11.1 (5.8).
EBITDA amounted to USD 395 (179) million in the quarterandEBITwasUSD219(56)million.Netprofitfor the quarter was USD 112 (63) million, translating into an EPS of USD 0.33 (0.31). Net interest-bearing debt amounted to USD 1,941 (2,380) million per 30 September 2017.
Two new wells commenced production at the Volund fieldduringthequarter,resultinginareallocationofproductioncapacityfromtheAlvheimfield.TheTransoceanArcticdrillingrigiscurrentlydrillinginfillwells at Boa.
Production from the Skarv and Valhall areas was impacted by planned maintenance in the third quarter. Drilling from the Valhall injection platform continued and P&A activity commenced with the Maersk Invincible drilling rig.
Production at Ivar Aasen has remained stable in the third quarter. The Johan Sverdrup project is progressing accordingtoplanwiththefirststeeljacketinstalledonthefieldduringthequarter.
Drilling of the Delta appraisal well in the NOAKA area was completed in the quarter and the Hyrokkin and Nordfjellet exploration wells in the North Sea were completed in the quarter, both dry.
Following a successful placement of a new USD 400 million bond in June, the company in the third quarter redeemed its USD 300 million subordinated bond and cancelled its USD 550 million revolving credit facility.
In August, the company paid a quarterly dividend of USD 0.185 per share.
After the end of the third quarter, Aker BP entered into an agreement to acquire Hess Norge AS (“Hess Norge”) for a cash consideration of USD 2.0 billion. The transaction includes Hess Norge’s interests in the ValhallandHodfields,andataxlosscarryforwardwitha nominal after tax value of USD 1.5 billion.
Forward-looking statements in this report reflect current views about future events and are, by their nature, subject to significant risks and uncertainties because they relate
to events and depend on circumstances that will occur in the future.
All figures are presented in USD unless otherwise stated, and figures in brackets apply to the corresponding period in the previous year, and is for 2016 not directly comparable
as they represent Aker BP ASA prior to the merger with BP Norge AS.

5
FINANCIAL REVIEW
(USD million) Q3 2017 Q3 2016
Operating income 596 248
EBITDA 395 179
EBIT 219 56
Pre-taxprofit/loss 209 51
Netprofit 112 63
EPS (USD) 0.33 0.31
(USD million) Q3 2017 Q3 2016
Goodwill 1 817 1 858
PP&E 4 782 4 383
Cash & cash equivalents 81 786
Total assets 9 116 10 280
Equity 2 502 2 579
Interest-bearing debt 2 022 3 165
Total income in the third quarter was USD 596 (248) million, higher than the third quarter 2016 mainly due to inclusion of BP Norge activities. Petroleum revenues amounted to USD 601 (247) million, while other income was USD -5 (1) million, primarily related to realized and unrealized gains and losses on commodity hedges.
Exploration expenses amounted to USD 64 (31) million inthequarter,reflectingdryholecosts,seismiccosts,area fees and G&G activities. Production costs were USD 134 (32) million, equating to 11.1 (5.8) USD/boe, including shipping and handling of 3.2 (1.0) USD/boe. The increase from the third quarter 2016 is mainly due toinclusionofBPNorgefieldsandproductionfromIvar Aasen, which have higher production costs per boe compared to the Alvheim area. Other operating expenses amounted to USD 3 (6) million.
Depreciation amounted to USD 175 (115) million, corresponding to 14 (21) USD/boe, which represents a decrease from third quarter 2016 mainly due to the inclusion of the BP Norge assets.
ThecompanyrecordedanoperatingprofitofUSD219(56) million in the third quarter, higher than the third quarter 2016 primarily due to the merger with BP Norge. ThenetprofitfortheperiodwasUSD112(63)millionafternetfinancialitemsofUSD-9(-5)millionandatax expense of USD 97 (-13) million. Earnings per share were USD 0.33 (0.31).
Total intangible assets amounted to USD 3,433 (4,449) million, of which goodwill was USD 1,817 (1,858) million. The decrease from the third quarter 2016 is mainly related to impairment losses recorded in fourth quarter2016andfirstquarter2017.
Property, plant and equipment increased to USD 4,782 (4,383)million,reflectinginvestmentsindevelopmentprojects less depreciation. Current tax receivables amounted to USD 145 (133) million at the end of the quarter, and is related to last year’s exploration spending.
The group’s cash and cash equivalents were USD 81 (786) million as of 30 September 2017. Total assets were USD 9,116 (10,280) million at the end of the quarter.
Equity amounted to USD 2,502 (2,579) million at the end of the quarter, corresponding to an equity ratio of 27 (25) percent. The decrease is mainly related to the quarterlydividendpayments,offsetbynetprofitinthe period.
Deferred tax liabilities decreased to USD 1,137 (1,415) millionandaredetailed innote7 to thefinancialstatements.
Gross interest-bearing debt decreased to USD 2,022 (3,165) million, consisting of the DETNOR02 bond of USD 237 million, the AKERBP Senior Note 2017 (17/22) of USD 389 million and the Reserve Based Lending (“RBL”) facility of USD 1,396 million.
Income statement Statement of financial position

6QUARTERLY REPORT Q3 2017
(USD million) Q3 2017 Q3 2016
Cashflowfromoperations 730 251
Cashflowfrominvestments -285 164
Cashflowfromfinancing -427 300
Net change in cash & cash eq. 18 715
Cash and cash eq. EOQ 81 786
Statement of cash flow
NetcashflowfromoperatingactivitieswasUSD730(251) million. The change was mainly caused by increasedprofitbeforetaxandataxrefundreceivedfollowing the liquidation of BP Norge.
NetcashflowfrominvestmentactivitieswasUSD-285(164)million.Investmentsinfixedassetsamountedto USD 226 (203) million for the quarter, mainly reflectingcapitalexpenditures(“CAPEX”)onIvarAasen,Alvheim, Valhall/Hod, Ula/Tambar and Johan Sverdrup. Investments in intangible assets including capitalized exploration were USD 33 (54) million in the quarter and payment for decommissioning activities were USD 27 (3) million in the quarter.
NetcashflowfromfinancingactivitiestotalledUSD427(300)million,reflectingarepaymentofUSD422millionon the group’s RBL facility in the quarter, USD 330 million related to repayment of DETNOR03 (including early redemption fee), issuance of AKERBP Senior Note of USD 388 million (net of fees) and dividend disbursements of USD 62.5 million during the quarter.
FundingAt the end of the third quarter, the company had total available liquidity of USD 2.6 (1.5) billion, comprising of cash and cash equivalents of USD 81 (786) million and undrawn credit facilities of USD 2,540 (712) million.
Bondholders representing NOK 2.0 million nominal worth of DETNOR02 bonds exercised the distribution put option following the dividend payment in August. Aker BP consequently owns DETNOR02 bonds equal to NOK 5.8 million.
On 28 June, the company priced a notes offering of USD 400 million aggregate principal amount of 6.00 percent
senior unsecured notes due 2022 at par. Interest will be payable semi-annually. The offering was closed on 5 July 2017.
On30June,thecompanynotifiedNordicTrusteeASAof its intention to exercise its redemption right for bond issue DETNOR03 (ISIN NO 001073638.2) as per Clause 10.3 of the Bond Agreement. The entire bond issue was repaid at 110 percent of par value (plus accrued interest) on 31 July 2017. The remaining balance of the notes proceeds was used to repay (without cancelling) drawn commitments under the company’s RBL credit facility and pay the costs, fees and expenses related to the offering.
Ahead of the notes offering, Aker BP obtained credit ratings from S&P and Moody’s. S&P assigned a BB+ long-term corporate credit rating with stable outlook. Moody’s assigned a Ba2 corporate family rating with stable outlook.
During the third quarter, the Company completed certain amendments to its RBL facility and has achieved a more flexibleandcosteffectivestructure.Theborrowingbase under the amended facility is set annually based onthecompany’scertified2Preserves.Thecompanyalso cancelled its second lien RCF facility which was established in 2015.
HedgingThe company seeks to reduce the risk related to both foreign exchange rates, interest rates and commodity prices through hedging instruments. The company actively manages its exposures through a mix of forward contracts and options.
During the fourth quarter 2016, the company entered into new commodity hedges for 2017. These include put options with a strike price of 50 USD/bbl for approximately 14 percent of estimated 2017 oil production, corresponding to approximately 50 percent of the undiscounted after-tax value.
Subsequent to the end of the third quarter, the company has bought put options at a strike price of USD 50 per barrel for approximately 14 percent of estimated oil productionforthefirsthalfof2018.
DividendsA quarterly dividend of USD 62.5 million, corresponding to USD 0.185 per share was disbursed on 9 August 2017.
7
At the Annual General Meeting in April 2017, the Board was authorized to approve the distribution of dividends based on the company’s annual accounts for 2016 pursuant to section 8-2 (2) of the Norwegian Public Limited Companies Act.
On 27 October 2017, the Board of Directors declared a quarterly dividend of USD 0.185 per share, to be disbursed on or about 9 November 2017.
HEALTH, SAFETY AND THE ENVIRONMENT
HSE is always the number one priority in all Aker BP’s activities. The company ensures that all its operations, drilling campaigns and projects are carried out under the highest HSE standards.
During the third quarter, no process safety events, high potential incidents or acute spills were recorded. One recordable injury at Valhall resulted in an arm fracture. This incident has been investigated and root causes addressed.TwonotificationsweresenttothePetroleumSafety Authority (PSA).
There was a high activity level in the third quarter atseveralofthecompany’soperatedfieldsrelatedto
scheduled maintenance activities. Safety awareness briefsandstart-upofaself-verificationprogramoffshorewithin Aker BP have been prioritized in order to have a proactive and structured approach to manage safety barriers.
Adequate and robust support of HSE to the new project alliance structures has been an important activity to align all parties and ensure high quality deliverables.
Five audits by the PSA were conducted during third quarter, and thorough preparations and follow up activities have been executed in response to the audit reports received.

8QUARTERLY REPORT Q3 2017
OPERATIONAL REVIEW
Aker BP produced 12.1 (5.5) mmboe in the third quarter of 2017, corresponding to 131.9 (59.8) mboepd. The average realized oil price was USD 55 (47) per barrel, while gas revenues were recognized at market value of USD 0.20 (0.15) per standard cubic metre (scm).
Alvheim AreaPL203/088BS/036C/036D/150 (operator)TheproducingfieldsAlvheim(65percent),Volund(65percent), Bøyla (65 percent) and Vilje (46.9 percent) are all tied back to the Alvheim FPSO.
Third quarter production from Alvheim area was approximatelyfivepercentdownfrompreviousquarter.This was partly a result of ordinary decline, but also impacted by outage of the SAGE gas pipeline and by a planned Alvheim emergency shut down test.
ProductionfromtheVolundfieldwasrestoredinthethird quarter as two new wells started production. These new wells are given priority over the Viper/Kobrawells,whichispartoftheAlvheimfield,butisproduced via the Volund infrastructure. This resulted in a corresponding reduction in production from the Alvheimfield.
TheproductionefficiencyfortheAlvheimareawas96percent in the quarter.
Valhall Area PL006B/033/033B (operator)TheValhallareaconsistsoftheproducingfieldsValhall(35.95 percent) and Hod (37.5 percent).
Production from the Valhall area decreased in the third quarter partly driven by a planned maintenance shutdown, reservoir depletion and temporary well shutdowns related to drilling and well operations.
During the quarter, four parallel drilling and wells operations have been in progress. The Maersk Invincible rig continued the P&A campaign at Valhall, while the IP rig drilling campaign progressed very well and two wireline crews were running production and abandonment well interventions. Well G-09 was completed and put on production in August.
TheproductionefficiencyfortheValhallareawas86percent in the quarter.
Ula Area PL019/019B/065/300 (operator)TheUlaareaconsistsoftheproducingfieldsUla(80.0percent), Tambar (55.0 percent) and Tambar East (46.2 percent). Tambar and Tambar East are tied back to the Ula facilities, together with the Repsol operated Blane fieldandtheFaroeoperatedOselvarfield.
Production from the Ula area was slightly down in third quarter, with the reduction mostly caused by cyclic well performance. The alternating water and gas injection modeofthesewellsisexpectedtocausefluctuationinproduction volumes going forward.
TheproductionefficiencyfortheUlaareawas68percentin the quarter.
Skarv AreaPL159/212/212B/262 (operator)TheSkarvareaconsistsoftheSkarvproducingfield(23.84 percent). In addition, production from the Snadd test producer is reported as Skarv volumes.
Production from the Skarv area was stable during the third quarter with continued high plant uptime. Three wells at Skarv are shut in due to technical issues. Ample capacity from the other wells has softened the negative impact of these shut-ins. The Songa Enabler drilling unitiscurrentlyonthefieldperformingworkoverswithan aim reinstate production within year end. Aker BP is taking steps to prevent similar problems elsewhere.
The Snadd test producer was shut in during the third quarter as it had reached its allowed production volume for 2017. An extended pressure build up test is currently being performed in order to obtain key reservoir data in support of the Snadd development.
TheproductionefficiencyfortheSkarvareawas87percentinthequarter,influencedbytheplannedtestingof emergency shutdown valves in September.
Ivar Aasen PL001B/242/457 (operator)Ivar Aasen (34.786 percent) delivered planned production in the third quarter and completed the PDO drilling scope. The plant continued to perform well averaging 97 percent availability in the quarter.
9
PROJECTS
Johan Sverdrup UnitPL265/501/502 (partner)Phase 1 of the Johan Sverdrup (11.5733 percent) development project is progressing according to plan towards production start-up in the fourth quarter 2019.Phase1consistsofafieldcentrewithfourfixedplatforms, three subsea templates, oil and gas export pipelines, power from shore and 36 production and injection wells.
At the end of the third quarter, approximately 70 percent of the Phase 1 facilities construction has been completed. InJulythefirststeeljacket(offour)wasdeliveredbyKværner (Verdal) and installed offshore, becoming the firstvisiblestructureattheJohanSverdrupfield.InSeptember three large modules constructed by Aibel (Thailand and Haugesund) and Nymo (Grimstad) were lifted by Heerema and integrated on a giant barge inshore in Klosterfjorden (south of Stord) to become the Drilling Platform, which was thereafter hauled to Haugesund forfinalonshorehookupandcommissioning.Theplan is to pick up the “drilling ready” topside by the new build twin hull heavy lift ship Pioneering Spirit (Allseas) and conduct a single lift installation offshore in the summer of 2018.
After a successful completion of the eight pre-drilled production wells and a four well pilot/appraisal campaignforfurtherimprovementofreservoirdefinition,the planned pre-drilling of 10 water injection wells has made good progress.
The front end engineering and design (“FEED”) has progressed well for the Phase 2 installations, aiming forahighengineeringmaturitylevelpriortothefinalinvestment decision and Plan for Development and Operation (PDO) for Phase 2 scheduled for the second half of 2018. Phase 2 production start is expected in
2022. Phase 2 includes 28 additional production and injection wells in the peripheral parts of the Johan Sverdrupoilfield,increasingthetotalnumberofwellsto 64.
Phase 2 also includes an increased production capacity onafifthplatformatthefieldcentre,increasingtheproduction capacity from 440,000 to 660,000 barrels of oil per day. Phase 2 includes increased power from shore capacity which will allow Johan Sverdrup to also supplythesurroundingfieldsIvarAasen,EdvardGriegand Gina Krog with power.
The cost estimate of the Johan Sverdrup development continues on a positive downward trend. The Operator’s latest Phase 1CAPEX estimate isNOK92 billion(nominal at project currency), which is more than NOK 30 billion (25 percent) lower than at PDO in 2015. The CAPEXestimateforPhase2isNOK40–55billion,which is approximately half the cost estimated for Phase 2 when the PDO for Phase 1 was submitted in 2015.
The Operator estimates the Johan Sverdrup reserves at between 2.0 and 3.0 billion barrels of oil equivalents (boe)andthefullfieldbreakevenoilpricelowerthanUSD 25 per boe.
Valhall Flank WestPL006B/033/033B (operator)The Valhall Flank West project will be developed out oftheTorFormationatthewesternflankoftheValhallfield.Valhallisachalktypereservoirlocatedinthesouthern area of the Norwegian North Sea. The project passed concept selection in April, and is currently in the FEED phase and experiencing a seamless transition into detail engineering. The plan is to submit a PDO before the end of 2017.
TheproductionefficiencyforIvarAasenwas82percentin the quarter, impacted pre-dominantly by power availability issues.
Gina Krog PL029B/029C/048/303 (partner)TheGinaKrogfield(3.3percent)startedproductionon30June.Thefieldhasbeendevelopedwithafixed
platform with living quarters and processing facilities. Oil from Gina Krog is exported with shuttle tankers while gas is exported via the Sleipner platform. The fieldisoperatedbyStatoil.

10QUARTERLY REPORT Q3 2017
Valhall Flank North Water InjectionPL006B/033/033B (operator)The Valhall Flank North platform is located to the north of the Valhall complex in 72 meter water depth. A project is currently being matured to expand capability for water injection to the northern basin drainage area, thus securing the Valhall base production through enabling water injection to existing depleted producers and offering a potential for increased reserves recovery from Valhall of 6-8 mmboe gross.
North of Alvheim and Askja-Krafla (NOAKA) PL442/026B/364 (operator) and PL272 (partner)TheNorthofAlvheimandAskja-Krafla (NOAKA)area consists of the discoveries Frigg Gamma Delta, Langfjellet,Frøy,Fulla,FriggandAskja-Krafla.Thearea development is a shared initiative between the partners in the licences.
With limited infrastructure available in the area, the goal is to develop an economically robust area solution, which can tie-in neighbouring licenses and open up for new exploration upsides. The area development solution is likely to include subsea structures and unmanned/ normally unmanned installations on the individual reservoirs based on their size and complexity. The project is expected to be further matured towards a plannedconceptselection(DG2)decisioninthefirstquarter 2018.
Storklakken PL460 (operator)Storklakken (65 percent) is planned to be developed as a stand-alone development with a single multilateral productionwelltiedbacktotheViljefield,utilizingexisting pipeline from Vilje to Alvheim FPSO. Project sanctioning is planned for the fourth quarter 2017 and firstoilisexpectedin2020.
Snadd PL162/159/212/212B (operator)Snadd is planned as a tie-in to Skarv FPSO in a phased development. Phase 1 is planned with three subsea wells tied in to Skarv A template, with production start scheduled for 2020.
The key upcoming activities include sanctioning of the project (DG3) in fourth quarter 2017 followed by the submission of the Plan for Development and Operation (PDO), award of the main contracts for the electrical trace heating system, subsea production system and topsidesmodificationsscopesaswellasestablishmentof an alliance organisation to deliver the project. The neartermfocusisthequalificationoftheelectricaltraceheatedpipe-in-pipeflowlinesystemandplacementofcommitments for long lead items.
Tambar Re-developmentPL065 (operator) Tambarislocated16kmsoutheastofUla.Inthefirstquarter, the Tambar license approved a development projectwhichwilladdtwoproductionwellstothefieldandmodifyfacilitiestoprovidegasliftfromUlafieldtonew and existing Tambar wells. The drilling will also testtheoil-watercontactinthenorthernpartofthefield,and thus contribute to increased understanding of the Tambar reservoir. During the third quarter the execution ofoffshorefacilitymodificationshasstarted,includingpreparing for intake of the drilling rig. Drilling with the Maersk Interceptor commenced in October 2017.
Oda PL405 (partner)TheOdafield(15percent)isbeingdevelopedwitha subsea template tied back to the Aker BP operated UlafieldcentreviatheexistingOselvarinfrastructure.The project involves two production wells and one water injector. Aker BP performs the required facility modificationstoreceiveproductionfromandprovideinjection water to Oda. Oda’s recoverable reserves are estimated at 48 mmboe (gross). Natural gas from Oda will support Ula development strategy in provision of gas for the water alternating gas (WAG) injection regime. The PDO was approved by the Ministry of Petroleum and Energy in May 2017. Total investments for Oda are estimated to NOK 5.4 billion. Offshore execution offacilitymodificationsontheUlafieldcentretobeready to receive Oda production is ongoing. First oil from Oda is expected in second quarter 2019.

11
EXPLORATION
BUSINESS DEVELOPMENT
In August, the company entered into an agreement to acquire Wellesley’s 30 percent share in PL 810. The license is located in one of Aker BP’s core areas, between
Ula and Tambar. The transaction has been approved by relevant authorities, and the company expects to close the transactions within the end of the month.
During the quarter, the company’s cash spending on exploration was USD 76 million. USD 64 million was recognized as exploration expenses in the period, relating to dry wells, seismic, area fees and G&G costs.
Drilling of the Hyrokkin prospect in PL677 in the North Sea was completed in August as a dry hole.
Drilling of the Delta appraisal well and the Nordfjellet exploration well in PL442 near the Frigg Gamma Delta discovery was completed in September. The objective of the appraisal well was to delineate the oil discovery in the Delta structure towards the north and examine the mobility of the oil in the Frigg formation. The well encountered an oil column of 13.5 metres in sandstone with good reservoir quality. The oil/water contact was
encountered near 1,950 metres below the sea surface. Analysesareongoingtoconfirmtheresourceestimate.TheNordfjelletexplorationwellwasclassifiedasdry.
Drilling commenced on the Hufsa prospect in PL533 in the Barents Sea in October and results are expected in the fourth quarter 2017.
In August, the company entered into an agreement with Odfjell Drilling for the lease of the semi-submersible drilling rig Deepsea Stavanger for a period of approximately nine months, with commencement in February 2018. The contract is for exploration and development drilling at various locations in the Norwegian Sea and the Barents Sea.

12QUARTERLY REPORT Q3 2017
On 24 October 2017, Aker BP entered into an agreement to acquire Hess Norge. Through the transaction, Aker BP will strengthen its production and resource base, and willbecomethesoleowneroftheValhallandHodfields,where the company sees a great value creation potential throughincreasedoilrecoveryandflankdevelopments.
The cash consideration of the transaction is USD 2.0 billion. The transaction includes a 64.05 percent interest intheValhallfieldanda62.5percentinterestintheHodfield.Asperend-2016,thecorrespondingprovenand probable reserves (2P) amounted to 150 million barrels of oil equivalent (mmboe), while the best estimate for contingent resources (2C) was 195 mmboe, based on Aker BP’s own assessment per year-end 2016. For thefirstninemonthsof2017,HessNorge’sshareofproductionfromthesefieldswasapproximately24,000barrels of oil equivalent per day (boepd). Aker BP will also assume Hess Norge’s tax positions, which include a tax loss carry forward with a net nominal after-tax value of USD 1.5 billion, as booked in Hess Norge’s 2016 annual accounts.
ThetransactionwillbefinancedthroughAkerBP’sexisting long-term Reserve Based Lending bank facility, and by the issuance of USD 500 million in new equity.
The issue price will be determined through a book building process. Aker ASA (“Aker”) and BP plc (“BP”) will subscribe for 40 percent and 30 percent of the shares to be issued, respectively, at the price determined through the bookbuilding process, or minimum NOK 155 per share. In addition, Aker and BP will underwrite the remaining shares to be issued at NOK 155 per share.
The transaction is subject to customary conditions for completion, including approval by the Ministry of Oil and Energy, Ministry of Finance and relevant competition clearance. The effective date of the transaction will be 1 January 2017, and closing is expected by the end of 2017. A general meeting in Aker BP will be called to approve the issuance of new equity.
Following the completion of the transaction and the equity issue, the board will increase the shareholder dividends from USD 250 million to USD 350 million per year, effective from the dividend for the fourth quarter2017whichispayableinthefirstquarter2018.
Aker BP intends to subsequently sell or swap a minority interestintheValhallandHodfieldstopartnerswhowant to work together with Aker BP to proactively target the upside potential in the area.
ACQUISITION OF HESS NORGE AS

13
OUTLOOK
The company continues to build on a strong platform for further value creation through an effective business model built on lean principles, technological competence and industrial cooperation to secure long-term competitiveness.
Going forward, the company will continue to selectively pursue growth opportunities which will enhance production and increase dividend capacity. A dividend of USD 0.185 per share is scheduled to be paid in November. The board will raise the dividend level to USD 350 million per year for the fourth quarter 2017 whichispayableinthefirstquarter2018andwillfurther increase this level once Johan Sverdrup is in production.
The company will have four rigs in operation in the fourthquarter.OperationsincludeinfilldrillingatBoa and Tambar as well as new production wells and P&A activity at Valhall. In addition, the company is partner in drilling of the Hufsa and Hurri prospects in the Barents Sea.
Aker BP is in the process of preparing to submit three PDOs during 2017, relating to the Valhall West Flank, Snadd and Storklakken projects.
The company has a robust balance sheet, providing thecompanywithamplefinancialflexibilitygoingforward. The announced USD 500 million equity issue is expected to be carried out shortly. The Hess transaction is expected to close before year-end 2017.
The company expects 2017 production (excluding the Hess transaction) to be in the upper half of the 135-140 mboepd guidance with a production cost of approximately10USD/boe.2017CAPEXisexpectedtobebetweenUSD900–950million.Guidancefor2017explorationexpendituresisunchangedatUSD280–300million, while total cash spend on decommissioning is expectedtobeUSD80–90million(previouslyUSD100–110million).

14QUARTERLY REPORT Q3 2017
FINANCIAL STATEMENTSWITH NOTES

15
INCOME STATEMENT (Unaudited)
(USD 1 000) Note 2017 2016 2017 2016
Petroleum revenues 2 600 808 247 213 1 838 450 719 254Other income 2 -4 620 779 -1 511 -10 748
Total income 596 188 247 993 1 836 939 708 506
Exploration expenses 3 63 887 30 843 169 521 103 172Production costs 134 411 32 188 376 303 105 678Depreciation 5 175 334 114 649 543 532 349 231Impairments 4, 5 1 091 8 429 31 238 26 748Other operating expenses 2 893 6 223 14 057 16 964
Total operating expenses 377 617 192 333 1 134 651 601 794
Operating profit/loss 218 571 55 660 702 288 106 712
Interest income 2 566 568 4 725 2 908Other financial income 54 522 37 918 84 752 79 113Interest expenses 27 129 20 107 88 397 61 933Other financial expenses 39 427 23 487 140 654 46 527
Net financial items 6 -9 469 -5 107 -139 574 -26 439
Profit/loss before taxes 209 102 50 553 562 714 80 273
Taxes (+)/tax income (-) 7 97 065 -12 880 321 963 -21 701
Net profit/loss 112 037 63 433 240 751 101 974
Weighted average no. of shares outstanding basic and diluted 337 737 071 202 618 602 337 737 071 202 618 602Basic and diluted earnings/(loss) per share 0.33 0.31 0.71 0.50
STATEMENT OF COMPREHENSIVE INCOME (Unaudited)
(USD 1 000) Note 2017 2016 2017 2016
Profit/loss for the period 112 037 63 433 240 751 101 974
Items which may be reclassified over profit and loss (net of taxes)
Currency translation adjustment - - -356 -59
Total comprehensive income in period 112 037 63 433 240 395 101 914
Q3 01.01.-30.09.
Q3 01.01.-30.09.Group
Group

16QUARTERLY REPORT Q3 2017
STATEMENT OF FINANCIAL POSITION (Unaudited)
(USD 1 000) Note 30.09.2017 30.09.2016 31.12.2016
ASSETS
Intangible assetsGoodwill 5 1 817 486 1 858 465 1 846 971Capitalized exploration expenditures 5 355 926 361 696 395 260Other intangible assets 5 1 259 511 1 339 433 1 332 813Deferred tax assets 7 - 889 108 -
Tangible fixed assetsProperty, plant and equipment 5 4 781 618 4 383 110 4 441 796
Financial assetsLong-term receivables 41 402 42 308 47 171Long-term tax receivable 7 - 22 234 -Long-term derivatives 11 23 238 14 924 -Other non-current assets 6 041 12 866 12 894
Total non-current assets 8 285 223 8 924 144 8 076 905
InventoriesInventories 73 762 66 499 69 434
ReceivablesAccounts receivable 53 548 99 775 170 000Tax receivables 7 145 245 133 101 400 638Other short-term receivables 8 463 597 259 579 422 932Short-term derivatives 11 14 106 7 988 -Other current financial assets - 3 070 -
Cash and cash equivalentsCash and cash equivalents 9 80 764 785 622 115 286
Total current assets 831 022 1 355 635 1 178 290
TOTAL ASSETS 9 116 244 10 279 778 9 255 196
Group

17
STATEMENT OF FINANCIAL POSITION (Unaudited)
(USD 1 000) Note 30.09.2017 30.09.2016 31.12.2016
EQUITY AND LIABILITIES
EquityShare capital 54 349 54 349 54 349Share premium 3 150 567 3 150 567 3 150 567Other equity -702 814 -626 206 -755 709
Total equity 2 502 102 2 578 710 2 449 207
Non-current liabilitiesDeferred taxes 7 1 137 008 1 414 944 1 045 542Long-term abandonment provision 15 2 210 726 2 019 566 2 080 940Provisions for other liabilities 10 89 209 359 909 218 562
Long-term bonds 13 625 726 525 645 510 337Long-term derivatives 11 8 356 20 072 35 659Other interest-bearing debt 14 1 396 158 2 639 517 2 030 209
Current liabilitiesTrade creditors 72 787 77 042 88 156Accrued public charges and indirect taxes 15 280 22 598 39 048Tax payable 7 265 080 - 92 661Short-term derivatives 11 2 128 - 5 049Short-term abandonment provision 15 152 668 83 498 75 981Other current liabilities 12 639 016 538 276 583 844
Total liabilities 6 614 142 7 701 068 6 805 988
TOTAL EQUITY AND LIABILITIES 9 116 244 10 279 778 9 255 196
Group
18QUARTERLY REPORT Q3 2017
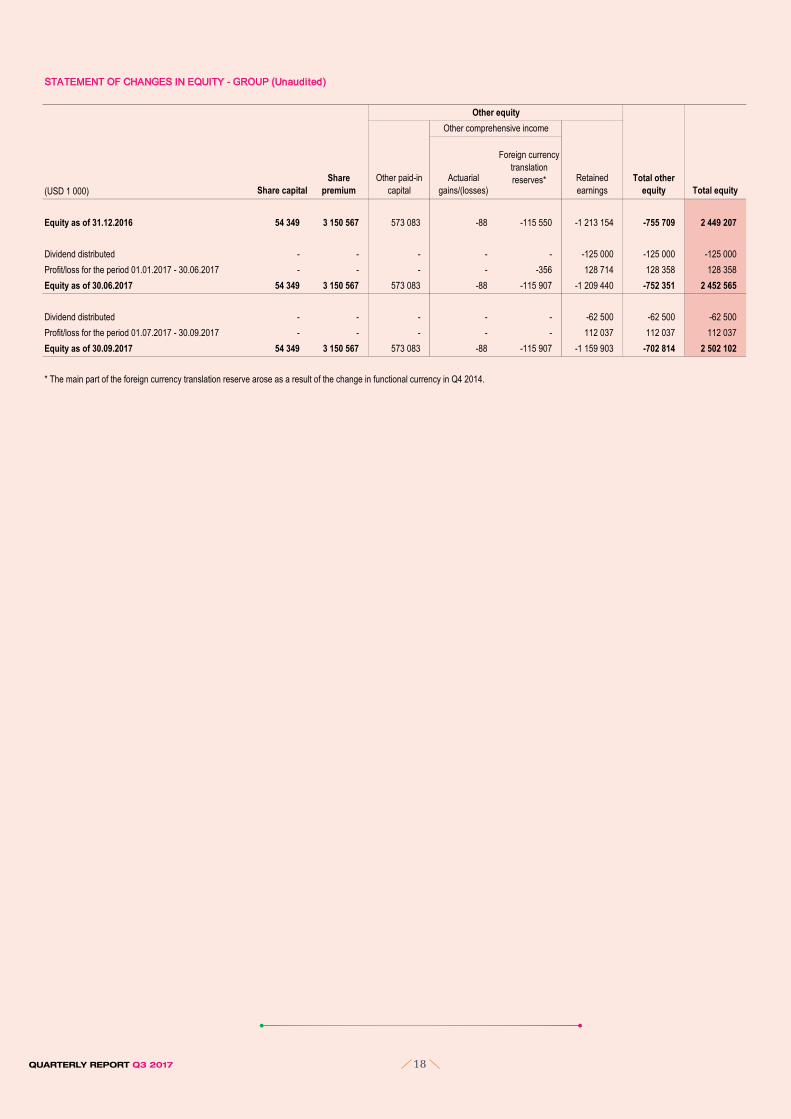
STATEMENT OF CHANGES IN EQUITY - GROUP (Unaudited)
(USD 1 000)
Equity as of 31.12.2016 54 349 3 150 567 573 083 -88 -115 550 -1 213 154 -755 709 2 449 207
Dividend distributed - - - - - -125 000 -125 000 -125 000Profit/loss for the period 01.01.2017 - 30.06.2017 - - - - -356 128 714 128 358 128 358Equity as of 30.06.2017 54 349 3 150 567 573 083 -88 -115 907 -1 209 440 -752 351 2 452 565
Dividend distributed - - - - - -62 500 -62 500 -62 500Profit/loss for the period 01.07.2017 - 30.09.2017 - - - - - 112 037 112 037 112 037Equity as of 30.09.2017 54 349 3 150 567 573 083 -88 -115 907 -1 159 903 -702 814 2 502 102
Total other equity Total equity
* The main part of the foreign currency translation reserve arose as a result of the change in functional currency in Q4 2014.
Other equity
Share capitalShare
premiumOther paid-in
capitalActuarial
gains/(losses)
Foreign currency translation reserves* Retained
earnings
Other comprehensive income
19
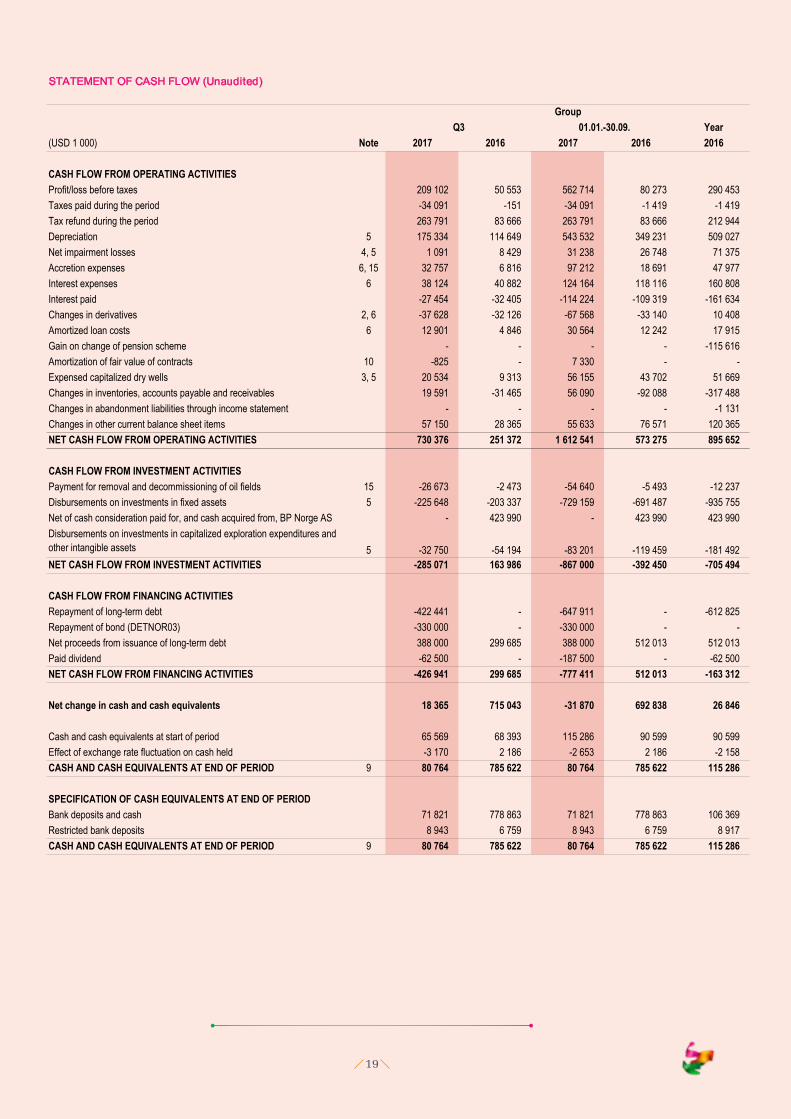
STATEMENT OF CASH FLOW (Unaudited)
Year(USD 1 000) Note 2017 2016 2017 2016 2016
CASH FLOW FROM OPERATING ACTIVITIESProfit/loss before taxes 209 102 50 553 562 714 80 273 290 453Taxes paid during the period -34 091 -151 -34 091 -1 419 -1 419Tax refund during the period 263 791 83 666 263 791 83 666 212 944Depreciation 5 175 334 114 649 543 532 349 231 509 027Net impairment losses 4, 5 1 091 8 429 31 238 26 748 71 375Accretion expenses 6, 15 32 757 6 816 97 212 18 691 47 977Interest expenses 6 38 124 40 882 124 164 118 116 160 808Interest paid -27 454 -32 405 -114 224 -109 319 -161 634Changes in derivatives 2, 6 -37 628 -32 126 -67 568 -33 140 10 408Amortized loan costs 6 12 901 4 846 30 564 12 242 17 915Gain on change of pension scheme - - - - -115 616Amortization of fair value of contracts 10 -825 - 7 330 - -Expensed capitalized dry wells 3, 5 20 534 9 313 56 155 43 702 51 669Changes in inventories, accounts payable and receivables 19 591 -31 465 56 090 -92 088 -317 488Changes in abandonment liabilities through income statement - - - - -1 131Changes in other current balance sheet items 57 150 28 365 55 633 76 571 120 365NET CASH FLOW FROM OPERATING ACTIVITIES 730 376 251 372 1 612 541 573 275 895 652
CASH FLOW FROM INVESTMENT ACTIVITIESPayment for removal and decommissioning of oil fields 15 -26 673 -2 473 -54 640 -5 493 -12 237Disbursements on investments in fixed assets 5 -225 648 -203 337 -729 159 -691 487 -935 755Net of cash consideration paid for, and cash acquired from, BP Norge AS - 423 990 - 423 990 423 990
NET CASH FLOW FROM INVESTMENT ACTIVITIES -285 071 163 986 -867 000 -392 450 -705 494
CASH FLOW FROM FINANCING ACTIVITIESRepayment of long-term debt -422 441 - -647 911 - -612 825Repayment of bond (DETNOR03) -330 000 - -330 000 - -Net proceeds from issuance of long-term debt 388 000 299 685 388 000 512 013 512 013Paid dividend -62 500 - -187 500 - -62 500NET CASH FLOW FROM FINANCING ACTIVITIES -426 941 299 685 -777 411 512 013 -163 312
Net change in cash and cash equivalents 18 365 715 043 -31 870 692 838 26 846
Cash and cash equivalents at start of period 65 569 68 393 115 286 90 599 90 599Effect of exchange rate fluctuation on cash held -3 170 2 186 -2 653 2 186 -2 158CASH AND CASH EQUIVALENTS AT END OF PERIOD 9 80 764 785 622 80 764 785 622 115 286
SPECIFICATION OF CASH EQUIVALENTS AT END OF PERIODBank deposits and cash 71 821 778 863 71 821 778 863 106 369Restricted bank deposits 8 943 6 759 8 943 6 759 8 917CASH AND CASH EQUIVALENTS AT END OF PERIOD 9 80 764 785 622 80 764 785 622 115 286
Group
-181 492Disbursements on investments in capitalized exploration expenditures and other intangible assets -32 750 -54 1945
Q3 01.01.-30.09.
-83 201 -119 459

20QUARTERLY REPORT Q3 2017
NOTES(All figures in USD 1 000 unless otherwise stated)
Note 1 Accounting principles
Note 2 Income
Breakdown of petroleum revenues (USD 1 000) 2017 2016 2017 2016
Recognized income liquids 508 390 229 954 1 557 881 660 364Recognized income gas 85 936 14 338 263 117 51 752Tariff income 6 482 2 922 17 451 7 138Total petroleum revenues 600 808 247 213 1 838 450 719 254
Breakdown of produced volumes (barrels of oil equivalent)
Liquids 9 434 958 4 909 309 29 787 298 14 754 370Gas 2 698 032 595 866 8 412 970 1 948 807Total produced volumes 12 132 990 5 505 174 38 200 268 16 703 177
Other income (USD 1 000)
Realized gain/loss (-) on oil derivatives -1 291 5 640 -4 892 28 702Unrealized gain/loss (-) on oil derivatives -6 353 -4 993 -947 -43 436Gain on license transactions 2 718 - 3 274 -Other income 306 132 1 054 3 986Total other income -4 620 779 -1 511 -10 748
Q3 01.01.-30.09.Group
The acquisition of BP Norge AS was completed on 30 September 2016. Corresponding Income statement figures for 2016 are therefore not directly comparable as they represent Aker BP prior to the acquisition of BP Norge AS.
These interim financial statements were authorised for issue by the Company’s Board of Directors on 27 October 2017.
The significant judgements made by management in applying the Group’s accounting policies and the key sources of estimation uncertainty were the same as those that applied to the annual financial statements as at 31 December 2016.
The accounting principles used for this interim report are consistent with the principles used in the group's annual financial statements as at 31 December 2016. There are no new standards effective from 1 January 2017.
In preparing these interim financial statements, management has made judgements, estimates and assumptions that affect the application of accounting policies and the reported amounts of assets and liabilities, income and expense. Actual results may differ from these estimates.
These interim financial statements have been prepared in accordance with the International Financial Reporting Standards as adopted by the EU ("IFRS") IAS 34 "Interim Financial Reporting", thus the interim financial statements do not include all information required by IFRS and should be read in conjunction with the group's annual financial statement as at 31 December 2016. The interim financial statements reflect all adjustments which are, in the opinion of management, necessary for a fair statement of the financial position, results of operations and cash flows for the dates and interim periods presented. Interim period results are not necessarily indicative of results of operations or cash flows for an annual period. These interim financial statements have not been subject to review or audit by independent auditors.

21
Note 3 Exploration expenses
Breakdown of exploration expenses (USD 1 000) 2017 2016 2017 2016
Seismic 15 840 4 810 43 647 11 006Area fee 3 653 4 151 12 225 9 255Dry well expenses* 20 534 9 313 56 155 43 702Other exploration expenses 23 859 12 569 57 493 39 210Total exploration expenses 63 887 30 843 169 521 103 172
* Mainly related to the Hyrokkin and Nordfjellet wells.
Note 4 Impairments
Impairment testingImpairment tests of individual cash-generating units are performed when impairment triggers are identified.
As described in previous financial reporting, the technical goodwill recognized in relation to prior year`s business combinations, will be subject to impairment charges as it is fully allocated to the respective individual CGU's. Hence, a quarterly impairment charge is expected if all assumptions remain unchanged. However, in Q3 2017 there has been an increase in forward prices as well as some updates of the production profiles. The group's calculation shows that no impairment charge of technical goodwill is needed. Previous impairment of technical goodwill in 2017 amounted to USD 29.2 million.
The minor impairment of USD 1.1 million in the quarter mainly relates to intangible assets recognized in acquisitions of exploration licenses which are in the process of being relinquished.
GroupQ3 01.01.-30.09.

22QUARTERLY REPORT Q3 2017
Note 5 Tangible fixed assets and intangible assets
TANGIBLE FIXED ASSETS - GROUP
(USD 1 000)
Book value 31.12.2016 907 108 3 501 908 32 779 4 441 796
Acquisition cost 31.12.2016 908 674 4 950 566 56 137 5 915 377Additions 412 095 114 717 14 401 541 213Disposals 4 200 - 1 685 5 884Reclassification -69 332 132 258 2 661 65 587Acquisition cost 30.06.2017 1 247 238 5 197 541 71 514 6 516 293
Accumulated depreciation and impairments 31.12.2016 1 566 1 448 659 23 357 1 473 582Depreciation - 315 106 4 494 319 600Impairment -6 - - -6Retirement/transfer depreciations - - -1 685 -1 685Accumulated depreciation and impairments 30.06.2017 1 560 1 763 765 26 167 1 791 491
Book value 30.06.2017 1 245 678 3 433 777 45 347 4 724 803
Acquisition cost 30.06.2017 1 247 238 5 197 541 71 514 6 516 293Additions 132 709 78 826 18 028 229 562Disposals* 19 961 29 546 -154 49 353Reclassification** -105 147 102 105 3 690 648Acquisition cost 30.09.2017 1 254 838 5 348 926 93 386 6 697 150
Accumulated depreciation and impairments 30.06.2017 1 560 1 763 765 26 167 1 791 491Depreciation - 149 234 4 065 153 299Impairment - - 128 128Retirement/transfer depreciations* 6 -29 546 154 -29 386Accumulated depreciation and impairments 30.09.2017 1 566 1 883 452 30 513 1 915 532
Book value 30.09.2017 1 253 272 3 465 473 62 873 4 781 618
** The reclassification in this quarter is mainly related to infill wells on Vallhall and Volund.
* The disposal mainly relates to sale of 35 per cent share in Storklakken, as well as derecognition of the Glitne field as the removal and decommissioning operations in all material respect are finalized.
Capitalized exploration expenditures are reclassified to "Fields under development" when the field enters into the development phase. If development plans are subsequently re-evaluated, the associated costs remain in assets under development and are not reclassified back to exploration assets. Fields under development are reclassified to "Production facilities" from the start of production. Production facilities, including wells, are depreciated in accordance with the Unit of Production Method. Office machinery, fixtures and fittings etc. are depreciated using the straight-line method over their useful life, i.e. 3 - 5 years. Removal and decommissioning costs are included as production facilities or fields under development.
Production facilities
including wells
Fixtures and fittings, office
machinery TotalAssets under development

23
INTANGIBLE ASSETS - GROUP
(USD 1 000) Licences etc. Software Total Goodwill
Book value 31.12.2016 1 332 534 279 1 332 813 395 260 1 846 971
Acquisition cost 31.12.2016 1 575 203 7 501 1 582 705 395 260 2 720 835Additions 246 - 246 50 205 -Disposals/expensed dry wells 858 - 858 35 621 324Reclassification -11 - -11 -65 576 -Acquisition cost 30.06.2017 1 574 581 7 501 1 582 082 344 268 2 720 511
Accumulated depreciation and impairments 31.12.2016 242 670 7 223 249 892 - 873 864Depreciation 48 458 140 48 598 - -Impairment 992 - 992 - 29 161Retirement/transfer depreciations - - - - -Accumulated depreciation and impairments 30.06.2017 292 119 7 363 299 482 - 903 025
Book value 30.06.02017 1 282 462 138 1 282 600 344 268 1 817 486
Acquisition cost 30.06.2017 1 574 581 7 501 1 582 082 344 268 2 720 511Additions -90 - -90 32 841Disposals/expensed dry wells* 10 120 - 10 120 20 534 9 619Reclassification - - - -648 -Acquisition cost 30.09.2017 1 564 371 7 501 1 571 872 355 926 2 710 892
Accumulated depreciation and impairments 30.06.2017 292 119 7 363 299 482 - 903 025Depreciation 21 965 70 22 035 - -Impairment 963 - 963 - -Retirement/transfer depreciations* -10 120 - -10 120 - -9 619Accumulated depreciation and impairments 30.09.2017 304 928 7 433 312 361 - 893 406
Book value 30.09.2017 1 259 443 68 1 259 511 355 926 1 817 486
Depreciation in the Income statement (USD 1 000) 2017 2016 2017 2016
Depreciation of tangible fixed assets 153 299 92 353 472 899 284 904Depreciation of intangible assets 22 035 22 296 70 633 64 327Total depreciation in the Income statement 175 334 114 649 543 532 349 231
Impairment in the Income statement (USD 1 000)
Impairment/reversal of tangible fixed assets 128 - 121 -9 870Impairment/reversal of intangible assets 963 8 429 1 956 8 429Impairment of goodwill - - 29 161 28 189Total impairment in the Income statement 1 091 8 429 31 238 26 748
* The disposal mainly relates to sale of 35 per cent share in Storklakken, as well as derecognition of the Glitne field as the removal and decommissioning operations in all material respect are finalized.
01.01.-30.09.Q3Group
Exploration wellsOther intangible assets
24QUARTERLY REPORT Q3 2017
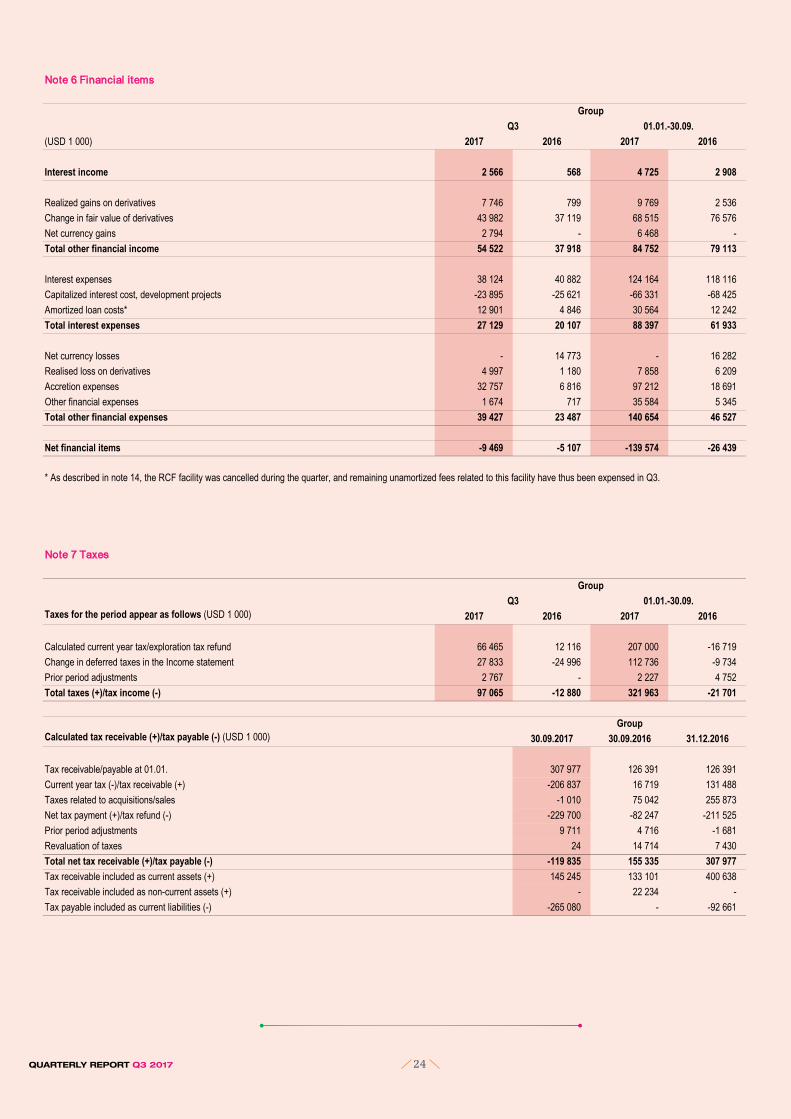
Note 6 Financial items
(USD 1 000) 2017 2016 2017 2016
Interest income 2 566 568 4 725 2 908
Realized gains on derivatives 7 746 799 9 769 2 536Change in fair value of derivatives 43 982 37 119 68 515 76 576Net currency gains 2 794 - 6 468 -Total other financial income 54 522 37 918 84 752 79 113
Interest expenses 38 124 40 882 124 164 118 116Capitalized interest cost, development projects -23 895 -25 621 -66 331 -68 425Amortized loan costs* 12 901 4 846 30 564 12 242Total interest expenses 27 129 20 107 88 397 61 933
Net currency losses - 14 773 - 16 282Realised loss on derivatives 4 997 1 180 7 858 6 209Accretion expenses 32 757 6 816 97 212 18 691Other financial expenses 1 674 717 35 584 5 345Total other financial expenses 39 427 23 487 140 654 46 527
Net financial items -9 469 -5 107 -139 574 -26 439
Note 7 Taxes
Taxes for the period appear as follows (USD 1 000) 2017 2016 2017 2016
Calculated current year tax/exploration tax refund 66 465 12 116 207 000 -16 719Change in deferred taxes in the Income statement 27 833 -24 996 112 736 -9 734Prior period adjustments 2 767 - 2 227 4 752Total taxes (+)/tax income (-) 97 065 -12 880 321 963 -21 701
Calculated tax receivable (+)/tax payable (-) (USD 1 000) 30.09.2017 30.09.2016 31.12.2016
Tax receivable/payable at 01.01. 307 977 126 391 126 391Current year tax (-)/tax receivable (+) -206 837 16 719 131 488Taxes related to acquisitions/sales -1 010 75 042 255 873Net tax payment (+)/tax refund (-) -229 700 -82 247 -211 525Prior period adjustments 9 711 4 716 -1 681Revaluation of taxes 24 14 714 7 430Total net tax receivable (+)/tax payable (-) -119 835 155 335 307 977Tax receivable included as current assets (+) 145 245 133 101 400 638Tax receivable included as non-current assets (+) - 22 234 -Tax payable included as current liabilities (-) -265 080 - -92 661
Group
Group
01.01.-30.09.
Q3
GroupQ3
01.01.-30.09.
* As described in note 14, the RCF facility was cancelled during the quarter, and remaining unamortized fees related to this facility have thus been expensed in Q3.

25
Deferred taxes (-)/deferred tax asset (+) (USD 1 000) 30.09.2017 30.09.2016 31.12.2016
Deferred taxes/deferred tax asset 01.01. -1 045 542 -1 356 114 -1 356 114Change in deferred taxes in the Income statement -112 736 9 734 -374 617Reclassification of acquired loss carried forward - -60 379 -238 866Deferred tax related to acquisitions/sales 19 190 890 510 942 611Prior period adjustment 2 080 -9 587 -18 555Deferred tax charged to OCI and equity - - -1Net deferred tax (-)/deferred tax asset (+) -1 137 008 -525 836 -1 045 542Deferred tax asset - 889 108 -Deferred tax -1 137 008 -1 414 944 -1 045 542
Reconciliation of tax expense (USD 1 000) 2017 2016 2017 2016
78% tax rate on profit before tax 162 822 39 431 438 639 62 613Tax effect of uplift -30 027 -24 598 -92 274 -75 722Permanent difference on impairment - - 22 813 21 987Foreign currency translation of NOK monetary items -2 067 5 970 -4 933 10 689Foreign currency translation of USD monetary items 84 627 78 567 131 289 180 741Tax effect of financial and other 24%/25% items -33 492 -51 580 -42 989 -104 214Revaluation of tax balances* -82 614 -57 924 -132 524 -117 850Other permanent differences and prior period adjustment -2 184 -2 747 1 942 54Total taxes (+)/tax income (-) 97 065 -12 880 321 963 -21 701
The tax rate for general corporation tax changed from 25 to 24 per cent from 1 January 2017. The rate for special tax changed from the same date from 53 to 54 per cent.
Note 8 Other short-term receivables
(USD 1 000) 30.09.2017 30.09.2016 31.12.2016
Prepayments 29 604 34 835 40 730VAT receivable 9 163 9 478 7 913Underlift of petroleum 51 308 59 590 70 003Accrued income from sale of petroleum products 116 222 6 024 86 429Other receivables, mainly from licenses 257 300 149 651 217 857Total other short-term receivables 463 597 259 579 422 932
Q3 01.01.-30.09.
* Tax balances are in NOK and converted to USD using the period end currency rate. When NOK weakens against USD, the tax rate increases as there is less remaining tax depreciation measured in USD (vice versa).
In accordance with statutory requirements, the calculation of current tax is required to be based on NOK functional currency. This may impact the tax rate as the company's functional currency is USD.
Group
Group
Group

26QUARTERLY REPORT Q3 2017
Note 9 Cash and cash equivalents
The item 'Cash and cash equivalents' consists of bank accounts and short-term investments that constitute parts of the group`s transaction liquidity.
Breakdown of cash and cash equivalents (USD 1 000) 30.09.2017 30.09.2016 31.12.2016
Bank deposits 71 821 778 863 106 369Restricted funds (tax withholdings) 8 943 6 759 8 917Cash and cash equivalents 80 764 785 622 115 286
Unused revolving credit facility (see note 14) - 550 000 550 000Unused reserve-based lending facility (see note 14) 2 540 000 162 000 1 805 000
Note 10 Provisions for other liabilities
Breakdown of provisions for other liabilities (USD 1 000) 30.09.2017 30.09.2016 31.12.2016
Fair value of contracts assumed in acquisition of BP Norge AS* 80 766 210 425 202 874Other long term liabilities 8 443 149 483 15 688Total provisions for other liabilities 89 209 359 909 218 562
Note 11 Derivatives
(USD 1 000) 30.09.2017 30.09.2016 31.12.2016
Unrealized gain currency contracts 23 238 14 924 -Long-term derivatives included in assets 23 238 14 924 -Unrealized gain on commodity derivatives - 1 781 -Unrealized gain currency contracts 14 106 6 207 -Short-term derivatives included in assets 14 106 7 988 -Total derivatives included in assets 37 344 22 912 -
Unrealized losses currency contracts - - 5 073Unrealized losses interest rate swaps 8 356 20 072 30 586Long-term derivatives included in liabilities 8 356 20 072 35 659Unrealized losses currency contracts - - 3 868Unrealized losses commodity derivatives 2 128 - 1 181Short-term derivatives included in liabilities 2 128 - 5 049Total derivatives included in liabilities 10 484 20 072 40 708
The group has different types of hedging instruments. The commodity derivatives are used to hedge the risk of oil price reduction. The group manages its interest rate exposure using interest rate derivatives, including a cross currency interest rate swap. Foreign currency exchange derivatives are used to manage the company's exposure to currency risks, mainly NOK, EUR and GBP. These derivatives are mark to market with changes in market value recognized in the Income statement.The nature of the instruments and the valuation method is consistent with the disclosed information in the annual financial statements as at 31 December 2016.
Group
* The negative contract values are related to rig contracts entered into by BP Norge AS, which were different from current market terms at the time of the acquisition. The fair value was based on the difference between market price and contract price at the time of the acquisition. The balance is split between current and non-current liabilities based on the cash flow in the contracts, and amortized over the lifetime of the contracts. In Q3 2017 there has been a reclassification between fair value of contracts and abandonment liabilities as described in note 15.
Group
Group

27
Note 12 Other current liabilities
Breakdown of other current liabilities (USD 1 000) 30.09.2017 30.09.2016 31.12.2016
Current liabilities related to overcall in licences 78 595 104 821 81 686Share of other current liabilities in licences 389 230 329 299 360 222Overlift of petroleum 1 940 9 561 20 000Fair value of contracts assumed in acquisition of BP Norge AS* 19 316 - 36 199Other current liabilities** 149 935 94 596 85 737Total other current liabilities 639 016 538 276 583 844
* Refer to note 10.
** Other current liabilities include unpaid wages and vacation pay, accrued interest and other provisions.
Note 13 Bonds
(USD 1 000) 30.09.2017 30.09.2016 31.12.2016
DETNOR02 Senior unsecured bond 1) 237 126 230 274 214 827DETNOR03 Subordinated PIK toggle bond 2) - 295 371 295 510AKERBP – Senior Notes 2017 (17/22) 3) 388 600 - -Long-term bonds 625 726 525 645 510 337
2) As described in the Q2 2017 report, the bond was repaid in July 2017.
Note 14 Other interest-bearing debt
(USD 1 000) 30.09.2017 30.09.2016 31.12.2016
Reserve-based lending facility 1 396 158 2 639 517 2 030 209Total other interest-bearing debt 1 396 158 2 639 517 2 030 209
- Interest Coverage Ratio shall be minimum 3.5
The interest rate is from 1 - 6 months LIBOR plus a margin of 2 - 3 per cent based on drawn amount. In addition, a commitment fee is paid on unused credit.
Group
Group
Group
- Leverage Ratio shall be maximum 4 untill the production start of Johan Sverdrup, thereafter maximum 3.5
1) The loan is denominated in NOK and runs from July 2013 to July 2020 and carries an interest rate of 3 month NIBOR + 6.5 per cent. The principal falls due on July 2020 and interest is paid on a quarterly basis. The loan is unsecured. The loan has been swapped into USD using a cross currency interest rate swap whereby the group pays LIBOR + 6.81 per cent quarterly. In connection with the RBL amendment described in note 14, the financial covenants in this bond has been adjusted to be consistent with the RBL.
3) The bond was established in July 2017 and carries an interest of 6 per cent. The principal falls due on July 2022 and interest is paid on a semiannually basis. The loan is senior unsecured and has no financial covenants.
The RBL facility was established in 2014 and is a senior secured seven-year facility. The facility was originally USD 3.0 billion, with an additional uncommitted accordion option of USD 1.0 billion. In connection with the acquisition of BP Norge AS, the facility size was increased to USD 4.0 billion. In addition a new, uncommitted, accordion option of USD 1.0 billion was added to the facility.
In Q3 2017 certain amendments have been made to the RBL facility. The borrowing base under the amended facility is set annually based on the company’s certified 2P reserves. Current availability under the RBL is USD 4 billion. In addition, the financial covenants have been adjusted as follows:
As part of the amendment process of the RBL facility, the revolving credit facility ("RCF") of USD 550 miillion was cancelled during the quarter.

28QUARTERLY REPORT Q3 2017
Note 15 Provision for abandonment liabilities
(USD 1 000) 30.09.2017 30.09.2016 31.12.2016
Provisions as of 1 January 2 156 921 423 325 423 325Abandonment liabilities from acquisition of BP Norge AS* 128 143 1 588 236 1 680 206Incurred cost removal -47 310 -5 493 -12 237Accretion expense - present value calculation 97 212 18 691 47 977Change in estimates and incurred liabilities on new fields** 28 427 78 306 17 650Total provision for abandonment liabilities 2 363 394 2 103 065 2 156 921
Break down of the provision to short-term and long-term liabilitiesShort-term 152 668 83 498 75 981Long-term 2 210 726 2 019 566 2 080 940Total provision for abandonment liabilities 2 363 394 2 103 065 2 156 921
** The change in estimates are mainly related to the completion of new wells on producing fields.
Note 16 Contingent liabilities
Note 17 Subsequent events
24 October 2017 the company announced that it has entered into an agreement to acquire all the shares in Hess Norge AS for a cash consideration of USD 2.0 billion. Hess Norge’s assets include a 64.05 per cent share of the Valhall field and a 62.5 per cent share of the Hod field, and a tax loss carry forward with a net nominal after tax value of USD 1.5 billion. The cash consideration will be financed through Aker BP's existing long-term Reserve Based Lending bank facility, and by new equity of USD 500 million.
The estimate is based on executing a concept for abandonment in accordance with the Petroleum Activities Act and international regulations and guidelines. The calculations assume an inflation rate of 2.5 per cent and a nominal discount rate before tax of between 4.14 per cent and 6.35 per cent.
During the normal course of its business, the group will be involved in disputes, including tax disputes. The group has made accruals for probable liabilities related to litigation and claims based on management's best judgment and in line with IAS 37 and IAS 12.
Group
* The increase of USD 128 million is caused by a reclassification between fair value of contracts and abandonment liabilities, both in relation to the acquisition of BP Norge AS.

29
Note 18 Investments in joint operations
Fields operated: 30.09.2017 30.06.2017 Fields non-operated: 30.09.2017 30.06.2017Alvheim 65.000 % 65.000 % Atla 10.000 % 10.000 %Bøyla 65.000 % 65.000 % Enoch 2.000 % 2.000 %Hod 37.500 % 37.500 % Gina Krog 3.300 % 3.300 %Ivar Aasen Unit 34.786 % 34.786 % Johan Sverdrup 11.5733 % 11.5733 %Jette Unit 70.000 % 70.000 % Jotun 7.000 % 7.000 %Valhall 35.953 % 35.953 % Oda 15.000 % 15.000 %Vilje 46.904 % 46.904 % Varg 5.000 % 5.000 %Volund 65.000 % 65.000 %Tambar 55.000 % 55.000 %Tambar Øst 46.200 % 46.200 %Ula 80.000 % 80.000 %Skarv 23.835 % 23.835 %
Production licences in which Aker BP is the operator: Production licences in which Aker BP is a partner:Licence: 30.09.2017 30.06.2017 Licence: 30.09.2017 30.06.2017PL 001B 35.000 % 35.000 % PL 006C 15.000 % 15.000 %PL 006B 35.833 % 35.833 % PL 018DS 13.338 % 13.338 %PL 019 80.000 % 80.000 % PL 019C 30.000 % 30.000 %PL 026B 90.260 % 90.260 % PL 026 30.000 % 30.000 %PL 027D 100.000 % 100.000 % PL 029B 20.000 % 20.000 %PL 028B 35.000 % 35.000 % PL 035 50.000 % 50.000 %PL 033 37.500 % 37.500 % PL 035C 50.000 % 50.000 %PL 033B 37.500 % 37.500 % PL 038 5.000 % 5.000 %PL 036C 65.000 % 65.000 % PL 048D 10.000 % 10.000 %PL 036D 46.904 % 46.904 % PL 102C 10.000 % 10.000 %PL 065 55.000 % 55.000 % PL 102D 10.000 % 10.000 %PL 088BS 65.000 % 65.000 % PL 102F 10.000 % 10.000 %PL 103B 70.000 % 70.000 % PL 102G 10.000 % 10.000 %PL 150 65.000 % 65.000 % PL 265 20.000 % 20.000 %PL 150B 65.000 % 65.000 % PL 272 50.000 % 50.000 %PL 169C 50.000 % 50.000 % PL 405 15.000 % 15.000 %PL 203 65.000 % 65.000 % PL 457BS 40.000 % 40.000 %PL 203B 65.000 % 65.000 % PL 492 60.000 % 60.000 %PL 212 30.000 % 30.000 % PL 502 22.222 % 22.222 %PL 212B 30.000 % 30.000 % PL 507 45.000 % 45.000 %PL 212E 30.000 % 30.000 % PL 533 35.000 % 35.000 %PL 242 35.000 % 35.000 % PL 554 30.000 % 30.000 %PL 261 50.000 % 50.000 % PL 554B 30.000 % 30.000 %PL 262 30.000 % 30.000 % PL 554C 30.000 % 30.000 %PL 300 55.000 % 55.000 % PL 627 20.000 % 20.000 %PL 340 65.000 % 65.000 % PL 627B 20.000 % 20.000 %PL 340BS 65.000 % 65.000 % PL 719 20.000 % 20.000 %PL 364** 90.260 % 90.260 % PL 721 40.000 % 40.000 %PL 442 90.260 % 90.260 % PL 722 20.000 % 20.000 %PL 442B*** 90.260 % 90.260 % PL 778 20.000 % 20.000 %PL 460** 65.000 % 100.000 % PL 782S 20.000 % 20.000 %PL 504 47.593 % 47.593 % PL 782SB 20.000 % 20.000 %PL 626 50.000 % 50.000 % PL 782SC*** 20.000 % 20.000 %PL 659 50.000 % 50.000 % PL 811 20.000 % 20.000 %PL 677 60.000 % 60.000 % PL 813 3.300 % 3.300 %PL 715 40.000 % 40.000 % PL 838 30.000 % 30.000 %PL 724 40.000 % 40.000 % PL 842 30.000 % 30.000 %PL 724B 40.000 % 40.000 % PL 844 20.000 % 20.000 %PL 748 50.000 % 50.000 % PL 852 40.000 % 40.000 %PL 748B*** 50.000 % 50.000 % PL 857 20.000 % 20.000 %PL 762 20.000 % 20.000 % PL 862*** 50.000 % 50.000 %PL 777 40.000 % 40.000 % PL 863*** 40.000 % 40.000 %PL 777B 40.000 % 40.000 % PL 864*** 20.000 % 20.000 %PL 777C*** 40.000 % 40.000 % PL 871*** 20.000 % 20.000 %PL 784 40.000 % 40.000 % PL 891*** 30.000 % 30.000 %PL 790 30.000 % 30.000 % PL 892*** 30.000 % 30.000 %PL 814 40.000 % 40.000 % PL 902*** 30.000 % 30.000 %PL 818 40.000 % 40.000 % Number 47 47PL 821 60.000 % 60.000 %PL 821B*** 60.000 % 60.000 %PL 822S 60.000 % 60.000 %PL 839 23.835 % 23.835 %PL 843 40.000 % 40.000 %PL 858 40.000 % 40.000 %PL 861*** 50.000 % 50.000 %PL 867*** 40.000 % 40.000 %PL 868*** 60.000 % 60.000 %PL 869*** 40.000 % 40.000 %PL 872*** 40.000 % 40.000 %PL 873*** 40.000 % 40.000 %PL 874*** 90.260 % 90.260 %PL 893*** 60.000 % 60.000 %PL 895*** 60.000 % 60.000 %Number 63 63
*** Interest awarded in the APA Licensing round (Application in Predefined Areas) in 2016. The awards were announced in 2017.** Acquired/changed through licence transactions or licence splits.* Relinquished licences or Aker BP has withdrawn from the licence.

30QUARTERLY REPORT Q3 2017
Note 19 Results from previous interim reports
2015(USD 1 000) Q3 Q2 Q1 Q4 Q3 Q2 Q1 Q4
Total income 596 188 594 501 646 250 655 624 247 993 255 665 204 848 254 634
Exploration expenses 63 887 75 375 30 259 44 281 30 843 36 214 36 115 18 867Production costs 134 411 121 017 120 874 121 139 32 188 39 116 34 374 24 077Depreciation 175 334 184 194 184 004 159 796 114 649 120 264 114 318 111 590Impairments 1 091 365 29 782 44 627 8 429 -19 644 37 964 191 939Other operating expenses 2 893 3 113 8 051 5 029 6 223 5 410 5 330 3 228
Total operating expenses 377 617 384 065 372 969 374 872 192 333 181 360 228 101 349 701
Operating profit/loss 218 571 210 436 273 280 280 752 55 660 74 305 -23 253 -95 067
Net financial items -9 469 -83 597 -46 508 -70 572 -5 107 -28 951 7 620 -56 138
Profit/loss before taxes 209 102 126 840 226 772 210 180 50 553 45 353 -15 633 -151 205Taxes (+)/tax income (-) 97 065 66 944 157 955 277 183 -12 880 39 046 -47 866 4 980
Net profit/loss 112 037 59 896 68 818 -67 003 63 433 6 308 32 233 -156 184
20162017

31
Alternative performance measures
Depreciation per boe is depreciation divided by number of barrels of oil equivalents produced in the corresponding period
Dividend per share (DPS) is dividend paid in the quarter divided by number of shares outstanding
EBIT is short for earnings before interest and other financial items and taxes
EBITDA is short for earnings before interest and other financial items, taxes, depreciation and amortisation and impairments
EBITDAX is short for earnings before interest and other financial items, taxes, depreciation and amortisation, impairments and exploration expenses
Equity ratio is total equity divided by total assets
Net interest-bearing debt is book value of current and non-current interest-bearing debt less cash and cash equivalents
Production cost per boe is production cost divided by number of barrels of oil equivalents produced in the corresponding period
Aker BP may disclose alternative performance measures as part of its financial reporting as a supplement to the financial statements prepared in accordance with IFRS. Aker BP believes that the alternative performance measures provide useful supplemental information to management, investors, security analysts and other stakeholders and are meant to provide an enhanced insight into the financial development of Aker BP’s business operations and to improve comparability between periods.

akerbp.com

![Complications of Pacemaker Implantation - … · Complications of Pacemaker Implantation ... from our Heart Rhythm Center [11] revealed that contrast was used in 55 of 92 (59.8%)](https://img.pdfslide.us/doc/110x75/5b0c581b7f8b9af65e8be784/complications-of-pacemaker-implantation-of-pacemaker-implantation-from-our.jpg)


![EBARA (6361) · December 31, 2016 Results FY Ended December 31, 2017 Results 66.0 131.9 231.5 74.3 148.2 251.9 58.6 117.4 213.8 56.7 118.9 225.7 [Reference] FY Ended December 31,](https://img.pdfslide.us/doc/110x75/5fd6026e6863d42018028baa/ebara-6361-december-31-2016-results-fy-ended-december-31-2017-results-660-1319.jpg)