Embed Size (px)
Citation preview

Akamai Site Analyzer Service Description July 2009

Table of Contents
Introduction 3
How Akamai Site Analyzer Works 4
Site Analyzer Infrastructure and Software 5
Site Analyzer Metrics 5
Management and Control: EdgeControl Management Center 6
Record a Transaction 6
Test Provisioning 6
Reporting and Diagnostics 8
Degradation Alerting 12
Page Check/ Instant Transaction Check 12
Service and Support 13
Professional Services 13
Customer Care 13
Network Operations Command Center (NOCC) 13

Akamai Site Analyzer – Service Description
3
Introduction The Internet is an important channel for businesses to connect and communicate with customers,
prospects, employees, investors and business partners. A well-performing site can translate to a
stronger brand, customer loyalty, repeat visits and increased market share. In contrast, poor
performance can lead to lost revenue and an eroded brand. Monitoring performance and
availability from major end-user networks globally is critical in monetizing web assets and
protecting brand value.
A performance, availability monitoring and diagnostics service for single objects, full HTML pages,
and applications, Site Analyzer is designed to address the challenges faced by companies in
managing their Web assets. It belongs to Akamai’s performance analytics product suite and is
modeled as an active testing service. Site Analyzer provides information that helps construct a
global view of user experience and performance of Web assets from outside the firewall. This
enables the customer to pro-actively determine and isolate performance and availability incidents
and act upon them before site visitors are affected. The service seamlessly integrates into your
operational workflow by providing real time alerts and detailed diagnostic information.
Akamai Site Analyzer is designed to advance a number of key business benefits:
Evaluate End-User Experience on Web assets
• Objectively measure end-user experience across geographies and networks • Ability to monitor uploads as well as downloads • Analyze root-cause of performance/ availability degradation • Proactively act on degradation in performance/ availability of critical assets • Easy sharing of relevant information with all stakeholders within the organization
Low Total Cost of Ownership
• No upfront investment or system integration required to activate the service • Intuitive provisioning and reporting imply lower learning costs for staff
Validate External Content
• Measure 3rd party content – measurements not limited to Akamai delivery • Define performance based Service Level Agreements for 3rd party content
Leverage in Negotiations with Customers (B2B)
• Share concrete and objective metrics with customers • Use performance delivered as leverage in price negotiations Determine ROI on your infrastructure investments
• Set historical baselines for website performance & availability • Quantitatively measure improvement in performance & availability

Akamai Site Analyzer – Service Description
4
Overview and Service Offering Akamai Site Analyzer allows you to effectively monitor websites and applications from major end-user networks across the world.
How Akamai Site Analyzer Works
Akamai Site Analyzer works as follows:
Figure 1: Schematic View of the Site Analyzer service
1. Record a typical end-user’s interaction with the application to a transaction script 2. Provision tests on the Akamai EdgeControl portal with the desired parameters
3. The test configuration is pushed to all relevant nodes in the Site Analyzer agent network to commence monitoring
4. Measurement data collected is sent to the Analytics backend where key metrics are calculated and aggregated with test data from all agents
5. The relevant metrics and diagnostic information is made available on the portal
6. Asset owners setup alerts to receive real-time information on performance and availability
degradation
Customer Origin
Site
Analyzer
Agents
Provisioning Measurements
Reports Akamai Edge control Analytics
Backend

Akamai Site Analyzer – Service Description
5
Site Analyzer Infrastructure and Software
Akamai Site Analyzer operates an independent network of agents. The Site Analyzer network is
managed and maintained separately from the Akamai delivery network.
Agents are deployed in major end-user networks in different geographies. Each agent location has
three machines for redundancy and to manage data quality. As a result, Akamai Site Analyzer’s
ability to monitor from a particular location is not susceptible to a single machine going down.
Agents run a browser-simulation using proprietary Akamai technology. The agent downloads web-
sites and applications similar to the way an end-user browser would and captures various
performance and availability metrics. The metrics are aggregated and represented on the
reporting interface. The reporting interface has been designed in a way to maximize user-
productivity while troubleshooting and minimize user-training overhead.
Site Analyzer Metrics
Site Analyzer metrics are designed to give a quantitative view of end user experience on websites
and applications. The landing page is designed to give the user summary level performance and
availability statistics, isolate poor performance by geography and identify skew in data, if any.
Average Response Time: From an end-user’s perspective, average response time captures
widespread anomalous performance or huge outliers, if any. The response time trend is
constructed by averaging performance measurements across agents and plotting a time trend of
the same. Absolute values are indicative of end-user response times. (Last-mile is not included in
the measurements) The response time chart is useful in conducting comparative performance
studies. Low variability in response time indicates absence of large-scale performance incidents.
Availability: Availability is a measure of application downtime. Poor availability indicates that
many agents experienced issues and downloads ended in error. The sensitivity of the availability
definition used while constructing the trend line can be customized by the category of content.
Both performance and availability trends can be viewed by geography and location of agent.
Average performance and availability can be broken down by location and network of the agent.
The user can trim outliers from the average response time trend. Ability to zoom-in to a time period
that contains a performance or availability incident makes troubleshooting more productive. A
histogram view of the data allows the user to identify statistical distribution of performance data
and skew, if any.

Akamai Site Analyzer – Service Description
6
Management and Control: EdgeControl Management Center
Akamai’s EdgeControl portal functions as the interface for all aspects of management of the
service, including provisioning, reporting, alerting and permissions.
Record a Transaction
The Akamai session recorder is a Mozilla Firefox plug-in. Installing Firefox is a pre-requisite to use the
recorder. The recorder has an easy to use and intuitive user interface. It captures all requests made by
the browser into an XML script, which is used as a transaction blueprint by the agent. The recorder has
advanced provisioning options such as replace host name, specify request headers and include/ exclude
embedded content.
Figure 2: Akamai Session Recorder Snapshot
Test Provisioning
A new test configuration requires: mode of testing, transaction script or URL as appropriate,
frequency of testing, agent group from which the test will execute and the download size limit. The
provisioning interface is intuitive and adding a new test takes under 5 minutes. For multi-page
tests, provisioning validates the script before saving the configuration.

Akamai Site Analyzer – Service Description
7
Figure 3: Sample Edge Control New Test Provisioning Interface
Akamai Site Analyzer – Service Description
8
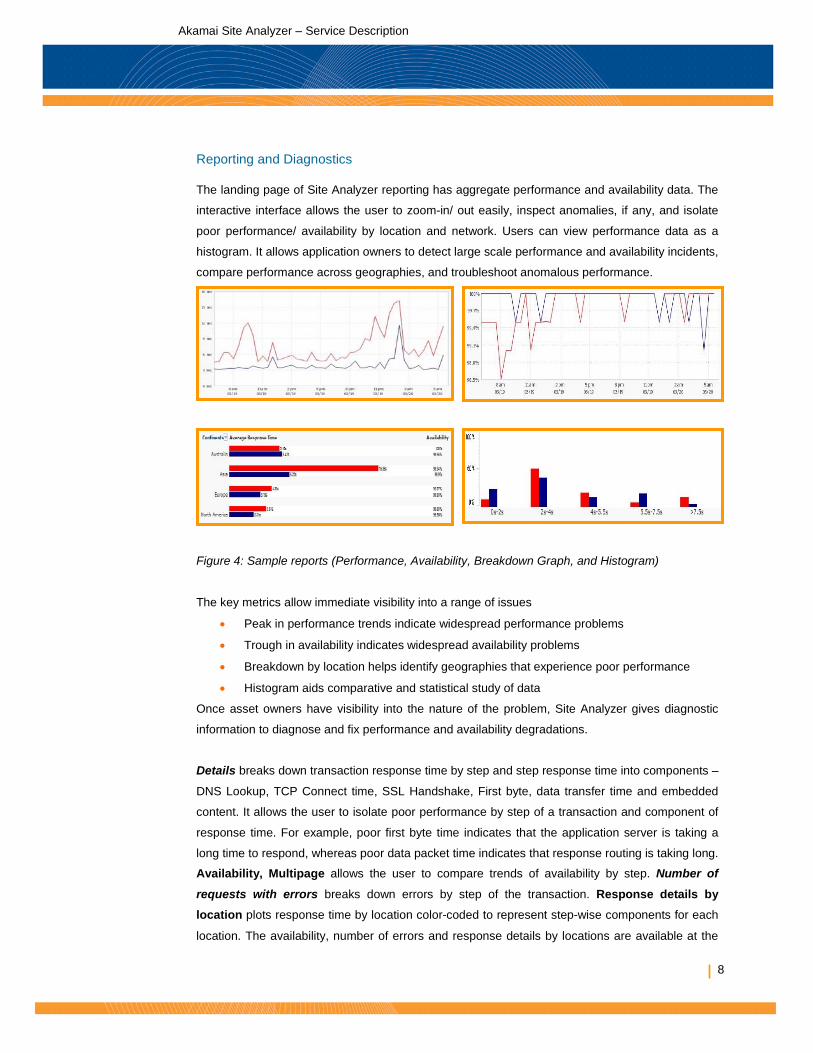
Reporting and Diagnostics
The landing page of Site Analyzer reporting has aggregate performance and availability data. The
interactive interface allows the user to zoom-in/ out easily, inspect anomalies, if any, and isolate
poor performance/ availability by location and network. Users can view performance data as a
histogram. It allows application owners to detect large scale performance and availability incidents,
compare performance across geographies, and troubleshoot anomalous performance.
Figure 4: Sample reports (Performance, Availability, Breakdown Graph, and Histogram)
The key metrics allow immediate visibility into a range of issues
• Peak in performance trends indicate widespread performance problems
• Trough in availability indicates widespread availability problems
• Breakdown by location helps identify geographies that experience poor performance
• Histogram aids comparative and statistical study of data
Once asset owners have visibility into the nature of the problem, Site Analyzer gives diagnostic
information to diagnose and fix performance and availability degradations.
Details breaks down transaction response time by step and step response time into components –
DNS Lookup, TCP Connect time, SSL Handshake, First byte, data transfer time and embedded
content. It allows the user to isolate poor performance by step of a transaction and component of
response time. For example, poor first byte time indicates that the application server is taking a
long time to respond, whereas poor data packet time indicates that response routing is taking long.
Availability, Multipage allows the user to compare trends of availability by step. Number of
requests with errors breaks down errors by step of the transaction. Response details by location plots response time by location color-coded to represent step-wise components for each
location. The availability, number of errors and response details by locations are available at the

Akamai Site Analyzer – Service Description
9
step-level too. Here the charting is similar to single-page testing. The details data breaks down
response time by components, errors plots a trend of the number of errors over time and classifies
the same by base page and embedded object. Breakdown by location, plots color-coded response
times averaged for a location. The color code indicates components of response time.
The details page allows the user to isolate performance and errors by step of a transaction,
component of response time and type of object. It also allows to trend step level performance or
components across locations. This view is an important part of troubleshooting poor performance.
Figure 5: Sample Details charts-Multipage (Details, Availability, Errors and Breakdown by Agent)

Akamai Site Analyzer – Service Description
10
Figure 6: Sample Details charts-Step Level (Details, Availability, Errors and Breakdown by Agent)
Further diagnostic information is available in the Errors page which buckets errors by hostname,
server IP, agent location, error type and step of transaction. The information above is important in
understanding the nature and scope of the degradation. Troubleshooting poor availability involves
the ability to characterize majority errors leading to availability degradation. The error summary
page is built keeping this need in mind.

Akamai Site Analyzer – Service Description
11
Figure 7: Sample Errors reports (bucketed by Hostname, server IP, location, type and step)
Raw Data i.e. unfiltered data from all measurements conducted in the last 90 days is available for
asset owners to view and reuse. Request level data is available as a waterfall chart. Response
time is broken down by component for each of the objects requested by the agent. Also, the
default reporting and charting functionality can be changed to reflect data up to 90 days.
Site Analyzer reports are also email compatible. Reports, with the same information as in the
portal, can be emailed to relevant stakeholders on a recurring basis. The reports can be converted
to a PDF format while sharing.

Akamai Site Analyzer – Service Description
12
Degradation Alerting
Site Analyzer allows application owners to set up alerts on performance degradation and
availability. The owners define a threshold (download time) and the scope (number of agents
reporting degradation) for the alerts to fire. Alerting allows owners to proactively act upon these
degradations before actual end users report the same. Site Analyzer alerts can be forwarded to
relevant email or pager addresses to ensure easy 24x7 monitoring of web applications.
Page Check/ Instant Transaction Check
The Instant page check feature allows the users to immediately check the performance of a
website or application from up to 10 locations. The metrics reported in the instant check are the
same as request details.
Figure 8: Sample Instant check report
Instant check is useful when owners are trying to validate a reported performance problem either
through Site Analyzer alerts or end user feedback. This can also be used to verify the impact of
measures taken after performance degradation has been reported.

Akamai Site Analyzer – Service Description
13
Service and Support Performance Analytics customers are supported by a comprehensive integration and support program. This program extends throughout the customer experience with Akamai, from initial assessment to ongoing support and maintenance.
Professional Services
Akamai Professional Services works closely with each customer to assess the customer’s current infrastructure, to understand performance measurement needs and integrate with other Akamai services. Our team works in four phases:
• Assessment
• Design and Planning
• Implementation and Testing
• Deployment and Optimization
Solution Architects, Technical Project Managers, and Engineers work in tandem with the customer to facilitate knowledge transfer and on-time delivery.
Customer Care
Akamai Customer Care provides a 24x7 single point of contact for all customer support issues in the post-sale phase of the account life cycle. Customer Care is responsible for all internal escalations until there is satisfactory resolution of an issue.
All escalations are logged into the central ticketing database that is accessible online via the Akamai portal (https://control.akamai.com/).
Akamai Customer Care provides the customer with best-of-class support by excelling in all three areas: people, process, and technologies. The Customer Care team is composed of a globally distributed staff with significant professional experience and advanced degrees. They work in a single-tier paradigm, so the person answering the phone can work on any problem, regardless of the time of day.
There are three ways to contact Akamai Customer Care:
• control.akamai.com Enterprise Portal
• E-mail ([email protected])
• Telephone 1.877.4.AKATEC [1.877.425.2832]
Network Operations Command Center (NOCC)
Akamai’s Network Operations Command Center (NOCC) monitors the globally distributed Akamai Platform on a 24x7x365 basis. The NOCC uses Akamai’s proprietary, secure, scalable, real-time data collection mechanisms with a variety of diagnostic, network visualization, and reporting tools to enable efficient and responsive monitoring of the Akamai Platform. If a problem is detected, Akamai’s fault-tolerant architecture takes over, automatically switching traffic from one edge server to another. At the same time, trained NOCC professionals investigate the cause of the problem by logging in to the server to perform diagnostic measures, or by contacting the data center where the problem server is housed.

Akamai Technologies, Inc.
US Headquarters
8 Cambridge Center
Cambridge, MA 02142
Tel: 617.444.3000
Fax: 617.444.3001
US Toll free 877.4AKAMAI
(877.425.2624)
Akamai Technologies GmbH, Germany
Betastrasse 10b
85774 Unterfoehring
Germany
Tel: 49 89 94006 ext. 308
Fax: 49 89 94006 - 006
Akamai Technologies Japan K.K.
15F Tokyo Ginko Kyokai building
1-3-1 Marunouchi, Chiyoda-ku,
Tokyo 100-0005
Tel: 81-3-3216-7300
Fax: 81-3-3216-7390
Copyright © 2009 Akamai Technologies, Inc. All Rights Reserved.
No part of this publication may be reproduced, transmitted, transcribed, stored in a retrieval system or translated into any language in any form
by any means without the written permission of Akamai Technologies, Inc. While every precaution has been taken in the preparation of this
document, Akamai Technologies, Inc. assumes no responsibility for errors, omissions, or for damages resulting from the use of the information
herein. The information in these documents is believed to be accurate as of the date of this publication but is subject to change without notice.
The information in this document is subject to the confidentiality provisions of the Terms & Conditions governing your use of Akamai services.
Akamai is a registered trademark of Akamai Technologies, Inc. EdgeControl Management Center, Edge Suite, Edge Computing, EdgeScape,
and Sure Route are Akamai trademarks. Other products or corporate names may be trademarks or registered trademarks of other companies
and are used only for the explanation and to the owner’s benefit, without intent to infringe or to imply any endorsement of Akamai or its
services by, or relationship between Akamai and, the owners of such marks or to imply that Akamai will continue to offer services compatible
with technology
14
The Akamai Difference
Akamai provides market-leading managed services for powering rich media, dynamic transactions,
and enterprise applications online. Having pioneered the content delivery market one decade ago,
Akamai's services have been adopted by the world's most recognized brands across diverse
industries. The alternative to centralized Web infrastructure, Akamai's global network of tens of
thousands of distributed servers provides the scale, reliability, insight and performance for
businesses to succeed online. An S&P 500 and NASDAQ 100 company, Akamai has transformed
the Internet into a more viable place to inform, entertain, interact, and collaborate. To experience
The Akamai Difference, visit www.akamai.com.

![The Akamai Network: A Platform for High-Performance ...rmartin/teaching/fall15/papers/arch2/cdn.pdf · Akamai study on an e-commerce website [11]. In the study, site visitors were](https://img.pdfslide.us/doc/110x75/5e874ba602aa766f6374ba89/the-akamai-network-a-platform-for-high-performance-rmartinteachingfall15papersarch2cdnpdf.jpg)