Embed Size (px)
Citation preview
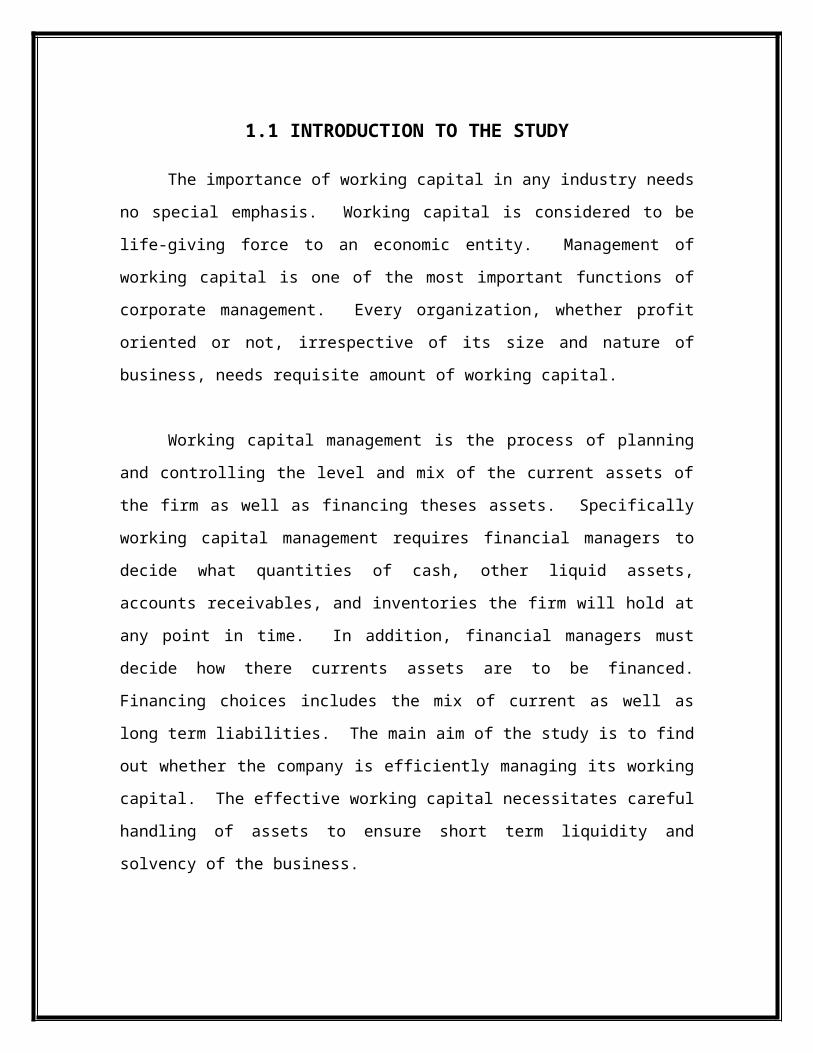
1.1 INTRODUCTION TO THE STUDY
The importance of working capital in any industry needs no special emphasis.
Working capital is considered to be life-giving force to an economic entity. Management
of working capital is one of the most important functions of corporate management.
Every organization, whether profit oriented or not, irrespective of its size and nature of
business, needs requisite amount of working capital.
Working capital management is the process of planning and controlling the level
and mix of the current assets of the firm as well as financing theses assets. Specifically
working capital management requires financial managers to decide what quantities of
cash, other liquid assets, accounts receivables, and inventories the firm will hold at any
point in time. In addition, financial managers must decide how there currents assets are
to be financed. Financing choices includes the mix of current as well as long term
liabilities. The main aim of the study is to find out whether the company is efficiently
managing its working capital. The effective working capital necessitates careful handling
of assets to ensure short term liquidity and solvency of the business.
Keeping in view the pragmatic importance of working capital management as a
gray area of corporate financing function, an attempt has been made to examine working
capital management practices and the problems faced by Metal Industries Ltd in working
management process. In this study, also analyze the working capital management and
profitability position of the Metal Industries Ltd by using financial reports and other
documents given by the company.
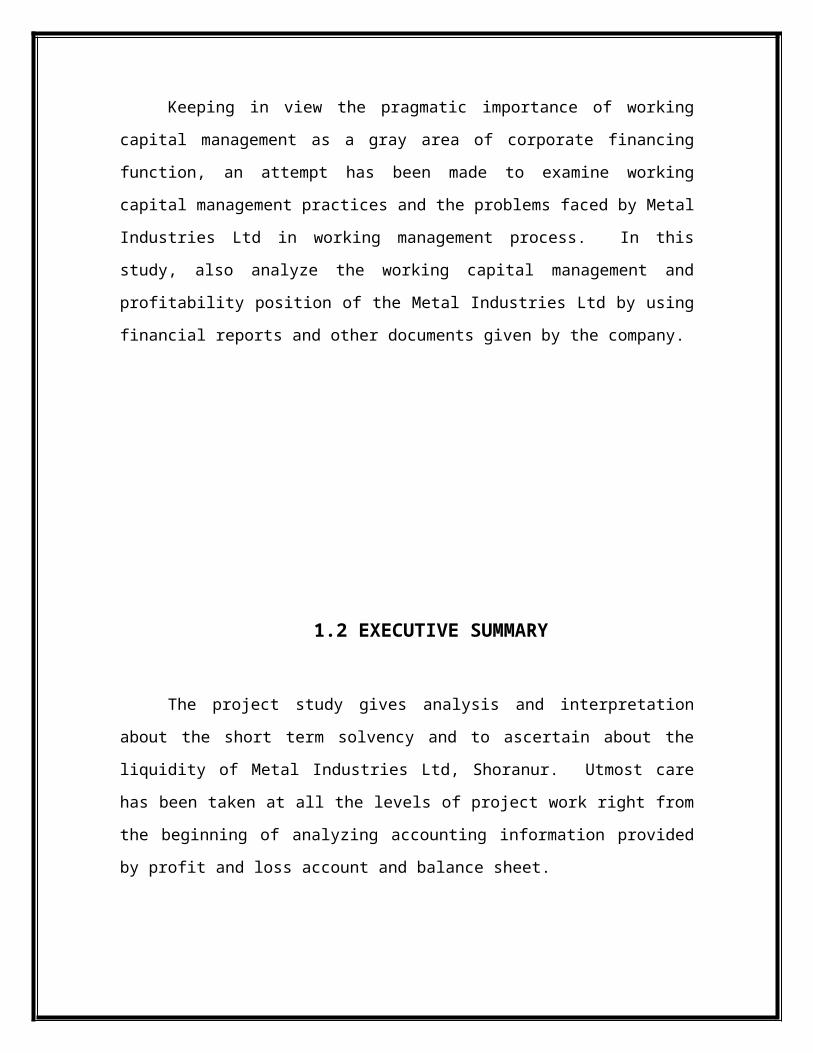
1.2 EXECUTIVE SUMMARY
The project study gives analysis and interpretation about the short term solvency
and to ascertain about the liquidity of Metal Industries Ltd, Shoranur. Utmost care has
been taken at all the levels of project work right from the beginning of analyzing
accounting information provided by profit and loss account and balance sheet.
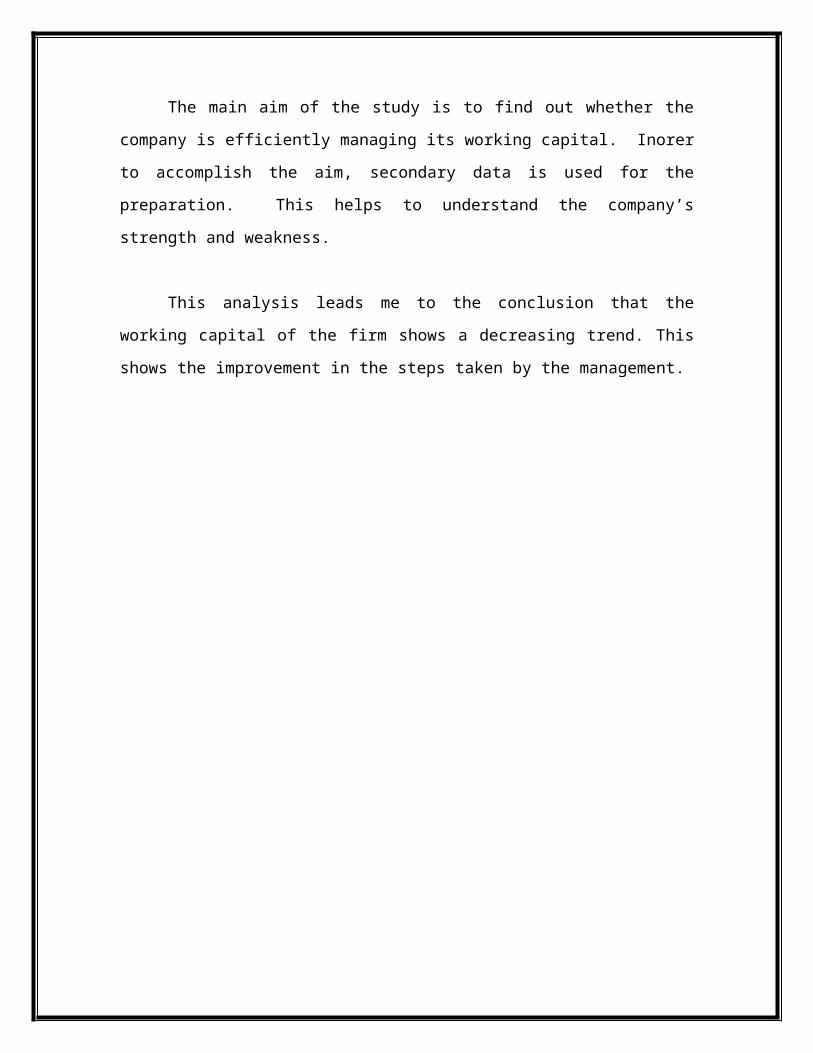
The main aim of the study is to find out whether the company is efficiently
managing its working capital. Inorer to accomplish the aim, secondary data is used for
the preparation. This helps to understand the company’s strength and weakness.
This analysis leads me to the conclusion that the working capital of the firm
shows a decreasing trend. This shows the improvement in the steps taken by the
management.
1.3 STATEMENT OF THE PROBLEM
Each and every decision requires the interpretation and evaluation of
information. A problem statement is the discrepancy between some current state of
affairs and the desired state. For each and every business organization, it is necessary for
them to know the working capital management in the organization, to take decisions for
now and the future.
The problem of the undergone study states that “Metal Industries Ltd,
Shoranur” is eager to know about their working capital management for the ten years.
The finance department recommended that the ratio analysis to conduct the research with
the help of balance sheet and profit & loss account for the year 2001-2010.
1.4 OBJECTIVES OF THE STUDY
The study is mainly intended to analyze the working capital position of Metal
Industries Ltd, Shoranur. Following are the main objectives of the study:
Primary objectives:
To study the position of working capital of Metal Industries Ltd, Shoranur.
Secondary objectives:
1. To ascertain the liquidity position of the firm.
2. To study about the various factors affecting the working capital management of
the firm.
1.5 SCOPE OF THE STUDY
The study was conducted over a period of six weeks entitled “A study on
Working Capital Management of Metal Industries Ltd, Shoranur. In order to accomplish
the aim descriptive research has been taken. As the researcher must be able to define
clearly what he wants to measure and must find adequate methods for measuring it. It is
the research of fact finding.
The management of working capital plays an important role in maintaining the financial
health of the firm during the normal course of business. It portrays the flow of resources
through the firm. Certain aspects covered in the research are to determine whether the
firm is able to carry its operations. To ascertain the liquidity position of the firm, to
evaluate the financial performance of the firm and to identify the factor that affecting
working capital management. Such an analyis is expected is to show and highlight the
streangth and weakness regarding various aspects of its liquidity and working capital
management.
1.6 LIMITATIONS OF THE STUDY
In any study or research conducted there would be some limitations associations with it.
Hence for the proper understanding of the project it is inevitable to specify the limitatios
of the study.
The time frame for the project is about six weeks ,had there been sufficient time
the study could have been more elaborate.
Data taken was for the period of five years as it was available only for those
years.
Only audited records are considered for analysis.
Non monetary factors like human behaviour, their relations etc.are not considered.
The study does not take into account the other areas of finance such as capial
budgeting, costing and cash management etc.
1.7 THEORITICAL BASIS
WORKING CAPITAL MANAGEMENT
The management of working capital plays an important role in maintaining the
financial health of the firm during the normal course of business. Working capital
management is the process of planning and controlling the level and mix of the
current assets of the firm as well as fianncing these assets. Specifically working
capital management requires fiancial managers to decide what quantities of cash,
other liquid assets, accounts receivable and inventories of the firm will hold at any
point in time. In addition, financial managers must decide how there currents are to
ne financed.
According to Shubin, “ working capital is the amount of funds necessary to cover
the cost of operating the enterprize”.
Working capital is the difference between inflow and outflow of funds. In other
words, it is the net cash flow. It is the assets and liabilities required to operate a
business on day to day basis.
Financial managers devote a considerable amount of attention to the management
of working capital. Net working capital provides a accurate assessment of the
liquidity position of the firm. An examination of the components of working capital
is helpful because of the preoccupation of management with the proper combination
on assets and liabiliities constitute the portion of funds which have been planned for
and raised.
CONCEPT OF WORKING CAPITAL
There are two concepts of working capital
a) Gross working capital
b) Net working capital
Gross working capital refers to the firm’s investment in current asset. The
current asset, which can be converted into cash with in an accounting year. It
includes cash short-term security, debenture ans stock.
Net working capital refers difference between current asset and current
liability. Current liabilities are those claims out side’s which ae expected to mature
for payment with in an accounting year and it’s include creditirs, bills payable and
outstanding expenses. Alternatively networking capital is a portion of current asset,
which finances with long term funds. Net working capital measures liquidity of the
firm.
Net working capital may be
a) Positive working capital
b) Negative working capital
When curent assets exceeds current liability that will be positive net
working capital. When current liability exceeds current assets that will be negative
working capital. Gross working capital is a going concept and net working capital is
a accounting concept, some time gross working capital is used because,
1. It shows current amount of working capital at right time.
2. Management is more interested in the total asset than source from where it’s made
available.
3. Every increase in the funds of enterprize would increase its working capital as per
gross concept.
4. It is more useful in determine rate of return.
Net working capital is also important because:
1. It is qualitative concept.
2. It indicates the excess current assets and current liability.
3. It indicate fiancial soundness.
4. It suggest need for financing as a part of working capital from permanent sources.
On the basis of time working capital is classified in to
Permanent / fixed working capital
Temporary / variable working capital
Permanent working capital is the maximum amount required for the effective
utilization fixed capacity and for maintain circulation of curretn asset. Always a
maximum level of current asset, which is continously required by the enterprize to carry
out normal business operation.
For e.g. Raw material,finished goods in work in progree and cash balances.
Temporary working capital is the capital required to meet the seasonal demend
and special exigencies. Temporary working may be seasonal and special working capital
is required for short period and cannot permanently employed. Seasonal working capital
may be need where the raw material is seasonal or the business is in seasonal nature.
IMPORTANCE OF ADEQUATE WORKING CAPITAL
A business firm must maintain an adequate level of working capital in order to
run its businesss moothly. It is worthy that both excessive and inadequate working
capital postions are harmful. However, out of the two, inadequacy of working capital is
more dangerous for a firm. Excessive working capital results in idle funds no profit is
earned. Similarly inefficiency of working capital results in interruption. This will ,lead
to inefficiencies, increase in costs and reduction in profits.
Working capital is just like the heart of business. It it becomes a week, the
business can hardly and surv ices. No business can run succesfully without an adequate
amount of working capital. The following are a few advantages of adequate working
capital in the business:
Advantage of maintain adequate working capital
Increases the solvency of business
Increase goodwill of the business
Get easy loan
Firm get cash discount on purchase hence reduce cost
Regular supply of raw materials
Regular payment of wages and salaries
Exploitation of faavourable market conditions
Quick and regular return and investment
Adequate working capital create an environment of confidence and high morale.
DANGER OF INADEQUATE WORKING CAPITAL
When working capital is inadequate, a firm faces the following problems;
It may not be able to take advantage of cash discount.
It cannot by its requirements in bulk and unable to utilize the production
facilities fully.
It may not be able to take advantage of profitable business opportunities.
It may fail to pay its dividend because of non availability of funds.
Its low liquidity may lead to low profitability.
Short term liabilities cannot be paid because of inadequate working capital.
Credit-worthiness of the firm may be damaged because of lack of liquidity.
Low liqudity position may lead to liquidation of firm.
DANGER OF EXCESSIVE WORKING CAPITAL
When there is too much working capital, it is also dangerous. Excessive working capital
raises the following problems:
A firm may be tempted to over and loss heavily.
The situtation may lead to unnecessary purchases and accumulation of
inventories.
There arises an imbalance between liquidity and profitability.
Excessive working capital means funds are idle.
The situation leads to greater production which may not have matching demand.
The excess of working capital lead to carelessness about cost of production.
SOURCES OF WORKING CAPITAL
The financial manager is always interested in obtaining the working capital at the right
time, at a reasonable cost and the best possible favourable terms. In any concern a part of
the working capital investments are permanent investments in fixed assets. Because there
is always a minimum level of current assets which are continously required by the
enterprise to carry its day to day operations. The minimum level cannot be expected to
reduce at any time. The minimum level of current assets gives rise to permanent working
capital, which is permanently blocked in current assets.
FINANCING OF LONG TERM WORKING CAPITAL
Long term working capital should be provided in such a manner that the enterprize may
have its unintrrupted use for a long time. It can be conveniently financed by the
following sources:
1. Issue of shares:
Issue of shares is the most important sources for raising the permanent working
capital. Maximum amount of permanent capital should be raised by the issue of shares.
2. Floating of shares:
A debenture is an instrument issued by the company acknowledgement its debt to
its holder. It is also important source of long term working capital.
3. Ploughing back of profit:
It means reinvestment by a concern of its surplus earning in its business. That is,
a part of the earned profit may be ploughed back by the firm, in meeting their working
capital needs.
4. Long term loans:
Financial institution such as commerical banks , Life Insurance Corporation of
India etc provide all types of loans long-term, medium term and short term loans.
5. Accepting public deposits:
Public deposits are the fixed deposits accepted by a concern enterprize directly
from public.
Financing short-term working capital
The category of funds covers the need of working capital for financing day-to-day
business requirements. There are two types- Internal source and External source.
A. Internal sources
Depreciation funds: Depreciation reserve provides a source of funds for
working capital.
Provision for taxation: The provision for taxation can also be used by the
concern as a source of working capital during intermittent periods.
Accrued expenses: The firm can postponed the payment of expenses for short
periods.
B. External sources
Trade credit
Credit papers
Bank credit
Customer’s credit
Government assistance
Loan from directors
Security of employees
DETERMINANTS OF WORKING CAPITAL
Nature of business:
Working capital requires of the firm basically influence by the nature of its
business. Trading and fiancial firms have very small investment in fixed assets but
require a large sum of money to be invested in working capital. Manufacturing and
construction firms also have to invest substancially in working capital and a nominal
amount in fixed assets.
Production cycle:
Production cycle comprises of the purchases and use of raw material and the
production of finished goods. Longer the manufacuring cycle, large will be the firm’s
working capital requirement. A study prodution policy will cause inventories to
accumulate during off-season periods and the firm will be exposed to greater inventory
cost and risks.
Production policy:
Working capital need of the firm is related to its sales. Sales depend on demand
condition. Most firm experience seasonal and cyclical variation in the demand for those
product and service. These business variations affect the working capital requirement
specially the temporary working capital requirement of the firm.
Growth and expansion:
Growth and expansion of the firm will affect the working capital. Growth and
expansion of the business in the future will lead more working capital requirement.
Credit policy of the firm:
Credit policy of the firm affects the working capital by influencing the label of
debtors.
Credit policy will be affect in two ways.
1). Credit term granted to customers.
2). Credit term available to firm from creditors.
The firm should be prompt in making collection’s high collection period will
mean tie up of large funds in book debt. Stock collection procedure can increase chances
of bead debt.
Availability of raw materials:
Raw materials availability also affects the working capital requirement. The
availability of raw material is an seasonal the temporary working capital is needed high in
the season.
Price level changes:
Rise in the price level require a firm to maintain higher amount of working capital
and aslo same level of current asset is needed, increased investment when price are
increasing. So the company which can immediately revise these product prices with
rising price level will not face a serve working capital problem.
Operating efficiency:
Operating efficiency of the firm related to the optimal utilization of resources at
minimum cost of the firm will effectively contributing in keeping the working capital
investment at a lower level if it is efficient in controlling the operating cost and utilizing
current asset. Better utilization of resources improves the profitability and this helps in
realizing the pressure on working capital.
INVENTORY MANAGEMENT
Inventory is stock of product a company is manufacturing for sales and
component that make up the product. The various forms of inventory are raw material,
work in progress and finished goods. Other material consumable stores etc. proper
planning of purchasing handling storing and accounting should form a part of inventory
management.
Efficient system of inventroy management determined
a). What to purchase
b). How to purchase
c). From where to purchase
d). Where it store.
Objectives:
1. Determine and maintain optimal level of inventory investment to eliminate duplication
in ordinary or replenishing.
2. Minimize loss through deterioration, wastage and damage.
3. Ensure right quality of goods at reasonable price.
4. Facilitating and finishing of data or short term and term planning and control of
inventory.
5. Ensure continous supply of raw materials to facilitate uninterrupted production.
6. Maintain sufficient finished goods inventory for smooth sales operation and efficient
customer service.
Mainly cost os managing inventory is two parts:
a). Ordering cost
b). Carrying cost
ordering cost is entire cost incurred for acquiring raw materia. These costs
include purchase requisition, purchase ordering, transporting, receiving and storing.
Ordering cost increases in proportion to the number of orders placed.
Carrying cost: Costs incurred for maintaining a given level of inventory are
called carrying cost. It includes cost of storage, insurance recording inspection. It
increases in proportion to the volume of inventory.
IMPORTANT WORKING CAPITAL MANAGEMENT RATIOS
The working capital magnitude of a concern should neither be too inadequate nor
too excessive as cpmpared to its requirement. Maintaining adequate working capital
ensures the improvement of profitability. The finance managers always tries to maintain
the adequate working capital at every time so as to carry on the operations succesfully
and maximize the return on investment. The following are the important ratios to
measure the efficiency of working capital management.
1. CURRENT RATIO
It is the ratio of current assets to current liabilities. It shows the relationship
between total current assets and total current liabilities. It is a measure of firm’s short
term solvency. Current ratio is also called working capital ratio.
Current assets Current ratio =
Current liabilities
Current assets mean cash or those assets which can be converted into cash within
a year. Current asset normally include cash in hand and cash at bank, marketable
securities, stock, suntry debtors, bills receivables and prepaid expenses. Current
liabilities are those liabilities which are to be repaid within a year. Current liabilities
include suntry creditors, bills payable, bank overdraft, provision for taxation etc.
2. LIQUID RATIO
It is the ratio of liquid assets to liquid liabilities. It established the relationship
between quick assets and quick liabilities. It is also known as acid test ratio. It is
computed as follows:
Liquid assetsLiquid ratio=
Liquid liabilities
Liquid or quick assets include cash, bank balances, debtors, bills receivables and short
term marketable securities. In other words, they are current assets minus stock and
prepaid expenses. Stock cannot be included in quick assets because it is not easily and
readily convertible into cash. Perpaid expenses by their nature cannot be used for
payment of quick liabilities. Liquid liabilities are current liabilities minus bank overdraft.
The exclusion of bank overdraft is due to the fact that it tends become a permenant mode
of financing.
3. DEBTORS TURNOVER RATIO
It is also called receivables turnover ratio. It related net credit sales to suntry
debtors. It measures how fast debts are collected. It is calculated as follows:
Total sales Debtors turnover ratio= Average debtors
Average debtors
×365Avarage collection period= Total sales
4. CREDITORS TURNOVER RATIO:
It is the ratio between net credit purchases and the amount of suntry creditors. It
implies the credit period enjoyed by the firm in paying creditors. It is computed by using
the following formula:
Net credit purchasesCreditors turnover ratio =
Creditors
Accounts payable Avarage payment period = × 365 Net credit purchases
5. WORKING CAPITAL TURNOVER RATIO:
This ratio is computed to test the efficiency with which the net working capital is
utilized. In other words, this ratio indicates whether working capital is effectively used in
making sales. It is calculated as follows:
Net SalesWorking capital turnover ratio = Net working capital
6. INVENTORY TURNOVER RATIO
This ratio is also known as stock turnover ratio. It establishes the relationship
between cost of goods sold and avarage inventory. Besides help in determining the
liquidity of a business concern, this ratio indicates how many times during the period the
firm has turned its inventory. In other words, it shows the rate at which inventories are
converted into sales and then into cash. It is computed as follows:
Cost of goods soldInventory turnover ratio =
Average inventory
7. FIXED ASSETS TURNOVER RATIO:
Fixed assets turnover ratio shows the relationship between sales and fixed
assets. It shows whether fixed assets are fully utilized. To be more clearly, this ration
measures the efficiency with which the firm is utilizing its fixed assets in generating the
sales. It is computed as follows:
SalesFixed assets turnover ratio =
Fixed assets
8. GROSS PROFIT RATIO:
This ratio is also known as gross margin. This is the ratio of profit to net
sales. It is usually expressed as percentage. It is computed as follows:
Gross profit Gross profit ratio = ×100
Net sales
Net sales means total sales minus return. Gross profit means sales minus
cost of goods sold. In the case of trading concern, cost of goodssold would be equal to
opening stock plus purchases plus all direct expenses charged to Trading Account minus
closing stock. In the case of manufacturing concerns, it would be equal to the sum of
cost of material consumed, wafes, direct expenses and all factory or manufacturing
expenses.
Gross profit ratio indicates the margin of profit on sale. This ratio
indictes the efficiency of production or trading operations. It is useful to ascertain
whether the average percentage of the mark-up on the goods sold is maintained. A high
G/P ratio is a sign of good management.
9. NET PROFIT RATIO:
Net profit ratio is the ratio of net profit to sales. It is also known as profit
margin. It is usually expressed as percentage. It is calculated as follows:
Net profit Net profit ratio = ×100
Net sales
Here, net profit is the balance of profit and loss account after adjusting interest
and taxes and all non oerating expenses like loss on sale of fixed assets, provisions for
contigent liability etc. and all non operating income like profit on sale of assets, interest
on investment, dividend received etc.
Net profit ratio indicates management’s efficiency in manufacturing,
administrating and selling of the product. This is a measure of overall profitability. This
ratio also indicates the firm’s capacity to withstand adverse economic conditions. A high
N/P rtio would indicated higher overall efficiency of the business, better utilization of
limited resources and reasonable return to owners. A low N/P ratio would mean low
efficiency and inadequate return to owners.
10. OPERATING RATIO:
This is the ratio of cost of goods sold plus operating expenses to net sales. This
ratio shows the percentage of sales absobed by the cost of goods sold and operating
expenses. Operating expenses include office and administrative expenses and selling and
distribution expenses. A low ratio is favourable because it will leave a large amount of
operating income to meet interest, tax and fair return to owners.
(Cost of goods sold + Operating expenses)Operating ratio = ×100
Net sales
1.8 DEFINITION OF TERMS
Profitability
Profitability analysis comprises the study of sales, analysis of cost of
goods sold, analysis of gross margin on sales, analysis of operating expenses, analysis of
operating profit and analysis of profit in relation to sales and capital. Profit margin ratios
reflect the relationship between profit and investments. Profitability ratios can be
determined on the basis of either sales or investments.
Liquidity
Liquidity is a business, economics or investment term that refers to an
assets ability to be easily converted through an act of buying or selling without causing a
significant movement in the price and with minimum loss of value. An act of exchange
of a less liquid asset is called liquidation. Liquidity also refers both to that quality asset is
called liquidation. Liquidity also refers both to that quality of business which enables it
to meet its payment obligations, in terms of processing sufficient liquid assets and to such
assets themselves.
Inventory
The raw materials, work-in-progress goods and completely finished goods
that are considered to be the portion of a business’s assets that is ready or will be for
selling. Inventory represents one of the most important assets that most businesses
possess, because the turnover of inventory represents one of the primary sources of
revenue generation and subsequent earning for the company’s shareholders or owners.
Cash management
Identify the cash balances which allow for the business to meet day to day
expenses, but reduces cash holding costs. When liquidity is highly restricted in terms of
cash and cash equaivalents, this ratio should be calculated. Liquidity ratio measures the
relationship between cash and near cash items at one hand, and immediately maturing
obligations on the other.
Debtors
Identify the appropriate credit policy, i.e.credit terms which attract
customers, such that any impact on cash flows and the flows and the cash converstion
cycle will be offset by increased revenue and hence return on capital (or vice versa).
Creditors
A business firm usually purchases on credit goods, raw materials and
services from other firms. The amount of total payable of a concern depends upon the
purchase policy of the concern. Longer the period of outstanding payable is, lesser is the
problem of working capital of the firm. But when the firm does not pay off its creditors
within time, it may have adverse effect on business.
Accounts receivables
Accounts receivable is one of the series of accounting transactions
dealing with the billing og customers who owe money to a person, company or
organization for goods and services that have been provided to the customer. In most
business entities this is typically done by generating an invoice and mailing electronically
delivering it to the customer which is to be paid within as established time frame called
credit or payment terms.
Accounts payable
Accounts payable is a file or account that contains money that a person
or company owes to suppliers, but hasn’t paid yet when you receive and invoice you add
it to the file, and then you remove it when yopu pay. Thus, A/P is a form of credit that
suppliers offer to their purchasers by allowing them to pay for a product or service after it
has already been received.
INDUSTRY PROFILE
METAL INDUSTRY
The Metal Industry is primarily concerned with metallurgy and metal working.
At first the metals are extracted from the metal- ores found in their natural state deep
within the earth and then these ores are purified a detailed procedure to obtain the metals
in their pure form of the metals in their pure form, these processes comprise metallurgy.
Then the pure form of the metal so obtained is used to manufacture structures as well as
different machines and parts of machines. The procedures which involve the
manufacturing of machines and other useful items form the so obtained through the
metallurgical processes constitute metalworking.
The manufacturing of alloys is also carried out in the Metal Industry through the
proportionate homogeneous mixing of two of more metallic elements 9metal in the pure
state). The alloys so formed are mainly manufactured in order to enhance the natural
properties of the metals by combining together. Steel is one of the most popular as well
as useful alloys of iron, formed through the chemical combination of mainly iron and
carbon. In addition, it may also contain other metals, as added to the combination in
order to attain desired properties form the alloy. Metal industries are indispensable part
of an economy; they from the backbone of industrial development of any country.
HISTORY
India ought to be known as the Great Grandfather of the World Metallurgical
Industry. However due to the unfortunate Historical circumstances many Indians
themselves remain ignorant of this fact. The art of Bronze Casting had been practiced in
India several centuries before the Modern World Discovered “Metallurgy’. Copper and
bronze were perhaps the earliest Non- Ferrous Metals which man shaped into tools.
Metal is the part of the Indian mystique as each Metal has its own alchemic and healing
powers as documented in ancient Indian Scriptures written over 5000 years ago. Metal in
India has been used as a way of expressing Art in several forms using techniques such as
Inlay, Casting, Carving, Appliqué Enameling, Engraving etc. Metal craft has also been
and integral part of Indian culture.Indian “Metallurgists” had perfected the complex
process of extracting Zinc from its ores by the Downward Distillation method that
required exceptional care in the type of furnace, retorts and a reducing atmosphere as
well as temperature management, as evidenced by the archaeological finds at Zawar in
Rajasthan as early as the 4th century BC. It may be noted that it was only in the 18 th
century AD that the same process was re-adopted in Britain, and patented too. In the
classical age of India, the metallurgy of Copper also assumed macro-dimensions. In the
field of Copper Metallurgy too, the huge 5th century Copper Statue of the Buddha, over
two meters in height and one tone in weight, (now in the Safe Custody of Birmingham
Museum) is a remarkable product of macro technology.
An equally remarkable micro technology, namely the production of High quality
Steel now known as Wootz Steel (an Iron Carbon alloy with 1.3 to 1.6 percent Carbon is
also in use). This production was particularly prevalent in South India and emerged as an
accomplished Metallurgical technique by about the 6th century, after which India steel
was sought after for the production of what was termed the Damascus Sword in West
Asia, around the 10th century AD. Metallurgists in the Universities of Stanford and Lowa
State (USA0 have investigate Wood Steel with a view to reproducing the ancient India
process. The former have even patented a process for the production of Utah- high-
Carbon Steel (1.3 to 1.6 % carbon that could be used for certain automobile and aero
plane components.
CLASSIFICATION OF METAL INDUSTRIES
METAL FABRICATION INDUSTRY
The main function of the Metal Fabrication Industry is to produce component
metal parts will fit in along with other parts, to form larger machinery. In this way the
Metal Industry proves to be an essential section of the entire global metal industry as it
produces minute spare parts of larger heavy machinery and equipments, which cannot be
manufactured simultaneously with the manufacturing of the heavy machines.The process
involved in the manufacture of tools and machine parts in the Metal Fabrication Industry.
The construction of fine and minute machine parts involve several procedures
which require a lot of concentration on the part of the person involved in it. They are
therefore not carried out by the large scale metal industries are in the fact manufactured
in the small scale Metal Fabrication Industry. The production of minute machine parts
(most commonly, smaller constituents of a heavy machine) includes the processes as
given below:
Cutting
Molding
Finishing
The Metal sheets that used in the Metal Fabrication Industry are at first cut in to
finer sections, in order to the fit the size of the parts or the finished products that are to be
manufactured in the Metal Fabrication Industry.
METAL CASTING INDUSTRY
The Metal Casting Industry employs the process of pouring molten metals
(“hot metal” in industry parlance into casts (or models), which takes a definite permanent
shape after cooling. The industrial casting procedure that is followed in the Metal
Casting Industry is be classified as non-disposable, as it involves processes that retain
that cast (or mold) for several applications, in contrast to the use of molds made of sand,
plaster or plastics etc, which cannot be used more than once, and are therefore unfit for
application in the Metal Casting Industry. These rather domestic mold casting
procedures are termed as disposable mold casting.
WORLD METAL INDUSTRY
The World Metal Industries in fact provide an overview of the different metal
industries which are making the lives of people easier around the globe through their
advanced innovations. In fact, we should not forget that all the industries around the
globe are dependent upon metallic elements. Metals are an indispensable part of every
industry for all machinery and equipment are made from metallic elements of alloys.
The products of World Metal Industries have now become and almost
indispensable part of our lives for everything we use are either directly made of metallic
elements or alloys (which are proportionate homogeneous mixtures of alloys), or they ere
manufactured through the use of machinery, that is made of metals or alloys.
METAL STAMPING INDUSTRY
The Metal Stamping Industry looks set to replace the machining die casting,
fabricating and forging processes which were the traditional methods into definite shapes.
The Metal Stamping Industry is more affordable and cost effective in comparison to all
the other processes followed to give desired shapes to the metal and alloy sheets that are
in vogue. Even the machinery used for pressing the metals into shapes, in the metal
stamping industry actually involves the method of bending, clipping and molding
metallic and alloy sheets in to definite forms. These procedures of bending, clipping and
molding are carries out in the Metal Stamping Industry to actually give definite form to
the larger metal and alloy sheets. The major products of the Metal Stamping Industry
consists of finer components of larger machinery, equipments and bigger metal
structures, and these smaller items may also be used as spare parts of the same machines.
The metal or alloy sheets are stamped or pressed in to definite fixed shapes and
than the shaped metal is plated with nickel, tin, or some other metallic elements to protect
it from corrosion. Basically alloys of an iron (steel), zinc, nickel, and aluminum are used
in the Metal Stamping Industry as these alloys are strong, durable, do not break easily,
portable, non-poisonous, and affordable at same time.The business is classified under
metal manufacturing are
Metal furniture, shelves, lockers, cabinets and fixtures
Primary metal products
Fabricated metal products
Machinery including electrical and electronic machinery, equipment and supplies.
Storage of primary batteries.
Motor vehicle parts and accessories
Measuring, analyzing, or controlling equipment
Other metals items such as clocks and watches, costume and precious metal
jewelry, needles, pins, and similar notions, signs and advertising displays, burial
caskets,. Silverware or stainless steel flatware.
Metal Industries also include facilities that are involved in metal working
activities such as
Rolling, drawing, and extruding of non-ferrous metals
Heat treating
Coating, engraving and allied services.
Metal Industries businesses performs many different processes including
Machining
Polishing
Forming
Forging
Enameling
Finishing
Grinding
Welding etc.
METAL INDUSTRIES IN INDIA
Metal Industries are the indispensable part of an economy; they form the
backbone of industrial development of any country. In India the industrial development
began with the setting up of Tata Iron and Steel Company (TISCO) at Jamshedpur in
1907. it started its production in 1912. then came up Burnpur and Bhadrawathi Steel
Plants in 1919 and 1923 respectively. It was, however, only after the independence that
the steel industry has been able to find its feet. Barring the Jamshadpur plant of the
Tatas, all are in public sector and looked after by the steel Authority of India Ltd.(SAIL).
Bhilai and Bokaro plants were set up with the Soviet collaboration. Durgapur and
Rourkela came up with British and German technology know-how respectively.
Iron and steel industry is be nature a heavy industry. Proximity to raw materials
and access to efficient transportation network are crucial to this industry. The
Chotanagpur plateau boarding West Bengal, Bihar, Orissa and Madhya Pradesh therefore
has been the natural core of this industry. Besides iron and steel industry, heavy
engineering and machine tools industries are the main dealers of metals. These industries
have witnessed a phenomenal growth and produce a whole range of capital goods and
consumer durables. The capital industry required for textile industry, fertilizer plants,
mining, construction and agricultural machineries such as equipment for irrigation
projects, diesel engines, pumps and tractors, transport vehicles etc. are being produced
indigenously.
The heavy Engineering Corporation Limited., set up at Ranchi in 1958 fabricates
huge machines required for the iron and steel industry. Locomotives are manufactured
by three units, viz, Locomotive Works, Chitharanjan (West Bengal), Diesel Locomotive
Works, Varanasi (Uttar Prdesh), and Tata Engineering and Locomotive Co.Ltd.(TELCO),
Jamshadpur. The Hindustan Machine Tools Ltd (HMT) is a major manufacture of a wide
range of machines and tools. It has in units in Banglore, Pinjore (Hariyana) Kalamassery
(Kerala), and Hyderbad. The HMT also produces a wide range of watches.
The Bhart Heavy Electricals Limited (BHEL) is a public sector undertaking
which produces power generation equipments. Its manufacturing plants are located at
Bhopal, Thiruchirapally, Hyderbad, Haridwar, Ranipet, Banglore and Jagadishpur (Uttar
Pradesh). The Hindustan Aeronautics Ltd., Banglore has acquired capability of
manufacturing aircrafts of different types. It has its manufacturing units are Banglore,
Kanpur, Nazik, Koraput, Hyderbad and Lucknow, Vishakhapattanam, Mumbai, Calcutta
and Kochi are the major center of ship-building industry.
THREE TOP PLAYERS IN KERALA
CHESTER METAL INDUSTRIES
Chester Metal Industries, in their ceaseless pursuit of excellence have made major
advances and perfected ferrous& non ferrous casting into a fully proven process for a
wide range of precision casting for various engineering, automobile and industrial sectors
we are calibrating to deliver moldest products as desired by customers. Crafted from
high quality and various metals, they offer line of products in various precise geometrics.
D-TECH ENGINEERING INDUSTRIES LIMITED
D-TECH engineering Ltd is a steel fabrication unit engaged in structural steel roof work,
skylights, general steel fabrication work, manufacture of steel door frames, doors,
windows and ventilators, steel furniture, sheet metal work, kitchen cabinets, steel bridges
etc their products are widely used in industries, residential and commercial buildings,
educational institutions, hospitals and government departments.
STEEL AND INDUSTRIAL FORGINGS LIMITED
Steel and Industrial Forgings Limited (SIFIL) is an ISO 9001:2008 certified
Public Sector Undertaking fully owned by Government of Kerala, incorporated in 1983
and started commercial production in 1986, SIFIL rapidly forged ahead to become a
name to reckon with. We are master in Titanium and Special alloy forgings. Untiring
efforts of two decades as saddled SIFL firmly in the Forgings Industry of India and
abroad with best ratings for its products and services. Forgings with exquisite designs
and shapes, flawless forms of contours, broad bands and spectra of metals like alloy steel,
super alloys, aluminum and titanium. All in wide range of weights and unmatched
equality made have SIFL the most sought after forging company in the country for
critical components.SIFL’s diverse product mix caters to a wide range of sectors. These
include complex and high precision aerospace forgings, specialized forgings for defense,
Heavy Forgings for Commercial vehicles, railways and other components for
automobiles etc.
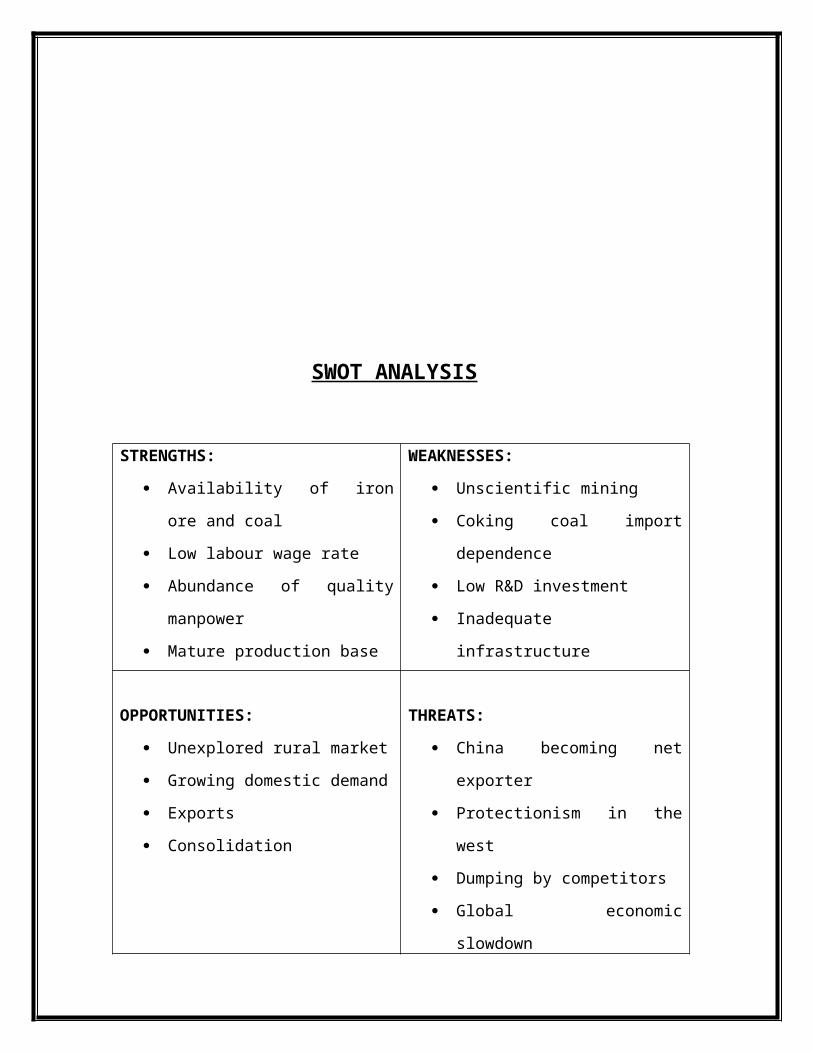
SWOT ANALYSIS
STRENGTHS:
Availability of iron ore and coal
Low labour wage rate
Abundance of quality manpower
Mature production base
WEAKNESSES:
Unscientific mining
Coking coal import dependence
Low R&D investment
Inadequate infrastructure
OPPORTUNITIES:
Unexplored rural market
Growing domestic demand
Exports
Consolidation
THREATS:
China becoming net exporter
Protectionism in the west
Dumping by competitors
Global economic slowdown
RECENT TRENDS
It’s been a Luke warm year for manufacturing. Sort of, let’s dip the big toe and
see how cold the water still is, kind of thing. It’s difficult to look at how well the
industry is actually doing without looking at the past few years to compare. So based on
some research, I’m going to point out a few key points of where the industry was, and
where it’s headed for 2011. Rumors of a double dip recession are still being circulated,
which would be another blow to the industry, but most economists are keeping the glass
half full in this regard against it.Raw materialsPrices have clearly fluctuated with the
crash of the market in 2008, and are slowly starting to creep back to pre-recession prices.
COMPANY PROFILE
INTRODUCTION TO THE COMPANY
The Metal Industries Limited, METIND Nagar, Shoranur, Palakkad, India- 679122 is a
Kerala state Public Sector Undertaking Unit established in the year 1928 perhaps the one
among the first few pioneer industries in pre independent India and the first one in south
India. The activities of the company are to manufacture and market various agricultural
implements and tools required for agro farming, handicrafts and artisans community.
The major clients of the products are Public and Government sectors. The factory is
located at Shoranur, a major industrial destination of Malabar Region of Kerala in 24
acres of land. The ownership of the unit as a public sector undertaking owned and
promoted by the Government of Kerala.
“METIND” is known for Quality, Durability and Reliability of its products and is still
remains on the zenith. A special type of alloy steel used as raw materials of
manufacturing, which undergoes a series of scientific forging and treatment processes to
refine the grain structure and thus makes our implements resistance to wear, tear and
corrosion. This unique feature of the products has sky rocketed the fame of our company
in capturing the local market within the country and now capable to tap the global market
in agricultural implements sector.
The development of Indian economy mainly depends on the agricultural income of the
country. Being the developing nation, almost all the states from top to bottom even
thought some states have advanced to some extend by way of industrialization are
utilizing a major portion of their areas for agricultural purpose in Southern States; the
agricultural activities have a strong impact because the majority of villages are engaged
in agricultural activities. This factor gives an immense scope for the production and
marketing of agricultural implements.
HISTORY OF THE COMPANY

The Metal Industries Limited, a public company was established in the 6th March 1928
with the main object of manufacturing agricultural implements, state tools, horticulture
implements and hand tools etc. the founder of the company was Late Shri C.K Menon.
The Metal Industries Ltd is a SSI established in 1928, perhaps one among the first few
pioneer industries of pre independent India and the first one of south India to cater all
sorts of implements and hand tools needed for agriculture, estate and artisan workers of
our country. Due to various reasons, Shoranur was considered as an ideal place for the
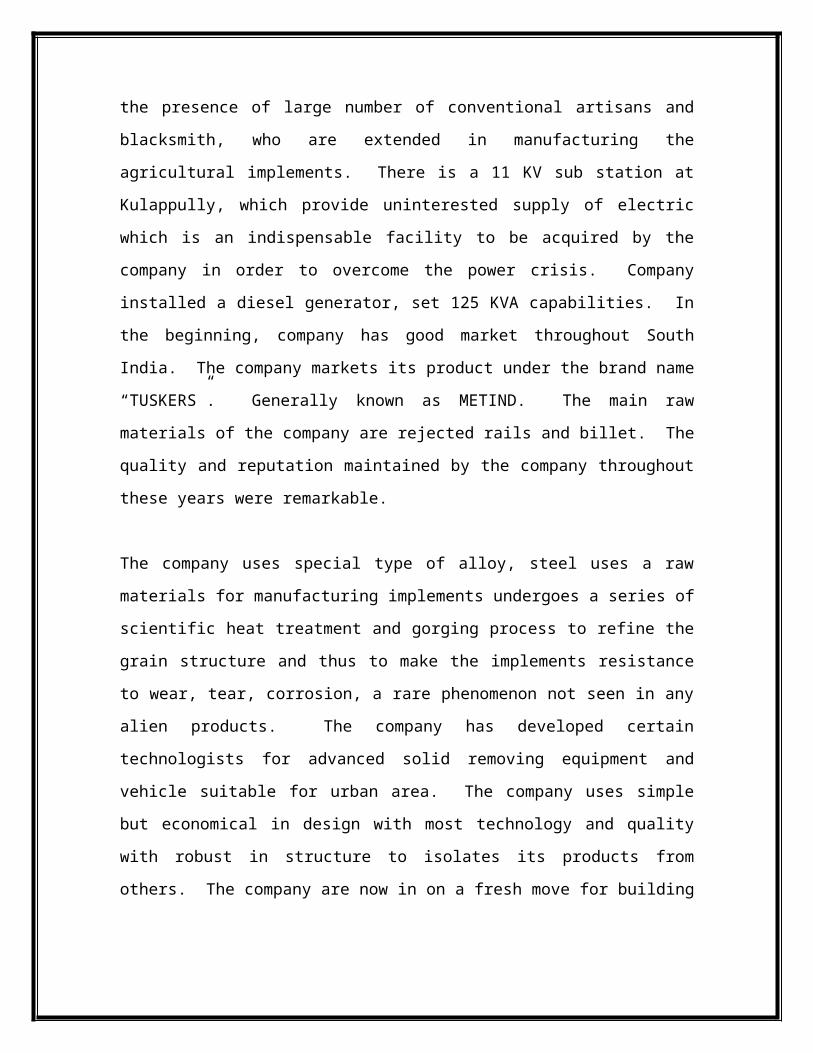
business of agricultural implements manufactured. Most important is the presence of
large number of conventional artisans and blacksmith, who are extended in
manufacturing the agricultural implements. There is a 11 KV sub station at Kulappully,
which provide uninterested supply of electric which is an indispensable facility to be
acquired by the company in order to overcome the power crisis. Company installed a
diesel generator, set 125 KVA capabilities. In the beginning, company has good market
throughout South India. The company markets its product under the brand name
“TUSKERS”. Generally known as METIND. The main raw materials of the company
are rejected rails and billet. The quality and reputation maintained by the company
throughout these years were remarkable.
The company uses special type of alloy, steel uses a raw materials for manufacturing
implements undergoes a series of scientific heat treatment and gorging process to refine
the grain structure and thus to make the implements resistance to wear, tear, corrosion, a
rare phenomenon not seen in any alien products. The company has developed certain
technologists for advanced solid removing equipment and vehicle suitable for urban area.
The company uses simple but economical in design with most technology and quality
with robust in structure to isolates its products from others. The company are now in on a
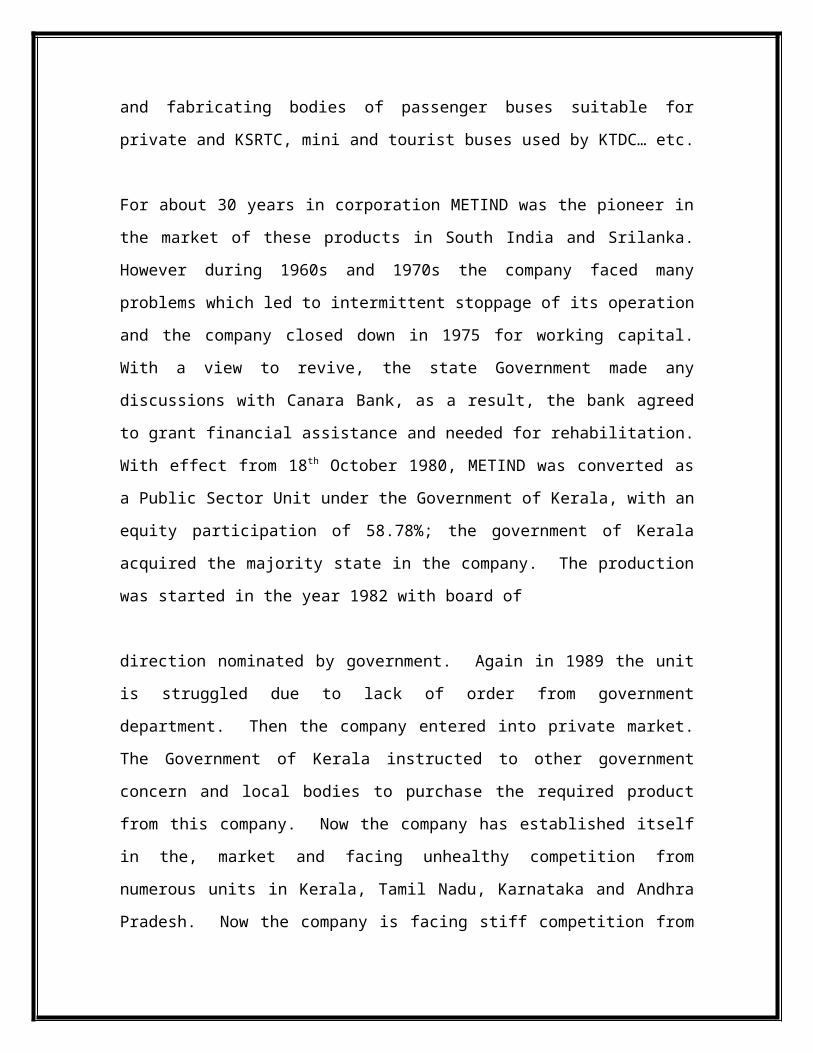
fresh move for building and fabricating bodies of passenger buses suitable for private and
KSRTC, mini and tourist buses used by KTDC… etc.
For about 30 years in corporation METIND was the pioneer in the market of these
products in South India and Srilanka. However during 1960s and 1970s the company
faced many problems which led to intermittent stoppage of its operation and the company
closed down in 1975 for working capital. With a view to revive, the state Government
made any discussions with Canara Bank, as a result, the bank agreed to grant financial
assistance and needed for rehabilitation. With effect from 18th October 1980, METIND
was converted as a Public Sector Unit under the Government of Kerala, with an equity
participation of 58.78%; the government of Kerala acquired the majority state in the
company. The production was started in the year 1982 with board of
direction nominated by government. Again in 1989 the unit is struggled due to lack of
order from government department. Then the company entered into private market. The
Government of Kerala instructed to other government concern and local bodies to
purchase the required product from this company. Now the company has established
itself in the, market and facing unhealthy competition from numerous units in Kerala,
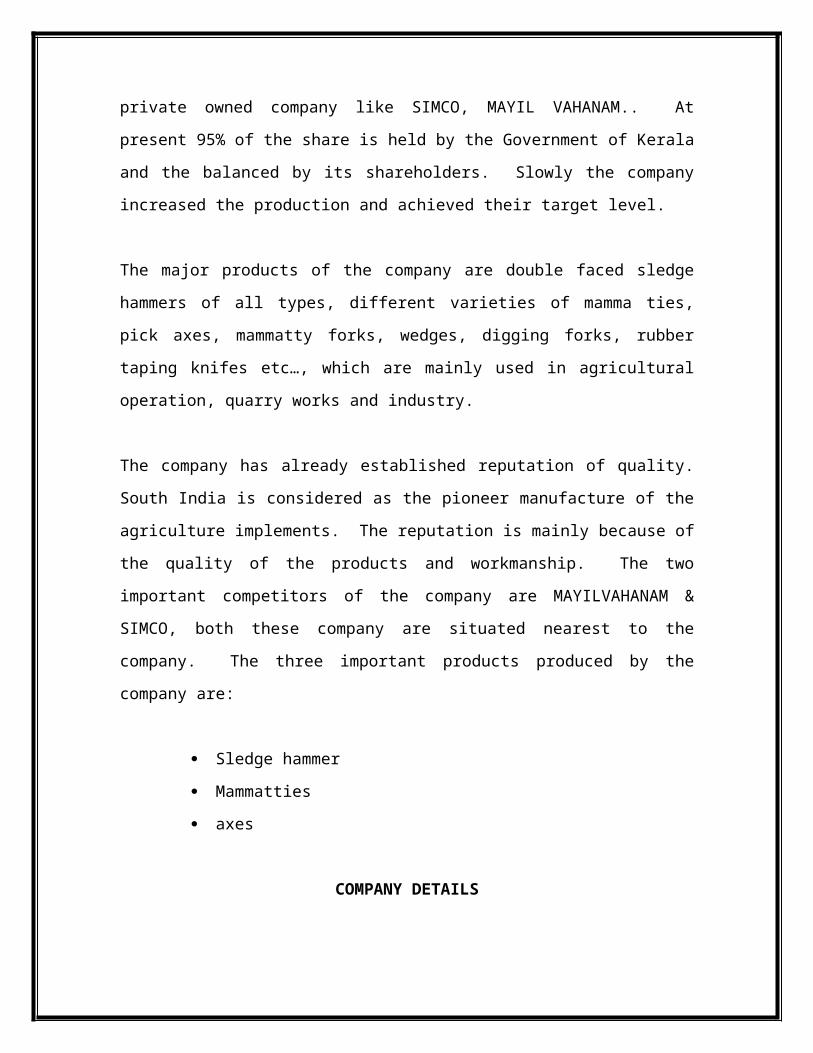
Tamil Nadu, Karnataka and Andhra Pradesh. Now the company is facing stiff
competition from private owned company like SIMCO, MAYIL VAHANAM.. At
present 95% of the share is held by the Government of Kerala and the balanced by its
shareholders. Slowly the company increased the production and achieved their target
level.
The major products of the company are double faced sledge hammers of all types,
different varieties of mamma ties, pick axes, mammatty forks, wedges, digging forks,
rubber taping knifes etc…, which are mainly used in agricultural operation, quarry works
and industry.
The company has already established reputation of quality. South India is considered as
the pioneer manufacture of the agriculture implements. The reputation is mainly because
of the quality of the products and workmanship. The two important competitors of the
company are MAYILVAHANAM & SIMCO, both these company are situated nearest to
the company. The three important products produced by the company are:
Sledge hammer
Mammatties
axes
COMPANY DETAILS
Name of the company The Metal Industries Limited (A Government of
Kerala undertaking)
Type of company A PSU of Govt.of Kerala & registered as an SSI
unit
Registered Number 1542
Date of incorporation 06/03/1928
Registered office Metind Nagar, Shoranur – 679122
Authorized capital 2,00,000/-
Issued, Subscribed and Paid up capital 1,47,95,686/-
chairman V.K. Babu, Ex.MLA
(Appointed by Govt. Of Kerala)
Managing Director Sri. T.M Rajan
Board of Directors Smt. Suzy Eapan (Director)
Sri. K. Babu (Director)
Sri. P. Sankaranarayanan (Director)
Sri. P. Krishnadas (Director)
Sri. P. Sreekumar (Director)
(Elected by shareholders)
Bank Canara Bank, Shoranur
Statutory Auditor M/s. Cheeran Varghese & Co. (Chartered
accountant, Thrissur)
Number of office staff 15
Executives 3
Number of workers 124
Product produced Agricultural implements
Estate tools
Artisan tools
Horticulture implements
Bran name TUSKER brand
Area of sales Kerala, Tamil Nadu, Karnataka and Andhra
Pradesh
Previous year turnover 4.01 crores
Installed capacity 272 metric tone
The company makes use of the facility of some security personnel to after the security
aspects related to it. They are being employed on contract basis. For this, they invite
tenders from reputed firm and recognize security service. All the matters relating to
employees are in accordance with the standing order issued by the company. This
department also deals with handling grievances and finding the solution to conflicts of
personnel in their performance of duties.
Trade unions have a strong impact in the company affairs. The major unions are INTUC
(Indian National Trade union Congress), CITU (Centre of Indian Trade unions) and BMS
(Bharatiya Mazdoor Sangh)
OBJECTIVES OF THE COMPANY
To maximize capacity utilization of existing products.
To maintain and improve the existing cordial relationship between
employees and management by mutual interaction at various at various
levels and to further improve the efficiency of executives, supervisors and
workers to meet future challenges.
To increase the sales.
To ensure strict quality control on all products competing in the market.
To minimize costs.
To increase the profit in order to reduce the accumulated losses.
LOCATIONAL FACTORS
After the formation of Metal Industries Ltd, the location the company is known as
METIND NAGAR. Several other similar industries are located here. The main reason
for locating similar industries at Shoranur is the uninterrupted supply of raw materials.
Main raw materials used for the production are rail and billets. These companies are
situated near to Shoranur Railway Station. Other reason is the prompt study of power,
plenty of labour, transportation facility etc. The peculiarity of this area is that there are a
number of conventional artisans and blacksmiths who are expert in manufacturing these
types of products. Time has approved that this kind of industries can become a success
around this area. All over India the dealers and users of these kinds of products believe
that
“If the products are manufactured at Shoranur, it will be of good quality”.
PRODUCT DESCRIPTION
“A company’s product is what it has to sell.” It is the main link between company and
the consumer public. The Metal Industries Ltd is mainly engaged in the production of the
following products:
Products in Metal Industries are:
Agricultural Implements
Artisan tools
Horticulture Implements
AGRICULTURAL IMPLEMENTS
Agricultural equipment consists of farm field and farmstead machinery used for
the production of crops and agricultural livestock. It includes:
Pickaxe
Hoe
Wedges
Sledge hammer
Claw hammer
Crowbar
Garden rake
Chisel
hatchet
Digging Fork
PICKAXE
A pickaxe or pick is a hand tools with a hard head attached perpendicular to the handle.
Some people make the distinction that a pickaxe has a head with a pointed end, and a
pick has both ends pointed, or only end; but most people use the words to mean the same
thing. The head is usually made of metal, and the commonly wood, metal or fiberglass.
A pickaxe handle without the head, is sometimes used, often unofficially, as a baton. A
normal pickaxe handle is made of ash or hickory wood and is about three feet long and
weights account 2.5 pounds.
HOE
A hoe is an ancient and versatile agricultural tool used to move small amounts of soil.
Common goals include weed control, by agitating the surface of the soil around plants,
pilling soil around the base of plants (hilling), creating narrow furrows (drills) and
shallow trenches for planting seeds and bulbs, to chop weeds, roots and crop residues,
and even to dig or move soil, such as when harvesting root crops like potatoes.
WEDGES
A wedge is a triangular shaped tool, a compound and portable inclined plane, and of the
six classical simple machines. It can be used to separate two objects or portions of an
object, lift an object, or hold an object in place. It functions by converting a force applied
to its blunt end into forces perpendicular 9normal) it its inclined surfaces. The
mechanical advantage of the wedge is given by the ratio of the length of its slope to its
width. Although a short wedge with a wide angle may do a job faster, it requires more
force than long wedge with a narrow angle.
SLEDGE HAMMER
A sledge hammer is a tool consisting of a large, flat head attached to a lever (or handle).
The head is typically made of metal. The sledge hammer can apply more impulse than
other hammers, due to its large size. Along with the mallet, it shares the ability to
distribute force over a wide area. This is in contrast to other types of hammer, which
concentrate force in a relatively small area.
CLAWHAMMER
A claw hammer is a tool primarily used for pounding nails into, or extracting nails from,
some other object. Generally, a claw hammer is associated with wood working but is not
limited to use with wooden products. It is not suitable for heavy hammering on metal
surfaces (such as in machining work), as the steel of its head is somewhat brittle; the ball
peen hammer is more suitable for such metalwork.
CROWBAR
A crowbar is a tool consisting of a metal bar with a single curved end and flattened
points, often with a small fissure on one or both ends for removing nails. It is used as a
lever either to force apart two objects or to remove nails. Crowbars are commonly used
to open nailed wooden crates. Common uses for larger crowbars are: removing nails,
prying apart boards, and generally breaking things. Crowbars can be used as any of the
three classes but the curved end is usually used a first- class lever, and the flat end as a
second class lever.
DIGGING FORK
A garden fork, digging fork or graip is a gardening implement, with a handle and
several (usually four) short, sturdy tines. It is used for loosening, lifting and turning over
soil in gardening and farming. It is used similarly to a spade, but in many circumstances
it is more appropriate than a spade: the tines allow the implement to be pushed more
easing in to the ground, it can take out stones and weeds and break up clods, it is not so
easily stopped by stones, and it does not cut through weed roots or root-crops.
GARDEN RAKE OR GARDEN TOOL
A garden tool is any one of many tools made for gardens and gardening and
overlaps with the range of tools made for agriculture and horticulture. Garden tools can
also apply be hand tools and power tools. The hand tools stills used by gardeners
originated with the earliest agricultural implements used by man: the spade, the garden
hoe, the pitchfork, the garden fork, the garden rake and the plough. The earliest tools
were made of wood. Flint and bone. The development of metal working, first in copper
and later in iron and steel, enabled the manufacture of more durable tools. Industrial
metal working enables the manufacture of cutting tools, including pruning shears. The
first power tools to become popular with gardeners were the lawn mower. This has been
followed by a wide range of power tools, including cultivating, string trimmer, irrigation
sprinklers, hedge trimmers, lawn aerators, leaf sweepers, leaf blowers, chainsaws and
mini-tractors.
HATCHET
A hatchet is single handed striking tool with a sharp blade used to cut and split
wood. Hatches may also be used for hewing when making flattened surfaces on logs;
when the hatchet head is optimized for this purpose it is called a broad axe.
ORGANIZATIONAL CHART
GOVERNEMNT
CHAIRMAN
MANAGING DIRECTOR
PRODUCTION MANGERPERSONNEL MANAGERPURCHASE MANAGERMARKETING MANGER
ORGANISATIONAL STRUCTURE
FINANCE MANAGER
STAFF STAFF STAFF STAFF STAFF
WORKERS WORKERS WORKERS WORKERS WORKERS
The administrative affairs of the company are managed by Board of Directors
comprising of seven members headed by the Chairman. One of the board members are
elected shareholders and others are nominated by government. Managing directors are
responsible for taking decisions regarding framing of policy and its implementation etc.
the Board Meeting is held in every 3 months. For the administrative purpose, the
company is divided into five departments namely production, purchase, sales and
marketing, finance and personnel department.
FUNCTIONAL DEPARTMENTS
1. HUMAN RESOURCE DEPARTMENT
Human resource is the most valuable resource in any organization because it can
function only thorough people. The success depends upon the ability of its human
resource. Human resource management has been presented as a radical alternative to
personnel management consisting of exciting of modern ideas, which would replace the
out of data and ineffective thoughts of personnel management. Personnel manager is
related with the management of workers or employees of the organization. Personal
management is also known as personnel administration. The human resource department
is responsible for the organizational structure in the way which will ensure better working
environment and quality. They deal with the personnel administration (keeping records,
wage agreement etc) in their usual course of operation. Human resource department
keeps an overall record and workers. It works in such a manner to create an atmosphere
in which free exchange of ideas and information between management and workers is
possible.
NUMBER OF EMPOLYEES
There are totally 142 employees in this unit. The employees are divided in to
factory and office employees. There are 124 factory employees and 18 staffs belong to
office and administration department. The factory employees include skilled, semi-
skilled and unskilled workers.
TRAINING
Training is a process of learning a sequence of programmed behaviour. Training
of employees is essential because work force is invaluable asset to an organization. It is
necessary to provide training for both existing and new employees which increase the
skill of the employees. The training facility provided by the company is apprentice
training and health and safety training.
INCENTIVES
The company provides both monetary and non monetary benefits to employees.
It includes bonus, dearness allowance, provident fund, gratuity, labour welfare, canteen
facility, traveling allowance, medical benefits, uniform contribution to labour; HRA,
festival allowance, pension etc are provided to employees.The wages are paid on the
basis of piece rate and time rate system. They are given incentives for extra production
in weekly basis.
INDUSTRIAL SAFETY
Safety means freedom from the occurrence of risks of injury or loss. Industrial
safety of employees safety refers to the protection of workers from the danger of
industrial accidents. Industrial safety is one of the important responsibilities of the
management in the modern industrial set up. The importance of industrial safety was
realized because number of employees is injured while doing job which is caused to
partial or total disablement. In Metal Industries Limited, a safety committee is existed. It
is the responsibility of the committee to safeguard of each and every employee while
doing their job; the employees are strictly advised to take safety measures, such as
goggles for protecting eyes, gloves for protecting hand, apron for the whole body, nose
mask for inhaling suffocating gases.
INDUSTRIAL RELATIONS
Industrial relation is very essential for rapid industrialization of every nation. The
means the relationship between employer and employee in industrial organizations.
Good industrial relationship helps to avoid disputes between employers and employees
and helps to create co-operation, partnership and mutual understanding. Industrial
relation describes the relationship between management and individual employee. It
embraces the relationship between management and trade unions. It includes the relation
between employees and the government. The factory maintains a harmonious relation
between superiors and subordinates. There exists co-operation among the workers.
2. PRODUCTION DEPARTMENT
This is the main functional department of the organization. Production is the process by
which raw materials are converted into finished products. Here the finished products are
agricultural implements, estate tools and hand tools. All the decisions regarding the
production are taken by Work Manager with necessary consultation with Managing
Directors. Production department is sub divided into three sections that is, forging and
maintenance. Production department means the creation of utilities and covers all the
activities of procurement, equipment and machinery etc. Utilities are goods and service
which have want satisfying power.
Production management involving planning, organizing, directing and controlling the
production function or production system- a subsystem if its environment.
According to A.W FIElD “production management is the process of planning and
regulating of the operation of the part of an enterprise which is responsible for actual
transformation of materials into finished products.”
The company METIND has an installed capacity of production of 218 metric tones per
annum of forged agricultural implements ant tools on a single shift basis.
The main raw material of the company are rejected rail, billet
Both these are available at cheaper are art the ancient time. But now, cost of raw material
is increased. Other raw materials are steam cool and petroleum coke used as fuel. The
raw materials are mainly available form North India.
The company had established three manufacturing section:
Forging division
Foundry and Engineering Division
A cutlery division
The first two divisions located adjacently is sprawling acre landscape and third division
was located in three acres of compounded at Lakkidi.
The various products are manufactures in the company are
Double faced sledge hammer
Different varieties of mammaties
Pick axes
Crowbars
Axes
Bill hooks, mainly used in agricultural operation, quarry works and industries.
The sizes of above products are differing according to geographical area. That means of
slight changes in usages of quantity of raw material for producing varieties of products in
different geographical area.
PRODUCTION PROCESS
The production products start with cutting of rejected rail. First of all it cuts in to
three parts then it will cut in to the basis of proposed products weight. After that will be
firing and going different stages of production process.
RAIL CUTTING POWER FORGING FLATTENING
HAND FORGING GRINING TEMPERING POLISHING
HANDLE FITTING PAINTING FINISHED GOODS STORE.
In production department, there is a long process for converting the rails and billets into
end product. The production process adds value to the raw materials and makes it as end
products ready for consumption. The heavy materials installed in this department are
costly and imported from Beche Company in Germany. In this unit, only raw materials
having ferrous content are needed. The steel requited may be carbon steel or alloy steel.
Here only carbon steel is used for manufacturing products. There is low carbon steel is
used for manufacturing products. There is low carbon steel, medium carbon steel, high
carbon steel. In this unit, high carbon steel is used as raw materials for making good
products. The reason is that the product is high carbon steel. This is important for the
use of end products for long duration. The whole process of production is generally
called FORGING.
Agricultural implements are produced in this section. The main raw materials used in
this section are rejected rails, billets etc. This section uses machineries such as power
hammers, grinding machines, shaping machines etc. During the review of the production
has decreased to 226.3 MT as against the production of 245 MT during the previous year.
3. PURCHASE DEPARTMENT
Purchase department has a vital role in the company. All the purchasing activity of the
company is headed by this department. This department is controlled by the Purchase
Officer. It has two sections- purchase and store. The purchase officer is assistant by a
store keeper who is in charge of store. The store keeper receives, inspects and checks all
the materials purchased by the company. The duty of purchase manager in a company is
to purchase the raw materials from suppliers in a proper way at reasonable price.
Purchasing process starts with purchase manager and send quotation to the supplier of
raw materials and select least one by purchase manager and then he sends purchase order.
The purchase of raw materials is on the basis of production requirements.
Purchase order includes the following:
Address of the party
Units of raw materials
Quantity of the raw materials
Rate of the raw materials
Excise duty
Sales tax
Mode of dispatch
Freight
Delivery schedule
Payment terms
An efficient purchasing ensures the procurement of materials of the right quality, in the
right quantity, at the right time, from the right source at a right place.
Payment terms will be two months, one month or two weeks. The raw materials of the
company are rejected rail and billet. Steam coal and petroleum coke used as fuel.
There are two types of purchasing- Centralized and Decentralized. The purchase is
entrusted with the important function of purchasing of materials for the entire
organization. Centralized purchasing refers to the purchase of materials by a purchase
manager. Under centralized purchasing, all purchases are made by the purchase
department to avoid duplication, overlapping and non-uniform procurements. A
company has to follow the centralized purchasing of raw materials for ensuring proper
materials control as well as efficient store keeping. Under this system, the purchasing
department purchases the required materials for all the departments and branches of the
company.
When the purchasing function is entrusted for a single person, it is said to be centralized
purchasing. It means all purchasing are made by the purchasing officer. Generally large
and medium size organizations accept centralized purchasing.
Decentralized purchasing refers to the purchasing materials by all departments and
branches independently to fulfill their needs. Such a purchasing occurs when
departments and branches purchase separately and individually. Under decentralized
purchasing, there is no one purchasing manager who has the right to purchase materials
for all departments and divisions. The defects of centralized purchasing can be overcome
by decentralized purchasing system. Decentralized purchasing helps to purchase the
materials immediately in case of an urgent situation
The raw materials used by this company are Rails and Billet. They also purchase steam
coal, coke, firewood, charcoal and paint.
4. MARKETING DEPARTMENT
The primary function of a business enterprise is to create and maintain a satisfied
customer. No longer is profit operational goal or the sole criterion of effective marketing
performance. Marketing management usually represent all managerial efforts and
function to operate the marketing concepts not only in letter but also in spirit. The
survival and growth of every business depends up on profitability and growth are duly
assured.
The company has a marketing department. The company has no scope for advertising of
these products because they produced only agricultural products.
According to Ducker, marketing is the not merely a function of a business enterprise
units or view of the entire business as the economic organ to provide goods and services.
The marketing of METIND COMPANY is done through some agents. The company
recruits agents of agencies. They are working on commission basis. The agents are
made a contract with the company. The agents have their own respected area: it may be
district or zone wise. The represented district agents collect information from consumers
regarding the requirements of the products. The customers include private owned
shoppers and government institutions like Panchayat, Municipality, and Corporation etc.
After collecting the information, the agents communicate with the company and the
company will send the products to the customers according to their demand. If the
products reached to the consumers hand, the agents collect money from consumers and
give money to the company and they collect their commission. The company sells their
products through cash as well as credit basis. Normally the credit period allowed to
consumers is sixty days.
5. FINANCE AND ACCOUNTS DEPARTMENT
All the accounting transactions are maintained under this department. Books and
recording of cash and credit transactions are maintained under this department. Finance
manager is the head of the department. Finance manager gives necessary instructions and
suggestions for the smooth and proper functioning of the department. The company
follows the double entry accounting. The accounts of the company are prepared on
account basis under the historical cost conventions. Finance requires proper planning and
control to achieve the objectives of the business. This gives birth to financial
management as separate discipline. Financial management simply means management of
finance. Financial management may be defined as planning, organizing, directing and
controlling of the financial activity in a business enterprise. Financial management is
concerned with management of finance and smooth running and successful achievement
of the enterprise. The company has a sound finance department under financial manager.
The main function of the financial department is to control the day to day receipts and
payments of the company. The main source of the company is to generate the finance
through selling of its product. Through this, the company captures its working capital
and paying its liabilities.
REVIEW OF LITERATURE
Many researchers have studied working capital from different views and in
different environments. The following ones are useful for our research:
(Eljelly, 2008) elucidated that efficiency liquidity management involves planning
and controlling current assets and current liabilities in such a manner that eliminates the
risk of inability to meet due short-term obligations and avoids excessive investment in
these assets. The relation between profitability and liquidity was examined, as measures
by current ratio and cash gap (cash converstion cycle) on a sample of joint stock
companies in India using correlation and regression analysis. The study found that the
cash conversion cycle was more importance as a measure of liquidity than the current
ratio that affects profitability. The size variable was found to have significant effect on
profitability at the industry level. The results were stable and had important implications
for liquidity management in various Indian companies. First, it was clear that there was a
negative relationship between profitability and liquidity indicators such as current ratio
and cash gap in the India samle examined. Second, the study also revealed that there
was great variation among industries with respect to the significant measures of liqudity.
(Deloof, 2008) discussed that most firms had a large amount of cash invested in
working capital. It can therefore be expected that the way in which working capital is
managed will have a significant impact on profitability of those firms. Using correlation
and regression tests he found a significant negative relationship between gross operating
income and the number of days accounts receivable, inventories and accounts payable
etc in Indian companies. On the basis of these results he suggested that managers could
create value for their shaeholders by reducing the number of days accounts receivable
and inventories to a reasonable minimum. The negative relationship between accounts
payable and profitability is consistent with the view that less profitable firms wait longer
to pay their bills.
(Ghosh and Maji, 2009) in this paper made an attempt to examine the efficiency
of working capital management of the Indian cement companies during 1992-1993 to
2001-2002. For measuring the efficiency of working capital management, performance,
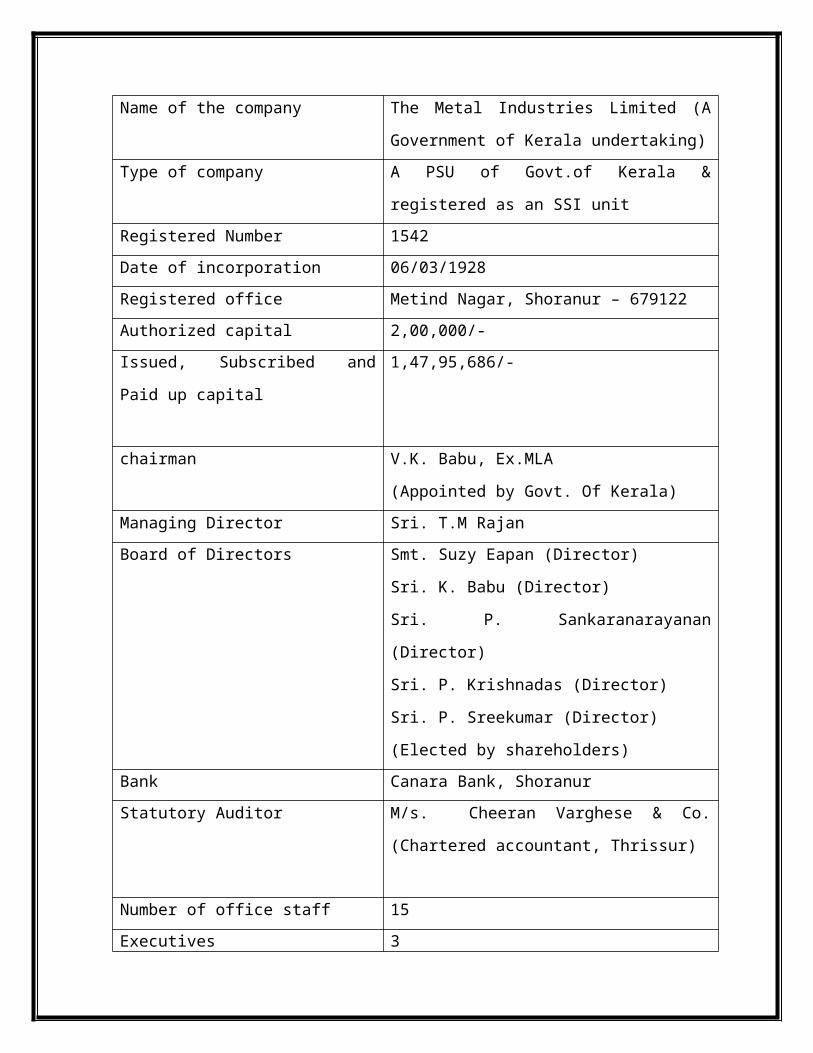
utilization, and overall efficiency indices were calculated instead of using some common
working capital management ratios. Setting industry norms as target-efficiency levels of
the individuals firm during the period of study. Findings of the study indicates that
Indian Cement Industry as a whole did not perform remarkably well during this period.
(Shin and Soenen, 1998) highlighted that efficient Working Capital Management
(WCM) was very important for creating value for the shareholders. The way working
capital was managed had a significant impact on both profitability and liquidity. The
relationship between the length of Net Trading Cycle,. Corporate profitability and risk
adjusted stock return was examined using correlation and regression analysis, by industry
and capital intensity. They found a strong negative relationship between lengths of the
firm’s net trading Cycle and its profitability. In addition, shorter net trade cycles were
associated with higher risk adjusted stock returns.
(Smith and Begemann,2009) emphasized that those who promoted working
capital theory shared that profitability and liquidity comprised the salient goals of
working capital management. The problem arose because the maximisation of the firm’s
return could seriously threaten its liquidity, and the pursuit of liquidity had a tendency to
dilute returns. This article evaluated the association between traditional and alternative
working capital measures and retur on investment (ROI), specifically in industrial firms
listed on the Johannesburg Stock Exchange (JSE). The problem under investigation was
to establish whether the more recently developed alternative working capital concepts
showed improved association with return on investment to that of traditional working
capital ratios or not. Results indicated that there were no significant differences amongst
the years with respect to the independent variables. The results of their stepwise
regression corroborated that total current liabilities divided by fund flow accounted for
most of the variability in Return on Investment (ROI). The stastistical test results showed
that a traditional working capital leverage ratio, current liabilities divided by funds flow,
displayed the greatest associations with return on investment. Well known liquidity
concepts such as the current and qucik ratio registered insignificant associations whilst
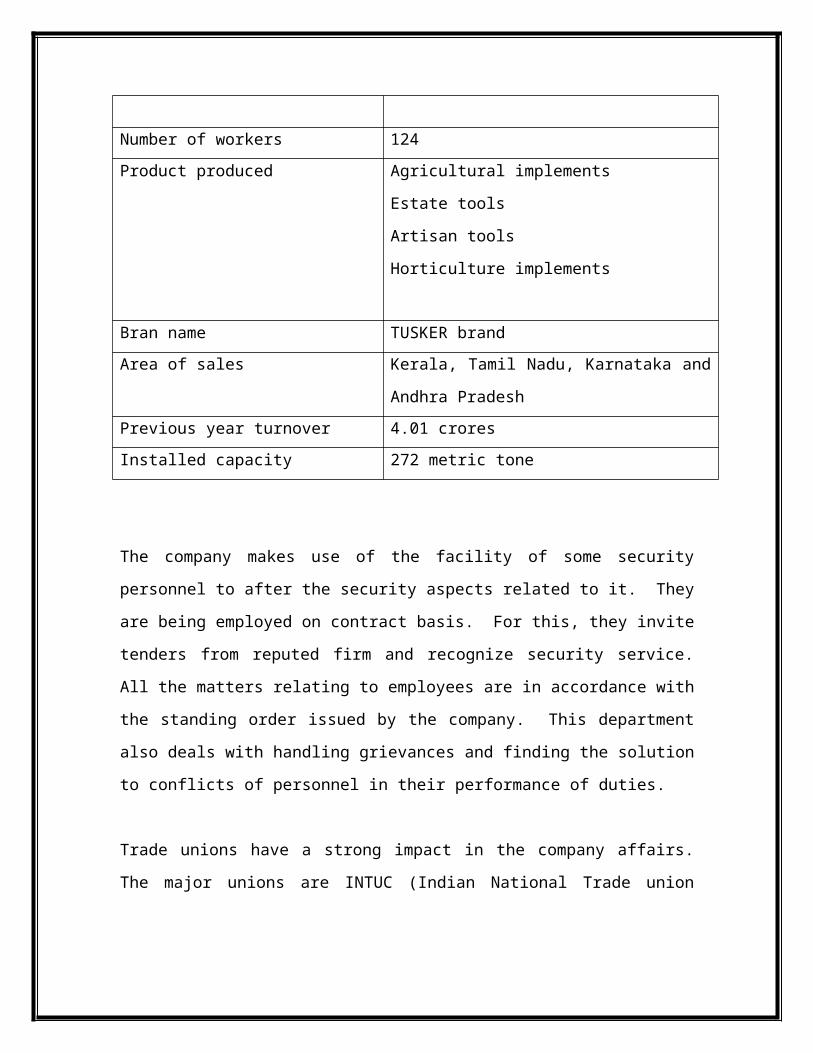
only one of the newer working capital concepts, the comprehensive liquidity index,
indicated significant associations with return on investment.
(Santhosh Deoran Watpade,2009) emphasised that working capital management
is concerned with the problems in attempting to manage the current assets, the current
and the inter relationship that exist between them. The goal of working capital
management is to manage the firm’s current assets and current liabilities in such a way
that the satisfactory level of working capital is mentioned. Study of working capital
management is managed effectively, monitor efficiently, planned properly and reviewed
periodically at regular intervals to remove bottlenecks if any, company cannot earn
profits and increase its turnover and to study the liquidity postion through various
working capital related ratios. The study of working capital ,managemtn in Jain
Irrigation System Ltd has revealed that the current ratio was as per the standard industrial
practice but the liquidity position of the company showed an increasing trend. Overall
company has good liquidity position and sufficient funds to repayment more current
assets balance. Company is increasing sales volume per year which supported the
company for sustained second position in the world and number one position in India.
(Carole Howorth & Paul Westhead,2003) they mainly focused on the working
capital management in small firms in India. Working capital management routines of a
large random of small companies in the India are examined. Considerable variability in
the take up of 11 working capital management routines was detected. Principal
components analysis and cluster analysis confirm the identification of four distinct
‘types’ of companies with regard to patterns of working cpaital management. The first
three ‘types’ of companies focused upon cash management, stock or debtors routines
respectively, whilist the fourth ‘types’ were less likely to take up any working capital
management routines. Influences on amount and focus of working capital management
are discussed. Multinomial logistic regression analysis suggests that he selected
independent variables succesfully discriminated between the four ‘types’ of companies.
The results suggest that the small companies focus only on areas of working capital
management where they expect to improve marginal returns. The difficultie of
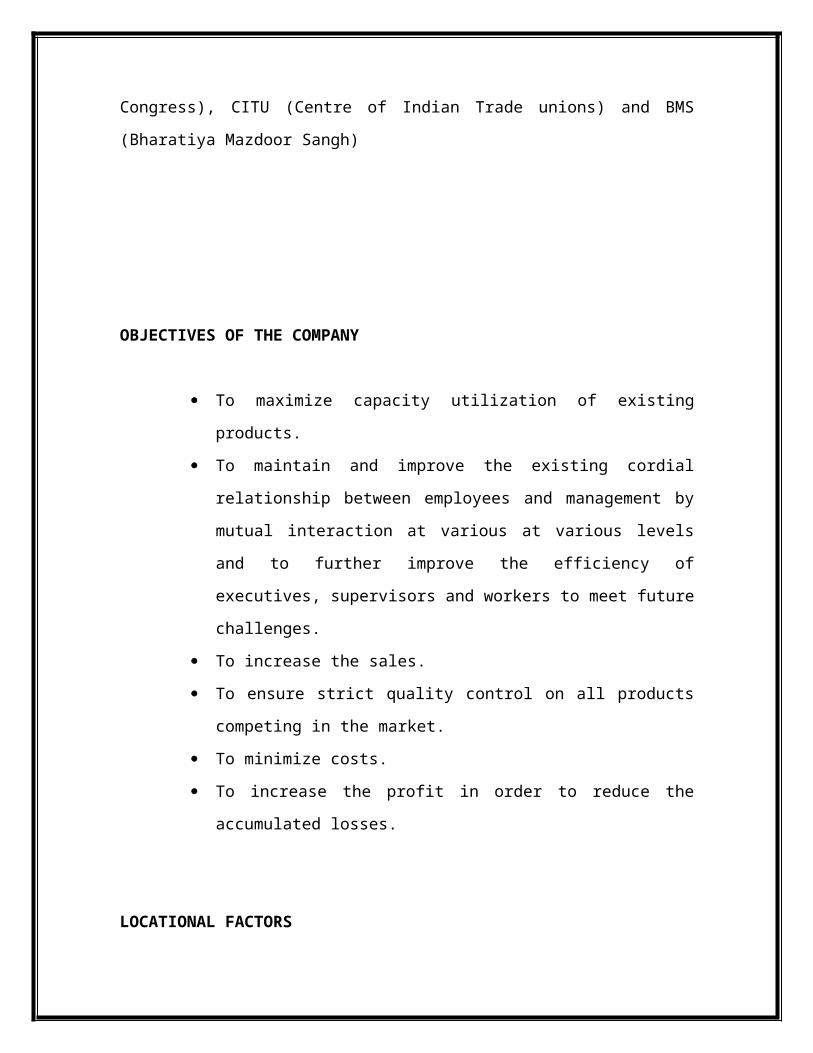
establishing casuality are highlighted and implications for academics, policy makers and
practioners are reported.
(Gbenga Akinwande, 2010), the efficient management of working capital is very
vital for a business survival. This is premised on the fact having too much working
capital signifies inefficiency, whereas to little cash at hand signifies that the survival of
business is shaky. The working capital management in the small and medium scale
businesses, using VGC Telecom company as a case study, so as to establish factors
influencing working capital performance; examine how cash management, inventory
management and trade credit management affects working capital management; company
effectiveness in converting working capital to ready money; how working capital
management development and to offer recommendations on possible ways of improving
working capital management. The collaborate postulation of Weston et al that a
company’s investment working capital is a substantial percentage of its total investment.
In case of VCG telecoms, it is high as 65 percent. An efficient and ineffective
management of this investment will result in slow pace of development and ultimately to
the business failure. The performance of the company in the different sphers of working
capital management is good.
(Baig Viquir Ali, 2009) empahasized that if a firm has inadequate working
cpaital-the money necessary to keep your business running-the firm is doomed to fail.
Many firms, that are profitable on paper, are enforced to “close their doors” due to their
helplessness to meet short term debts when they come due. However, by implementing
sound working capital management strategies, your enterprize can flourish; in other
words, assets are working for the firm. The objective of working capital management is
to make certain that the firm is able to carry on its operations and that it has enough cash
flow to satisfy both maturing short term debt and upcoming operational expenses. In
order to improve the working capital management practices, it is essential for the finance
to adopt a proper appraoch of working capital decisions making to drive their respective
firms towards success in order to generate the value for the shareholders. In addition to
proper approach, there may be some other factors that may prove to be important ehile
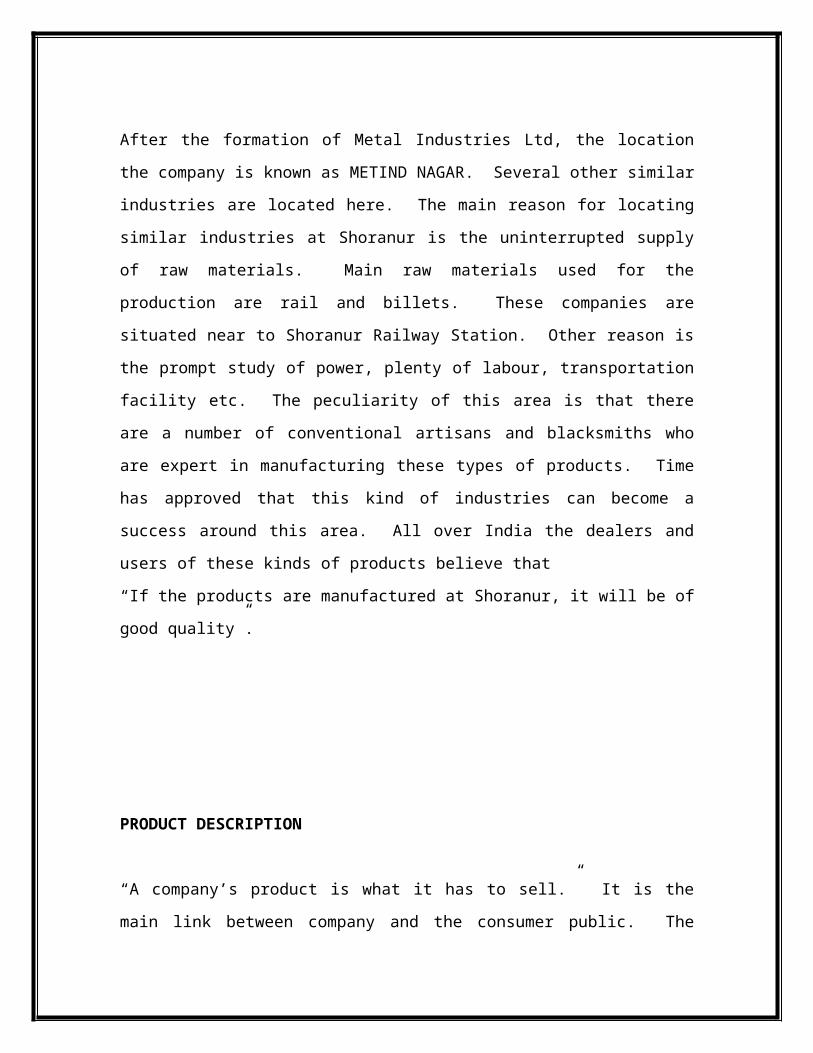
dealing with working capital decision making decision making and certainity these
factors may include ownership, govt regulation, managerial empowerment and cultural
factors. Therefore, the , main purpose of this paper is to report comparative findings of a
survey of working capital management practices of selected agribusiness firms from
diary co-operatives, private and MNC diary firms as a part of research thesis completed
in July 2008. A sample of three state diary co-operatives, three private diary and three
MNC diary firms was taken for the study.
( Maxime Abel, 2001) conducted the study in impact of working capital
management on cash holdings. This study examine the impat of working capital
management on cash holdings of small and mudium-sized manufacturing enterprizes.
The aim of these work is to theoritically derive significant factors related to working
capital management which have an influence on the cash level of SMEs and test in a
large sample of manufacuring SMEs. The theoritical framework for this consists of a
treatise of motives for holding cash, working capital management and cash level. From
these theoritical findings, two hypotheses are deducted:
H1: Cash holdings are negatively related to the presence of cash substitutes.
H2: Cash holdings are positively related to working capital management efficiency.
The quantitative investigation consists of the statistical analysis- namely
comparison of means and correlation analysis-of key figures which are calculated from
the financial statements of a large sample of firms. The data set contains 13,287 Swedish
manafacturing SMEs of the legal form “Aktieboloag’. Both hypotheses are confirmed by
the results. Empirical evidences is presented which substantiates the supposition that the
presence of cash substitutes-namely inventory and accounts receivable-entails lower cash
holdings. Furthermore, it is confirmed that working capital management efficiency-
measured by the cash conversion cycle-is positively related to cash level.
(MICHAELJ. PEEL, 2000) Very little research has been conducted on the capital
budgeting and working capital practices of small firms. The purpose is to present the
results of a preliminary study on the working capital and financial management practices
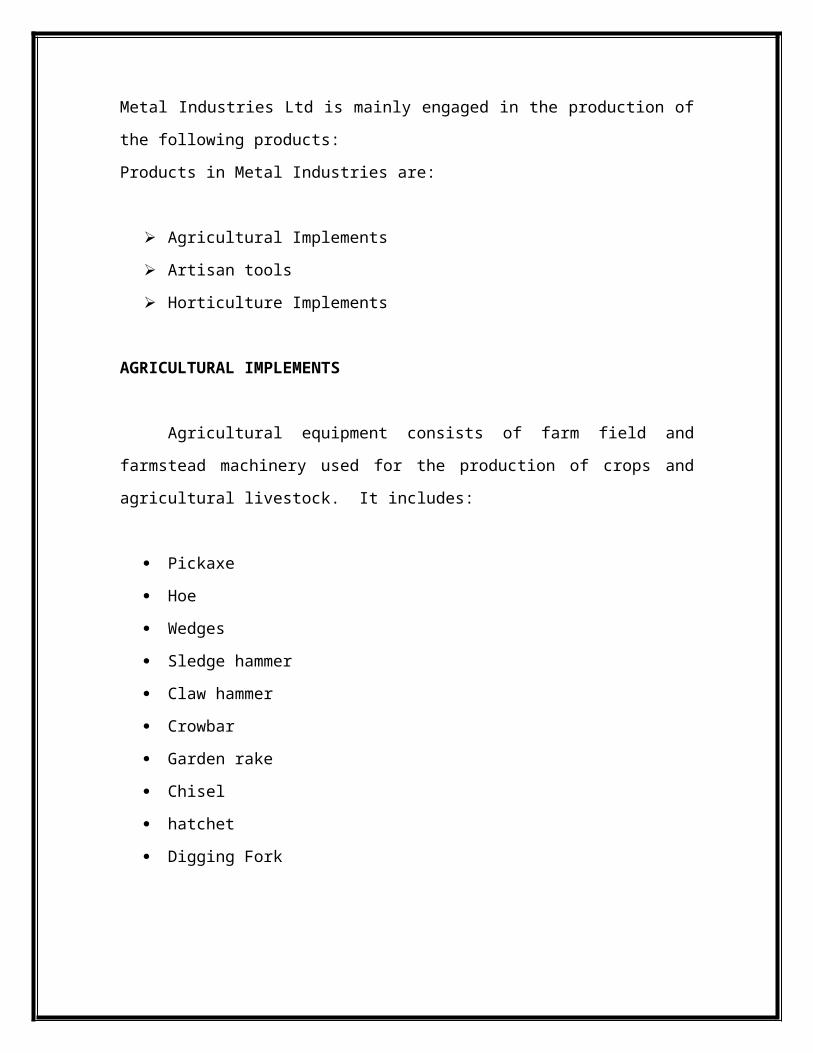
of small firms located in the north of England. In general, the results of the survey
indicated that a relatively high proportion of small firms in the sample claimed to use
quantitative capital budgeting and working capital techniques and to review various
aspects of their companies working capital. In addition the firms which claimed to use
the more sophisticated discounted cash flow capital budgeting techniues, or which had
been active in terms of reducing stock levels or the debtor’s credit period, on average
tended to more active in respect of working capital management practices. It is hopped
that the issued raised will stimulate further theoritical and empirical contributions on this
neglected and important area of small business research.
(Michel j.Peel, Nicholas wilson, 2000): They emphasized that the working capital and
financial management practices of a sample of small firms located in the north of
England. In general, the results of the survey indicated that a relatively high proportion
of small firms in the sample claimed to use quantitative capital budgeting and working
capital techniques and to review various aspects of their companies working capital. In
addition, the firms which claimed to use the more sophisticated cash flow capital
budgeting techniques, or which had acive in terms of reducing stock levels of the debtors
credit period, on average tended to be more active in respect of working capital
management practicces. It is hoped that the issues raised will stimulate further theoritical
and empirical contributions on this neglected and important area of small business
research.
(C.R Sathyamoorthy and L.B Wally-Dima, 2002) indicated that the working capital
management of retail domestic companies that are listed on the Botswana Stock
exchange. Working capital management is very important because a company that
neglects its working capital mangement will soon run out of cash way even have to close
down. Data was collected from companies that are listed on the Botswana Stock
Exchange. The research for choosing the listed companies is because the financial
statements for these companies are readily available and often more reliable that those of
unlisted companies.
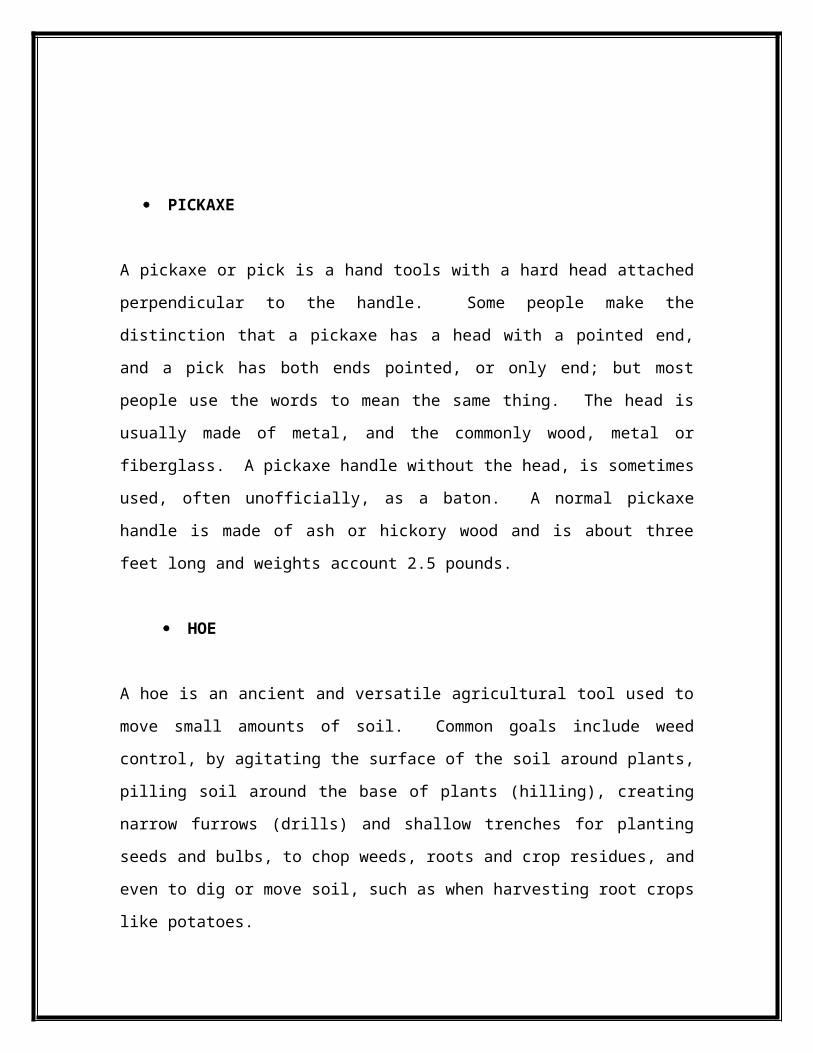
(Mohd Ridzuan Darun, 2000) indicates the practice of working capital management
(WCM) in the Malaysian context, particualrly in Malaysian listed companies. Even
though a number of studies about WCM were undertaken in many countries around the
world, especiallyin Western countries, the understanding about how to manage working
capital is not explicit. To date there has been no study examining the Malaysian context.
Prior research in this area has focused on two approaches 1) Surveys seeking to examine
the relatioship between WCM and corporate performance and 2) the development of
optimization models to improve WCM performance. In te event of changes in industry
context, it is argued that the failure of WCM research to reflect the characteristics and
challlenges of contemporary organizational settings had led to a loss of relevance and
gives to the need for a conceptual framework explaining current WCM practices. This
study is intended to first develop an understanding of determinants of the various WCM
practices currently used in organization.
(James,1998), indicate that the financial status of Abbot Laborataries based on an
analysis of their liquidity, slovency and profitability and asset management ratios. These
financial ratios shows that Abbot has solid financial policies, despiter a significant
increase in short term borrowings in 1994; however, this is most likely a short term effect
of the company’s strategic reorganization to target its core business sectors and of the
purchases and acquisitions that have not yet had the time to show their profitability.
(Brigham and Houston 2000) Larger amount of cash, securities, accounts receivables,
marketable securities, inventories and fixed assets will be needed to support increased
sales required levels will be based on expected sales levels ane expected order lead times.
Additional holdings may be needed to enable the firm to deal with departures from the
expected values. Further firms will also attempt to increase their accounts payable
balances as a means of financing increased levels of operating assets to support
subsequent growth, while at the same time attempting to maintain adequate performance
indicators.
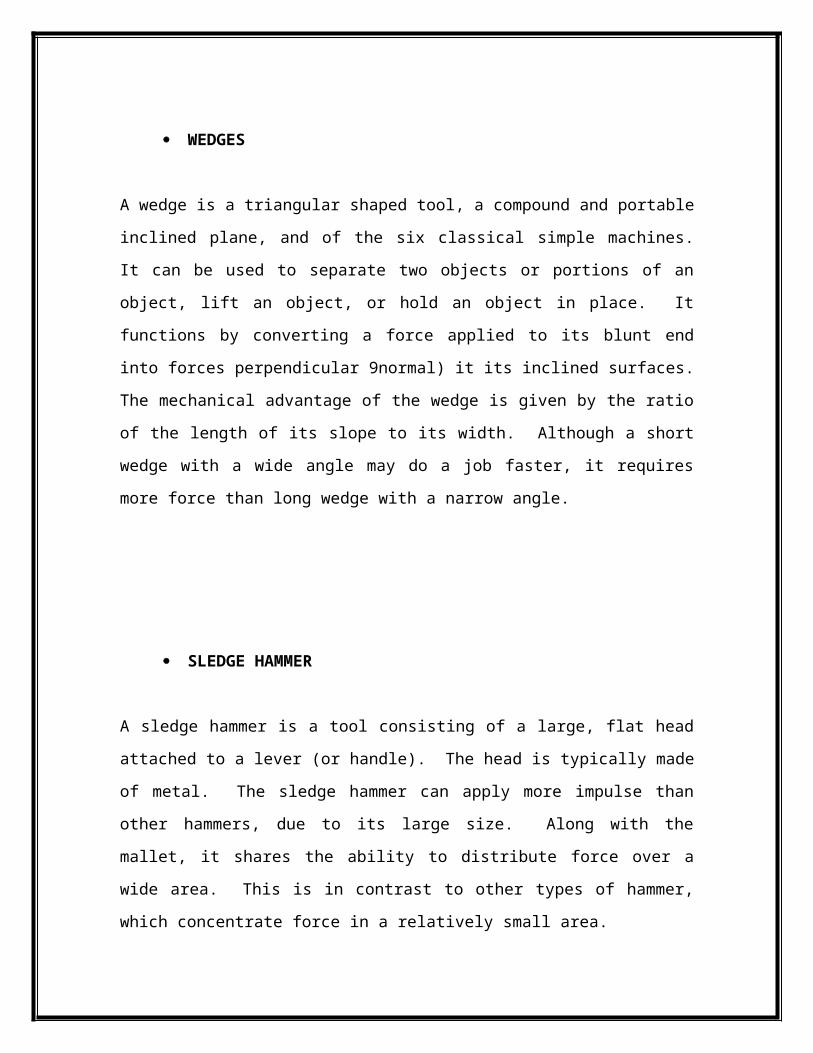
(peterson and Rajan, 1997): This study provides further evidence that good working
capital management is positively associated with better operating performance. Higher
levels of accounts receivables are associated with higher operating performance, in all
three growth rate categories. This study also finds that maintaining control over levels of
cash, securities, inventory, fixed assets, and accounts payable is associated with higher
operating performance. The firms which are experiencing very high growth will hold
higher level of cash, securities, inventory and fixed assets and accounts payable to
support the high growth. This, in turn, increases financial and operating risk for these
firms. Perhaps IPO firms should stay more focused on their operating performance,
while maintaining more moderate growth levels.
RESEARCH METHODOLOGY
RESEARCH
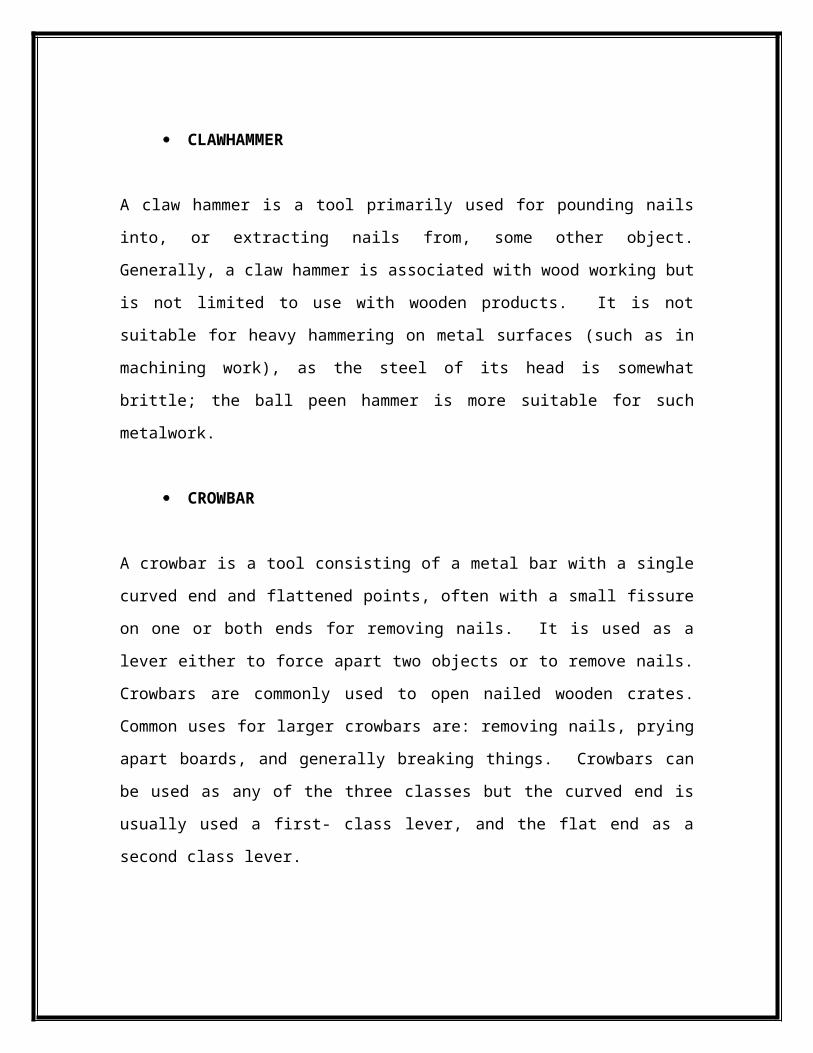
Research is a scientific and systematic search for pertinent information on a
specific topic. Research considered as an effort to gain new knowledge. Research finds
out the new solution for the problem. Research is the process of systematic and in-debth
study of any particular topic, subject or area of investigation backed by collection,
computation, presentation and interpretation of relevant data. According for Clifford
Woody, research comprises “defining and redefining problems, formulating hypotheses
of suggestion, solution, collection, organizing and evaluating data, at last careful testing
the conclusion to determine whether they fit the formulated hypothesis”.
RESEARCH METHODOLOGY
Research methodology is a scientific and systematic way to solve research
problem. Research methodology deals with research methods and takes into
consideration the logic behind the method. Research methodology is the description,
explanation and justification of carious methods of conducting research. It is understood
as a science of studying how research is done systematically.
RESEARCH DESIGN
The research design is the conceptual structure within research is conducted. It
constitutes the blue print for the collection, measurement and analysis of data. The
research design specifies the method of study. Research design is prepared after selecting
the topic and formulating the problem.
HISTOCIAL RESEARCH
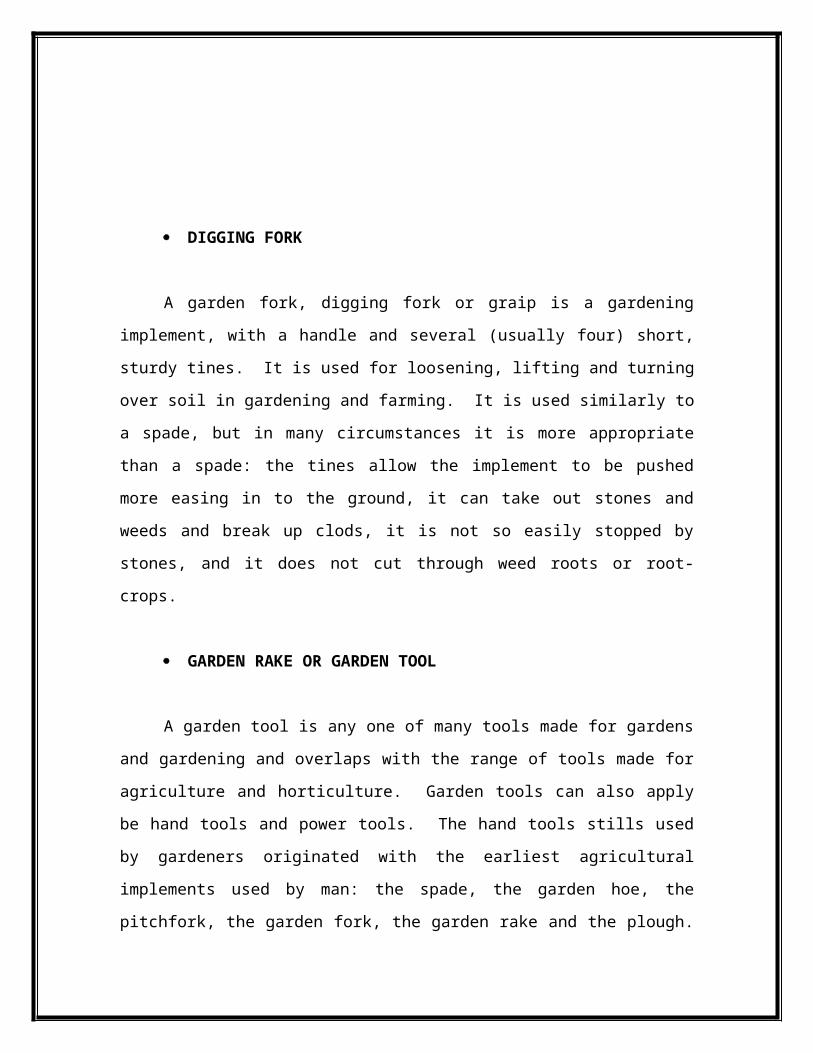
In this study Historical research is used. It is a research based on historical or past
data. It attempts to find what happened in the past and reveal reasons for why and how
things happened.
PERIOD OF STUDY
The study covers the period of 6 weeks
METHOD OF DATA COLLECTION
The analysis of financial condition and performance of the enterprize necessitates
accurate and reliable data. These for the data for present study are collected with the help
of secondary data from the annual report of the firm, it includes Profit and loss account
and Balancesheet of the Metal Industry Limited Shoranur.
SECONDARY DATA
Secondary data is the data collected by others to be re-used by the researcher.
Secondary data is mainly used for the study purposes. It is taken from published sources
of the company like annual reports, magazines, journals, website and other fianancial
offical records.
Annual reports
Books
Websites
TOOLS FOR THE STUDY
Ratio Analysis
Ratio Analysis is the systematic use of accounting ratios in order to weigh
and evaluate the operating performance of a firm. Accounting ratios are relationship
expressed in mathematical terms between two related figures in the financial statements.
The following ratios are used for the study
Current ratio, quick ratio, inventory turnover ratio, working capital turn over ratio, fixed
assts turn over ratio, debtors turn over ratio, creditors turn over ratio, gross profit ratio,net
profit ratio, cash to current assts ratio, current assets turnover ratio, average collection
period, average payment period etc.
1. CURRENT RATIO
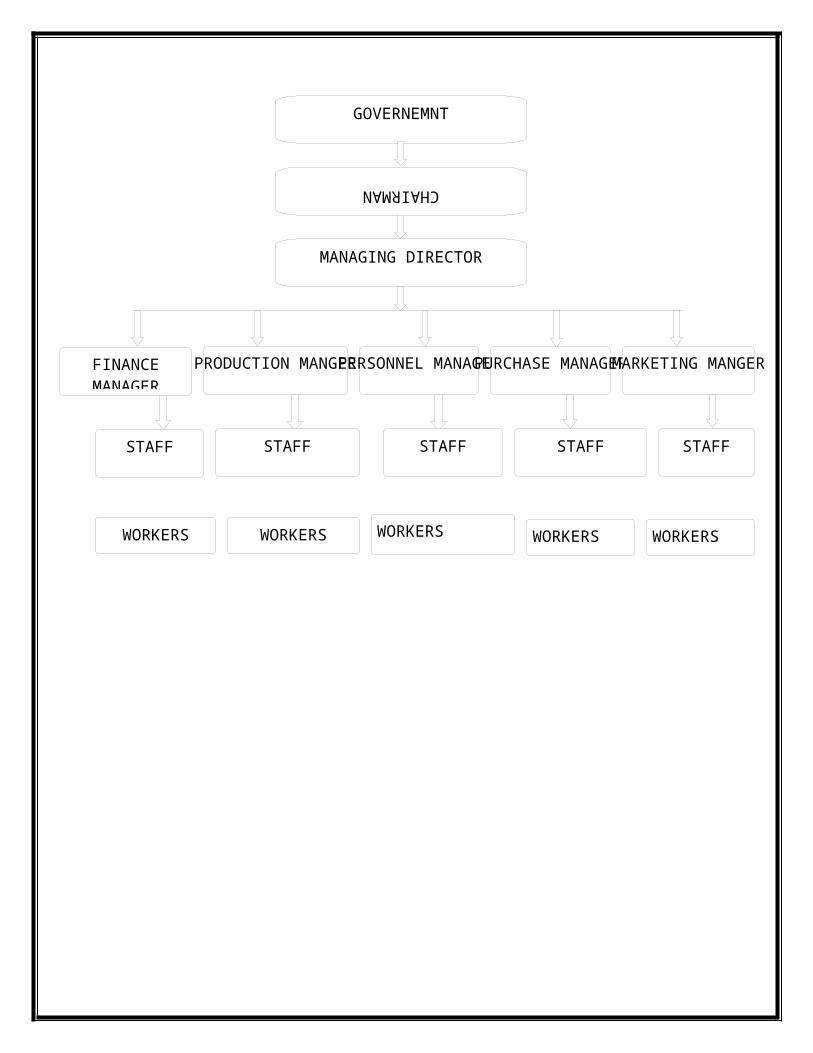
Current assets Current ratio =
Current liabilities
TABLE NO :1
YEAR CURRENT ASSET CURRENT LIABILITY
CURRENT RATIO
2001 12018810.63 7259742.39 1.65
2002 13297955.66 13615086.15 0.97
2003 10778371.36 8700252.63 1.23
2004 8853627.61 8210282.88 1.07
2005 9637695.62 9079675.99 1..06
2006 9474804.52 9777891.36 0.96
2007 9339653.78 10583860.51 0.88
2008 16272103.19 6282915.95 2.58
2009 16925641.09 4322464.05 3.91
2010 30807106.08 5571244.08 5.52
Chart No.1
CHART SHOWING CURRENT RATIO
2001 2002 2003 2004 2005 2006 2007 2008 2009 20100
1
2
3
4
5
6
1.23 0.97 1.23 1.07 1.06 0.96 0.88
2.58
3.91
5.52
YEAR
INTERPRETATION:
As a conventional rule current ratio of 2:1 is considered to be ideal. Here the
current ratio of last 3 years is increasing. The company is maintaining an average of 1.23
which is not satisfactory. The highest ratio is in the year 2010 (5.52) and lowest in the
year 2007 (0.88). The firm must try to keep the ratio 2:1 as per the ideal standard..
LIQUID RATIO
Liquid assets
Liquid ratio= Liquid liabilities
TABLE NO :2
YEAR LIQUID ASSETS LIQUID LIABILITIES
RATIO
2001 6374197.36 7259742.39 0.87
2002 8260818.21 13615086.15 0.60
2003 5910315.76 8700252.63 0.68
2004 3480680.02 8210282.88 0.42
2005 5099205.46 9079675.99 0.56
2006 6103590.93 9777891.36 0.62
2007 6319694.98 10512870.510 0.60
2008 12488640.24 6282915.95 1.98
2009 13190405.29 4322464.05 3.05
2010 25051809.53 5571244.08 4.49
CHART NO :2
CHART SHOWING LIQUID RATIO
2001 2002 2003 2004 2005 2006 2007 2008 2009 20100
0.51
1.52
2.53
3.54
4.55
0.870.6 0.68 0.65 0.59
0.340.6
1.98
3.05
4.49
YEAR
LIQUID RATIO
INTERPRETATION
As a rule of thumb the quick ratio of 1:1 is satisfactory. The firm has adequate
liquid assets to meet liabilities. The above table shows that the company’s quick ratio is
ranging from 4.49 to 0.87.
CASH RATIO
Cash + marketable securitiesCash ratio=
Current liability
TABLE NO :3
YEAR CASH AND MARKETABLE
SECURITIES
CURRENT LIABILITIES
RATIO
2001 1970571.44 7259742.39 0.27
2002 3584812.32 13615086.15 0.26
2003 492631.81 8700252.63 0.05
2004 615954.67 8210282.88 .07
2005 21883.85 9079675.99 .024
2006 1348967.45 9777891.36 0.13
2007 1324682.90 10583860.51 0.11
2008 49947721.10 6282915.95 0.79
2009 2753462.85 4322464.05 0.63
2010 13983251.50 5571244.08 2.5
CHART NO :3
TABLE SHOWING CASH RATIO
2001 2002 2003 2004 2005 2006 2007 2008 2009 20100
0.5
1
1.5
2
2.5
3
0.27 0.260.05 0.07 0.0024 0.13 0.11
0.790.63
2.5
YEAR
CASH RATIO
INTERPRETATION :
Cash ratio of the firm shows a mixed trend. The ratio is 0.27 in 2001 and
decreases to 0.26 in 2002 and in the last 3 years the ratio is increasing on an average. The
absolute liquid asset ratio is 0.481. This is because, the cash component of the current
asset is at a very low level. Hence, the firm has got more of convertible liquid assets and
less of immediately liquid assets, as it carries a small amount of cash.
DEBTORS TURNOVER RATIO
Total sales Debtors turnover ratio= Average debtors
TABLE NO :4
YEAR NET CREDIT SALES
DEBTORS RATIO
2001 12701348.86 3497427.47 3.63
2002 19394190.80 3251117.43 6.00
2003 23703318.38 4547007.63 5.21
2004 176844394.25 3421320.36 5.16
2005 14352306.31 4266670.60 3.36
2006 11678612.55 3682398.47 3.17
2007 18875520.23 3425740.98 5.50
2008 20268925.50 5587551.79 3.62
2009 39089885.4O 8448047.89 4.62
2010 23148586.70 8256857.78 2.8
CHART NO :4
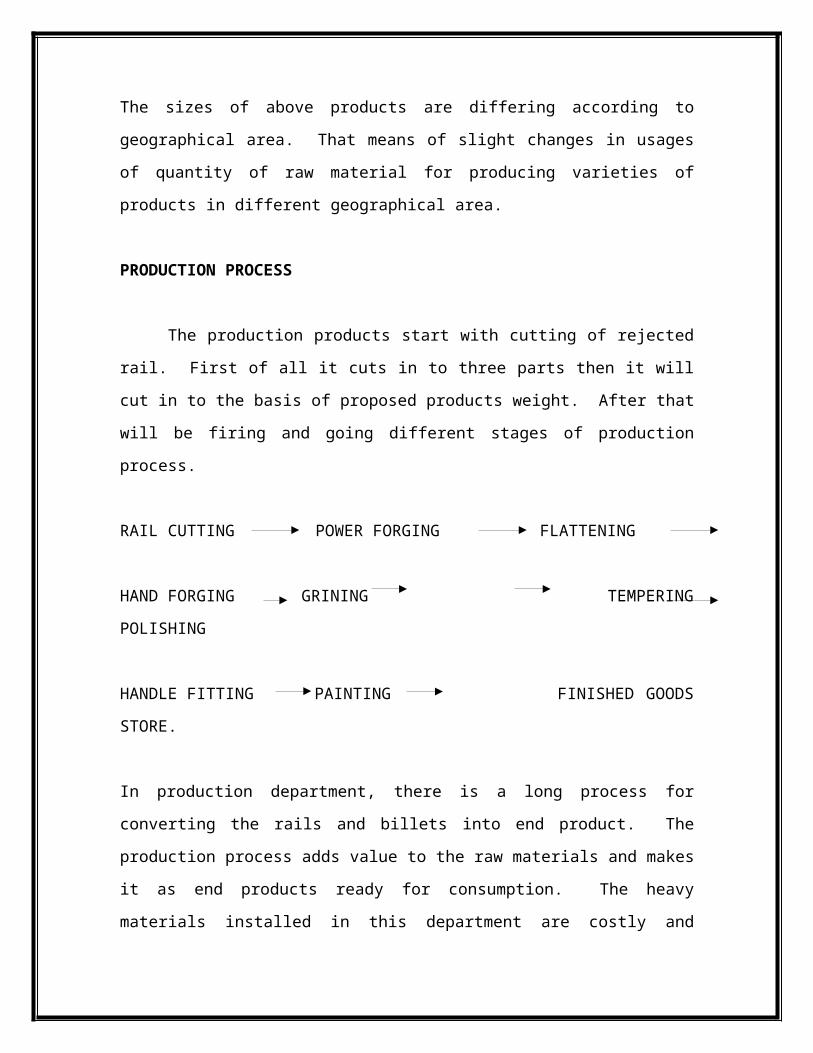
CHART SHOWING DEBTORS TURNOVER RATIO
2001 2002 2003 2004 2005 2006 2007 2008 2009 20100
1
2
3
4
5
6
7
3.63
65.21 5.16
3.36 3.17
5.5
3.62
4.62
2.8
YEAR
DTR
INTERPRETATION :
Debtors turnover ratio shows decreasing trend. It is highest in the year 2002
(6.00) and lowest in the year 2010 (2.8). The higher value of debtors turnover ratio the
more efficient of management of debtors. The average debtors turnover ratio is 4.30
which is not good for the company.
AVERAGE COLLECTION PERIOD
No.of days in ayear
Avarage collection period= DTR
TABLE NO :5
YEAR NO.OF DAYS IN A YEAR
DTR RATIO(in days)
2001 365 3.63 100
2002 365 6.00 61
2003 365 5.21 70
2004 365 5.16 71
2005 365 3.36 109
2006 365 3.17 115
2007 365 5.50 66
2008 365 3.62 101
2009 365 4.62 79
2010 365 2.8 130
CHART NO :5
CHART SHOWING AVERAGE COLLECTION PEROID
2001 2002 2003 2004 2005 2006 2007 2008 2009 20100
20
40
60
80
100
120
140
100
6170 71
109 115
66
101
79
130
year
DTR
INTERPRETATION:
The average collection period shows increasing trend which is bad for the
company. The highest collection period is in the year 2010 and the lowest collection
period is in the year 2002, which means company is inefficient in collecting its debts.
CREDITORS TURNOVER RATIO
Net credit purchasesCreditors turnover ratio =
Creditors
TABLE NO:6
YEAR NET CREDIT PURCHASES
CREDITORS RATIO
2001 2042621.75 507664.47 4.02
2002 10106018.60 7517770.56 1.34
2003 8496868.36 624380.44 13.6
2004 3545959.40 534170.91 6.6
2005 2960645.20 1063084.56 2.8
2006 1552831.71 1551010.05 1.0
2007 4671645.85 1352929.87 3.5
2008 4410883.74 1695451.37 2.60
2009 7485138.15 1401997.97 5.3
2010 4528032.22 1727372.27 2.62
CHART NO:6
CHART SHOWING CREDITORS TURNOVER RATIO
2001 2002 2003 2004 2005 2006 2007 2008 2009 20100
2
4
6
8
10
12
14
16
4.02
1.34
13.6
6.6
2.81
3.52.6
5.3
2.62
YEAR
CTR
INTERPRETATION:
In 2001, the ratio was 4.02 it decreased to 1.34 in 2002 it again increased to 2003
and finally decrease to 2.62. The CTR is very low which reflects tuff credit terms
granted by suppliers. It will affect to back the credit quickly from the creditors.
AVERAGE PAYMENT PERIOD
Accounts payable Avarage payment period = × 365 Net credit purchases
TABLE NO: 7
YEAR NO.OF DAYS IN A YEAR
CTR RATIO(in days)
2001 365 4.02 9
2002 365 1.34 272
2003 365 13.6 27
2004 365 6.6 55
2005 365 2.8 130
2006 365 1.0 365
2007 365 3.5 104
2008 365 2.60 140
2009 365 5.3 69
2010 365 2.62 139
CHART NO:7
CHART SHOWING AVERAGE PAYMENT PERIOD
2001 2002 2003 2004 2005 2006 2007 2008 2009 20100
50
100
150
200
250
300
350
400
9
272
2755
130
365
104140
69
139
YEAR
CTR
INTERPRETATION:
On an average, the APP is 131 days. A shorter period indicates that creditors are
being paid promptly, while a longer period reflects liberal creidt terms granted by
suppliers. Last 10 years average collection period shows a longer period. Higher APP
increases the cash position of the firm.
WORKING CAPITAL TURNOVER RATIO
Net SalesWorking capital turnover ratio =
Net working capital
TABLE NO:8
YEAR NET CREDIT SALES
NET WORKING CAPITAL
RATIO
2001 12701348.86 4759068.24 2.67
2002 19394190.80 -317130.49 -61
2003 23703318.38 2078118.73 11.4
2004 176844394.25 643344.73 27.4
2005 14352306.31 558019.63 26
2006 11678612.55 -303086.84 -39
2007 18875520.23 -1244206.73 -15.1
2008 20268925.50 9989187.24 2.02
2009 39089885.4O 12603177.04 3.10
2010 23148586.70 22235862 1.04
CHART NO:8
CHART SHOWING WORKING CAPITAL TURNOVER RATIO
-50
-40
-30
-20
-10
0
10
20
30
40
2.67
-6.1
11.4
27.4 26
-39
-15.1
2.02 3.1 1.04
Year
Wo
rkin
g c
apit
al t
urn
ove
r ra
tio
INTERPRETATION:
This ratio indicates the number of times the utilization of working capital in the
process doing business. Here the woring capital turnover ratio is decreasing trend.
Lower is the ratio indicates higher is the investment in working capital and there will be
lower profits.
INVENTORY TURNOVER RATIO
Cost of goods soldInventory turnover ratio =
Average inventory
TABLE NO: 9
YEAR COST OF GOODS SOLD
AVERAGE STOCK RATIO
2001 10279001.08 3589514.52 2.9
2002 14755079.45 4473621.85 3.3
2003 14600931.28 4045485.915 3.6
2004 10534177.88 3228026.82 3.26
2005 7216798.49 2474893.05 2.91
2006 5937731.85 2163086.95 2.74
2007 9057201.69 1619722.25 5.6
2008 7513828.34 1881521.3 4.00
2009 13613520.9 2641319 5.15
2010 8251252.02 349357.38 2.36
CHART NO: 9
CHART SHOWING INVENTORY TURNOVER RATIO
2001 2002 2003 2004 2005 2006 2007 2008 2009 20100
1
2
3
4
5
6
2.93.3
3.63.26
2.91 2.74
5.6
4
5.15
2.36RATIO
YEAR
INVENTORY TURNOVER
RATIO
INTERPRETATION:
Stock is most important component of working capital. It measures how fast the
stock is moving through the firm and generating sales. In 2001, the ratio was 2.9 and it
increase in following 3 years and finally decreases in the year 2010, the ratio was 1.04.
proper inventory turnover makes business to earn a reasonable margin of profit.
INVENTORY TURNOVER PERIOD
No. of days in a yearInventory turnover period =
Inventory turnover ratio
TABLE NO:10
YEAR NO.OF DAYS IN A YEAR
ITR RATIO(in days)
2001 365 2.9 126
2002 365 3.3 111
2003 365 3.6 101
2004 365 3.26 112
2005 365 2.91 125
2006 365 2.74 133
2007 365 5.6 65
2008 365 4.00 91
2009 365 5.15 71
2010 365 2.36 155
CHART NO: 10
CHART SHOWING INVENTORY TURNOVER PERIOD
2001 2002 2003 2004 2005 2006 2007 2008 2009 20100
20406080
100120140160180
126111
101112
125 133
65
9171
155
RATIO(IN DAYS)
YEAR
ITP
INTERPRETATION:
In the year 2001, the ITP is 126 days and reduces to 111 days in 2002. In the
following three years the ratio is increasing. In the year 2010, the ratio is 155 days, i.e.,
higher. It means the inventories are kept idle for a longer period of time.
FIXED ASSET TURNOVER RATIO
SalesFixed assets turnover ratio =
Fixed assets
TABLE NO: 11
YEAR NET SALES FIXED ASSETS RATIO
2001 12701348.86 22523965.53 0.56
2002 19394190.80 22290387.61 0.87
2003 23703318.38 22045252.15 1.0
2004 176844394.25 21889216.25 0.80
2005 14352306.31 21716799.68 0.66
2006 11678612.55 21572579.46 0.54
2007 18875520.23 21509813.56 0.87
2008 20268925.50 22558482.20 0.89
2009 39089885.40 24580818.32 1.5
2010 23148586.70 26092221.04 0.88
CHART NO:11
CHART SHOWING FIXED ASSETS TURNOVER RATIO:
2001 2002 2003 2004 2005 2006 2007 2008 2009 20100
0.2
0.4
0.6
0.8
1
1.2
1.4
1.6
0.56
0.871
0.80.66
0.54
0.87 0.89
1.5
0.88
YEAR
FIXED ASSET TURNOVER
RATIO
INTERPRETATION:
This ratio expresses the number of times the fixed asset is being turned over a
stated period. This ratio shows decreasing trend. The lowest ratio in the year 2001 (0.56)
and highest in the year 2009 (1.5). Lower ratio shows inefficiency in utilization of
capital and it would lead to lower profitability.
CURRENT ASSET TO TOTAL ASSET RATIO
Current assetsCurrent asset to total asset ratio =
Total assts
TABLE NO:12
YEAR CURRENT ASSET TOTAL ASSET RATIO
2001 12018810.63 34542776.16 34.79
2002 13297955.66 35588343.27 37.36
2003 10778371.36 32823623.51 32.8
2004 8853627.61 30742843.86 28.7
2005 9637695.62 31354495.3 31
2006 9474804.52 31047383.98 31
2007 9339653.78 30849467.34 30.27
2008 16272103.19 38830585.39 50
2009 16925641.09 41506459.41 41
2010 30807106.08 56899327.12 54.14
CHART NO:12
CHART SHOWING CURRENT ASSET TO TOTAL ASSET RATIO
2001 2002 2003 2004 2005 2006 2007 2008 2009 20100
10
20
30
40
50
60
34.79 37.3632.8
28.7 31 31 30.27
50
41
54.14
RATIO
YEAR
CURRENT ASSET TO TOTAL ASSET
INTERPRETATION:
This ratio indicates the proportion of current asset towards total asset. In 2001, the
proportion was 34.79 and it decreased to 31 in 2005 and 2006. In the year 2010, it was
54.14. This means company is investing more amounts in current asset.
CASH TO CURRENT ASSET RATIO
CashCash to current asset ratio = ×100
Current assts
TABLE NO:13
YEAR CASH CURRENT ASSETS
RATIO
2001 1970571.44 12018810.63 16.3
2002 3584812.32 13297955.66 26.95
2003 492631.81 10778371.36 4.57
2004 615954.67 8853627.61 6.95
2005 21883.85 9637695.62 2.2
2006 1348967.45 9474804.52 14.23
2007 1324682.90 9339653.78 14.18
2008 49947721.10 16272103.19 30.69
2009 2753462.85 16925641.09 16.26
2010 13983251.50 30807106.08 45.3
CHART NO: 13
TABLE SHOWING CASH TO CURRENT ASSET RATIO
2001 2002 2003 2004 2005 2006 2007 2008 2009 201005
101520253035404550
16.3
26.95
4.57 6.952.2
14.23 14.18
30.69
16.26
45.3
RATIO
YEAR
CASH ASSET TO CURRENT ASSET
INTERPRETATION:
The above graph shows the cash to current asset ratio of the company for the last
ten years. In 2001, the ratio was 16.3 and in 2002 ratio increased 26.95 and the following
three years declined. Again the ratio is increased. In the year 2010, the ratio is highly
increased. This shows that the company holds more amount of cash.
CURRENT ASSET TURNOVER RATIO
Net sales Current asset turnover ratio =
current assts
TABLE NO:14
YEAR NET SALES CURRENT ASSETS
RATIO
2001 12701348.86 12018810.63 1.05
2002 19394190.80 13297955.66 1.45
2003 23703318.38 10778371.36 2.19
2004 176844394.25 8853627.61 1.99
2005 14352306.31 9637695.62 1.48
2006 11678612.55 9474804.52 1.23
2007 18875520.23 9339653.78 2.02
2008 20268925.50 16272103.19 1.24
2009 39089885.40 16925641.09 2.30
2010 23148586.70 30807106.08 0.75
CHART NO:14
CHART SHOWING CURRENT ASSET TURNOVER RATIO
2001 2002 2003 2004 2005 2006 2007 2008 2009 20100
0.5
1
1.5
2
2.5
1.05
1.45
2.191.99
1.481.23
2.02
1.24
2.3
0.75 RATIO
YEAR
CURRENT ASSET TURNOVER RATIO
INTERPRETATION: The ratio in the year 2001 was 1.05 and it increased to 1.45 in 2002 and it again
increased 2003. This ratio shows a mixed trend. Higher ratio indicates that company is
utilizing more current assets to generate sales. This trend shows that firm is not able to
utilize current assets effectively.
NET WORKING CAPITAL GAP RATIO
CA-CL Net working capital gap ratio =
CA
TABLE NO:15
YEAR NET WORKING CAPITAL
CURRENT ASSETS
RATIO
2001 475968.24 12018810.63 0.39
2002 -317130.49 13297955.66 -0.02
2003 2078118.73 10778371.36 0.19
2004 643344.73 8853627.61 0.07
2005 558019.63 9637695.62 0.05
2006 -303086.84 9474804.52 -0.03
2007 -1244206.73 9339653.78 -0.13
2008 9989187.24 16272103.19 0.61
2009 12603177.04 16925641.09 0.74
2010 22235862 30807106.08 0.72
CHART NO:15
CHART SHOWING NET WORKING CAPITAL GAP RATIO:
2001 2002 2003 2004 2005 2006 2007 2008 2009 2010-0.2
0
0.2
0.4
0.6
0.8
0.39
-0.02
0.190.07 0.05
-0.03-0.13
0.610.72 0.74
YEAR
NET WORKING CAPITAL GAP
RATIO
INTERPRETATION:
In the year 2001, the ratio was 0.39 and it goes to loss stage in the year 2002, 206
and 2007. in the last three years the ratio is increasing, that means the proportion of
working capital in current asset is increasing.
GROSS PROFIT RATIO
Gross profit Gross profit ratio = ×100
Net sales
TABLE NO:16
YEAR GROSS PROFIT NET SALES RATIO
2001 3134912.04 120701348.86 24.68
2002 1412212.32 19394190.80 7.28
2003 25186441.39 23703318.38 16.25
2004 477176.54 176844394.25 2.6
2005 -481246.50 14352306.31 -3.35
2006 3146410.98 1168612.55 26.94
2007 1298563.21 18875520.23 6.87
2008 2431644.27 20268925.50 11.9
2009 2312655.92 39089885.4O 5.9
2010 2700140.43 23148586.70 11.6
CHART NO:16
CHART SHOWING GROSS PROFIT RATIO
2001 2002 2003 2004 2005 2006 2007 2008 2009 2010-5
0
5
10
15
20
25
3024.68
7.28
16.25
2.6
-3.35
26.94
6.87
11.9
5.9
11.6
RATIO
YEAR
GROSS PROFIT RATIO
INTERPRETATION:
In 2001 the ratio was 24.68. This ratio fluctuting from year to year. And in 2005
the ratio is decreasing, ie gross loss occurred. The highest ratio in the year is 2006. in
the last three years the ratio is average. It is a bad sign which indicates the inefficiency in
mannagement.
NET PROFIT RATIO
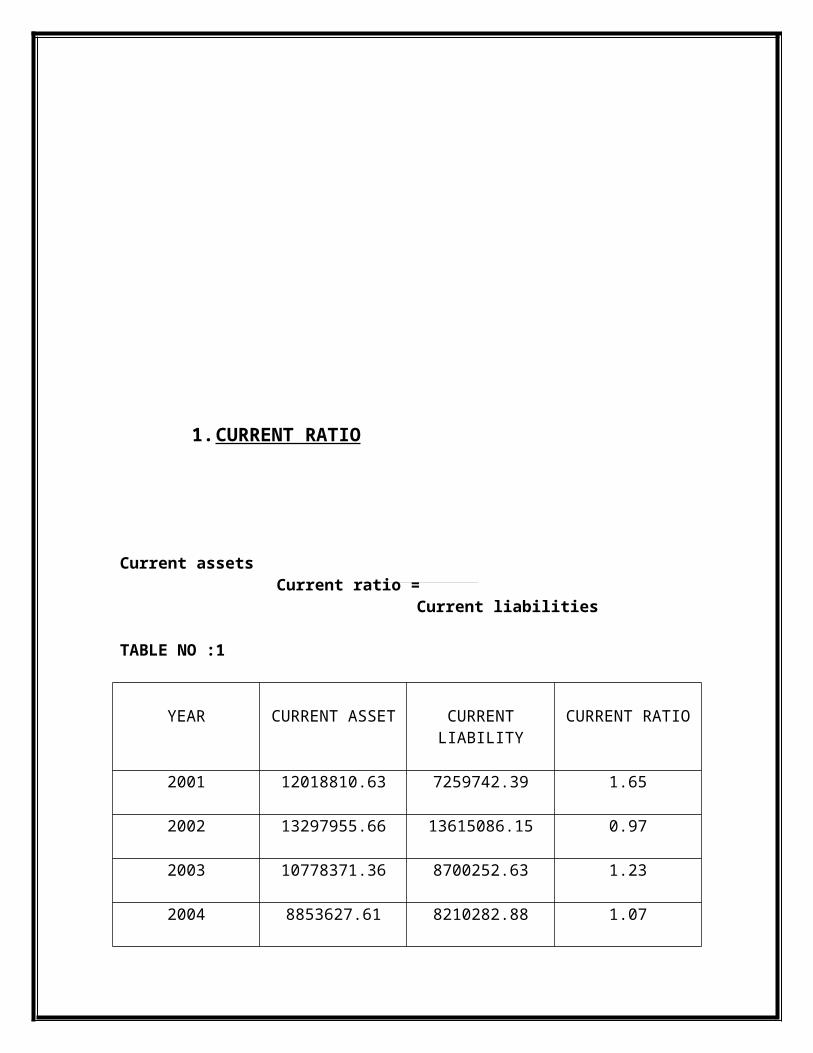
Net profit Net profit ratio = ×100
Net sales
TABLE NO:17
YEAR NET PROFIT NET SALES RATIO
2001 14495685.98 120701348.86 140
2002 17438955.65 19394190.80 90
2003 -18361070.27 23703318.38 -77.46
2004 19871907.13 176844394.25 112.36
2005 22737754.54 14352306.31 158
2006 -24887504.59 1168612.55 -213
2007 -25176354.77 18875520.23 -133
2008 -20092467.11 20268925.50 -99.12
2009 -16350503.40 39089885.4O -41.8
2010 -15259113.22 23148586.70 -66
CHART NO:17
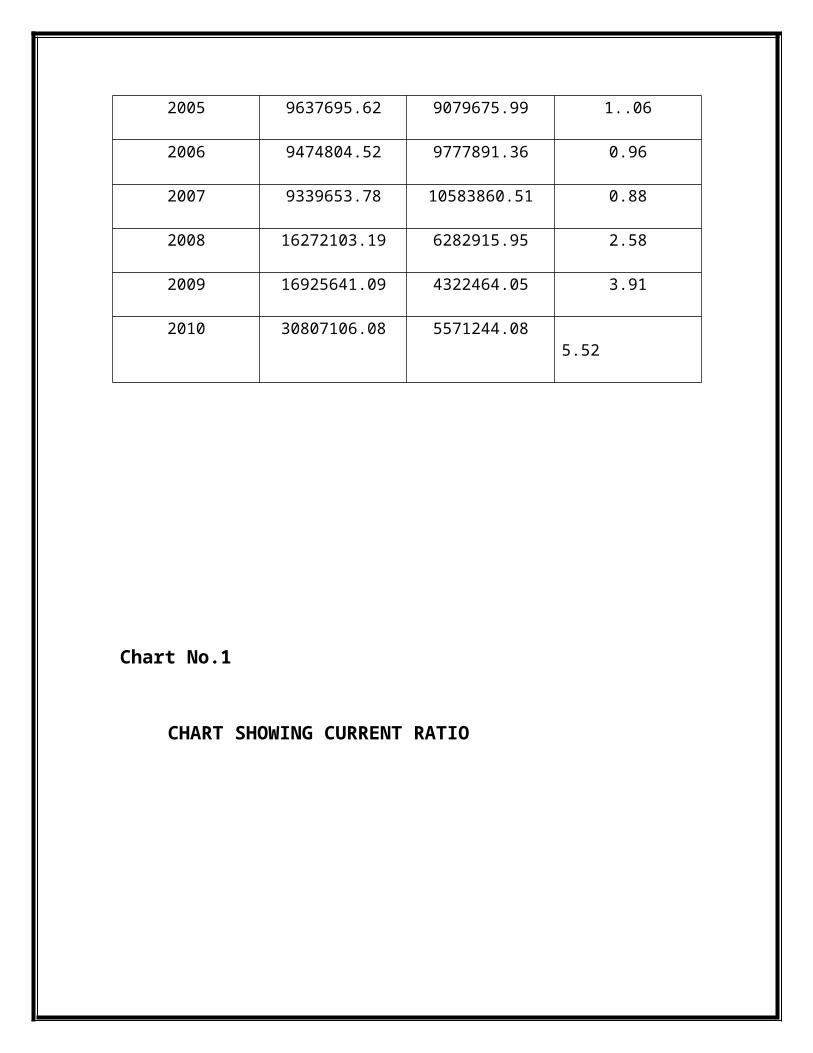
CHART SHOWING NET PROFIT RATIO
2001 2002 2003 2004 2005 2006 2007 2008 2009 2010-250-200-150-100-50
050
100150200
14090
-77.46
112.36158
-213
-133-99.12
-41.8-66
0
RATIO
YEAR
NET PROFIT RATIO
INTERPRETATION:
This ratio shows the negative trend. The ratio is highest in the year 2005 (158).
In the last five years the company goes to loss stage. It will affect the profitability of the
firm.
5.1 FINDINGS OF THE STUDY
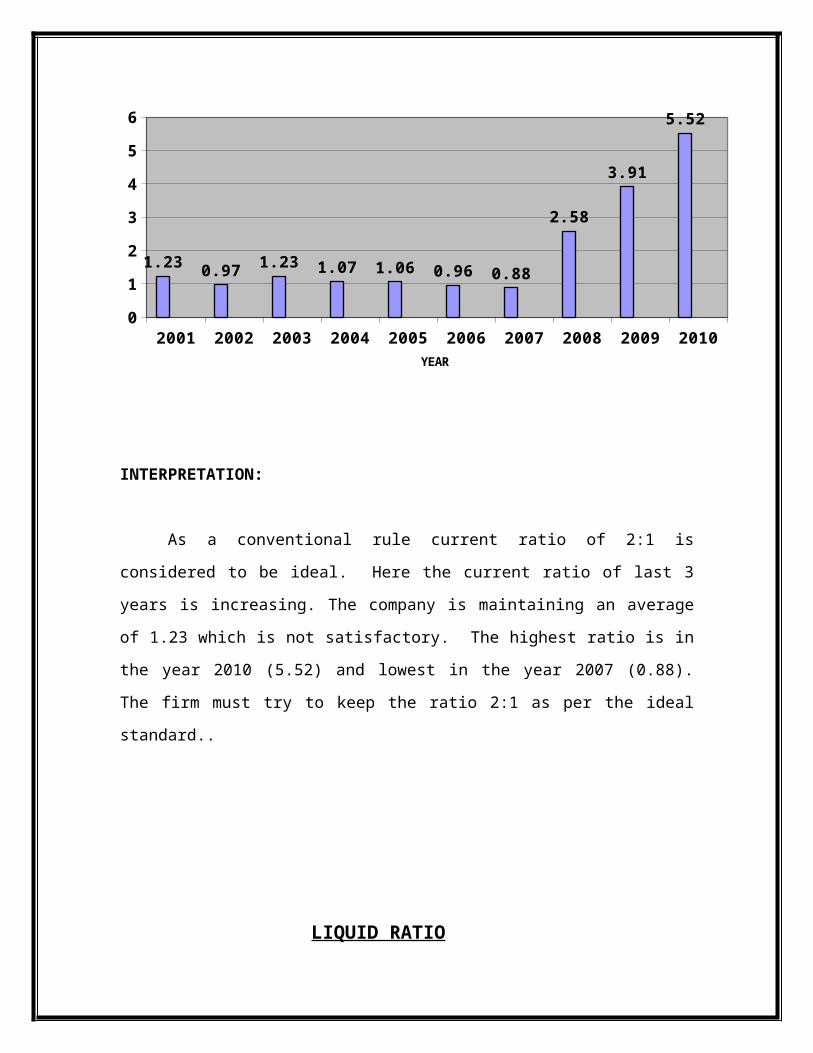
The study shows that working capital management in Metal Inddustries Ltd is
satisfactory.
The company is maintaining adequate liquidity level to meet its liability.
The company has maintained an average of 1.23 :1 in the case of current ratio
which is not satisfactory because the standard current ratio is 2:1.
The Quick Ratio of the company is considered satisfactory because the company
is maintained an average of 1.38:1 and the standard quick ratio is 1:1.
Cash ratio of the company is increasing, that means the availability of cash
increasing for meeting the current liablities.
The company’s debtors turnover ratio has a decreasing trend which shows
inefficiency of the company to collect the cash from the debtors quickly.
The creditor’s turnoverr ratio shows a mixed trend and this indicates that the firm
is not following neither a stringent nor liberal policy and higher APP increases the
cash position of the firm.
By analysing the working capital turnover ratio it is found that the company
utilizes less amount of working capital for generating sales.
Inventrory turnover ratio is in slightly increasing, that means raw materials are
converted into sales slowly and the inventories are over stocked.
The fixed asset turnover ratio is decreasing, which shows the efficiency in
utilization of capital and it would lead to lesser profitability.
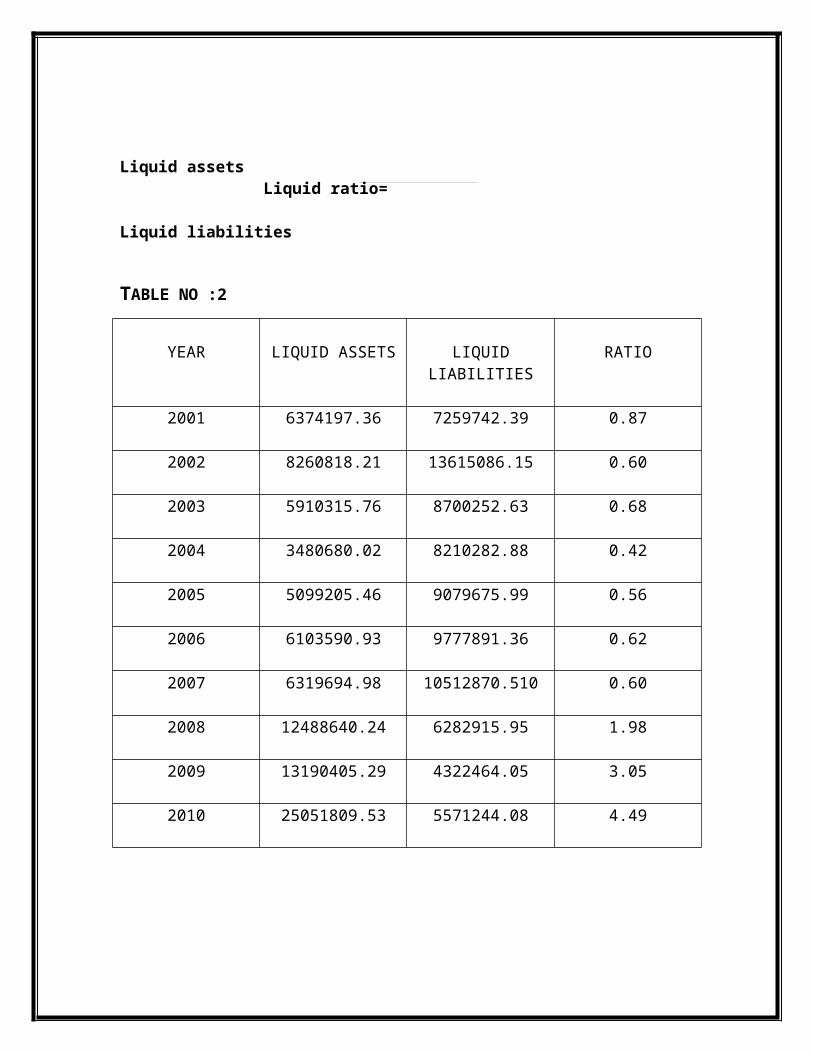
By looking the current assets to total assets ratio we can see that the proportion of
current asset in total asset is very high.
The cash to current asset ratio shows that the company holds more amount of
cash.
Lower current asset turnover ratio indicates the company is utilizing less current
assets to generate sales.
Working capital gap ratio is decreasing, in 2010 the ratio is 0.72 that means the
proposition of working capital in current asset is decreasing.
Gross profit ratio of the company is decreasing, this indicates the inefficiency of
the management.
The net profit ratio is decreasing trend, some times it goes to loss stage, which
means that it reduces the profitability of the firm.
5.2 SUGGESTIONS
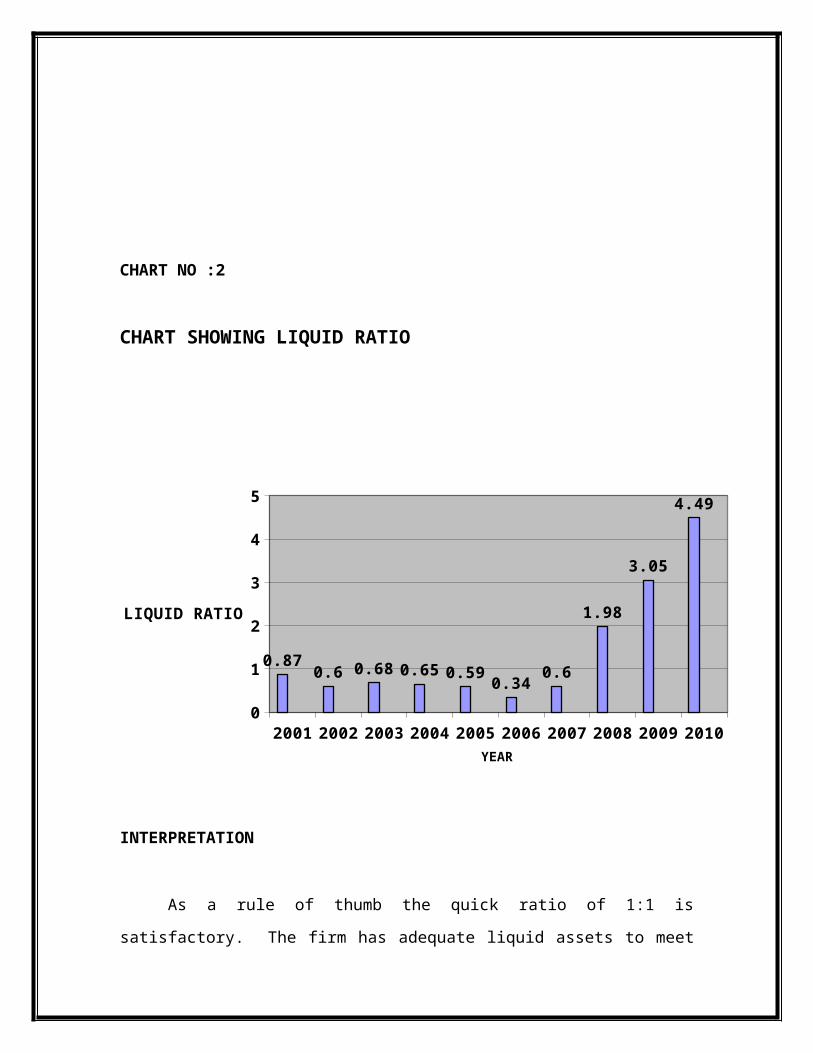
As the current ratio of the company is not satisfactory, the company should
improve its short term liquidity position either by increasing current assets or
reducing current liabilities.
Net profit of the company can be increased by decreasing the manufacturing cost
with the help of an effective cost management system.
The company should think of modernization and diversification programmes,
otherwise it would not be able to withstand in the competition.
When compared to sales the company is maintaining huge investment in fixed
asset. So the company should either sell the unnecessary fixed asset or increasing
the plant capacity.
Debtors collection period had to be reduced, at least 60 days otherwise the chance
of them turning bad would be high. By adopting proper credit policy from time to
time for avoding this situation in the company.
The firm should identify the various investment avenues suitable to it.
A well planned collection programme should be adopted so as to reduce the
amount of receivables.
The management of inventory should ensure that no inventories are lying in stock
for long time.
5.3 CONCLUSION
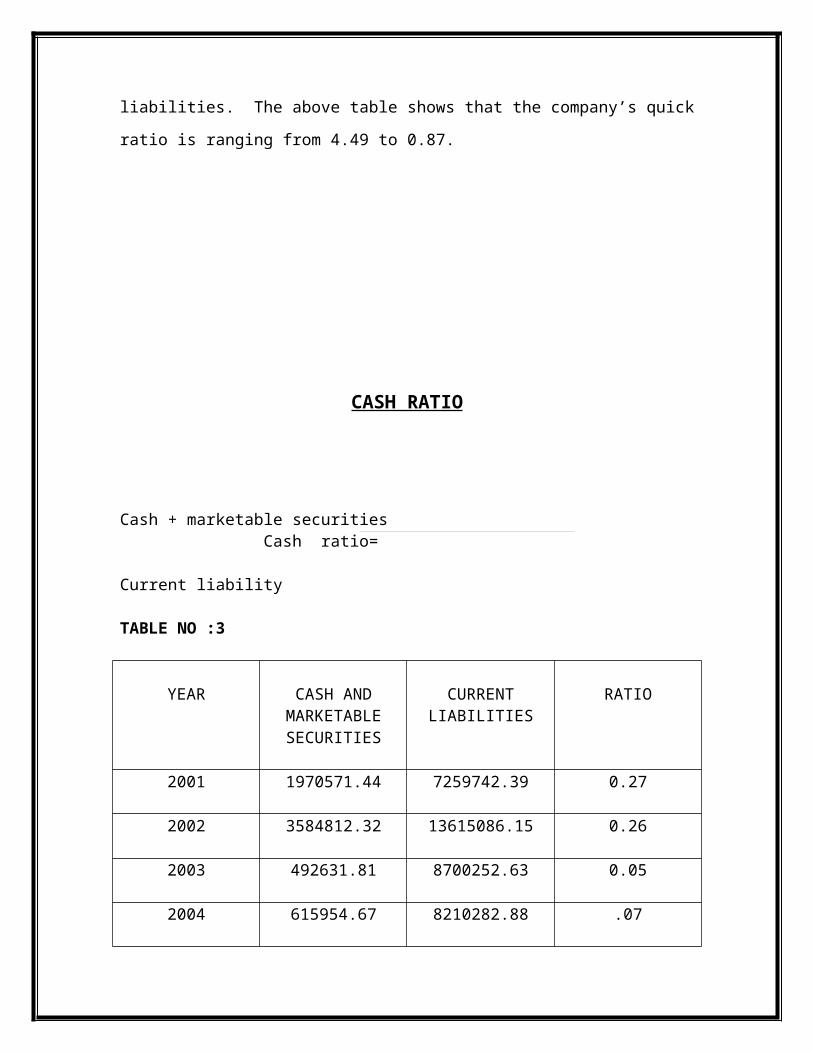
Finance is the king-pin of any business enterprise. Every part of an enterprise
production, distribution, management, etc requires finance. Working capital
management is the management of the current asset. The study of the working capital
will helps to identify the liquidity and overall efficiency of the firm. From this study
we can conclude that the working capital management of Metal Industries Ltd is not
satisfactory. The company should give some attention to manage the fixed asset, cash
and net profit and also control overstocking. When the company manages its
inventory, cash and receivables efficiently we can say that working capital
management is efficient.
BIBLOGRAPHY
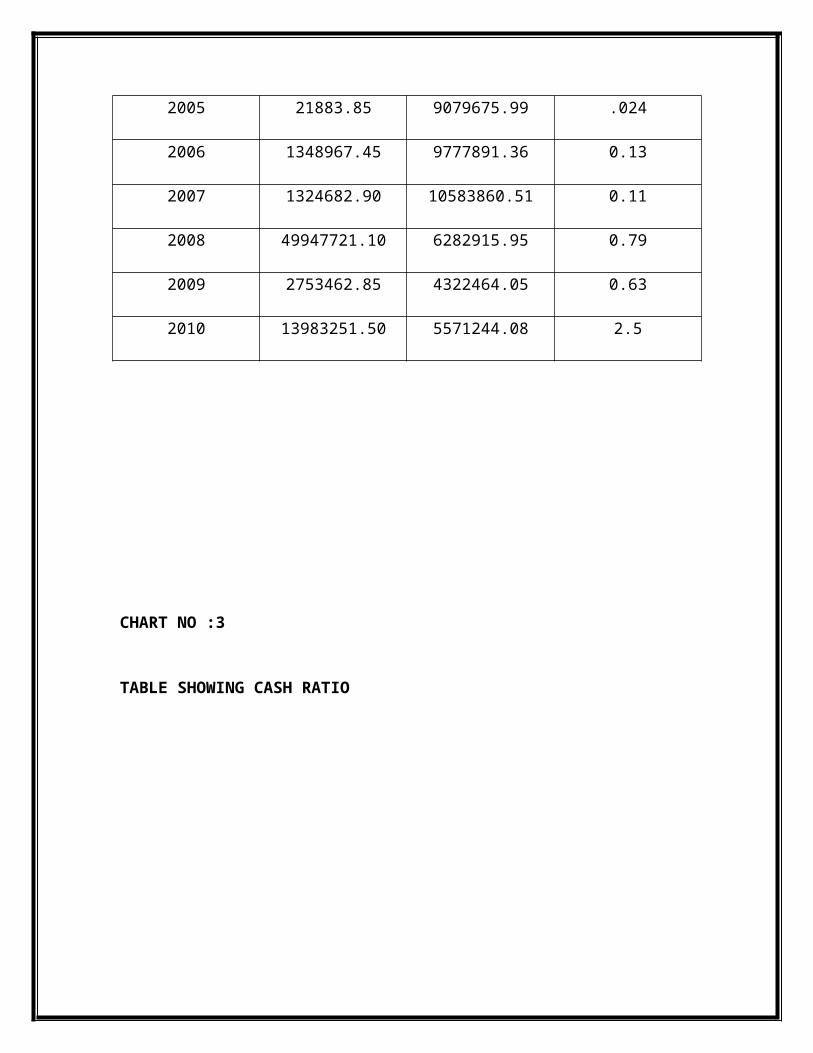
PRASANNA CHANDRA, fundamentals of Financial Management, New Delhi,
Tata McGraw- Hill Publishing Company Ltd., 1998.
KHAN & JAIN, Financial Management (Third Edition), New Delhi, Tata
McGraw- Hill Publishing Company Ltd., 1999.
V.K BHALLA, Working Capital Management (11th revised & enlarged Edition),
New Delhi, Anmol Publications Pvt Ltd., 2010.
C.R KOTHARI, Research Methodology and Techniques Second Revised
Edition), New Delhi, New Age International Publishers, 2004
Annual reports- METIND, Shoranur.
WEBLIOGRAPHY
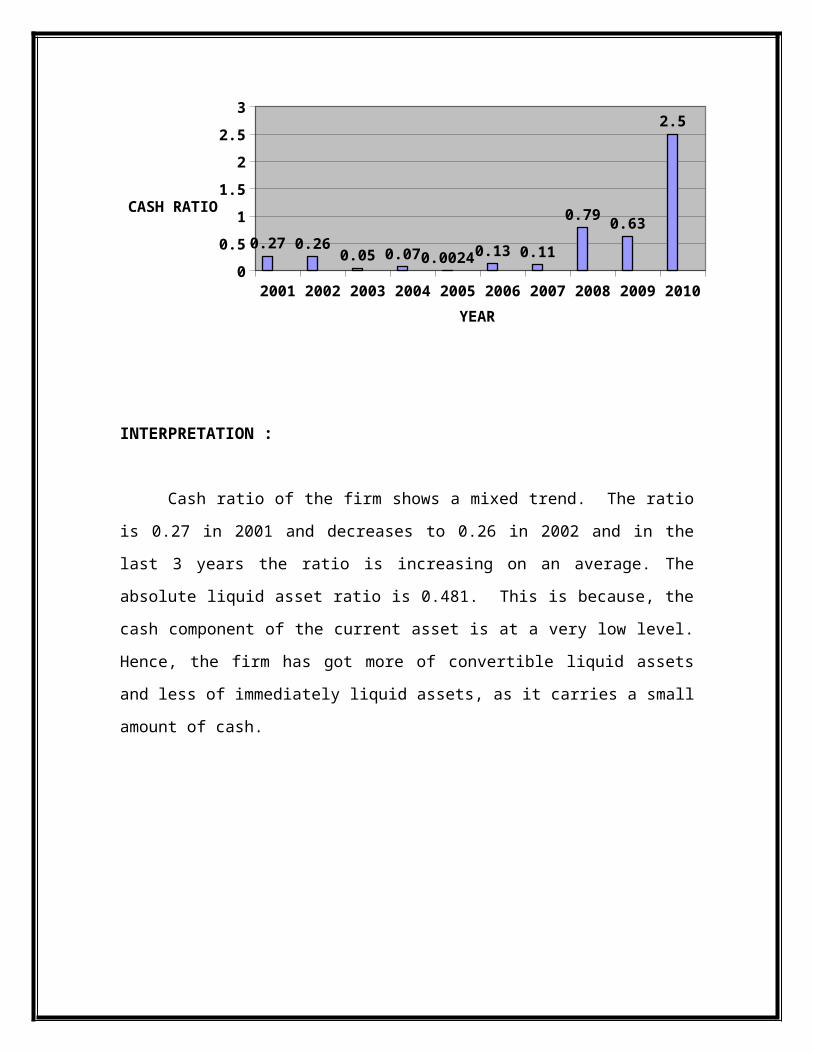
WWW.FINANCE . INDIAMART.COM
WWW. METIND.COM
WWW.ANSWERS.COM
WWW.WIKIPEDIA.ORG
http://www.essays.se/about/working capital+management+thesis/


![AJI - KPM EKONOMI [Compatibility Mode]](https://img.pdfslide.us/doc/110x75/577d34c01a28ab3a6b8ec504/aji-kpm-ekonomi-compatibility-mode.jpg)