Embed Size (px)
Citation preview

ASX/Media Release
24 February 2010
AJA HALF YEAR RESULTS - PRESENTATION
We attach the Presentation relating to Astro Japan Property Group’s Half Year Results to 31 December 2009.
ENDS Investor & Media Enquiries: Eric Lucas Ian Hay Senior Advisor Chief Financial Officer Phone: +61 2 8987 3900 (Australia) Phone: +61 2 8987 3902 +81 3 3238 1671 (Japan) About Astro Japan Property Group Astro Japan Property Group is a listed property group which invests in the Japan real estate market. It currently holds interests in a portfolio comprising 43 retail, office and residential properties. Asset management services in Japan are generally undertaken by Spring Investment Co., Ltd. AJA is a stapled entity comprising Astro Japan Property Trust (ARSN 112 799 854) and Astro Japan Property Group Limited (ABN 25 135 381 663). For further information please visit our website: www.astrojapanproperty.com.

AJA half year results to 31 December 2009
Eric Lucas, Senior Advisor
24 February 2010

DISCLAIMER
2
This publication is issued by the Astro Japan Property Group (“Astro Group”), comprising Babcock & Brown Japan Property Management Limited (ABN 94 111
874 563, AFSL 283142) (“Responsible Entity”) as responsible entity of the Astro Japan Property Trust (ARSN 112 799 854) (“AJT”) and Astro Japan Property
Group Limited (ABN 25 135 381 663) (“AJCo”).
The Astro Group and its directors, officers, employees and contractors do not accept, and expressly disclaim, any liability whatsoever for any loss howsoever
arising from any use of this publication or its contents.
This publication is not intended to constitute legal, tax or accounting advice or opinion. No representation or warranty, express or implied, is made as to the
accuracy, completeness or thoroughness of the content of the information contained in this publication. The recipient should consult with their own investment,
financial, taxation or other professional adviser as to the accuracy and application of the information contained herein and should conduct their own due
diligence and other enquiries in relation to such information.
The information contained in this publication does not constitute an offer of, or invitation to invest in or subscribe for, or a recommendation of, AJA stapled
securities.
The information contained in this publication constitutes general information only. The Responsible Entity is not licensed to provide financial product advice
(including personal financial product advice), and the information contained in this publication does not constitute financial product advice.
In providing this publication, the Astro Group has not considered the investment objectives, financial situation and particular needs of an investor. Before
making any investment decision with respect to AJA stapled securities, an investor should consider its own investment objectives, financial circumstances and
needs, and if necessary consult its investment, financial, taxation or other professional adviser.
This publication may include information forecasting or projecting future outcomes. Such outcomes may be affected by a wide range of influences outside of
the Astro Group‟s control. In respect of such forward-looking information, no representation or warranty is made by or on behalf of the Astro Group that any
projection, forecast, forward-looking statement, assumption or estimate contained in this publication should or will be achieved.
The Astro Group specifically prohibits the redistribution or reproduction of this material in whole or in part without the written permission of the Astro Group and
the Astro Group accepts no liability whatsoever for the actions of third parties in this respect.
Asset management services in Japan are generally undertaken by Spring Investment Co. Limited (“Spring”). Property level information contained in this
publication has been provided by Spring.
AGENDA
• Key points
• Financial results
• Portfolio overview and leasing activity
• Debt and FX hedging
• Events since 31 December 2009
• Outlook
• Appendices
3

Key Points

KEY POINTS
• Net operating profit after tax of A$26.7m, down approximately 17.7% on the prior corresponding period,
mainly due to a decline in net property income
• Net property income declined 15.6% on the prior corresponding period of which approximately 7.2%
represents the impact of the sale of Shinjuku Sanei in May 2009
• Excluding the sale of Shinjuku Sanei, net property income declined by approximately 8.4% on the prior
corresponding period, primarily due to a fall in office occupancy and office rental income
• Funds from operations (FF0)¹ of ¥2.0bn (A$25.1m) down ¥0.6bn (A$7.5m) relative to the prior
corresponding period of which approximately ¥0.3bn (A$3.8m) represents the impact of the sale of
Shinjuku Sanei
• Portfolio occupancy by area remains at 92.7% as at 31 December 2009 versus 94.0% as at 30 June 2009
• Portfolio debt service coverage ratio (DSCR)² remains strong at 3.5x
• Distribution of 3.50 cps for the period after retaining 2.13 cps for capital management purposes
• Full year distribution guidance of 7.00 cps
5
¹ FFO consists of operating cashflow excluding foreign exchange hedge income and Japanese withholding tax
² Portfolio DSCR is FFO divided by debt service costs

ACHIEVEMENTS DURING THE HALF YEAR
Debt
Definitive term sheet signed for a new five year, senior, non-recourse loan of ¥13.4bn (A$160m)
Loan will be used to refinance the five year term loan set to mature in March 2010, representing 16.3% of AJA‟s
total debt balance
Favourable margin payable of 195 bps, all-in margin cost of approximately 237 bps
Formal loan documentation currently being finalised with closing expected to take place in March
Discussions have commenced with current lender and other lender candidates regarding refinancing of loan
maturing in December 2010
Capital and distribution hedging
Successfully renegotiated positive changes to foreign exchange hedging terms including:
Waiver of counterparty‟s August 2009 option to terminate
Removal of the gearing ratio covenant
Amendment of the minimum securityholders‟ equity covenant reducing the threshold to A$250m (previously
A$458m)
As at 24 February 2010, at an FX rate of A$1.00 = ¥78.30, the hedging position is fully cash collateralised on a
mark to market basis. No further collateral can be called on the basis of mark to market movements
Counterparty has retained annual option to terminate in August. AJA is in constructive discussions with the
counterparty to manage the upcoming August 2010 termination option
6

ACHIEVEMENTS DURING THE HALF YEAR (cont‟d)
Property performance
Only 15 properties required to be revalued as at 31 December 2009 (compared to all 43 as at 30 June 2009)
resulting in a portfolio decline of 4.8%
Rate of increase in capitalisation rates appears to have slowed significantly since June 2009. Cyclical
expansion in capitalisation rates may be concluding
Internalisation progress
Securityholders approved implementation of the stapled security proposal at the EGM held on 4 November
2009
Normal trading of the stapled securities on the ASX commenced on 19 November 2009
Responsible Entity of Astro Japan Property Trust, Babcock & Brown Japan Property Management Limited, will
legally become part of AJA following closing of the March 2010 refinancing completing AJA‟s final separation
from the Babcock & Brown Group. Upon completion, the name of the Responsible Entity will be changed
7

Financial Results

FINANCIAL RESULTSSix months to
31 Dec 2009
Six months to
31 Dec 2008
Change
Net property income (¥) ¥ 3.5bn ¥ 4.1bn -15.6%
Net property income (A$) $43.6m1 $54.4m2 -19.9%
Net operating profit after income tax (A$) $26.7m1 $32.4m2 -17.7%
Net profit/(loss) after income tax (A$) $(35.1)m1 $(215.2)m2 nm
FFO (¥) ¥ 2.0bn ¥ 2.6bn -23.3%
FFO per security (¥) ¥3.92 ¥5.11 -23.3%
Distribution per security (A$) 3.50¢ 4.00¢ -12.5%
9
¹ Average exchange rate for period of A$1.00 = 79.80 ³ Exchange rate of A$1.00 = 83.15
² Average exchange rate for period of A$1.00 = 80.06 4 Exchange rate of A$1.00 = 78.01
• Net property income declined 15.6% on the prior corresponding period of which approximately 7.2% represents the impact of
the sale of Shinjuku Sanei in May 2009
• Excluding the sale of Shinjuku Sanei, net property income declined by approximately 8.4% on the prior corresponding period,
primarily due to a fall in office occupancy and office rental income
• Net loss after income tax includes non-cash items during 1H10 - property devaluations of A$73.5m and unrealised mark-to-
market gain on FX hedging contracts of A$11.3m - vs. A$125.5m of property devaluations and A$121.0m mark-to-market
hedging loss during 1H09
• FFO of ¥2.0bn (A$25.1m) was down ¥0.6bn (A$7.5m) relative to the prior corresponding period of which approximately
¥0.3bn (A$3.8m) represents the impact of the sale of Shinjuku Sanei
• NTA movement due to property revaluations (15c of change) and movement in A$/ ¥ exchange rate (2c of change)
31 Dec 2009 30 June 2009 Change
Total assets (A$) $1.6b3 $1.8b4 -11.1%
NTA per security (A$) $0.763 $0.934 -18.3%

MAIN COMPONENTS OF NET PROPERTY INCOME
DECLINE
10
• Rental income declined relative to the prior corresponding period reflecting the rise in office vacancies and a general
softening in market rents. Of the 8.9% decline in office rental income, Kokusai Nihombashi contributed 2.7%
• Occupancy levels declined relative to the prior corresponding period mainly due to a rise in office vacancies. Of the
14% decline in office occupancy levels, the vacancy of a sole tenanted office asset, Kokusai Nihombashi,
represented approximately 6% of the decline
• Occupancy in the retail segment has increased
Property revenue (¥ million)Six months to
31 Dec 2009
Six months to
31 Dec 2008
(ex. Shinjuku Sanei)
Change
Retail 2,300 2,542 -9.5%
Office 2,191 2,405 -8.9%
Residential 429 430 -0.2%
Total portfolio 4,920 5,377 -8.5%
Occupancy by area 31 Dec 200931 Dec 2008
(ex. Shinjuku Sanei)Change
Retail 97.6% 96.0% 1.7%
Office 79.1% 92.0% -14.0%
Residential 99.6% 99.8% -0.2%
Total portfolio 92.7% 95.3% -2.7%

OPERATING PERFORMANCE
11
36.0
46.3
54.4
43.6
0
10
20
30
40
50
60
Dec-06 Dec-07 Dec-08 Dec-09
A$
mil
lio
ns
Net Property Income
4.17
4.51
5.11
3.92
0.00
1.00
2.00
3.00
4.00
5.00
6.00
Dec-06 Dec-07 Dec-08 Dec-09
¥ p
er
secu
rity
FFO

NTA PER UNIT
Movement for half year ended 31 December 2009
12
*
0.02
0.76 0.05
0.14
0.93
$0.00
$0.20
$0.40
$0.60
$0.80
$1.00
$1.20
NTA at 30/6/09 Impacts of FX FV of cap & dist hedges Revaluation of properties Closing NTA at 31/12/09
NT
A p
er secu
rity
NTA movement - A$ per security
FX 78.10
FX83.15

NTA SENSITIVITIES
13
0.33
0.48
0.62
0.76
0.90
1.04
1.18
$0.00
$0.20
$0.40
$0.60
$0.80
$1.00
$1.20
$1.40
-15% -10% -5% 0% 5% 10% 15%
NT
A (
A$)
Property revaluations
NTA sensitivity to revaluations
1.030.95
0.890.83
0.76 0.74 0.710.67 0.64
$0.00
$0.20
$0.40
$0.60
$0.80
$1.00
$1.20
$1.40
60 65 70 75 83 85 90 95 100
NT
A (
A$)
A$:¥ exchange rate
NTA sensitivity to A$:¥ exchange rate
Portfolio Overview and Leasing Activity

PORTFOLIO OVERVIEW
31 Dec 2009 30 Jun 2009 Change
Portfolio value ¥119.5 bn ¥125.5 bn -4.8%
Total number of properties 43 43 0
NRA (sqm) 275,946 275,877 0.0%
Occupancy by area 92.7% 94.0% -1.4%
Number of leases 409 422 -13
% non-cancellable leases by income 45.4% 45.5% -0.2%
Weighted average term to expiry (WALE) (non-
cancellable leases) – years
6.2 years 6.7 years -0.5 years
15
• Occupancy remains healthy despite challenging economic conditions
• Proportion of non-cancellable leases remains high at 45%, bringing stability to AJA‟s portfolio income stream

LEASING ACTIVITY
16
Leasing Activity No. of leases % of NRA % of portfolio income¹
Expired / renewed leases
Expired leases (73) (3.7)% (7.7)%
Renewed leases 73 3.7% 7.5%
Net change due to renewals 0 0.0% (0.2)%
New / cancelled leases
Cancelled leases (41) (5.2)% (10.3)%
New leases 28 4.0% 3.3%
Net change due to new / cancelled leases (13) (1.2)% (7.0)%
Net increase / (decrease) in occupied area (13) (1.2)% (7.2)%
For half year ended 31 December 2009
• All 73 leases that expired during the period (equivalent to 7.7% of portfolio income) were renewed by their existing
tenants
• Kokusai Nihombashi represented 4.4% of the portfolio income decline due to cancelled leases
• 13 of 41 leases cancelled during the period have not yet been replaced (equivalent to 7.0% of portfolio income).
¹ Includes rent and Common Area Maintenance (CAM)

PORTFOLIO DIVERSIFICATION
17
Asset class diversification (by value) Geographic diversification (by value)
• Post property revaluations in December 2009:
- Retail increased to 47% from 46% at June 2009
- Office decreased to 44% from 46% at June 2009
- Residential increased marginally to 9% from 8% at June 2009
• Approximately 67% concentration of properties in Central and Greater Tokyo with asset and lease diversification
supporting stability of portfolio cashflows
Retail - 47% Office - 44% Residential - 9% Greater Tokyo - 41% Central Tokyo - 26% Greater Osaka - 22% Hokkaido - 4%
Okinawa - 2% Shizuoka - 2% Fukuoka - 2% Aichi - 1%

PROPERTY REVALUATIONS
• Fair value of all portfolio properties was independently reviewed at 31 December 2009
• All valuers used are also used by J-REITs
• Only 15 properties were required to be revalued as at 31 December 2009 (compared to all 43 as at 30
June 2009)
• Over the half year period, AJA‟s portfolio was devalued by 4.8% to ¥119.5bn (A$1.4bn)
• Devaluation for the period ended 31 December 2009 was ¥6.1 billion compared to 30 June 2009
devaluation of ¥19.2 billion, the latter reflecting full impact of „Lehman shock‟
• Weighted average capitalisation rate used by valuers for the portfolio moved from 5.5% (30 June 2009) to
5.6% (31 December 2009)
• Rate of increase in capitalisation rates appears to have slowed significantly since June 2009. Cyclical
expansion in capitalisation rates may be concluding
18
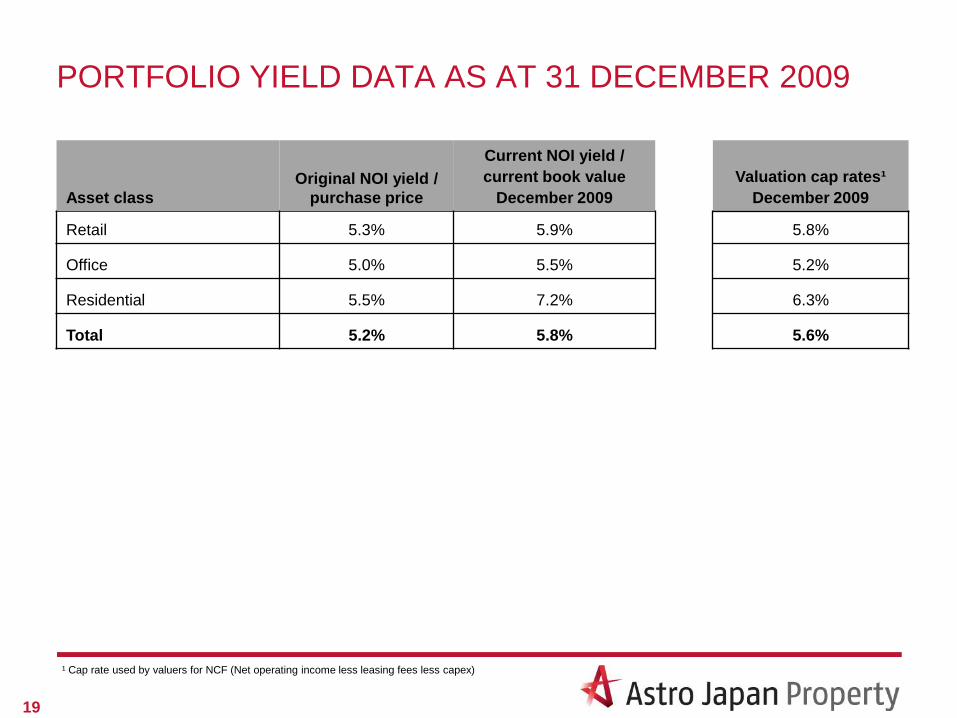
PORTFOLIO YIELD DATA AS AT 31 DECEMBER 2009
Asset class
Original NOI yield /
purchase price
Current NOI yield /
current book value
December 2009
Valuation cap rates¹
December 2009
Retail 5.3% 5.9% 5.8%
Office 5.0% 5.5% 5.2%
Residential 5.5% 7.2% 6.3%
Total 5.2% 5.8% 5.6%
19
¹ Cap rate used by valuers for NCF (Net operating income less leasing fees less capex)

Debt and FX Hedging

• Total AJA debt is 5 separate, non-recourse, asset-specific loans, all borrowed in ¥ in Japan, primarily from Japanese
lenders
• No cross-collateralization or cross-default between loans
• None of the loans contain covenants which take into account FX hedging mark-to-market
• 57% of debt hedged to fixed interest rates for weighted average term of 2.6 years post March 2010 refinancing
• Portfolio DSCR of 3.5x
21
Debt Maturity Profile (¥bn)
DEBT OVERVIEW AND MATURITY PROFILE
18.0
15.5
18.8
21.1
13.4
0.0
5.0
10.0
15.0
20.0
25.0
Dec-09 Jun-10 Dec-10 Jun-11 Dec-11 Jun-12 Dec-12 Jun-13 Dec-13 Jun-14 Dec-14 Jun-15
¥ b
n
New 5 year loan replacing
loan maturing in Mar 2010

• Definitive term sheet signed for a new, 5-year senior, non-recourse loan of ¥13.4bn (c. A$160m)
• Loan will be used to refinance the five year term loan set to mature in March 2010, representing 16.3% of AJA‟s total
debt balance
• Favourable margin payable of 195 bps, all-in margin cost of approximately 237 bps
• Formal loan documentation currently being finalised with closing expected to take place in March 2010
• AJA intends to contribute additional equity of ¥900m (c. A$11m) from existing cash resources to reduce leverage
• Equity will be injected into JPT Co., Ltd., the Japanese special purpose company borrowing the new loan, and
represents the difference between the amount being debt financed and the loan maturing
• Equity to pay loan costs and expenses will also be paid from existing cash resources
• Gearing across AJA‟s entire portfolio will be 72.6% post refinancing and equity injection
22
MARCH 2010 REFINANCING
Key terms of new loan
Lender: A Japanese commercial bank
Term: 5 years
Amount: ¥13.4 bn
Interest Margin: 195 bps
LTV Covenant: None
DSCR Covenant: Cashflow not to fall below 1.28 times a theoretical loan payment constant of 6.5% p.a .
applied to the outstanding loan balance
Amortization: ¥11.8m per quarter until October 2011 and then ¥148.4m per quarter until loan maturity

DEBT COVENANTS
23
• The principal financial covenant under each loan is a DSCR test. Only one loan contains an LTV test
• Portfolio gearing ratio does not impact any loan terms or covenants
• AJA remains within all covenants for the half year period
• The only LTV covenant is 78%, contained in one specific loan. Constructive discussions are taking place with
the lender of this loan as to how best to deal with the proximity of the current LTV (77.8%) to the covenant
Loan
amount
(¥ bn)
AJA
value
Dec 09
(¥ bn)
No. of
properties
secured
LTV
covenant
test
LTV at
Dec 09
(%)
DSCR covenant
test¹
DSCR at
Dec 09 Maturity
Interest
rate²
(%)
JPTS 18.0 27.7 17 None 65.0% Actual: Over 1.6x
Stress: Over 1.2x
Actual: 5.4x
Stress: 1.3x
Dec 2010 1.6%
JPTD 15.5 18.3 9 None 84.5% Stress: Over 1.15x Stress: 1.5x May 2012 2.8%
JPTA 18.8 18.5 5 None 101.9% Stress: Over 1.1x Stress: 1.7x Aug 2012 2.7%
JPTC 21.1 27.1 3 LTV of less
than 78%
77.8% Actual: Over 1.5x
(on Kawasaki Dice
only)
Actual: 7.3x Dec 2012 1.2%
JPT 13.4 28.0 9 None 47.8% Stress: Over 1.28x N/A Mar 2015 2.2%
¹ Actual DSCR based on actual loan payment whereas Stress DSCR based on theoretical loan payment
constants
² Interest rate for 4 out of 5 of the loans includes a floating rate portion based on current 3 month JPY LIBOR
of 0.255%
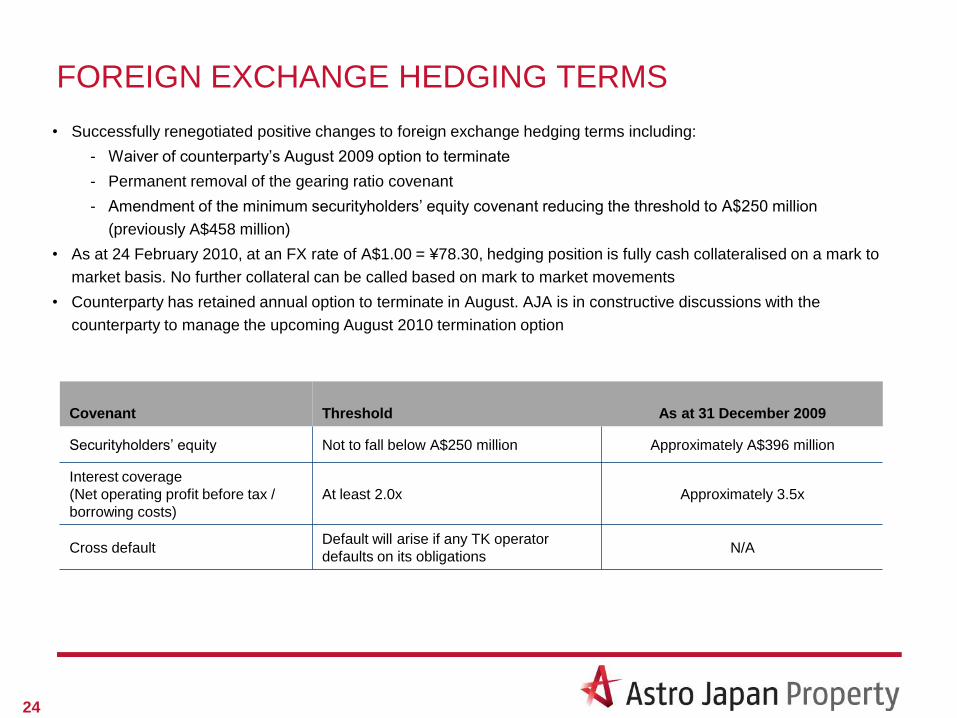
FOREIGN EXCHANGE HEDGING TERMS
• Successfully renegotiated positive changes to foreign exchange hedging terms including:
- Waiver of counterparty‟s August 2009 option to terminate
- Permanent removal of the gearing ratio covenant
- Amendment of the minimum securityholders‟ equity covenant reducing the threshold to A$250 million
(previously A$458 million)
• As at 24 February 2010, at an FX rate of A$1.00 = ¥78.30, hedging position is fully cash collateralised on a mark to
market basis. No further collateral can be called based on mark to market movements
• Counterparty has retained annual option to terminate in August. AJA is in constructive discussions with the
counterparty to manage the upcoming August 2010 termination option
24
Covenant Threshold As at 31 December 2009
Securityholders‟ equity Not to fall below A$250 million Approximately A$396 million
Interest coverage
(Net operating profit before tax /
borrowing costs)
At least 2.0x Approximately 3.5x
Cross defaultDefault will arise if any TK operator
defaults on its obligationsN/A

FOREIGN EXCHANGE HEDGING PROFILE
Capital Hedging
Settlement date
AJA receives
AUD
AJA pays
JPYExchange
rateInterest rate
spread
Aug 2011 14,724,649 1,500,000,000 101.9 6.19%
Aug 2012 20,614,509 2,100,000,000 101.9 6.01%
Aug 2013 16,687,936 1,700,000,000 101.9 5.86%
Aug 2014 22,577,795 2,300,000,000 101.9 5.69%
Aug 2015 24,541,082 2,500,000,000 101.9 5.52%
Aug 2016 14,724,649 1,500,000,000 101.9 5.39%
Distribution Hedging
Settlement dateExchange
rateJPY
Feb 2010 66.9 1,335,704,000
Aug 2010 68.8 1,339,291,000
Feb 2011 68.0 1,339,291,000
25
• Approximately 23.5% of net investment in Japanese properties
is hedged
• As at 31 December 2009, capital hedges were A$34.9m out-
of-the money (excluding collateral of ¥2.4bn) and distribution
hedges were A$6m in-the-money based on A$1.00 = ¥83.15
Events since 31 December 2009

PARTICIPATION IN ACQUISITION OF JOINT CAPITAL
PARTNERS
• AJA, through its 30% economic interest in its Japan asset manager, Spring Investment Co (Spring), will
participate in the acquisition of J-REIT management company, Joint Capital Partners (JCP)
• Spring is acquiring JCP in joint venture with Sekisui House Ltd, one of Japan‟s largest home builders
- Spring will take a 25% interest in the JV and Sekisui House will take a 75% interest
• JCP is the manager of Joint REIT, a Tokyo Stock Exchange listed J-REIT
• Joint REIT owns 53, mainly residential, assets with a book value of approximately ¥100 bn (A$1.25 bn)
• Details, including acquisition price, will remain confidential until the court administration of JCP‟s parent
company, Joint Corporation, is completed. The acquisition is expected to close in the first week of March
• AJA will contribute 30% of the capital to Spring‟s investment in JCP. The investment will have a minimal
impact on AJA‟s existing cash resources
• AJA‟s involvement marks the first time an Australian real estate company has held an interest in J-REIT
management
• AJA‟s participation is reflective of the opportunities now provided by AJA‟s economic interest in Spring.
These opportunities are expected to provide long term benefits to securityholders
27
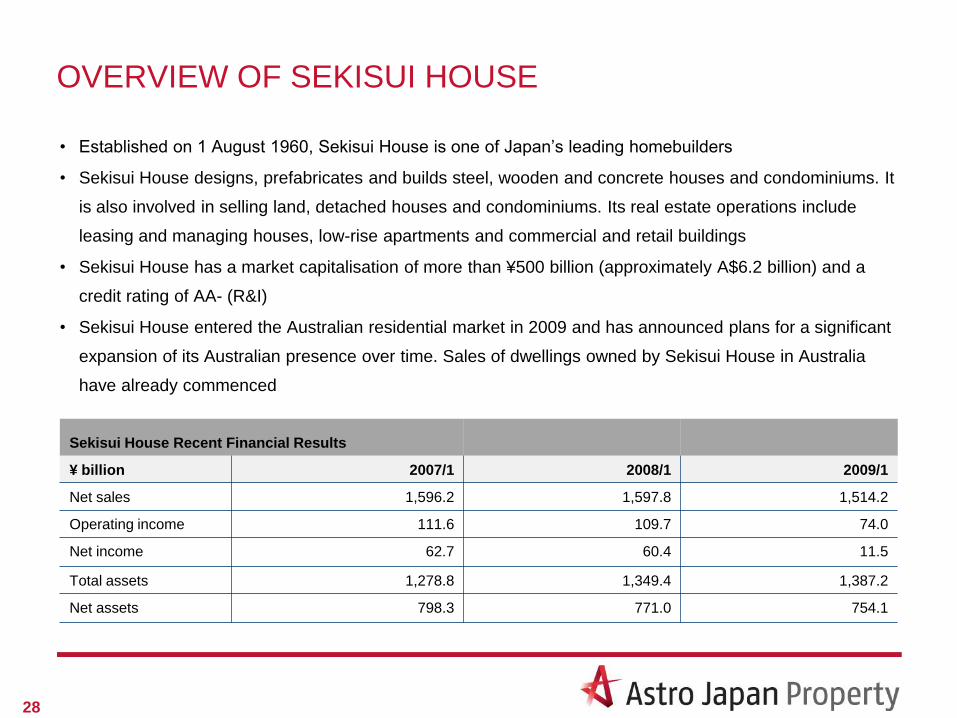
OVERVIEW OF SEKISUI HOUSE
• Established on 1 August 1960, Sekisui House is one of Japan‟s leading homebuilders
• Sekisui House designs, prefabricates and builds steel, wooden and concrete houses and condominiums. It
is also involved in selling land, detached houses and condominiums. Its real estate operations include
leasing and managing houses, low-rise apartments and commercial and retail buildings
• Sekisui House has a market capitalisation of more than ¥500 billion (approximately A$6.2 billion) and a
credit rating of AA- (R&I)
• Sekisui House entered the Australian residential market in 2009 and has announced plans for a significant
expansion of its Australian presence over time. Sales of dwellings owned by Sekisui House in Australia
have already commenced
28
Sekisui House Recent Financial Results
¥ billion 2007/1 2008/1 2009/1
Net sales 1,596.2 1,597.8 1,514.2
Operating income 111.6 109.7 74.0
Net income 62.7 60.4 11.5
Total assets 1,278.8 1,349.4 1,387.2
Net assets 798.3 771.0 754.1

Outlook

30
OUTLOOK
Operating outlook
• Downward pressure on rental market, particularly the office segment, will continue to weigh on operating cash flows
in 2H FY10
• However, the increase in vacancy rate for Tokyo Central five wards shows signs of slowing as it approaches high
single-digit peak levels of past downturns
• AJA portfolio stabilised by high – 45% – proportion of non-cancellable revenues, which are predominantly retail
• Board confirms FY10 distribution guidance of 7.00 cps
Debt refinancing
• Formal loan documentation for March 2010 refinancing currently being finalised with closing expected in March
• Discussions have commenced with current lender and other lender candidates regarding refinancing of loan
maturing in December 2010
• Continued focus on balance sheet de-risking
Structure
• Responsible Entity to become legally part of AJA following re-financing of March 2010 loan
Appendices

INCOME STATEMENT
32
31 Dec 2009 – $’000 31 Dec 2008 – $’000 31 Dec 2009 – ¥ ‘000 31 Dec 2008 – ¥’000
Net Property Income
Property revenue 61,728 75,534
(18,156) (21,104) (1,444,947) (1,653,484)
Net property income 43,572 54,430 3,474,803 4,121,545
Income from foreign currency capital hedge 3,090 3,719 265,644
Interest income 112 1,806 8,938 155,313
Other income 14 68 1,117 4,644
Total income 60,023 3,731,440 4,547,146
Expenses
Asset Management fee expense (5,071) (5,522) (404,666) (426,515)
Borrowing expense (11,961) (15,453) (954,488) (1,185,001)
Other expenses (1,762) (2,897) (140,607) (221,493)
Total Expenses (18,794) (23,872) (1,499,761) (1,833,009)
Net Operating Profit before withholding tax 36,151 2,231,679 2,714,137
Withholding tax (1,134) (3,744) (228,542)
Net Operating Profit after withholding tax 26,680 32,407 2,141,186 2,485,595
Non operating items
Net fair value adjustment of investment properties (73,501) (125,461) (5,865,380) (7,835,956)
Fair value gain on derivatives 11,318 (121,040) 903,176 (9,908,346)
Net foreign currency gain (2,602) 1,939 ( 207,640) 162,161
Gain/loss on disposal on assets
Withholding tax on disposal of investment properties
Deferred withholding tax (expense)/benefit 3,470 (1,320) 276,906 (80,588)
Unrealised loss on financial assets - (1,722) - (149,287)
Share of net profit / (loss) of Associate (607) (48,439)
Net non operating profit (61,922) (247,604) (4,941,377) (17,812,016)
Net AIRFS accounting profit (35,062) (2,800,191) (15,326,421)
5,775,029
-
4,919,750
246,582
Property expenses
(90,493)
- - -
-- -
-
-
-
46,788
27,994
(215,197)

BALANCE SHEET
33
31 Dec 2009 (A$'000) 30 Jun 2009 (A$'000) 31 Dec 2009 (¥'000) 30 Jun 2009 (¥'000)
Current Assets
Cash 82,321 120,617 6,844,991 9,409,332
Restricted cash1 55,284 40,428 4,596,865 3,153,788
Derivative financial instruments 8,744 6,093 727,064 475,315
Investment in convertible note 13,207 12,900 1,098,162 1,006,329
Investment property held for sale 46,422 3,859,989 4,429,408
Other assets 6,768 5,059 562,759 394,653
Total current assets 212,746 241,877 17,689,830 18,868,825Non-current assets
Property investments 1,390,772 1,551,177 115,642,692 121,007,318
Derivative financial assets - - - -
Deferred tax assets 17,433 19,062 1,449,554 1,487,027
Other assets 7,289 8,311 606,080 648,341
Total non-current assets 1,415,494 1,578,550 117,698,326 123,142,686
Total assets 1,628,240 1,820,427 135,388,156 142,011,510
Current liabilities
Payables 21,406 24,132 1,779,909 1,882,537
Tenant deposits 35,965 45,699 2,990,490 3,564,979
Interest bearing liabilities 387,241 226,725 32,199,089 17,686,817
Provision for distributions 17,787 25,411 1,478,989 1,982,312
Derivative financial liabilities 27,804 35,002 2,311,903 2,730,506
Current tax liability 1,135 7,239 94,375 564,714
Total current liabilities 491,338 364,208 40,854,755 28,411,866
Non-current liabilities
Payables - - - -
Tenant deposits 55,087 58,720 4,580,484 4,580,747
Interest bearing liabilities 661,205 889,439 54,979,196 69,385,136
Derivative financial liabilities 17,840 17,295 1,483,396 1,349,183
Deferred tax liability 6,558 8,829 545,298 688,750
Total non-current liabilities 740,690 974,283 76,003,817
Total liabilities 1,232,028 1,338,491 102,443,129 104,415,683
Net assets 396,212 481,936 32,945,027 37,595,827
Net tangible assets per unit 0.76 0.93
Gearing ratio (interest bearing debt/property value) 72.9% 69.4%
1 Restricted cash consits of cash in trust (e.g. tenant security deposits) and lender reserves (e.g. cash required under loan agreements for items such as capex and repairs).
61,588,374
56,780

PORTFOLIO SNAPSHOT AS AT 31 DECEMBER 2009
34
Retail Office Residential Portfolio
31-Dec-09 30-Jun-09 31-Dec-09 30-Jun-09 31-Dec-09 30-Jun-09 31-Dec-09 30-Jun-09
Number of properties 18 18 20 20 5 5 43 43
Carrying value (¥ bn) 55.9 57.3 52.9 57.3 10.6 10.9 119.5 125.5
Net Rentable Area (tsubo) 51,565 51,543 23,345 23,345 8,569 8,569 83,478 83,457
Net Rentable Area (sqm) 170,449 170,379 77,167 77,168 28,330 28,330 275,946 275,877
% of portfolio by value 46.8% 45.7% 44.3% 45.7% 8.9% 8.6% 100.0% 100.0%
% of portfolio by area 61.8% 61.8% 28.0% 28.0% 10.3% 10.2% 100.0% 100.0%
Number of leases 111 108 230 241 68 73 409 422
Occupancy by area 97.6% 95.2% 79.1% 89.0% 99.6% 99.9% 92.7% 94.0%

PORTFOLIO SNAPSHOT AS AT 31 DECEMBER 2009
35
Carrying value Occupancy by area
31/12/2009
¥ billions % of portfolio Dec-09 Jun-09
Retail 55.9 46.8% 97.6% 95.2%
Office 52.9 44.3% 79.1% 89.0%
Residential 10.6 8.9% 99.6% 99.9%
Portfolio 119.5 100.0% 92.7% 94.0%
RETAIL
Kawasaki Dice 12.3 10.3% 99.3% 98.2%
Konan Home Centre 10.5 8.8% 100.0% 100.0%
Shinjuku Fuji 4.5 3.8% 100.0% 100.0%
Mukomachi Saty 4.2 3.5% 100.0% 100.0%
Shibuya Konami 2.4 2.0% 100.0% 100.0%
Ginowan 2.3 1.9% 67.4% 45.1%
Motomachi 2.3 1.9% 100.0% 100.0%
Susono 2.3 1.9% 100.0% 100.0%
Matsudo Nitori 2.2 1.8% 100.0% 100.0%
Tsudanuma 2.0 1.6% 100.0% 100.0%
Sapporo Co-op 1.9 1.6% 100.0% 100.0%
Sapporo Ai 1.7 1.4% 100.0% 100.0%
Harajuku Bell Pier 1.6 1.3% 85.5% 79.3%
Sapporo Toys R Us 1.6 1.3% 100.0% 100.0%
Round One Amagasaki 1.3 1.1% 100.0% 100.0%
Round One Nara 1.0 0.9% 100.0% 100.0%
Yoshikawa 1.0 0.8% 98.9% 86.0%
Kajicho Ekimae 0.9 0.8% 79.2% 79.2%
Retail sub total / average 55.9 46.8% 97.6% 95.2%

PORTFOLIO SNAPSHOT AS AT 31 DECEMBER 2009
(cont‟d)
36
Carrying value Occupancy by area
31/12/2009
¥ billions % of portfolio Dec-09 Jun-09
OFFICE
JN 9.6 8.0% 81.9% 100.0%
Osaka No. 4 9.4 7.9% 94.9% 97.0%
Ginza Dowa 8.0 6.7% 83.6% 84.9%
Osaka No. 3 4.0 3.4% 83.0% 86.0%
Kokusai Nihombashi 3.9 3.2% 0.0% 100.0%
Yamashitachio 2.7 2.2% 100.0% 87.9%
Higashi Totsuka 2.0 1.6% 87.3% 87.3%
Takadanobaba 1.7 1.4% 79.4% 79.4%
Forest Kita Aoyama 1.6 1.4% 100.0% 100.0%
Sun Ace Tokugawa 1.4 1.2% 49.6% 58.5%
OS Tsukiji 1.4 1.2% 86.5% 100.0%
Prime Kanda 1.2 1.0% 71.4% 85.7%
Asakusa 1.2 1.0% 100.0% 100.0%
Prime Tsukiji 0.9 0.8% 71.4% 71.4%
Shiba Daimon 0.9 0.7% 28.7% 62.9%
Daikanyama Takara 0.7 0.6% 75.8% 100.0%
Yotsuya KD 0.7 0.6% 92.6% 79.1%
Akabane 0.7 0.6% 100.0% 100.0%
FT Nihombashi 0.6 0.5% 83.3% 83.3%
Sun No. 5 0.4 0.4% 100.0% 100.0%
Office sub total / average 52.9 44.3% 79.1% 89.0%
RESIDENTIAL
Tosabori 5.2 4.3% 100.0% 100.0%
Sekijomachi 2.7 2.2% 100.0% 100.0%
G-Clef Kamata 1.6 1.4% 100.0% 100.0%
Prime Stay Tsukiji 0.7 0.6% 90.1% 97.2%
Nishi-Kasai 0.5 0.4% 100.0% 100.0%
Residential sub total / average 10.6 8.9% 99.6% 99.9%
Total / average 119.5 100.0% 92.7% 94.0%
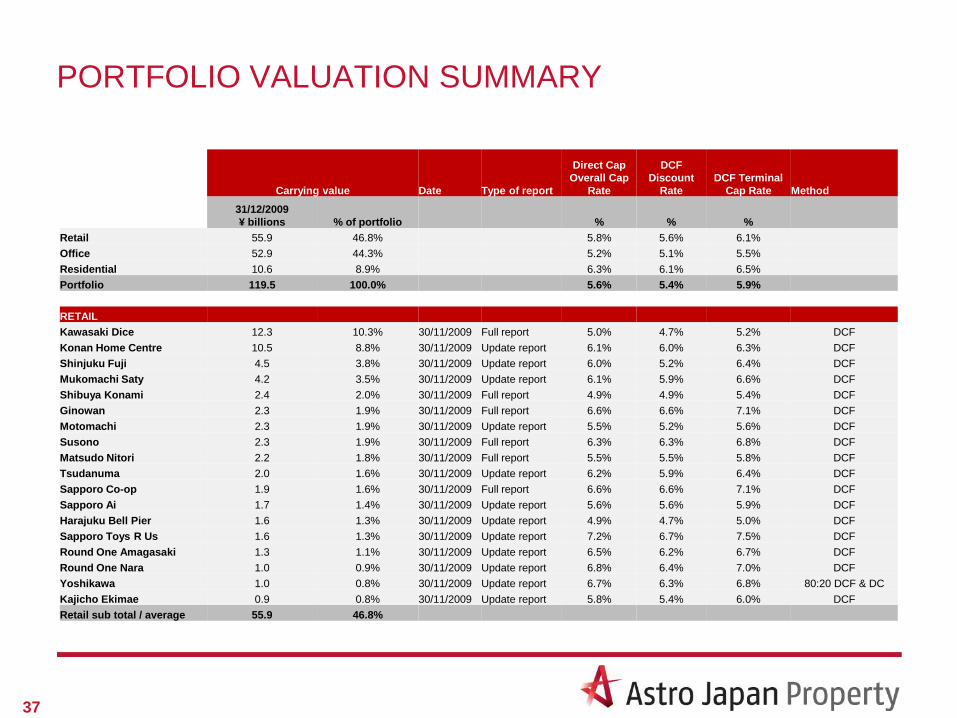
PORTFOLIO VALUATION SUMMARY
37
Carrying value Date Type of report
Direct Cap
Overall Cap
Rate
DCF
Discount
Rate
DCF Terminal
Cap Rate Method
31/12/2009
¥ billions % of portfolio % % %
Retail 55.9 46.8% 5.8% 5.6% 6.1%
Office 52.9 44.3% 5.2% 5.1% 5.5%
Residential 10.6 8.9% 6.3% 6.1% 6.5%
Portfolio 119.5 100.0% 5.6% 5.4% 5.9%
RETAIL
Kawasaki Dice 12.3 10.3% 30/11/2009 Full report 5.0% 4.7% 5.2% DCF
Konan Home Centre 10.5 8.8% 30/11/2009 Update report 6.1% 6.0% 6.3% DCF
Shinjuku Fuji 4.5 3.8% 30/11/2009 Update report 6.0% 5.2% 6.4% DCF
Mukomachi Saty 4.2 3.5% 30/11/2009 Update report 6.1% 5.9% 6.6% DCF
Shibuya Konami 2.4 2.0% 30/11/2009 Full report 4.9% 4.9% 5.4% DCF
Ginowan 2.3 1.9% 30/11/2009 Full report 6.6% 6.6% 7.1% DCF
Motomachi 2.3 1.9% 30/11/2009 Update report 5.5% 5.2% 5.6% DCF
Susono 2.3 1.9% 30/11/2009 Full report 6.3% 6.3% 6.8% DCF
Matsudo Nitori 2.2 1.8% 30/11/2009 Full report 5.5% 5.5% 5.8% DCF
Tsudanuma 2.0 1.6% 30/11/2009 Update report 6.2% 5.9% 6.4% DCF
Sapporo Co-op 1.9 1.6% 30/11/2009 Full report 6.6% 6.6% 7.1% DCF
Sapporo Ai 1.7 1.4% 30/11/2009 Update report 5.6% 5.6% 5.9% DCF
Harajuku Bell Pier 1.6 1.3% 30/11/2009 Update report 4.9% 4.7% 5.0% DCF
Sapporo Toys R Us 1.6 1.3% 30/11/2009 Update report 7.2% 6.7% 7.5% DCF
Round One Amagasaki 1.3 1.1% 30/11/2009 Update report 6.5% 6.2% 6.7% DCF
Round One Nara 1.0 0.9% 30/11/2009 Update report 6.8% 6.4% 7.0% DCF
Yoshikawa 1.0 0.8% 30/11/2009 Update report 6.7% 6.3% 6.8% 80:20 DCF & DC
Kajicho Ekimae 0.9 0.8% 30/11/2009 Update report 5.8% 5.4% 6.0% DCF
Retail sub total / average 55.9 46.8%

PORTFOLIO VALUATION SUMMARY (cont‟d)
38
Carrying value Date Type of report
Direct Cap
Overall Cap
Rate
DCF
Discount
Rate
DCF Terminal
Cap Rate Method
31/12/2009
¥ billions % of portfolio % % %
OFFICE
JN 9.6 8.0% 30/11/2009 Full report 4.9% 4.9% 5.2% DCF
Osaka No. 4 9.4 7.9% 30/11/2009 Update report 4.9% 4.9% 5.4% DCF
Ginza Dowa 8.0 6.7% 30/11/2009 Update report 4.9% 4.7% 5.1% DCF
Osaka No. 3 4.0 3.4% 30/11/2009 Update report 5.0% 5.0% 5.5% DCF
Kokusai Nihombashi 3.9 3.2% 30/11/2009 Update report 5.2% 4.8% 5.2% DCF
Yamashitachio 2.7 2.2% 30/11/2009 Update report 5.5% 5.5% 5.7% DCF
Higashi Totsuka 2.0 1.6% 30/11/2009 Update report 5.7% 6.2% 6.8% DCF
Takadanobaba 1.7 1.4% 30/11/2009 Update report 5.3% 5.3% 5.8% DCF
Forest Kita Aoyama 1.6 1.4% 30/11/2009 Update report 4.7% 4.7% 4.9% DCF
Sun Ace Tokugawa 1.4 1.2% 30/11/2009 Update report 7.3% 6.7% 7.3% DCF
OS Tsukiji 1.4 1.2% 30/11/2009 Update report 5.6% 5.4% 5.7% DCF
Prime Kanda 1.2 1.0% 30/11/2009 Update report 5.6% 5.5% 5.8% DCF
Asakusa 1.2 1.0% 30/11/2009 Update report 5.9% 5.5% 6.0% DCF
Prime Tsukiji 0.9 0.8% 30/11/2009 Update report 5.7% 5.5% 5.8% DCF
Shiba Daimon 0.9 0.7% 30/11/2009 Update report 5.5% 5.2% 5.6% DCF
Daikanyama Takara 0.7 0.6% 30/11/2009 Update report 5.6% 5.5% 5.8% DCF
Yotsuya KD 0.7 0.6% 30/11/2009 Update report 5.7% 5.4% 5.8% DCF
Akabane 0.7 0.6% 30/11/2009 Update report 5.9% 5.5% 5.9% DCF
FT Nihombashi 0.6 0.5% 30/11/2009 Update report 6.0% 5.6% 6.1% DCF
Sun No. 5 0.4 0.4% 30/11/2009 Update report 6.0% 5.6% 6.1% DCF
Office sub total / average 52.9 44.3%
RESIDENTIAL
Tosabori 5.2 4.3% 30/11/2009 Full report 6.4% 6.3% 6.6% DCF
Sekijomachi 2.7 2.2% 30/11/2009 Update report 6.1% 6.1% 6.5% DCF
G-Clef Kamata 1.6 1.4% 30/11/2009 Update report 6.0% 5.5% 6.3% DCF
Prime Stay Tsukiji 0.7 0.6% 30/11/2009 Update report 6.3% 6.1% 6.5% DCF
Nishi-Kasai 0.5 0.4% 30/11/2009 Update report 6.8% 6.1% 7.1% DCF
Residential sub total /
average 10.6 8.9%
Total / average 119.5 100.0%