Embed Size (px)
Citation preview

Airway reopening through catastrophic events ina hierarchical networkMichael Baudoina,b, Yu Songa, Paul Mannevillea, and Charles N. Barouda,1
aLaboratoire d’Hydrodynamique (LadHyX) and Department of Mechanics, École Polytechnique, Centre National de la Recherche Scientifique (CNRS),91128 Palaiseau, France; and bInstitut d’Electronique de Microélectronique et de Nanotechnologie (IEMN), Université des Sciences et Technologiesde Lille, UMR CNRS 8520, 59652 Villeneuve d’Ascq, France
Edited by William R. Schowalter, Princeton University, Princeton, NJ, and approved November 27, 2012 (received for review July 9, 2012)
When you reach with your straw for the final drops of a milkshake,the liquid forms a train of plugs that flow slowly initially because ofthe highviscosity. They then suddenly rupture and are replacedwitha rapid airflow with the characteristic slurping sound. Trains ofliquid plugs also areobserved in complexgeometries, suchas porousmedia duringpetroleumextraction, inmicrofluidic two-phaseflows,or in flows in the pulmonary airway tree under pathological con-ditions. The dynamics of rupture events in these geometries play thedominant role in the spatial distribution of the flow and in de-termining how much of the medium remains occluded. Here weshow that the flow of a train of plugs in a straight channel is alwaysunstable to breaking through a cascade of ruptures. Collectiveeffects considerably modify the rupture dynamics of plug trains:Interactions among nearest neighbors take place through thewetting films and slow down the cascade, whereas global inter-actions, through the total resistance to flow of the train, acceleratethe dynamics after each plug rupture. In a branching tree ofmicrochannels, similar cascades occur along paths that connect theinput to a particular output. This divides the initial tree into severalindependent subnetworks,which then evolve independently of oneanother. The spatiotemporal distribution of the cascades is random,owing to strong sensitivity to the plug divisions at the bifurcations.
microfluidics | respiratory flow
The motion of liquid plugs through a connected network ofchannels may involve many degrees of freedom evolving via
a similarly large number of interactions: each immiscible interfaceintroduces a degree of freedom into the problem owing to itsability to deform and to move, whereas each connecting branchbetween different areas introduces an interaction path that allowsthe flow in one region to influence the behavior in other areas ofthe network. The resulting flow pattern determines, among otherthings, how water or oil is extracted from porous media (1–3), theimbibition of paper (4, 5), and the stability of flow in a microfluidicdevice (6, 7).Liquid–gas two-phase flows also occur in the pulmonary airway
tree, which is constantly coated with a thin liquid film. When thethickness of this film increases beyond some limit, plugs of liquidmay form (8, 9) and therefore occlude the flow of air to the distalbranches. Evidence of such behavior has been observed in pa-thologies ranging from asthma (10, 11) to cystic fibrosis (12).Furthermore, liquid plugsmay be used asmeans to deliver medicaltreatment into the lung, e.g., in surfactant replacement therapy(13), and these plugs were observed to go through complex divi-sions, breaking and reforming before reaching their intendedtarget (14).The structure of the lung as a branching binary tree has moti-
vated many studies on the motion of gas–liquid flows into bi-furcating channels (15–20), with numerical work also taking intoaccount the elasticity of the pulmonary walls, (e.g refs. 21 and 22).However, nearly all the model experiments and simulations haveconsidered the simplest situations, either studying the motion of asingle liquid plug or gas finger or concentrating on the flowthrough a single bifurcation, or both. This reduces the number of
independent degrees of freedom and, by the same token, the rangeof behaviors those models can explore.These studies therefore cannot account for complex interactions
that involve many levels in the tree, which are observed in the reallung. Indeed, experiments on animal lungs have shown that mul-tilevel interactions are primordial during the reinflation of a col-lapsed lung. Alencar et al. (23, 24) reported that reopening takesplace through an avalanche of events in which distinct regions arereopened in nearly singular bursts. However, ex vivo observationsof the spatial behavior during reinflation are prohibitively complex,therefore limiting the comparison between the experiments and thetheoretical models to measurements at the root of the tree (25).Here we study the flow and rupture of liquid plugs that initially
occludemicrofluidic channels, as they are submitted to an imposedpressure head. Our experiments are conducted in microfluidicsystems consisting of a straight channel or a branching network ofchannels, formed in a polydimethylsiloxane (PDMS) substrateusing conventional soft lithography techniques. We show that thedynamics of a train of plugs differ from those of a single occlusionbecause the plugs interact via both short- and long-range mecha-nisms. The physics underlying plug interactions are first deducedfrom the reopening of a single straight channel, by comparingexperimental measurements with the results of a one-dimensionalanalytical model. Experiments in a branching tree are then per-formed, showing the existence of cascades of ruptures that occuralong well-defined paths through purely hydrodynamic effects.
Collective Behavior of Plugs in a Straight ChannelSingle-Plug Behavior. When a single plug of length L0 is pushed atconstant pressure in a channel of width w and height h, it rapidlyreaches a velocity V0 that depends on its initial resistance to flow.In its wake, it leaves a liquid film that remains at rest on thechannel wall. This implies a shortening of the plug, which ruptureswhen its length LðtÞ reaches zero. The airway then is opened in thesense that the flow of air becomes limited only by the viscous re-sistance of the gas. An example of such behavior is shown in Fig. 1,which displays snapshots of the experiment, taken at constant timeintervals (see also Movie S1). The positions of the rear and frontinterfaces in each frame are located and interpolated to form twocurves whose horizontal distance gives the length LðtÞ of the plug.The velocity V ðtÞ is given by the slope of the curve for the rearinterface. In this experiment, the velocity of the plug varies from 3cm/s when the pressure head is applied to 28 cm/s when the plugruptures. This acceleration generates an increase of the thicknessof the liquid film left behind the plug and a subsequent rapid de-crease of its length, leading to rupture after 24 ms.
Author contributions: M.B., P.M., and C.N.B. designed research; M.B. and Y.S. performedresearch; M.B. and C.N.B. analyzed data; and M.B., P.M., and C.N.B. wrote the paper.
The authors declare no conflict of interest.
This article is a PNAS Direct Submission.1To whom correspondence should be addressed. E-mail: [email protected].
This article contains supporting information online at www.pnas.org/lookup/suppl/doi:10.1073/pnas.1211706110/-/DCSupplemental.
www.pnas.org/cgi/doi/10.1073/pnas.1211706110 PNAS | January 15, 2013 | vol. 110 | no. 3 | 859–864
APP
LIED
PHYS
ICAL
SCIENCE
S

The dynamics of this plug can be understood by introducing anOhm-like law for the pressure vs. velocity (18, 26),ΔP=RV , whereΔP is the pressure head. The velocity V of the rear interface is ameasure of the flow rate, and R is the resistance due to the pres-ence of the liquid in the channel. This resistance is the sum ofcapillary contributions Rf and Rr of the front (“f”’) and rear (“r”)interfaces, and a bulk viscous resistance Rv. Resistances Rf and Rr
are a result of the deformation of the two interfaces from their restshape in response to the large velocity gradients in the corners ofthe moving liquid bridge, and they depend nonlinearly on V . Atlow capillary number Ca= μV=σ, where μ is the viscosity of theliquid and σ its surface tension, one gets Rf;r =Ff;rðh;wÞCa−1=3.The explicit expressions of Ff and Fr are obtained, respectively,from the Hoffman–Tanner law (27, 28) and the Bretherton law(29) adapted to rectangular channels (30). In turn, the bulk re-sistance of a long-enough plug can be estimated by modeling theflow inside it as a Poiseuille flow in a rectangular channel:Rv ≈ 12μL=h2 for large aspect ratiow=h (31). The relation betweenpressure head and speed has been validated experimentally byOdy et al. (18).The model describing the plug dynamics is closed with an
equation for LðtÞ that accounts for the liquid left in the stationaryfilms on the sidewalls. Bretherton’s law (29) provides a way toestimate this thickness for flow at small Ca in circular tubes. Werely for this on the empirical law proposed byAussillous andQuéré(32) for circular tubes, as extended to channels of rectangularcross-section and larger Ca by de Lózar et al. (33), which we in-troduce in the mass balance equation for the liquid phase: LetS=wh be the area of the channel cross-section and Sr and Sf theareas of the lumens open to air behind the plug and ahead of it,respectively. During a time interval dt, the advancing plug absorbsa volume ðS− SfÞVdt at its front interface, where V is the velocity.The volume left behind is ðS− SrÞVdt and the variation of theplug’s volume is SdL, so the balance reads Sd
dt L= ½Sr − Sf �V .Whereas Sr is a function of V as recalled above, Sf reflects the
thickness of the film present ahead of the plug at the consideredtime. In particular, Sf ≡ S when the plug is moving along a drychannel. Details on the model, its derivation, and its numericalsimulation are given in SI Text.The dynamics of a single plug therefore may be understood with
the model ingredients described above: When the pressure ΔP isapplied, the plug startsmoving at a velocity fixed by its initial lengthand physical parameters. The length then progressively decreasesbecause of liquid deposition, thus lowering the viscous resistanceRv so that the plug accelerates. The interfacial resistance scales asV−1=3 and therefore also decreases, contributing further to thevelocity increase. Finally, when the length of the plug approacheszero, it ruptures. A similar behavior has been observed by Fujioka
et al. (34) through direct numerical simulations of the flow fieldinside a moving plug.
Multiple-Plug Behavior. The evolution of a set ofN = 5 plugs, forcedat constant pressure head 2 kPa, is depicted in the spatiotemporalgraph of Fig. 2A (see also Movie S2). The plugs are initially dis-tributed as shown in the top image and start advancing when thepressure head is applied at t= 0. Plugs are numbered from right toleft, beginning with the most advanced one. The distance dk be-tween the rear interface of plug k and the rear interface of plug k+ 1remains nearly constant because the air compressibility is negligibleat these pressures. As a consequence, all plugs move at the samevelocityV ðtÞ and the behavior of the plug trainmay be characterizedby a single capillary number, which is plotted in Fig. 2A, Right. Weobserve that Ca stays constant up until t ’ 180 ms, then increasesup to the time when plug 1 ruptures at t ’ 400 ms, then more ir-regularly until t ’ 630 ms (rupture of plug 2), and finally divergesaround t ’ 800 ms, when plugs 3–5 break nearly simultaneously.Examination of this cascade leads us to identify two plug in-
teraction mechanisms: Long range effects arise from the super-positions of resistances within the plug train, whereas short rangeinteractions take place between nearest neighbors via the wettingfilm. Indeed, plug k gains some fluid left behind by plug k− 1 andleaves some fluid, which is taken up by plug k+ 1. Because the filmthickness depends on the instantaneous capillary number (see SIText for discussion), the balance between the liquid intake anddeposition generates plug length variations when the two layershave different thicknesses. When the train of plugs is forced at aconstant velocity—for example, by using a syringe pump—thethickness of the liquid films between the plugs remains constant, sothe plugs (except plug 1) always lose asmuch liquid as they gain andthus keep their initial length. When the plugs are pushed at con-stant pressure, as in Fig. 2, their velocity changes, leading to
Liquid depositedon the walls
Front interface
Rear interface
0
4
8
12
16
20
24
Tim
e (ms)
0 1 2Position mm
Fig. 1. Spatiotemporal evolution of a single plug of initial lengthL0 = 740 μm pushed at constant pressure head 2 kPa. The montage is pro-duced by stacking snapshots of the channel taken every 4 ms on top of oneanother. The liquid appears bright and the air dark. The dashed lines showthe positions of the front and rear interfaces as functions of time.
Tim
e (s
)
0
0.2
0.4
0.6
0.8
Position (mm)0 5 10 15 20
Tim
e (s
)
Position (mm)0 5 10 15 200
0.2
0.4
0.6
0.8
Air
Experiments Liquid
Simulations
A
B
Fig. 2. Dynamics of a set of equally spaced monodisperse plugs. The initiallength of the plugs is Lk;0 = 800 μm, and the distance separating two adja-cent plugs is dk ’ 2 mm. The whole train is pushed at constant pressure head2.0 kPa. (A) Image corresponding to the experiment. (Upper) Initial plugconfiguration; liquid (air) appears light (dark) gray. (Lower) Spatiotemporaldiagram displaying the gray values along the center line of the channel asa function of time. Velocities and lengths of the plugs are obtained from theslopes of the boundaries and the distances between them, respectively. Thegray dashed line indicates the moment when the plugs reach the initialposition of their immediate predecessor. (Right) Capillary number of theplug train as a function of time. (B) Spatiotemporal diagram obtained nu-merically from the model for the same conditions as in A.
860 | www.pnas.org/cgi/doi/10.1073/pnas.1211706110 Baudoin et al.

variations in the film thickness. These variations couple back withthe resistance to flow and velocities in two ways, as discussed below.First, the resistance Rf associated with the displacement of the
front interface decreases as the thickness of the precursor filmincreases. This has been demonstrated experimentally (26) andjustified theoretically (35) for a single plug in a prewetted channel.In our experiment, the thickness of the film left behind a plug maydisplay large changes, as seen in Fig. 1, which generates resistancevariations for the following plug. In a train of plugs, the capillarynumber of a plug affects the next one with a delay equal to the timerequired to cover the distance that separates them. So when plug karrives at the position initially occupied by plug k− 1, it encountersa thicker film that decreases the resistance of its front interfaceand leads to an increase in velocity. This sudden acceleration isobserved at t ’ 180 ms, as marked by the dotted horizontal line inFig. 2A. The second way in which neighboring plugs interact is viathe mass balance. Like the lubrication effect, this takes place witha delay because the plugs are traveling at finite speed. Liquidexchange tends to lengthen the cascade duration because the fluidtaken up by a plug increases its length. The two short-range effectstherefore are antagonistic.Using an analogy with electrical circuits, the train of plugs
submitted to a constant pressure head ΔP may be viewed as a se-ries of resistors and the total resistance as the sum of the individualresistances. Therefore, rupture of plug k leads to long-range effectsbecause it corresponds to a sudden drop to zero of the corre-sponding resistance. Consequently, the speed of the remainingplugs suddenly increases, further hastening the deposition of thewetting film and inducing new ruptures. This catastrophic speed-ing-up is at the origin of the cascade observed in our experiments.It is easier to observe when the initial distribution of plugs is ir-regular and their size polydisperse. An example is shown in Fig. S1,in which a train of 10 plugs is pushed at constant pressure head (seealso Movie S3). The evolution of the train is dominated mainly byshort-range interactions until t= 300 ms (dotted line), when threeplugs break nearly simultaneously. The velocity of the remainingplugs then displays a large increase, and the subsequent rupturestake place within shorter and shorter time intervals, with all theremaining plugs broken between t ’ 320 ms and t ’ 370 ms. The
rapid variation of the velocity points to the finite-time singularitynature of the cascade.
Model and Simulations. Because at a given time all plugs move atthe same speed, interactions between plugs may be treated bygeneralizing the equation for a single plug to a series of plugs:ΔP=
PNk=1RkV , where Rk is the resistance ascribed to plug k.
The lubricating role of the wetting film thickness is taken intoaccount by expressing the front interface resistance Rf
k as a func-tion of the cross-sectional area Sðx; tÞ of the lumen open to airahead of plug k. This area is given by Sðxk +Lk; tÞ, which is de-termined by the history of the previous plugs k− 1, k− 2, . . . Thesurface in front of plug 1 is just Sðx> x1 +L1Þ=wh. The fluiddistribution in the channel then may be computed as a function oftime, once the conservation of liquid is expressed. For each plug,we get d
dt Lk = − ½1− SðxkÞ=Sðxk +LkÞ�V . The area SðxkÞ of thelumen behind plug k then serves as an input in the computationfor plug k+ 1. Plug rupture takes place when Lk = 0 and isaccounted for by setting Rk = 0. The positions of the plugs may beobtained by integrating the velocity V, as discussed in SI Text.The results of themodel are shown in the bottompanels of Fig. 2
(monodisperse) and in Fig. S1 (polydisperse). In both cases, themotion of the plugs and the order of plug ruptures are reproducedcorrectly. Quantitative predictions from themodel were comparedwith results from experiments with trains made of one to sevenplugs. Two quantities were measured: (i) the time tc required forcomplete reopening of the airway (all plugs have ruptured), called“cascade duration,” and (ii) the penetration lengthLc, which is thedistance between the initial position of plug 1 and its positionwhenit breaks, also indicating the necessary channel length for a cascadeto be observed. Results are presented in Fig. 3, in which eachsquare marks a single run. (The simulation derivation is supportedby Figs. S2–S6 and the physical parameters are listed in Tables S1and S2.)The solid line corresponds to the predictions obtained with the
full model, which takes into account all the processes describedabove. In contrast, the dash/dotted lines in Fig. 3 A and B show thepredictions when short-range effects are neglected, i.e., when the
1.5 2 2.5 3 3.52
4
6
8
10
12
Pressure (kPa)
Pen
etra
tion
leng
th (
mm
)
1.5 2 2.5 3 3.50
0.5
1
1.5
Pressure (kPa)
Cas
cade
dur
atio
n (s
)
1 2 3 4 5 6 70
5
10
15
20
25
Initial number of plugs
Pen
etra
tion
leng
th (
mm
)
1 2 3 4 5 6 70
1
2
3
Initial number of plugs
Cas
cade
dur
atio
n (s
)
BA
DC
Fig. 3. Evolution of the cascade duration (A and C) and the penetration length (B and D) as functions of the number of plugs (A and B) and applied pressure(C and D) for a set of monodisperse plugs of length 0.78 mm separated by 2.1 mm. In A and B, the pressure head is 2.0 kPa. Squares correspond toexperiments, solid lines to the full model, and dash/dotted curves to predictions from the model without plug interactions.
Baudoin et al. PNAS | January 15, 2013 | vol. 110 | no. 3 | 861
APP
LIED
PHYS
ICAL
SCIENCE
S
resistances of all plugs are just summed as if each of them werealone in the channel:ΔP=NRsV , withN the total number of plugsandRs the resistance of an isolated plug.When the interactions areneglected, the cascade duration and the penetration length aregrossly underestimated and the discrepancy increases with thenumber of plugs, stressing the role of liquid exchange betweenplugs. This shows that the interactions play a dominant role in thedynamics of the train, increasing the quantities of interest bya large factor. The experiments were repeated to measure thecascade duration and penetration length as functions of the im-posed pressure head; the results are shown in Fig. 3 C and D. Themodel agrees quantitatively with the experiments at low pressures,but discrepancies appear above 2.5 kPa. This departure is attrib-uted to the fact that the theoretical expressions used for interfaceresistances are valid only at low capillary numbers. Although in-dividual resistances are not sufficiently well estimated during thefastest part of the cascade, themodel still may serve as a good basisfor predicting the cascade duration and penetration lengths instraight rectangular channels.
Cascade of Plug Ruptures in a Bifurcating NetworkWhen considering an initially occluded tree structure, such as thepulmonary airway, the processes described above must be adaptedto account for geometric effects: the division of plugs at bifurca-tions and the interactions across different regions in the network(19). This has been studied in a series of reopening experimentsperformed by replacing the straight channel with a six-generationtree network, as shown in Fig. 4. The widths of the channels insuccessive generations are chosen according to the diameter ratioin Weibel’s symmetric model of the human lung (36), i.e., wi+1=wi = 2−1=3, where wi is the width of channels in generation i andw1 = 720 μm. The height of channels is 45 μm everywhere.The same protocol as for the straight channels is used. The ex-
periment begins by alternately injecting liquid and air into the rootchannel to form seven successive plugs that are distributed into thetree. Indeed, each plug splits into two daughters when it reachesa bifurcation in the branching tree, thus distributing the liquid intoall regions of the network (19, 20). Although the sequence ofpressures during the plug formation is computer controlled and keptunchanged for all runs, slight perturbations affect the plug divisionsat each run. The initial distributions therefore differ slightly fromone experiment to the next despite the network symmetry.
A typical experiment is shown in Fig. 4 (see also Movie S4).Once the initial plug distribution is installed (Fig. 4A), after waitingsufficient time to make sure the system is at rest, a high pressurehead (3.5–5.5 kPa) is applied at the root, whereas the exits of thenetwork are maintained at atmospheric pressure. The flow rate ineach path is determined by the pressure difference, which isequilibrated by the sum of the resistances through each branch ofthe path. The small differences in initial distribution of plugs leadto variations in flow rates among paths, which then are amplified asthe liquid plugs make their way in the network. Ultimately, onepath reopens through a cascade of plug ruptures (Fig. 4B).This first cascade is followed by several others, each opening
a different path, as shown in Fig. 4C, in which the numbers in-dicate the order in which cascades occur. The spatial distributionof the cascades is irregular; they may take place either in adjacentpaths (e.g., 3 and 4) or in well-separated paths (e.g., 4 and 5).Each cascade divides the network into independent subnetworksthat evolve separately from the rest.The pressure driving each subnetwork may be inferred by con-
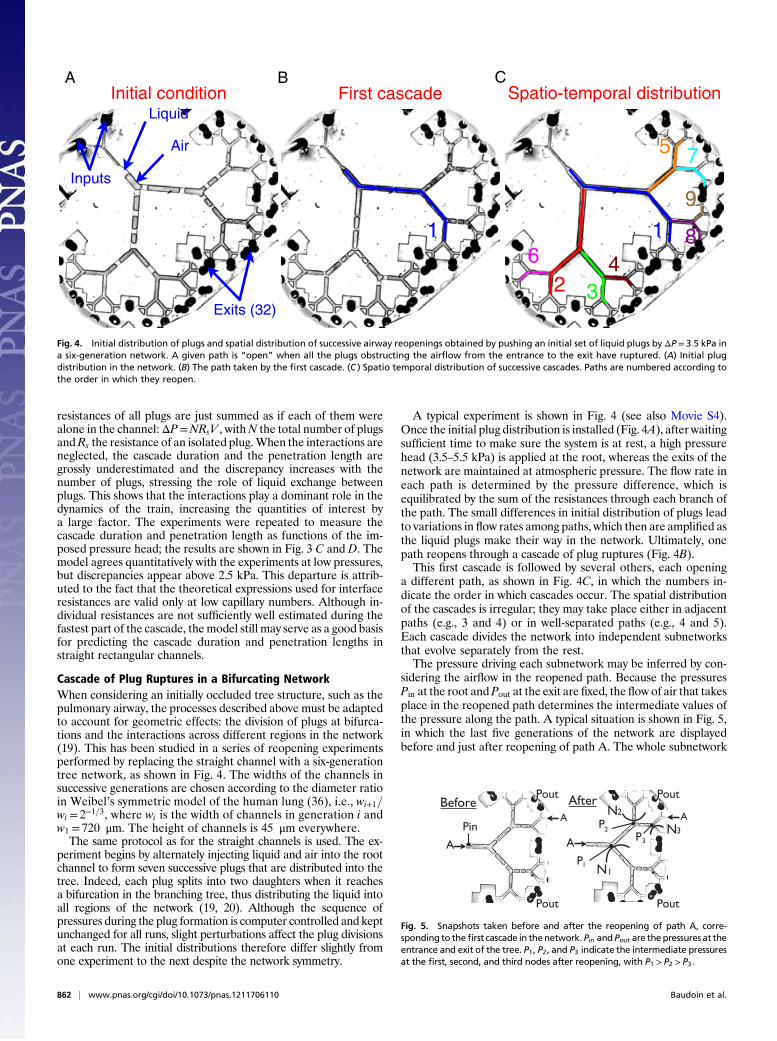
sidering the airflow in the reopened path. Because the pressuresPin at the root andPout at the exit are fixed, the flow of air that takesplace in the reopened path determines the intermediate values ofthe pressure along the path. A typical situation is shown in Fig. 5,in which the last five generations of the network are displayedbefore and just after reopening of path A. The whole subnetwork
Initial condition First cascade Spatio-temporal distribution
Inputs
Liquid
Air
Exits (32)
1 1
2 34
5
6
7
8
9
A B C
Fig. 4. Initial distribution of plugs and spatial distribution of successive airway reopenings obtained by pushing an initial set of liquid plugs by ΔP = 3:5 kPa ina six-generation network. A given path is “open” when all the plugs obstructing the airflow from the entrance to the exit have ruptured. (A) Initial plugdistribution in the network. (B) The path taken by the first cascade. (C ) Spatio temporal distribution of successive cascades. Paths are numbered according tothe order in which they reopen.
Before After
Pin
A
A
Pout
Pout
P1
P2P
Pout
Pout
3
N1
A
AN2
N3
Fig. 5. Snapshots taken before and after the reopening of path A, corre-sponding to thefirst cascade in thenetwork.Pin and Pout are the pressures at theentrance and exit of the tree. P1, P2, and P3 indicate the intermediate pressuresat the first, second, and third nodes after reopening, with P1 > P2 > P3.
862 | www.pnas.org/cgi/doi/10.1073/pnas.1211706110 Baudoin et al.
initially is driven at the common pressure Pin. However, once thecascade takes place along pathA, the tree gets separated into threesubnetworks, N1, N2, N3, driven at three intermediate values ofthe pressure, P1, P2, and P3. The smaller the subnetwork, thelower the pressure head driving it. On the other hand, the smallerthe subnetwork, the fewer plugs it contains, and hence the lowerthe resistance to flow. It therefore is not possible to predict thepath that will be followed by the next cascade.The readjustment of the driving pressure after each cascade
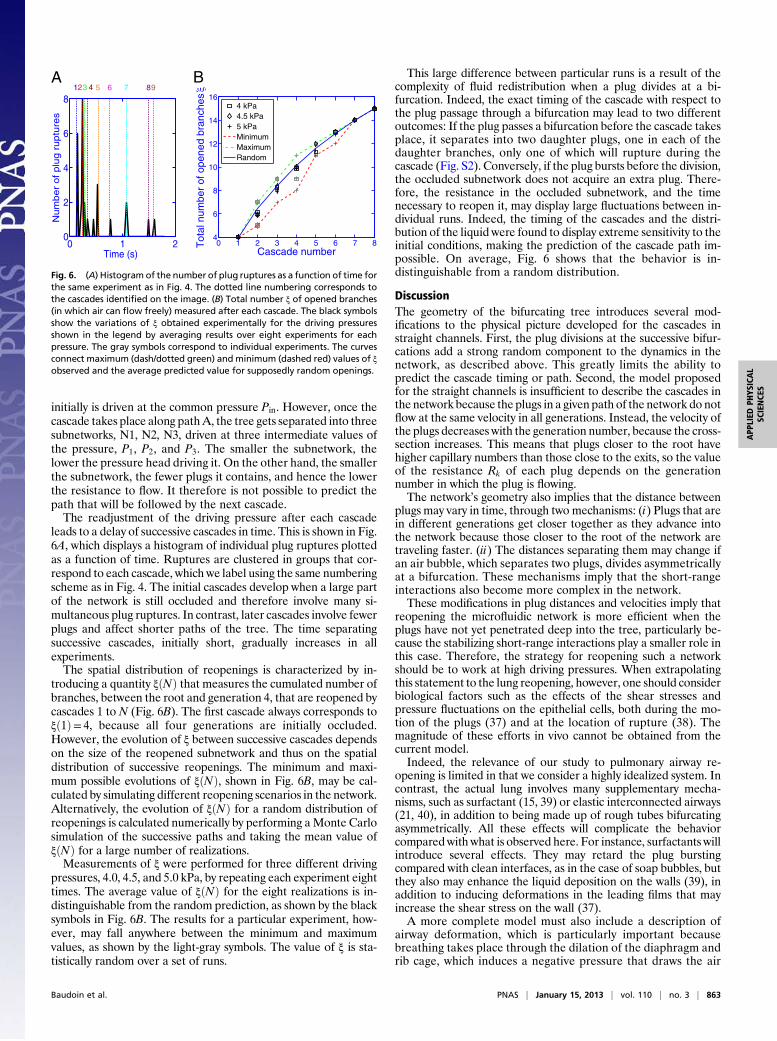
leads to a delay of successive cascades in time. This is shown in Fig.6A, which displays a histogram of individual plug ruptures plottedas a function of time. Ruptures are clustered in groups that cor-respond to each cascade, which we label using the same numberingscheme as in Fig. 4. The initial cascades develop when a large partof the network is still occluded and therefore involve many si-multaneous plug ruptures. In contrast, later cascades involve fewerplugs and affect shorter paths of the tree. The time separatingsuccessive cascades, initially short, gradually increases in allexperiments.The spatial distribution of reopenings is characterized by in-
troducing a quantity ξðNÞ that measures the cumulated number ofbranches, between the root and generation 4, that are reopened bycascades 1 to N (Fig. 6B). The first cascade always corresponds toξð1Þ= 4, because all four generations are initially occluded.However, the evolution of ξ between successive cascades dependson the size of the reopened subnetwork and thus on the spatialdistribution of successive reopenings. The minimum and maxi-mum possible evolutions of ξðNÞ, shown in Fig. 6B, may be cal-culated by simulating different reopening scenarios in the network.Alternatively, the evolution of ξðNÞ for a random distribution ofreopenings is calculated numerically by performing aMonte Carlosimulation of the successive paths and taking the mean value ofξðNÞ for a large number of realizations.Measurements of ξ were performed for three different driving
pressures, 4.0, 4.5, and 5.0 kPa, by repeating each experiment eighttimes. The average value of ξðNÞ for the eight realizations is in-distinguishable from the random prediction, as shown by the blacksymbols in Fig. 6B. The results for a particular experiment, how-ever, may fall anywhere between the minimum and maximumvalues, as shown by the light-gray symbols. The value of ξ is sta-tistically random over a set of runs.
This large difference between particular runs is a result of thecomplexity of fluid redistribution when a plug divides at a bi-furcation. Indeed, the exact timing of the cascade with respect tothe plug passage through a bifurcation may lead to two differentoutcomes: If the plug passes a bifurcation before the cascade takesplace, it separates into two daughter plugs, one in each of thedaughter branches, only one of which will rupture during thecascade (Fig. S2). Conversely, if the plug bursts before the division,the occluded subnetwork does not acquire an extra plug. There-fore, the resistance in the occluded subnetwork, and the timenecessary to reopen it, may display large fluctuations between in-dividual runs. Indeed, the timing of the cascades and the distri-bution of the liquid were found to display extreme sensitivity to theinitial conditions, making the prediction of the cascade path im-possible. On average, Fig. 6 shows that the behavior is in-distinguishable from a random distribution.
DiscussionThe geometry of the bifurcating tree introduces several mod-ifications to the physical picture developed for the cascades instraight channels. First, the plug divisions at the successive bifur-cations add a strong random component to the dynamics in thenetwork, as described above. This greatly limits the ability topredict the cascade timing or path. Second, the model proposedfor the straight channels is insufficient to describe the cascades inthe network because the plugs in a given path of the network do notflow at the same velocity in all generations. Instead, the velocity ofthe plugs decreases with the generation number, because the cross-section increases. This means that plugs closer to the root havehigher capillary numbers than those close to the exits, so the valueof the resistance Rk of each plug depends on the generationnumber in which the plug is flowing.The network’s geometry also implies that the distance between
plugs may vary in time, through two mechanisms: (i) Plugs that arein different generations get closer together as they advance intothe network because those closer to the root of the network aretraveling faster. (ii) The distances separating them may change ifan air bubble, which separates two plugs, divides asymmetricallyat a bifurcation. These mechanisms imply that the short-rangeinteractions also become more complex in the network.These modifications in plug distances and velocities imply that
reopening the microfluidic network is more efficient when theplugs have not yet penetrated deep into the tree, particularly be-cause the stabilizing short-range interactions play a smaller role inthis case. Therefore, the strategy for reopening such a networkshould be to work at high driving pressures. When extrapolatingthis statement to the lung reopening, however, one should considerbiological factors such as the effects of the shear stresses andpressure fluctuations on the epithelial cells, both during the mo-tion of the plugs (37) and at the location of rupture (38). Themagnitude of these efforts in vivo cannot be obtained from thecurrent model.Indeed, the relevance of our study to pulmonary airway re-
opening is limited in that we consider a highly idealized system. Incontrast, the actual lung involves many supplementary mecha-nisms, such as surfactant (15, 39) or elastic interconnected airways(21, 40), in addition to being made up of rough tubes bifurcatingasymmetrically. All these effects will complicate the behaviorcompared with what is observed here. For instance, surfactants willintroduce several effects. They may retard the plug burstingcompared with clean interfaces, as in the case of soap bubbles, butthey also may enhance the liquid deposition on the walls (39), inaddition to inducing deformations in the leading films that mayincrease the shear stress on the wall (37).A more complete model must also include a description of
airway deformation, which is particularly important becausebreathing takes place through the dilation of the diaphragm andrib cage, which induces a negative pressure that draws the air
0 1 20
2
4
6
8
Time (s)
Nu
mb
er
of
plu
g r
up
ture
s
123 4 5 6 7 89
0 1 2 3 4 5 6 7 84
6
8
10
12
14
16
Cascade number
Tot
al n
umbe
r of
ope
ned
bran
ches
4 kPa4.5 kPa5 kPaMinimumMaximumRandom
A B
Fig. 6. (A) Histogram of the number of plug ruptures as a function of time forthe same experiment as in Fig. 4. The dotted line numbering corresponds tothe cascades identified on the image. (B) Total number ξ of opened branches(in which air can flow freely) measured after each cascade. The black symbolsshow the variations of ξ obtained experimentally for the driving pressuresshown in the legend by averaging results over eight experiments for eachpressure. The gray symbols correspond to individual experiments. The curvesconnect maximum (dash/dotted green) and minimum (dashed red) values of ξobserved and the average predicted value for supposedly random openings.
Baudoin et al. PNAS | January 15, 2013 | vol. 110 | no. 3 | 863
APP
LIED
PHYS
ICAL
SCIENCE
S

into the lung. Because a plug’s length and resistance are coupledwith the cross-section of the tube containing it, an increase intube diameter will reduce the resistance to flow, leading to fastercascades.Nevertheless, our simple model has allowed us to identify some
basic mechanisms that will remain important in real pulmonaryflows. Indeed, the lung will still display the collective behavior thatwe have observed for a train of plugs, namely through local andglobal interactions, and the choice of a particular path in thenetwork for each cascade. Only the quantitative details will bemodified as more ingredients are added to the airway model butnot the qualitative behavior.
Materials and MethodsMicrofluidics and Observations. The microfluidic devices are prepared usingdry-film soft lithography techniques (41). The channels are etched in PDMSand bonded on a PDMS-covered glass slide. Perfluorodecalin is used as theworking fluid because of its good wetting properties (contact angle 23∘ withPDMS) and its compatibility with PDMS (42). The pressure at the networkinlet and driving the liquid is imposed using a Fluigent MFCS-8C controller,
which is programmed to achieve specific pressure sequences. The observationsare performed through a stereomicroscope using a fast camera (PhotronFastcam 1024) filming at 1,000 frames per second. The image sequences thenare analyzed using MatLab and ImageJ.
Experimental Protocol. A train of liquid plugs is created inside the channelsby alternately pushing liquid and air slowly through a Y-junction (18). TheY-junction then leads to the experimental region, which consists of eithera straight channel (rectangular cross-section of width w =700 μm andheight h= 55 μm) or a branching network. Once the plugs are created andplaced, the pressure is set to zero for a few seconds to achieve a stationaryinitial condition, after which a constant pressure head ΔP is applied at thechannel entrance of the channel. More details are given in SI Materialsand Methods.
ACKNOWLEDGMENTS. The authors thank Tim Pedley for a careful reading ofand comments on the manuscript. C.B. acknowledges early discussions of thiswork with Jihad Touma. This work was funded by the Agence Nationale deRecherche under the “Transport et Transfert via le Système PulmonaireHumain” project (M.B.). The Fluigent corporation generously lent us theMFCS-8C pressure source.
1. Lenormand R, Zarcone C, Sarr A (1983) Mechanisms of the displacement of one fluidby another in a network of capillary ducts. J Fluid Mech 135:337–353.
2. Dias MM, Payatakes AC (1986) Network models for two-phase flow in porous mediaPart 1. Immiscible microdisplacement of non-wetting fluids. J Fluid Mech 164:305–336.
3. Stark J, Manga M (2000) The motion of long bubbles in a network of tubes. TranspPorous Media 40:201–218.
4. Davis SH, Hocking LM (1999) Spreading and imbibition of viscous liquid on a porousbase. Phys Fluids 11:48–57.
5. Rost M, Laurson L, Dubé M, Alava M (2007) Fluctuations in fluid invasion into disor-dered media. Phys Rev Lett 98(5):054502.
6. Engl W, Roche M, Colin A, Panizza P, Ajdari A (2005) Droplet traffic at a simplejunction at low capillary numbers. Phys Rev Lett 95(20):208304.
7. Champagne N, Vasseur R, Montourcy A, Bartolo D (2010) Traffic jams and in-termittent flows in microfluidic networks. Phys Rev Lett 105(4):044502.
8. Duclaux V, Clanet C, Quéré D (2006) The effects of gravity on the capillary instabilityin tubes. J Fluid Mech 556(1):217–226.
9. Heil M, Hazel AL, Smith JA (2008) The mechanics of airway closure. Respir PhysiolNeurobiol 163(1-3):214–221.
10. Wright SM, et al. (2000) Altered airway surfactant phospholipid composition andreduced lung function in asthma. J Appl Physiol 89(4):1283–1292.
11. Hohlfeld JM, et al. (2002) The role of surfactant in asthma. Respir Res 3(4):1–8.12. Griese M, Birrer P, Demirsoy A (1997) Pulmonary surfactant in cystic fibrosis. Eur Respir
J 10(9):1983–1988.13. Engle WA; American Academy of Pediatrics Committee on Fetus and Newborn (2008)
Surfactant-replacement therapy for respiratory distress in the preterm and term ne-onate. Pediatrics 121(2):419–432.
14. Cassidy KJ, et al. (2001) A rat lung model of instilled liquid transport in the pulmonaryairways. J Appl Physiol 90(5):1955–1967.
15. Espinosa FF, Kamm RD (1999) Bolus dispersal through the lungs in surfactant re-placement therapy. J Appl Physiol 86(1):391–410.
16. Cassidy KJ, Gavriely N, Grotberg JB (2001) Liquid plug flow in straight and bifurcatingtubes. J Biomech Eng 123(6):580–589.
17. Zheng Y, Anderson JC, Suresh V, Grotberg JB (2005) Effect of gravity on liquid plugtransport through an airway bifurcation model. J Biomech Eng 127(5):798–806.
18. Ody CP, Baroud CN, de Langre E (2007) Transport of wetting liquid plugs in bi-furcating microfluidic channels. J Colloid Interface Sci 308(1):231–238.
19. Song Y, Manneville P, Baroud CN (2010) Local interactions and the global organiza-tion of a two-phase flow in a branching tree. Phys Rev Lett 105(13):134501.
20. Song Y, Baudoin M, Manneville P, Baroud CN (2011) The air-liquid flow in a micro-fluidic airway tree. Med Eng Phys 33(7):849–856.
21. Howell PD, Waters SL, Grotberg JB (2000) The propagation of a liquid bolus alonga liquid-lined flexible tube. J Fluid Mech 406:309–335.
22. Grotberg JB, Jensen OE (2004) Biofluid mechanics in flexible tubes. Annu Rev FluidMech 36:121–147.
23. Alencar AM, Buldyrev SV, Majumdar A, Stanley HE, Suki B (2001) Avalanche dynamicsof crackle sound in the lung. Phys Rev Lett 87(8):088101.
24. Alencar AM, et al. (2002) Physiology: Dynamic instabilities in the inflating lung. Na-ture 417(6891):809–811.
25. Majumdar A, et al. (2003) Fluid transport in branched structures with temporaryclosures: A model for quasistatic lung inflation. Phys Rev E Stat Nonlin Soft MatterPhys 67(3 Pt 1):031912.
26. Bico J, Quéré D (2001) Falling slugs. J Colloid Interface Sci 243(1):262–264.27. Hoffman RL (1975) Study of advancing interface. A. Interface shape in liquid-gas
systems. J Colloid Interface Sci 50(2):228–241.28. Tanner LH (1979) Spreading of silicone oil drops on horizontal surfaces. J. Phys. D 12:
1473–1484.29. Bretherton FP (1971) The motion of long bubbles in tubes. J Fluid Mech 10:166–188.30. Hazel AL, Heil M (2002) The steady propagation of a semi-infinite bubble into a tube
of elliptical or rectangular cross-section. J Fluid Mech 470:91–114.31. White FM (1991) Viscous Fluid Flow (McGraw-Hill, New York), 2nd Ed.32. Aussillous P, Quéré D (2000) Quick deposition of a fluid on the wall of a tube. Phys
Fluids 12(10):2367–2371.33. de Lózar A, Hazel AL, Juel A (2007) Scaling properties of coating flows in rectangular
channels. Phys Rev Lett 99(23):234501.34. Fujioka H, Takayama S, Grotberg JB (2008) Unsteady propagation of a liquid plug in
a liquid-lined straight tube. Phys Fluids 20(6):062104.35. Chebbi R (2003) Deformation of advancing gas-liquid interfaces in capillary tubes. J
Colloid Interface Sci 265(1):166–173.36. Weibel ER (1984) The Pathway for Oxygen. Structure and Function in the Mammalian
Respiratory System (Harvard Univ Press, Cambridge, MA).37. Fujioka H, Grotberg JB (2005) The steady propagation of a surfactant-laden liquid
plug in a two-dimensional channel. Phys Fluids 17(8):082102.38. Huh D, et al. (2007) Acoustically detectable cellular-level lung injury induced by fluid
mechanical stresses in microfluidic airway systems. Proc Natl Acad Sci USA 104(48):18886–18891.
39. Tavana H, et al. (2010) Dynamics of liquid plugs of buffer and surfactant solutions ina micro-engineered pulmonary airway model. Langmuir 26(5):3744–3752.
40. Halpern D, Naire S, Jensen OE, Gaver DP (2005) Unsteady bubble propagation ina flexible channel: Predictions of a viscous stick-slip instability. J Fluid Mech 528:53–86.
41. Stephan K, et al. (2007) Fast prototyping using a dry film photoresist: Micro-fabrication of soft-lithography masters for microfluidic structures. J Micromech Mi-croeng 17(69–N):74.
42. Dangla R, Gallaire F, Baroud CN (2010) Microchannel deformations due to solvent-induced pdms swelling. Lab Chip 10(21):2032–2045.
864 | www.pnas.org/cgi/doi/10.1073/pnas.1211706110 Baudoin et al.


![airway reopening arXiv:1705.07838v3 [physics.flu-dyn] 23 ... · veri ed for di erent systems (bubbles, liquid ngers, foams, ...). Nevertheless, there have been few attempts to compare](https://img.pdfslide.us/doc/110x75/5fc2c4f47220e176fc2da79f/airway-reopening-arxiv170507838v3-23-veri-ed-for-di-erent-systems-bubbles.jpg)