Embed Size (px)
Citation preview

RESEARCH Open Access
Airway driving pressure and lung stress inARDS patientsDavide Chiumello1,2*, Eleonora Carlesso3, Matteo Brioni3 and Massimo Cressoni3
Abstract
Background: Lung-protective ventilation strategy suggests the use of low tidal volume, depending on idealbody weight, and adequate levels of PEEP. However, reducing tidal volume according to ideal body weightdoes not always prevent overstress and overstrain. On the contrary, titrating mechanical ventilation on airwaydriving pressure, computed as airway pressure changes from PEEP to end-inspiratory plateau pressure,equivalent to the ratio between the tidal volume and compliance of respiratory system, should better reflectlung injury. However, possible changes in chest wall elastance could affect the reliability of airway drivingpressure.The aim of this study was to evaluate if airway driving pressure could accurately predict lung stress(the pressure generated into the lung due to PEEP and tidal volume).
Methods: One hundred and fifty ARDS patients were enrolled. At 5 and 15 cmH2O of PEEP, lung stress, drivingpressure, lung and chest wall elastance were measured.
Results: The applied tidal volume (mL/kg of ideal body weight) was not related to lung gas volume(r2 = 0.0005 p = 0.772). Patients were divided according to an airway driving pressure lower and equal/higherthan 15 cmH2O (the lower and higher airway driving pressure groups). At both PEEP levels, the higher airwaydriving pressure group had a significantly higher lung stress, respiratory system and lung elastance comparedto the lower airway driving pressure group. Airway driving pressure was significantly related to lung stress(r2 = 0.581 p < 0.0001 and r2 = 0.353 p < 0.0001 at 5 and 15 cmH2O of PEEP). For a lung stress of 24 and26 cmH2O, the optimal cutoff value for the airway driving pressure were 15.0 cmH2O (ROC AUC 0.85,95 % CI = 0.782–0.922); and 16.7 (ROC AUC 0.84, 95 % CI = 0.742–0.936).
Conclusions: Airway driving pressure can detect lung overstress with an acceptable accuracy. However, furtherstudies are needed to establish if these limits could be used for ventilator settings.
Keywords: ARDS, Lung stress, Driving pressure, VILI, Esophageal pressure, Mortality
BackgroundLung-protective ventilation strategy, commonly employedfor moderate to severe forms of acute respiratory distresssyndrome (ARDS) [1], suggests the use of low tidal volume,set according to the ideal body weight of the patient(6 mL/kgIBW) [2], and higher levels of positive end-expiratory pressure (PEEP) to limit ventilator-induced lunginjury (VILI) [2–7]. From a physical point of view, this
strategy should minimize the mechanical end-inspiratorylung stress (the applied force), strain (the magnitude oflung deformation) and the opening and closing trauma[8, 9]. It has been reported that VILI develops propor-tionally to the external energy applied by the ventilator tothe lung, mainly due to the dynamic strain and stresscaused by tidal volume [10–14]. However, reducing thetidal volume on the basis of ideal body weight, accordingto the current recommendations, does not always prevent
* Correspondence: [email protected] di Emergenza-Urgenza, ASST Santi Paolo e Carlo, Milan, Italy2Dipartimento di Scienze della Salute, Università degli Studi di Milano, Milan,ItalyFull list of author information is available at the end of the article
© 2016 The Author(s). Open Access This article is distributed under the terms of the Creative Commons Attribution 4.0International License (http://creativecommons.org/licenses/by/4.0/), which permits unrestricted use, distribution, andreproduction in any medium, provided you give appropriate credit to the original author(s) and the source, provide a link tothe Creative Commons license, and indicate if changes were made. The Creative Commons Public Domain Dedication waiver(http://creativecommons.org/publicdomain/zero/1.0/) applies to the data made available in this article, unless otherwise stated.
Chiumello et al. Critical Care (2016) 20:276 DOI 10.1186/s13054-016-1446-7
VILI [15–17]. In addition, the selection of optimal PEEPlevel is still questionable [7, 18–23].In ARDS, due to the presence of lung disease, the lung
available for ventilation is significantly and not uniformlyreduced among patients [24]; consequently, a similar tidalvolume, based on ideal body weight, can generate differentlung stress/strain [25]. On the contrary, titrating themechanical ventilation on the airway driving pressure,measured as the airway pressure changes from PEEP toend-inspiratory plateau pressure, equivalent to the ratiobetween the tidal volume and compliance of respiratorysystem, should better reflect the lung injury because ineach patient the applied tidal volume is related to theavailable lung gas volume [11, 24]. Recently, Amato et al.found that, in ARDS patients ventilated with differentcombinations of tidal volume and PEEP levels, the airwaydriving pressure was the factor most strongly related tothe outcome [3]. Thus, the airway driving pressure couldbe a useful tool to identify patients at risk of VILI. Inaddition, the estimation of airway driving pressure issimpler than that of lung stress, because it does not requirethe measurement of esophageal pressure by a dedicatedballoon, which, for several reasons, is not routinely clinicallyperformed [26]. However, due to the presence of possiblealterations in chest wall and lung elastance, the same in-spiratory airway pressure can be generated by different tidalvolumes [25]. In the presence of an increase in chest wallelastance, the same tidal volume can generate differenttranspulmonary pressure. Consequently, the airway drivingpressure could not adequately reflect lung stress (dynamicplus static stress). On the contrary, the transpulmonarydriving pressure (dynamic stress), taking into account thechest wall elastance, could better reflect lung stress.The aim of this study was to evaluate whether airway driv-
ing pressure accurately predicted the dynamic or the staticcomponent of lung stress during a PEEP trial with a constantlow tidal volume in sedated and paralyzed ARDS patients.
MethodsStudy populationA total of 150 ARDS patients were included: 21 wereenrolled from a new prospective study evaluating the rela-tionship between opening pressure (recruitment pressure)and closing pressure (PEEP) by lung computed tomography(CT) scan (http://clinicaltrials.gov/show/NCT01670747),while 129 were previously enrolled in three publishedstudies [22, 25, 27]. All the studies were approved by theinstitutional review board of the hospital and written con-sent was obtained according to current regulations.
Study designAll patients were deeply sedated, paralyzed and venti-lated in volume-control mode with a tidal volume of 6–8 mL per kilogram of ideal body weight throughout the
study protocol. The oxygen fraction, tidal volume and re-spiratory rate were maintained unchanged for the entirestudy. Five and 15 cmH2O of PEEP were randomly tested.Immediately before the changes of PEEP, a recruitmentmanoeuvre was performed to standardize the lung volumehistory. The recruitment manoeuvre was performed inpressure control ventilation at PEEP 5 cmH2O, with aplateau pressure of 45 cmH2O, inspiratory to expiratorytime ratio (I:E) 1:1, and a respiratory rate of 10 breaths/minute for 2 minutes [28]. At each PEEP level, after20 minutes, respiratory mechanics and blood gas analyseswere measured.
MeasurementsRespiratory mechanicsThe respiratory flow rate was measured with a heatedpneumotachograph (Fleisch n°2, Fleisch, Lausanne,Switzerland). Airway pressure (Paw) was measured afterthe Y piece proximally to the endotracheal tube with adedicated pressure transducer (MPX 2010 DP, Motorola,Solna, Sweden). Esophageal pressure (Pes) was measuredwith a radio-opaque balloon (SmartCath, Bicore, Irvine,CA, USA), inflated with 1.0–1.5 mL of air, connected to apressure transducer. To ensure the correct position of thecatheter, the esophageal balloon was positioned in thestomach to check for the presence of positive deflection.Then, it was retracted until it reached the lower third ofthe esophagus between a depth of 35–40 cm; in thisposition, an inspiratory occlusion was made to check forconcordant changes in airway and esophageal pressure[29]. The balloon inflation was periodically checked toensure it contained the recommended amount of air. Alltraces were sampled at 100 Hz and processed on adedicated data acquisition system (Colligo and Computo,www.elekton.it).At each PEEP level, the static airway and esophageal
pressure were measured during an inspiratory and expi-ratory pause. Subsequently, disconnecting the ventilatorand allowing the respiratory system to deflate from PEEPdown to atmospheric pressure (i.e. at functional residualcapacity), esophageal pressure was measured. At 5 cmH2Oin 58 patients the lung gas volume was measured bya simplified helium dilution technique as previouslydescribed [30]. The other 92 patients were transported tothe radiological department for a lung CT scan, and end-expiratory lung volume at PEEP 5 cmH2O was computedby quantitative analysis (see below).
Driving pressure, lung stress and partitioned elastanceAirway driving pressure was calculated according toAmato et al. [3], as the airway pressure changes fromPEEP to end-inspiratory plateau pressure. It is equivalentto the ratio between the tidal volume and compliance ofrespiratory system.
Chiumello et al. Critical Care (2016) 20:276 Page 2 of 10

The transpulmonary driving pressure, lung stress, respira-tory system, lung and chest wall elastance were computedaccording to the following formula [25, 31]:
Transpulmonary driving pressure cmH2Oð Þ¼ ½Airway pressure plateau cmH2Oð Þ
−Airway pressure PEEP cmH2Oð Þ�− ½Esophageal pressure plateau cmH2Oð Þ
−Esophageal pressure PEEP cmH2Oð Þ�Lung stress cmH2Oð Þ
¼ ½Airway pressure plateau cmH2Oð Þ−Atmospheric pressure cmH2Oð Þ�
− ½Esophageal pressure plateau cmH2Oð Þ−Esophageal pressure atmospheric pressure
cmH2Oð Þ�Respiratory system elastance Ersð Þ ðcmH2O=LÞ
¼Airway pressure plateau cmH2Oð Þ−Airway pressure PEEP cmH2Oð Þ
Tidal volume Lð ÞLung elastance Elð Þ ðcmH2O=LÞ
¼ Transpulmonary driving pressure cmH2Oð ÞTidal volume Lð Þ
Chest wall elastance Ecwð Þ ðcmH2O=LÞ
¼Esophageal pressure plateau cmH2Oð Þ−Esophageal pressure PEEP cmH2Oð Þ
Tidal volume Lð Þ
Lung CT scan and quantitative analysisIn 91 patients two whole-lung CT scans were performedafter a recruitment manoeuvre. During an end-expiratorypause at 5 cmH2O of PEEP and an end-inspiratory pauseat 45 cmH2O of airway pressure, lung CT scans weretaken using the following parameters: 110 mAs, tube volt-age 120 kV, rotation time 0.5 s, collimation 128 × 0.6 mm,pitch 0.85, and reconstruction matrix 512 × 512. Anautomatic tube current modulation technique (Care Dose4, Siemens Medical Solutions, Malvern, PA, USA) allow-ing for a dynamic reduction of dose radiation during CTexamination was applied. In each of the CT slices, lungprofiles were manually delineated and analysed usinga dedicated software package (Soft-E-Film, www.softefilm.eu). The total lung gas volume, weight, the amount inthe different compartments (not inflated, poorly inflated,well inflated and overinflated) and lung recruitability werecomputed as previously described [28].
Statistical analysisData are presented as median and interquartile range. Thewhole population was divided in two groups according tothe airway driving pressure lower and equal/higher than 15
cmH2O [3]. Physiological variables were compared withunpaired t test or Mann-Whitney rank sum test accordingto the result of the Shapiro-Wilk normality test. Categoricalvariables were compared with the chi-square test. The roleof baseline variables (gas exchange and lung mechanics) onpatients outcome from the intensive care unit was assessedwith logistic regression analysis (odds ratio [OR] and 95 %confidence intervals [CI]). The agreement between resultswas assessed using linear regression. A receiver operatingcharacteristics (ROC) curve was used to assess airway andtranspulmonary driving pressure ability to predict a lungstress greater than 24 or 26 cmH2O [32]. Statistical analysiswas performed with SigmaPlot 12.0 (Systat Software, SanJose, CA, USA), logistic regression with SAS statistical soft-ware 9.2 (SAS Institute, Cary, NC, USA).
ResultsThe main characteristics of the 150 enrolled patients areshown in Table 1. Sixty-five (43 %), 75 (50 %) and ten(7 %) patients presented mild, moderate and severe ARDS.Forty-eight patients (32 %) died in intensive care. Atintensive care unit (ICU) admission, non-survivor patientshad a higher arterial carbon dioxide (43.1 [36.0–48.3]vs 38.1 [35.0–43.6] mmHg, p = 0.019), respiratory rate
Table 1 Baseline characteristics of the study population
Characteristics Overall population (N = 150)
Age (years) 62 [47–74]
Male sex, N (%) 102 (68.0)
Body mass index (kg/m2) 24.7 [22.8–27.7]
ICU mortality, N (%) 48 (32.0)
Cause of lung injury, N (%):
• Sepsis 46 (30.7)
• Pneumonia 56 (37.3)
• Trauma 15 (10.0)
• Aspiration 7 (4.7)
• Other 26 (17.3)
ARDS category at clinical PEEP, N (%)
• Mild 65 (43.3)
• Moderate 75 (50.0)
• Severe 10 (6.7)
PaO2/FiO2 ratio 187 [146–230]
PaCO2 (mmHg)a 39.3 [35.1–45.3]
Respiratory rate (bpm)b 14 [12–18]
Minute ventilation (L/min)b 8.0 [6.6–9.7]
Tidal volume (mL/kgIBW)b 8.1 [6.7–9.3]
PEEP (cmH2O)a 10 [10–13]
ARDS acute respiratory distress syndrome, PEEP positive end-expiratory pressure,PaO2 arterial partial pressure of oxygen, FiO2 inspired fraction of oxygen, PaCO2
arterial partial pressure of carbon dioxide, IBW ideal body weightaData available in 143 patientsbData available in 142 patients
Chiumello et al. Critical Care (2016) 20:276 Page 3 of 10

(16.5 [14.0–20.0] vs 13.0 [11.0–16.5] breaths/min, p < 0.01),airway driving pressure at 5 cmH2O of PEEP (13.8[10.7–16.4] vs 12.2 [10.2–14.3] cmH2O, p = 0.047) andlower PaO2/FiO2 (160 [117–170] vs 211 [156–257], p <0.0001) compared to survivors (Additional file 1: Table S1).According to multivariate logistic regression, baselinePaO2/FiO2 (OR 0.989, CI 0.983–0.996; p = 0.0015) andbaseline respiratory rate (OR 1.090, CI 1.008–1.180; p =0.0315) predicted outcome from ICU, whereas baselinePaCO2 (p = 0.214) and driving pressures (p = 0.453) did not.
End expiratory lung gas volumeThe lung gas volume at PEEP 5 cmH2O was 1058[721–1662] mL and ranged between 229 to 3393 mL. Thelung gas volume measured at 5 cmH2O of PEEP was notrelated to the actual body weight (r2 = 0.002 p = 0.58, Fig. 1upper panel) and poorly related to ideal body weight (r2 =0.037 p = 0.019, Fig. 1 lower panel). The applied tidalvolume standardized for the ideal body weight was not re-lated to the lung gas volume (r2 = 0.001 p = 0.772, Fig. 2).
The respiratory system elastance computed at PEEP 5cmH2O was significantly related to the lung gas volumemeasured at the same level of PEEP (r2 = 0.234 p < 0.0001)(Additional file 1: Figure S1) and to the well-aerated lungtissue (r2 = 0.267 p < 0.0001) (Additional file 1: Figure S2).
Respiratory mechanics, lung stress and driving pressureThe population was classified in two groups according toan airway driving pressure lower and equal/higher of 15cmH2O (the lower and higher driving pressure groups).The two groups were similar for age, body mass index andseverity of disease (Additional file 1: Table S2).At 5 cmH2O the higher driving pressure group had a
significantly higher transpulmonary driving pressure, lungstress, respiratory system elastance, lung elastance, andmortality, and lower lung gas volume compared to thelower driving pressure group (Table 2). At 15 cmH2O ofPEEP, the higher driving pressure group presented asignificantly higher transpulmonary driving pressure, lungstress, and lung and chest wall elastance (Table 3). Gasexchange was similar between the two groups.The patients (N = 23, 21.3 %) who, increasing PEEP
to 15 cmH2O, were reassigned from the lower drivingpressure group to the higher driving pressure group, had(at PEEP 5 cmH2O) a higher airway driving pressure,transpulmonary driving pressure and lung stress com-pared patients remaining in the lower driving pressuregroup (Additional file 1: Table S3).
Driving pressure and lung stressThe transpulmonary driving pressure was significantly re-lated to the airway driving pressure (r2 = 0.737 p < 0.0001,and r2 = 0.656 p < 0.0001 at 5 and 15 cmH2O of PEEP,respectively; Fig. 3). The airway driving pressure wassignificantly related to lung stress (r2 = 0.581 p < 0.0001and r2 = 0.353 p < 0.0001 at 5 and 15 cmH2O of PEEP,
2
2
Fig. 1 Linear regression between lung gas volume at PEEP 5 cmH2O(determined at end-expiration with either lung CT scan or heliumdilution technique) and actual body weight (upper panel) and idealbody weight (lower panel). PEEP positive end-expiratory pressure
Fig. 2 Linear regression between tidal volume (mL/kg of ideal bodyweight) and lung gas volume at PEEP 5 cmH2O (mL). PEEP positiveend-expiratory pressure
Chiumello et al. Critical Care (2016) 20:276 Page 4 of 10
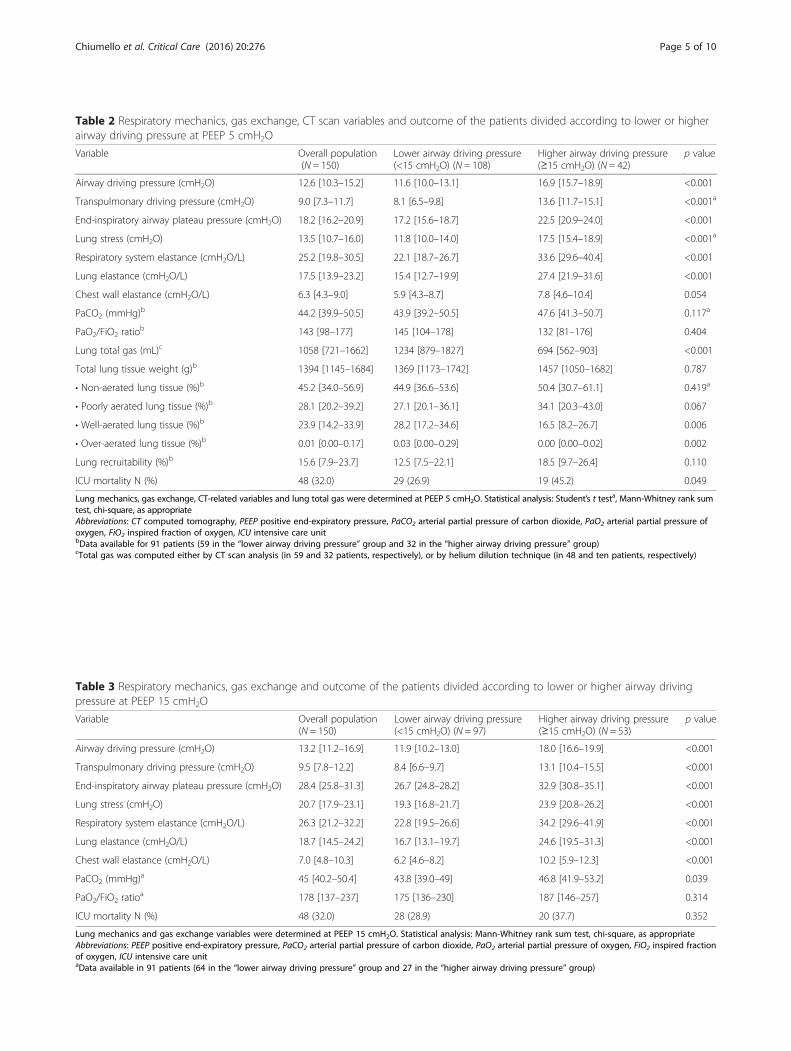
Table 2 Respiratory mechanics, gas exchange, CT scan variables and outcome of the patients divided according to lower or higherairway driving pressure at PEEP 5 cmH2O
Variable Overall population(N = 150)
Lower airway driving pressure(<15 cmH2O) (N = 108)
Higher airway driving pressure(≥15 cmH2O) (N = 42)
p value
Airway driving pressure (cmH2O) 12.6 [10.3–15.2] 11.6 [10.0–13.1] 16.9 [15.7–18.9] <0.001
Transpulmonary driving pressure (cmH2O) 9.0 [7.3–11.7] 8.1 [6.5–9.8] 13.6 [11.7–15.1] <0.001a
End-inspiratory airway plateau pressure (cmH2O) 18.2 [16.2–20.9] 17.2 [15.6–18.7] 22.5 [20.9–24.0] <0.001
Lung stress (cmH2O) 13.5 [10.7–16.0] 11.8 [10.0–14.0] 17.5 [15.4–18.9] <0.001a
Respiratory system elastance (cmH2O/L) 25.2 [19.8–30.5] 22.1 [18.7–26.7] 33.6 [29.6–40.4] <0.001
Lung elastance (cmH2O/L) 17.5 [13.9–23.2] 15.4 [12.7–19.9] 27.4 [21.9–31.6] <0.001
Chest wall elastance (cmH2O/L) 6.3 [4.3–9.0] 5.9 [4.3–8.7] 7.8 [4.6–10.4] 0.054
PaCO2 (mmHg)b 44.2 [39.9–50.5] 43.9 [39.2–50.5] 47.6 [41.3–50.7] 0.117a
PaO2/FiO2 ratiob 143 [98–177] 145 [104–178] 132 [81–176] 0.404
Lung total gas (mL)c 1058 [721–1662] 1234 [879–1827] 694 [562–903] <0.001
Total lung tissue weight (g)b 1394 [1145–1684] 1369 [1173–1742] 1457 [1050–1682] 0.787
• Non-aerated lung tissue (%)b 45.2 [34.0–56.9] 44.9 [36.6–53.6] 50.4 [30.7–61.1] 0.419a
• Poorly aerated lung tissue (%)b 28.1 [20.2–39.2] 27.1 [20.1–36.1] 34.1 [20.3–43.0] 0.067
• Well-aerated lung tissue (%)b 23.9 [14.2–33.9] 28.2 [17.2–34.6] 16.5 [8.2–26.7] 0.006
• Over-aerated lung tissue (%)b 0.01 [0.00–0.17] 0.03 [0.00–0.29] 0.00 [0.00–0.02] 0.002
Lung recruitability (%)b 15.6 [7.9–23.7] 12.5 [7.5–22.1] 18.5 [9.7–26.4] 0.110
ICU mortality N (%) 48 (32.0) 29 (26.9) 19 (45.2) 0.049
Lung mechanics, gas exchange, CT-related variables and lung total gas were determined at PEEP 5 cmH2O. Statistical analysis: Student’s t testa, Mann-Whitney rank sum
test, chi-square, as appropriateAbbreviations: CT computed tomography, PEEP positive end-expiratory pressure, PaCO2 arterial partial pressure of carbon dioxide, PaO2 arterial partial pressure ofoxygen, FiO2 inspired fraction of oxygen, ICU intensive care unitbData available for 91 patients (59 in the “lower airway driving pressure” group and 32 in the “higher airway driving pressure” group)cTotal gas was computed either by CT scan analysis (in 59 and 32 patients, respectively), or by helium dilution technique (in 48 and ten patients, respectively)
Table 3 Respiratory mechanics, gas exchange and outcome of the patients divided according to lower or higher airway drivingpressure at PEEP 15 cmH2O
Variable Overall population(N = 150)
Lower airway driving pressure(<15 cmH2O) (N = 97)
Higher airway driving pressure(≥15 cmH2O) (N = 53)
p value
Airway driving pressure (cmH2O) 13.2 [11.2–16.9] 11.9 [10.2–13.0] 18.0 [16.6–19.9] <0.001
Transpulmonary driving pressure (cmH2O) 9.5 [7.8–12.2] 8.4 [6.6–9.7] 13.1 [10.4–15.5] <0.001
End-inspiratory airway plateau pressure (cmH2O) 28.4 [25.8–31.3] 26.7 [24.8–28.2] 32.9 [30.8–35.1] <0.001
Lung stress (cmH2O) 20.7 [17.9–23.1] 19.3 [16.8–21.7] 23.9 [20.8–26.2] <0.001
Respiratory system elastance (cmH2O/L) 26.3 [21.2–32.2] 22.8 [19.5–26.6] 34.2 [29.6–41.9] <0.001
Lung elastance (cmH2O/L) 18.7 [14.5–24.2] 16.7 [13.1–19.7] 24.6 [19.5–31.3] <0.001
Chest wall elastance (cmH2O/L) 7.0 [4.8–10.3] 6.2 [4.6–8.2] 10.2 [5.9–12.3] <0.001
PaCO2 (mmHg)a 45 [40.2–50.4] 43.8 [39.0–49] 46.8 [41.9–53.2] 0.039
PaO2/FiO2 ratioa 178 [137–237] 175 [136–230] 187 [146–257] 0.314
ICU mortality N (%) 48 (32.0) 28 (28.9) 20 (37.7) 0.352
Lung mechanics and gas exchange variables were determined at PEEP 15 cmH2O. Statistical analysis: Mann-Whitney rank sum test, chi-square, as appropriateAbbreviations: PEEP positive end-expiratory pressure, PaCO2 arterial partial pressure of carbon dioxide, PaO2 arterial partial pressure of oxygen, FiO2 inspired fractionof oxygen, ICU intensive care unitaData available in 91 patients (64 in the “lower airway driving pressure” group and 27 in the “higher airway driving pressure” group)
Chiumello et al. Critical Care (2016) 20:276 Page 5 of 10
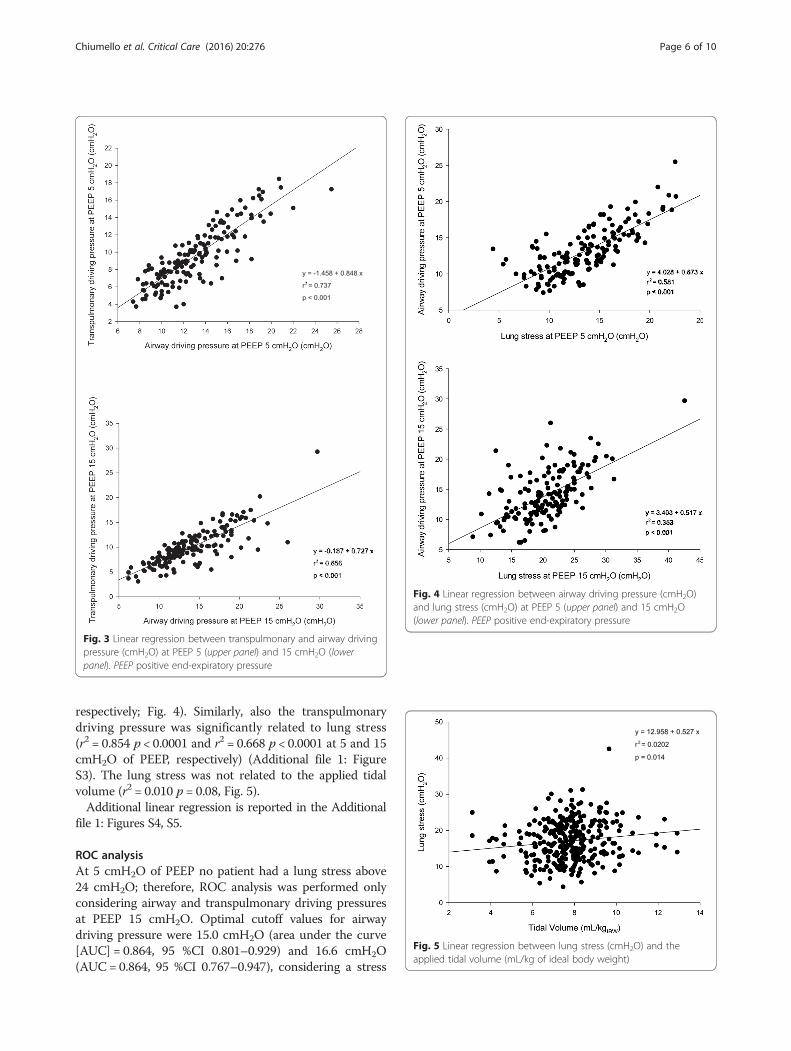
respectively; Fig. 4). Similarly, also the transpulmonarydriving pressure was significantly related to lung stress(r2 = 0.854 p < 0.0001 and r2 = 0.668 p < 0.0001 at 5 and 15cmH2O of PEEP, respectively) (Additional file 1: FigureS3). The lung stress was not related to the applied tidalvolume (r2 = 0.010 p = 0.08, Fig. 5).Additional linear regression is reported in the Additional
file 1: Figures S4, S5.
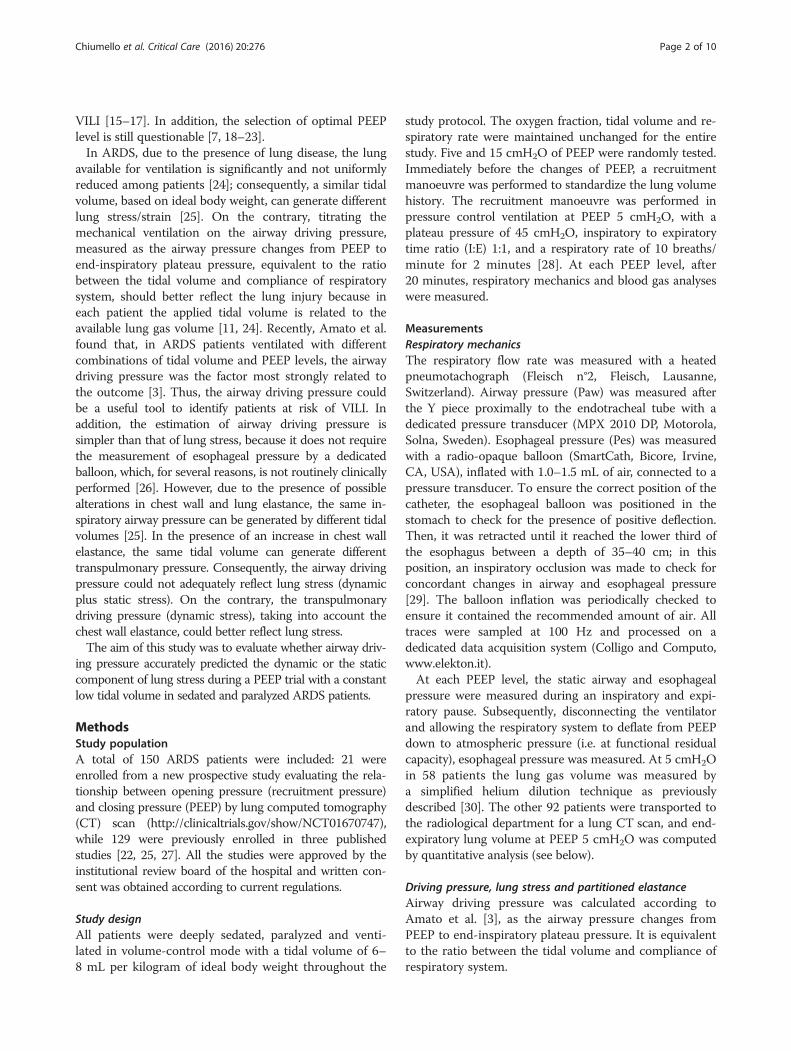
ROC analysisAt 5 cmH2O of PEEP no patient had a lung stress above24 cmH2O; therefore, ROC analysis was performed onlyconsidering airway and transpulmonary driving pressuresat PEEP 15 cmH2O. Optimal cutoff values for airwaydriving pressure were 15.0 cmH2O (area under the curve[AUC] = 0.864, 95 %CI 0.801–0.929) and 16.6 cmH2O(AUC= 0.864, 95 %CI 0.767–0.947), considering a stress
Fig. 3 Linear regression between transpulmonary and airway drivingpressure (cmH2O) at PEEP 5 (upper panel) and 15 cmH2O (lowerpanel). PEEP positive end-expiratory pressure
Fig. 4 Linear regression between airway driving pressure (cmH2O)and lung stress (cmH2O) at PEEP 5 (upper panel) and 15 cmH2O(lower panel). PEEP positive end-expiratory pressure
Fig. 5 Linear regression between lung stress (cmH2O) and theapplied tidal volume (mL/kg of ideal body weight)
Chiumello et al. Critical Care (2016) 20:276 Page 6 of 10

equal or above 24 and 26 cmH2O, respectively (Fig. 6). Fortranspulmonary driving pressure, optimal cutoff valueswere 11.7 cmH2O (AUC= 0.962, 95 %CI 0.934–0.989) and11.8 cmH2O (AUC= 0.938, 95 %CI 0.894–0.982), conside-ring a stress equal or above 24 and 26 cmH2O, respectively(Additional file 1: Figure S6, Table S4).
DiscussionThe primary findings of this study, aimed to assess therelationship between driving pressure and lung stress, arethat: (1) at both the tested levels of PEEP (5 and 15cmH2O) patients with a higher driving pressure presenteda significantly higher lung stress; (2) the airway drivingpressure was sufficiently accurate to detect lung stresshigher than 24 and 26 cmH2O.ARDS is commonly managed by invasive mechanical
ventilation. Unfortunately, the mechanical ventilation canfurther damage the lung, activating a biological inflamma-tory response and promoting VILI [8, 11, 33]. In order tolimit VILI, ensuring at the same time adequate ventilation,a lung-protective ventilation strategy has been imple-mented [2–7]. Presently, there are no clear thresholds fortidal volume or plateau pressure that may ensure a safeventilator strategy [34, 35], and these recommendationsare not widely applied [36]. Trying to reduce overstress/strain, the majority of the studies applied a tidal volumestandardized to ideal body weight, computed according tothe patient’s height and sex [37], as in healthy subjects thelung volume is related to height [38]. Thus, an obesepatient should not receive a higher tidal volume justbecause of the weight gain, compared to a normal bodyweight patient with similar height. Unlike healthy subjects,in ARDS patients the amount of lung gas volume in whichthe tidal volume is distributed is highly variable, anddepends on the severity of the disease [25, 28]. In thepresent study, the tidal volumes set according both to theideal body weight and to the actual body weight were not
related to the lung gas volume. Consequently, a similaramount of tidal volume could produce different stressamong different patients with similar body weight (Fig. 5).One possible solution should be to titrate the tidal volumeaccording to the airway driving pressure, which dependson the respiratory system elastance, thus better reflectingthe severity of the disease [3]. To estimate the “true” driv-ing pressure, it is necessary to have the patients well re-laxed, with or without paralysis, to avoid any possiblerespiratory effort. Amato et al., retrospectively analysingthe airway driving pressure from the individual data of3562 ARDS deeply sedated patients, enrolled in more thannine clinical trials, showed that driving pressure wasstrongly associated with outcome [3]. Similarly, Cinnellaet al, applying an open lung approach based on a recruit-ment manoeuvre followed by a decremental PEEP trial,compared to the ARDS Network protocol, significantly re-duced the driving pressure with a higher tidal volume frac-tion inflating the dorsal lung regions [39]. These studiesshowed the possibility of using airway driving pressure asa possible surrogate of lung stress at bedside [39, 40]avoiding thus the use of esophageal manometry and anydisconnection from the ventilator that can be technicallychallenging [26].However, due to the possible impairment of chest wall
elastance in ARDS [41, 42], a similar airway pressure canbe associated to a significantly different transpulmonarypressure, depending on the relationship between lung andchest wall elastance [25, 43]. In an experimental animalstudy with and without abdominal hypertension at diffe-rent PEEP levels, the airway driving pressure paralleledthe behaviours of transpulmonary driving pressure; how-ever, their ratio was always lower than 1, with a meanrange of 0.45 to 0.79 [31].In the present study, we divided the population accor-
ding to an airway driving pressure lower than, equal orhigher than 15 cmH2O, a value that was associated to
Fig. 6 Receiver operator characteristic (ROC) curve for airway driving pressure as a predictor of lung stress above 24 (left panel) or 26 cmH2O(right panel). AUC area under the curve
Chiumello et al. Critical Care (2016) 20:276 Page 7 of 10
an increase in the mortality in the study published byAmato et al. [3]. At both PEEP levels, the lower drivingpressure group had a significantly lower stress; further-more, patients who were reclassified from lower to higherairway driving pressure group by passing from 5 to 15cmH2O, presented higher lung stress and lung elastance.Regarding the possibility that airway driving pressurecould discriminate patients with lung overstress, althoughseveral studies titrated adjusted mechanical ventilation onthe basis of lung stress, there is not a clear threshold atthe present time; thus, in this study, two different cutoffs,24 and 26 cmH2O of transpulmonary pressure, wereconsidered [21, 25, 42, 44, 45]. However, experimentalstudies both in sheep [46, 47] and in piglets [13, 48, 49]show that VILI occurs if mechanical ventilation is con-ducted in the range of total lung capacity. Ratio of inspira-tory capacity to resting lung volume (total lung capacity/functional residual capacity, TLC/FRC) is approximately2.2–2.6 and is highly conserved among species. In normalhumans FRC is 2200 mL and TLC 6000 mL [50]; it fol-lows that the physical limit of lung expansion is between2.5 and 3. We found [25] that specific elastance (definedas the transpulmonary pressure/stress needed to doublethe FRC) in ARDS and healthy subjects is approximately13.5 cmH2O. It follows that applying a stress of 27cmH2O implies adding a volume of two times the FRC,reaching the total lung capacity. For this reason we pro-posed two thresholds immediately below the strain of 27(24 and 26 cmH2O). At 5 cmH2O of PEEP none of the pa-tients had a lung stress higher than 24 cmH2O. This sug-gests that applying a low tidal volume with low PEEPavoids an unsafe lung stress. However, this approach couldbe equally harmful in moderate to severe ARDS, whereusually lung recruitability is high and cyclic intra-tidalopening and closing would occur [51, 52]. On the con-trary, at 15 cmH2O of PEEP, 29 patients presented a lungstress higher than 24 and 16 patients higher than 26cmH2O respectively. In the linear regression there was arelative amount of variability suggesting that the exactlung stress could not be predicted with confidence. How-ever, as shown by the ROC curves, the airway drivingpressure presented an acceptable sensitivity and specificityto detect lung stress higher than 24 and 26 cmH2O(Additional file 1: Table S4).Contrary to the Amato et al. study, we found a diffe-
rence in outcome between patients with lower or higherdriving pressure only at 5 cmH2O of PEEP, but this canbe easily explained by the fact that the patients after thestudy underwent different setting of mechanical ventila-tion and were not managed according to the drivingpressure.Although respiratory rate, minute ventilation, and in-
spiratory flow [14, 53] can be associated to lung injury,the total alveolar deformation during mechanical
ventilation due to the application of PEEP (static strain)and to the tidal volume (dynamic strain) is the most fre-quently used indicator of VILI at bedside. Experimentalstudies showed that dynamic strain is more harmful com-pared to an equivalent static strain, and furthermoremaintaining the same global deformation by a simultan-eous reduction of the dynamic component and an in-crease of the static component caused less VILI [54–57].Although the monitoring of airway driving pressure is ableto detect the possible presence of lung overstress, it doesnot give any information about the other possible associ-ated factors in modulating VILI [14, 57].
LimitationsPossible limitations of this study are: (1) the includedpatients originated by mixing from previous publisheddata [22, 25, 27] and a new prospective study; (2) themajority of the patients presented a mild to moderateform of ARDS.
ConclusionsMechanical ventilation, applying pressure and volumewith non-physiologic distortion (i.e. strain) and stress(i.e. transpulmonary pressure), can generate an energy loadto lung parenchyma, which promotes VILI. The airwaydriving pressure can be a plausible, non-invasive methodto predict lung stress in mild and moderate ARDS. How-ever, further prospective studies are needed to establish thelimits of overstress that should be used at bedside.
Key messages
� The tidal volume based on ideal body weight is notrelated to the amount of aerated lung volume andto lung stress
� At 5 and 15 cmH2O of PEEP patients with a higherairway driving pressure presented a significantlyhigher lung stress (dynamic plus static stress).
� The airway driving pressure was sufficiently accurateto detect lung stress higher than 24 and 26 cmH2O.
� Further prospective studies are needed to establishthe limits of overstress.
Additional file
Additional file 1: Expanded results with additional tables and figures.(PDF 2454 kb)
AbbreviationsARDS, acute respiratory distress syndrome; AUC, area under the curve;CI, confidence interval; CT, computed tomography; Ecw, elastance of thechest wall; El, elastance of the lung; Ers, elastance of the respiratory system;FRC, functional residual capacity; IBW, ideal body weight; OR, odds ratio;PEEP, positive end-expiratory pressure; ROC, receiver operator characteristic;TLC, total lung capacity; VILI, ventilation-induced lung injury
Chiumello et al. Critical Care (2016) 20:276 Page 8 of 10

FundingThis study was performed with only institutional funding.
Authors’ contributionsDC designed the study and drafted the manuscript. EC, MB, and MCcontributed to data analysis and interpretation, and critically revisedthe manuscript for important intellectual content. All authors readand approved the final manuscript.
Competing interestsThe authors declare that they have no competing interests.
Author details1Dipartimento di Emergenza-Urgenza, ASST Santi Paolo e Carlo, Milan, Italy.2Dipartimento di Scienze della Salute, Università degli Studi di Milano, Milan,Italy. 3Dipartimento di Fisiopatologia medico-chirurgica e dei Trapianti,Università degli Studi di Milano, Milan, Italy.
Received: 18 February 2016 Accepted: 1 August 2016
References1. Ferguson ND, Fan E, Camporota L, Antonelli M, Anzueto A, Beale R, et al.
The Berlin definition of ARDS: an expanded rationale, justification, andsupplementary material. Intensive Care Med. 2012;38:1573–82.
2. Ventilation with lower tidal volumes as compared with traditional tidalvolumes for acute lung injury and the acute respiratory distress syndrome. TheAcute Respiratory Distress Syndrome Network. N Engl J Med. 2000;342:1301–8.
3. Amato MBP, Meade MO, Slutsky AS, Brochard L, Costa ELV, Schoenfeld DA,et al. Driving pressure and survival in the acute respiratory distresssyndrome. N Engl J Med. 2015;372:747–55.
4. Ranieri VM, Rubenfeld GD, Thompson BT, Ferguson ND, Caldwell E, Fan E, etal. Acute respiratory distress syndrome: the Berlin Definition. JAMA.2012;307:2526–33.
5. Villar J, Kacmarek RM, Perez-Mendez L, Aguirre-Jaime A. A high positiveend-expiratory pressure, low tidal volume ventilatory strategy improvesoutcome in persistent acute respiratory distress syndrome: a randomized,controlled trial. Crit Care Med. 2006;34:1311–8.
6. Dellinger RP, Levy MM, Rhodes A, Annane D, Gerlach H, Opal SM, et al.Surviving Sepsis Campaign: international guidelines for management ofsevere sepsis and septic shock, 2012. Intensive Care Med. 2013;39:165–228.
7. Briel M, Meade M, Mercat A, Brower RG, Talmor D, Walter SD, et al. Highervs lower positive end-expiratory pressure in patients with acute lung injuryand acute respiratory distress syndrome: systematic review andmeta-analysis. JAMA. 2010;303:865–73.
8. Slutsky AS, Ranieri VM. Ventilator-induced lung injury. N Engl J Med.2013;369:2126–36.
9. Wilson T. Solid mechanics. In: American Physiological Society, editor.Handbook of physiology: a critical, comprehensive presentation ofphysiological knowledge and concepts. Baltimore: Waverly Press; 1986. p. 35–9.
10. Kolobow T. Volutrauma, barotrauma, and ventilator-induced lung injury: lessonslearned from the animal research laboratory. Crit Care Med. 2004;32:1961–2.
11. Gattinoni L, Carlesso E, Cadringher P, Valenza F, Vagginelli F, Chiumello D.Physical and biological triggers of ventilator-induced lung injury and itsprevention. Eur Respir J Suppl. 2003;47:15s–25s.
12. Gonzalez-Lopez A, Garcia-Prieto E, Batalla-Solis E, Amado-Rodriguez L,Avello N, Blanch L, et al. Lung strain and biological response inmechanically ventilated patients. Intensive Care Med. 2012;38:240–7.
13. Protti A, Cressoni M, Santini A, Langer T, Mietto C, Febres D, et al. Lungstress and strain during mechanical ventilation: any safe threshold?Am J Respir Crit Care Med. 2011;183:1354–62.
14. Cressoni M, Gotti M, Chiurazzi C, Massari D, Algieri I, Amini M, et al.Mechanical power and development of ventilator-induced lung injury.Anesthesiology. 2016;124:1100–8.
15. Terragni PP, Rosboch G, Tealdi A, Corno E, Menaldo E, Davini O, et al. Tidalhyperinflation during low tidal volume ventilation in acute respiratorydistress syndrome. Am J Respir Crit Care Med. 2007;175:160–6.
16. Gattinoni L, Chiumello D, Carlesso E, Valenza F. Bench-to-bedside review:chest wall elastance in acute lung injury/acute respiratory distress syndromepatients. Crit Care Lond Engl. 2004;8:350–5.
17. Cortes-Puentes GA, Cortes-Puentes LA, Adams AB, Anderson CP, Marini JJ,Dries DJ. Experimental intra-abdominal hypertension influences airwaypressure limits for lung protective mechanical ventilation. J Trauma AcuteCare Surg. 2013;74:1468–73.
18. Meade MO, Cook DJ, Guyatt GH, Slutsky AS, Arabi YM, Cooper DJ, et al.Ventilation strategy using low tidal volumes, recruitment maneuvers, andhigh positive end-expiratory pressure for acute lung injury and acuterespiratory distress syndrome: a randomized controlled trial. JAMA.2008;299:637–45.
19. Mercat A, Richard J-CM, Vielle B, Jaber S, Osman D, Diehl J-L, et al. Positiveend-expiratory pressure setting in adults with acute lung injury and acuterespiratory distress syndrome: a randomized controlled trial. JAMA. 2008;299:646–55.
20. Brower RG, Lanken PN, MacIntyre N, Matthay MA, Morris A, Ancukiewicz M,et al. Higher versus lower positive end-expiratory pressures in patients withthe acute respiratory distress syndrome. N Engl J Med. 2004;351:327–36.
21. Talmor D, Sarge T, Malhotra A, O’Donnell CR, Ritz R, Lisbon A, et al.Mechanical ventilation guided by esophageal pressure in acute lung injury.N Engl J Med. 2008;359:2095–104.
22. Chiumello D, Cressoni M, Carlesso E, Caspani ML, Marino A, Gallazzi E, et al.Bedside selection of positive end-expiratory pressure in mild, moderate, andsevere acute respiratory distress syndrome. Crit Care Med. 2014;42:252–64.
23. Guerin C. The preventive role of higher PEEP in treating severely hypoxemicARDS. Minerva Anestesiol. 2011;77:835–45.
24. Gattinoni L, Pesenti A. The concept of “baby lung”. Intensive Care Med.2005;31:776–84.
25. Chiumello D, Carlesso E, Cadringher P, Caironi P, Valenza F, Polli F, et al.Lung stress and strain during mechanical ventilation for acute respiratorydistress syndrome. Am J Respir Crit Care Med. 2008;178:346–55.
26. Akoumianaki E, Maggiore SM, Valenza F, Bellani G, Jubran A, Loring SH, et al.The application of esophageal pressure measurement in patients withrespiratory failure. Am J Respir Crit Care Med. 2014;189:520–31.
27. Chiumello D, Marino A, Cressoni M, Mietto C, Berto V, Gallazzi E, et al.Pleural effusion in patients with acute lung injury: a CT scan study. Crit CareMed. 2013;41:935–44.
28. Gattinoni L, Caironi P, Cressoni M, Chiumello D, Ranieri VM, Quintel M, et al.Lung recruitment in patients with the acute respiratory distress syndrome.N Engl J Med. 2006;354:1775–86.
29. Chiumello D, Chidini G, Calderini E, Colombo A, Crimella F, Brioni M.Respiratory mechanics and lung stress/strain in children with acuterespiratory distress syndrome. Ann Intensive Care. 2016;6:11.
30. Chiumello D, Cressoni M, Chierichetti M, Tallarini F, Botticelli M, Berto V, etal. Nitrogen washout/washin, helium dilution and computed tomography inthe assessment of end expiratory lung volume. Crit Care. 2008;12:R150.
31. Cortes-Puentes GA, Keenan JC, Adams AB, Parker ED, Dries DJ, Marini JJ.Impact of chest wall modifications and lung injury on the correspondencebetween airway and transpulmonary driving pressures. Crit Care Med.2015;43:e287–95.
32. Hanley JA, McNeil BJ. The meaning and use of the area under a receiveroperating characteristic (ROC) curve. Radiology. 1982;143:29–36.
33. Dreyfuss D, Saumon G. Ventilator-induced lung injury: lessons fromexperimental studies. Am J Respir Crit Care Med. 1998;157:294–323.
34. Deans KJ, Minneci PC, Cui X, Banks SM, Natanson C, Eichacker PQ.Mechanical ventilation in ARDS: one size does not fit all. Crit Care Med.2005;33:1141–3.
35. Hager DN, Krishnan JA, Hayden DL, Brower RG. Tidal volume reduction inpatients with acute lung injury when plateau pressures are not high.Am J Respir Crit Care Med. 2005;172:1241–5.
36. Jaswal DS, Leung JM, Sun J, Cui X, Li Y, Kern S, et al. Tidal volume andplateau pressure use for acute lung injury from 2000 to present: asystematic literature review. Crit Care Med. 2014;42:2278–89.
37. Girard TD, Bernard GR. Mechanical ventilation in ARDS: a state-of-the-artreview. Chest. 2007;131:921–9.
38. Ibanez J, Raurich JM. Normal values of functional residual capacity in thesitting and supine positions. Intensive Care Med. 1982;8:173–7.
39. Cinnella G, Grasso S, Raimondo P, D’Antini D, Mirabella L, Rauseo M, et al.Physiological effects of the open lung approach in patients with early, mild,diffuse acute respiratory distress syndrome: an electrical impedancetomography study. Anesthesiology. 2015;123:1113–21.
40. Loring SH, Malhotra A. Driving pressure and respiratory mechanics in ARDS.N Engl J Med. 2015;372:776–7.
Chiumello et al. Critical Care (2016) 20:276 Page 9 of 10
41. Gattinoni L, Pesenti A, Avalli L, Rossi F, Bombino M. Pressure-volume curveof total respiratory system in acute respiratory failure. Computedtomographic scan study. Am Rev Respir Dis. 1987;136:730–6.
42. Ranieri VM, Brienza N, Santostasi S, Puntillo F, Mascia L, Vitale N, et al.Impairment of lung and chest wall mechanics in patients with acuterespiratory distress syndrome: role of abdominal distension. Am J Respir CritCare Med. 1997;156:1082–91.
43. Gattinoni L, Pelosi P, Suter PM, Pedoto A, Vercesi P, Lissoni A. Acuterespiratory distress syndrome caused by pulmonary and extrapulmonarydisease. Different syndromes? Am J Respir Crit Care Med. 1998;158:3–11.
44. Grasso S, Terragni P, Birocco A, Urbino R, Del Sorbo L, Filippini C, et al.ECMO criteria for influenza A (H1N1)-associated ARDS: role oftranspulmonary pressure. Intensive Care Med. 2012;38:395–403.
45. Grasso S, Mascia L, Del Turco M, Malacarne P, Giunta F, Brochard L, et al.Effects of recruiting maneuvers in patients with acute respiratory distresssyndrome ventilated with protective ventilatory strategy. Anesthesiology.2002;96:795–802.
46. Mandava S, Kolobow T, Vitale G, Foti G, Aprigliano M, Jones M, et al. Lethalsystemic capillary leak syndrome associated with severe ventilator-inducedlung injury: an experimental study. Crit Care Med. 2003;31:885–92.
47. Kolobow T, Moretti MP, Fumagalli R, Mascheroni D, Prato P, Chen V, et al.Severe impairment in lung function induced by high peak airway pressureduring mechanical ventilation. An experimental study. Am Rev Respir Dis.1987;135:312–5.
48. Cressoni M, Chiurazzi C, Gotti M, Amini M, Brioni M, Algieri I, et al. Lunginhomogeneities and time course of ventilator-induced mechanical injuries.Anesthesiology. 2015;123:618–27.
49. Protti A, Andreis DT, Milesi M, Iapichino GE, Monti M, Comini B, et al. Lunganatomy, energy load, and ventilator-induced lung injury. Intensive CareMed Exp. 2015;3:34.
50. American Physiological Society, editor. Handbook of physiology: a critical,comprehensive presentation of physiological knowledge and concepts.Baltimore: Waverly Press; 1986.
51. Caironi P, Carlesso E, Cressoni M, Chiumello D, Moerer O, Chiurazzi C, et al.Lung recruitability is better estimated according to the Berlin definition ofacute respiratory distress syndrome at standard 5 cm H2O rather thanhigher positive end-expiratory pressure: a retrospective cohort study. CritCare Med. 2015;43:781–90.
52. Caironi P, Cressoni M, Chiumello D, Ranieri M, Quintel M, Russo SG, et al.Lung opening and closing during ventilation of acute respiratory distresssyndrome. Am J Respir Crit Care Med. 2010;181:578–86.
53. Protti A, Maraffi T, Milesi M, Votta E, Santini A, Pugni P, et al. Role of strain ratein the pathogenesis of ventilator-induced lung edema. Crit. Care Med. 2016.[Epub ahead of print]
54. Tschumperlin DJ, Oswari J, Margulies AS. Deformation-induced injury ofalveolar epithelial cells. Effect of frequency, duration, and amplitude.Am J Respir Crit Care Med. 2000;162:357–62.
55. Webb HH, Tierney DF. Experimental pulmonary edema due to intermittentpositive pressure ventilation with high inflation pressures. Protection bypositive end-expiratory pressure. Am Rev Respir Dis. 1974;110:556–65.
56. Protti A, Votta E, Gattinoni L. Which is the most important strain in thepathogenesis of ventilator-induced lung injury: dynamic or static?Curr Opin Crit Care. 2014;20:33–8.
57. Protti A, Andreis DT, Monti M, Santini A, Sparacino CC, Langer T, et al. Lungstress and strain during mechanical ventilation: any difference betweenstatics and dynamics? Crit Care Med. 2013;41:1046–55.
• We accept pre-submission inquiries
• Our selector tool helps you to find the most relevant journal
• We provide round the clock customer support
• Convenient online submission
• Thorough peer review
• Inclusion in PubMed and all major indexing services
• Maximum visibility for your research
Submit your manuscript atwww.biomedcentral.com/submit
Submit your next manuscript to BioMed Central and we will help you at every step:
Chiumello et al. Critical Care (2016) 20:276 Page 10 of 10