Embed Size (px)
Citation preview
i
TECHNICAL GUIDANCE MATERIAL
AIRSPEED INDICATOR CALIBRATION
This document explains the process of calibration of the airspeed indicator to generate
curves to convert indicated airspeed (IAS) to calibrated airspeed (CAS) and has been
compiled as reference material only.
ii
Technical Guidance Material
BushCat NOSE-WHEEL AND TAIL-DRAGGER
FITTED WITH ROTAX 912UL/ULS ENGINE
APPROVED QRH PART NUMBER: BCTG-NT-001-000
AIRCRAFT TYPE: CHEETAH – BUSHCAT*
DATE OF ISSUE: 18th JUNE 2018
*Refer to the POH for more information on aircraft type.
iii
For BushCat Nose Wheel and Tail Dragger LSA
Section intentionally left blank.
Issue Number: Date Published: Notable Changes:
-001 18/09/2018 Original
iv
Table of Contents
1. BACKGROUND ..................................................................................................................... 1
2. DETERMINATION OF INSTRUMENT ERROR FOR YOUR ASI ................................................ 2
3. GENERATING THE IAS-CAS RELATIONSHIP FOR YOUR AIRCRAFT....................................... 5
4. CORRECT ALIGNMENT OF THE PITOT TUBE ....................................................................... 9
APPENDIX A – ASI INSTRUMENT ERROR SHEET ....................................................................... 11
Table of Figures
Figure 1 Arrangement of instrument calibration system .......................................................... 3
Figure 2 IAS instrument error sample ........................................................................................ 7
Figure 3 Sample relationship between IAS and CAS for power off descent .............................. 8
Figure 4 Longitudinal alignment of pitot tube ........................................................................... 9
Figure 5 Vertical alignment of pitot tube ................................................................................ 10
Abbreviations and Symbols
ASI: Airspeed Indicator
CAS: Calibrated airspeed
EFIS: Electronic Flight Information System
IAS: Indicated airspeed
ISA: International Standard Atmosphere
Eins: Instrument error
Epos: Position error
Vqc: Simulated calibrated airspeed
1
1. BACKGROUND
The aerodynamic forces acting on an aircraft are directly dependent on the dynamic
pressure encountered by the aircraft. In essence, the dynamic pressure is that portion of the
total pressure in the atmosphere that acts on the aircraft due to its movement through the
air. The calibrated airspeed (CAS) is directly representative of the dynamic pressure acting
on the aircraft regardless of altitude, wind, temperature etc. Thus, at a given CAS, the
aerodynamic forces acting on the aircraft are constant, regardless of altitude, temperature
etc. This conveniently means that the stall CAS for a given aircraft weight and configuration
will be much the same within the flight envelope of a typical light aircraft, regardless of the
environmental conditions. The pitot-static system installed in the aircraft attempts to
display CAS to the pilot but is subject to numerous errors.
In order to determine the relationship between indicated airspeed (IAS) and calibrated
airspeed (CAS) it is necessary to account for the most significant errors present in the pitot-
static system. These errors are instrument error and position error.
• Instrument error: The error present in the reading of the instrument due to
manufacturing imperfections and wear and tear. This can vary vastly depending on
the make, age and condition of the instrument.
• Position error: The error present in the reading due to the system sensing pressures
that are not truly representative of what the aircraft is encountering. These errors
come from the position on the aircraft at which the total and static pressures are
sensed and can be affected by the pressure distribution around the aircraft, the
propeller slipstream etc. Up to the time of writing, the standard pitot-static system
installed in the Cheetah/BushCat made use of a pitot tube to sense total pressure,
while the instruments themselves (ASI and altimeter) were left to sense static
pressure within the cabin.
This Technical Guidance Material aims to assist the owner/operator in generating the
approximate relationships between IAS and CAS for their aircraft. Information is entered
into the accompanying Excel spreadsheet and the calibration graphs will automatically be
generated for your system. You can then print these graphs for reference. These
relationships are subject to potential errors present in the tests used to obtain them, but
2
have been shown to be representative of reality (within about 1.5mph in their applicable
range) when applied to another aircraft in the fleet.
Note that if any changes have been made to the cabin, doors or pitot-tube of the aircraft,
these will affect the validity of this method.
2. DETERMINATION OF INSTRUMENT ERROR FOR YOUR ASI
The procedure to determine the instrument error present for your ASI is a relatively simple
one but must be done carefully and accurately. It requires 2 people to accomplish and
involves applying a pressure to the pitot tube to simulated a calibrated airspeed. This will
generate a certain indicated airspeed on the instrument. This is done for multiple values all
the way up and down the speed scale while recording the pressures corresponding to each
indicated airspeed. Upscale and downscale readings are taken as, for example, the needle of
the ASI may lag behind the movement of the pressure capsule due to mechanical free play
in the linkages. This could mean that the indicated airspeed for a given calibrated airspeed
in flight could vary depending on the movement of the linkages in the instrument before
reaching that airspeed, and so it is important to determine the magnitude of this effect.
Equipment:
• Calibrated differential manometer.
• Means to apply a pressure to the pitot tube (such as a small syringe).
• Rubber/silicone tubing of roughly 4mm internal diameter.
• T-piece connector to connect the syringe and manometer to the pitot tube.
• Tie-wraps.
Method:
1. Connect one end of the differential manometer to the t-piece connector using
a length of rubber tubing. Secure a syringe to a free leg of the t-piece
connector with another piece of rubber tube.
2. Zero the reading on the manometer. If there is no zeroing function, note the
zero-IAS pressure reading as an entry in Column 1 for an IAS of zero.
3
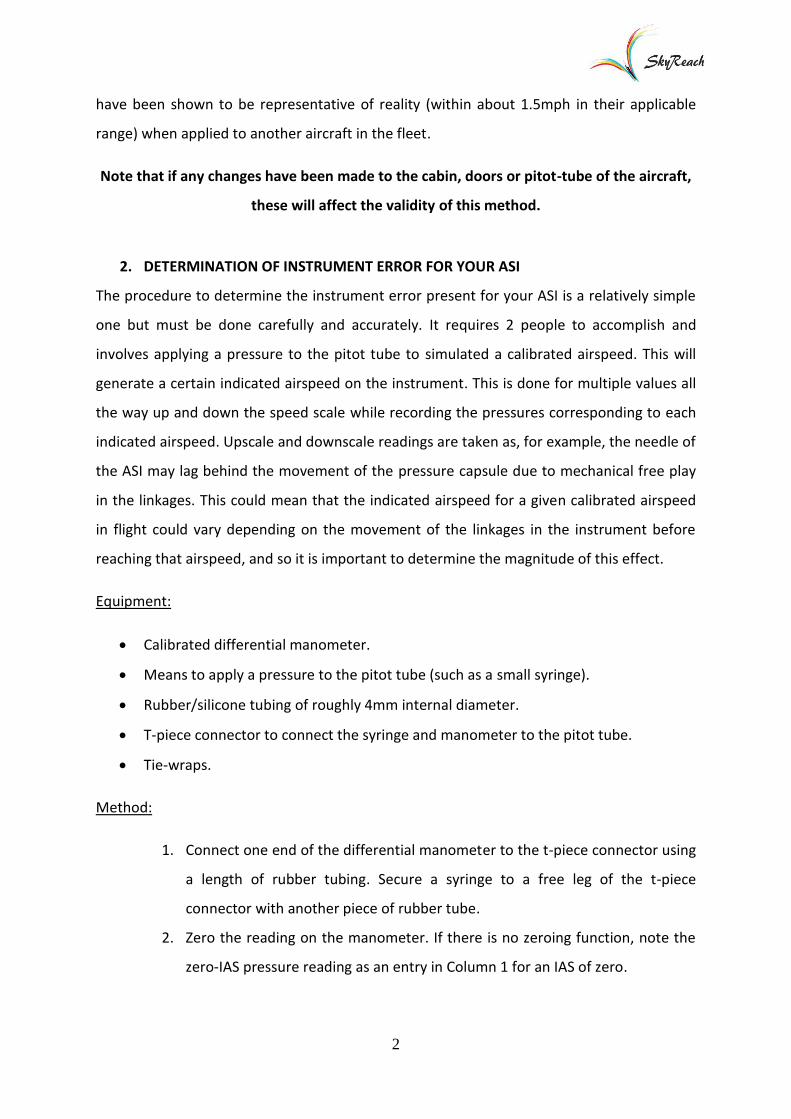
3. Carefully attach the last end of the t-piece connector to the pitot tube itself
with a third length of rubber tubing. When attaching the arrangement to the
pitot tube, ensure that the plunger of the syringe is inserted and on its lower
stop. Use tie-wraps to secure each connection.
Figure 1 Arrangement of instrument calibration system
4. Have someone sit in the cabin viewing the ASI as the pilot would in flight. The
second person must then slowly apply pressure to the syringe until the needle
on the ASI reads the closest round value (usually about 20 to 25mph for
analogue instruments). The person in the cabin calls when the desired value
has been reached (record this in Column 1 of Appendix A, or the spreadsheet
provided).
5. Hold the syringe steady (the friction on the plunger should be sufficient for
you to let it go). Let the pressure value stabilise.
i. Note that leaks will be evident by a steadily decreasing pressure value
on the differential manometer. If the leak rate exceeds approximately
5-10 Pascals per second, it is likely that the pitot line itself has a leak
and will have to be changed.
ii. If the desired airspeed value on the ASI is overshot (for example, the
needle indicates 22mph, rather than the desired 20), the pressure on
4
the system must be reduced to about 5mph below the intended value
(15mph for the example given), before pressure is reapplied to obtain
the correct value.
6. Record the reading on the differential manometer in Column 2of the sheet
provided in the Appendix A.
7. Gradually apply pressure to the syringe to obtain the next speed value on the
ASI and repeat the process. Go up in 5mph increments until at least 90mph. A
5ml syringe should be just sufficient to obtain the pressure required for this.
8. Once the highest speed has been obtained, gradually reduce pressure on the
syringe until the next round number below it has been obtained.
9. Continue back down the speed scale taking pressure readings at the same
values that you took going up the speed scale (completing Column 3, but from
bottom to top).
i. Note again that if the desired airspeed value on the ASI is overshot
while reducing pressure (for example, the needle indicates 83mph,
rather than the desired 85), the pressure on the system must be
increased to about 5mph above the intended value (90mph for the
example given), before pressure is slowly reduced again to obtain the
correct value.
ii. Once the applied pressure has been reduced to zero (plunger of
syringe is completely removed from cylinder) note the zero reading
on the manometer again in the zero IAS row.
Section intentionally left blank.
5
3. GENERATING THE IAS-CAS RELATIONSHIP FOR YOUR AIRCRAFT
Now that the pressure measurements are complete, Columns 1 to 3 of the sheet should be
populated with values. This section details the calculation of Columns 4 to 19 in order to
generate the relationship for your aircraft. This section requires some calculation and can be
done manually with a pocket calculator, or using the spreadsheet provided.
1. Columns 4 and 5: Convert each measured upscale and downscale pressure to
the CAS that it corresponds to (denoted as Vqc) using the formula below. If
there was a zero IAS pressure reading during the calibration, subtract this
from the measured pressure (as per the formula). Note that this assumes that
your ASI has been designed for sea level in the International Standard
Atmosphere (ISA). If the difference between Vqc for the upscale and
downscale values is less than 1mph (as it should be for an EFIS type system),
average the two values for each IAS and use those averages for the remainder
of the calculations (rather than continuing the calculations for both upscale
and downscale columns). Note that pressure values must be in Pascals for
this formula to apply.
𝑉𝑞𝑐 = 2.8583√(𝑀𝑒𝑎𝑠𝑢𝑟𝑒𝑑 𝑃𝑟𝑒𝑠𝑠𝑢𝑟𝑒 − 𝑍𝑒𝑟𝑜 𝐼𝐴𝑆 𝑝𝑟𝑒𝑠𝑠𝑢𝑟𝑒) 𝑖𝑛 𝑚𝑝ℎ (1)
2. Columns 6 and 7: The instrument error (Eins) is then calculated for each
measured pressure as follows.
𝐸𝑖𝑛𝑠 = 𝐼𝐴𝑆 − 𝑉𝑞𝑐 (2)
3. Columns 8 to 11: Rainbow SkyReach has conducted in-flight calibrations to
estimate the position error present for a factory-built aircraft. Equations to
calculate the position error for both descent and level flight are given below.
Note that these equations are only applicable for values of Vqc between
50mph and 75mph, but serve as good estimates at speeds below 50mph.
6
𝑫𝒆𝒔𝒄𝒆𝒏𝒕: 𝐸𝑝𝑜𝑠 = 0.3189 × 𝑉𝑞𝑐 − 17.805 (3)
𝑳𝒆𝒗𝒆𝒍: 𝐸𝑝𝑜𝑠 = 0.3182 × 𝑉𝑞𝑐 − 15.455 (4)
4. Columns 12 to 15: The final step is to estimate what the indicated airspeed in
flight would be for the CAS that was simulated by applying a pressure to the
pitot tube. This done using the following formula.
𝐼𝐴𝑆 = 𝑉𝑞𝑐 + 𝐸𝑖𝑛𝑠 + 𝐸𝑝𝑜𝑠 (5)
5. A plot of IAS (Columns 12 to 15) on the x-axis, versus Vqc(Columns 4 and 5) on
the y-axis, can now be produced for both upscale and downscale calibrations.
This is the approximate IAS-CAS relationship for your aircraft. This method has
been applied to other aircraft with different ASIs and has been shown to yield
results that agree to within 1.5mph of flight determined calibrations.
i. Note: If the difference between your upscale and downscale readings
is large, this implies that a given indicated airspeed on your ASI could
correspond to a range of CAS values.
6. Columns 16 to 19: If the difference between upscale and downscale readings
is relatively small, the average of the upscale and downscale IAS values can be
plotted against the average of the upscale and downscale values of Vqc. This
can be done for both descent and level flight.
i. Note that the readings in flight can vary about this calculated average.
If, for example, the difference between upscale and downscale IAS in
Columns 12 and 13 is 2mph, then in flight the actual IAS obtained for
a given CAS can vary by 1mph either side of this average.
Once the total calibration procedure is complete you should end up with 3 graphs depicting
important information relating to the calibration. A sample set of data were used to present
examples of these graphs.
7
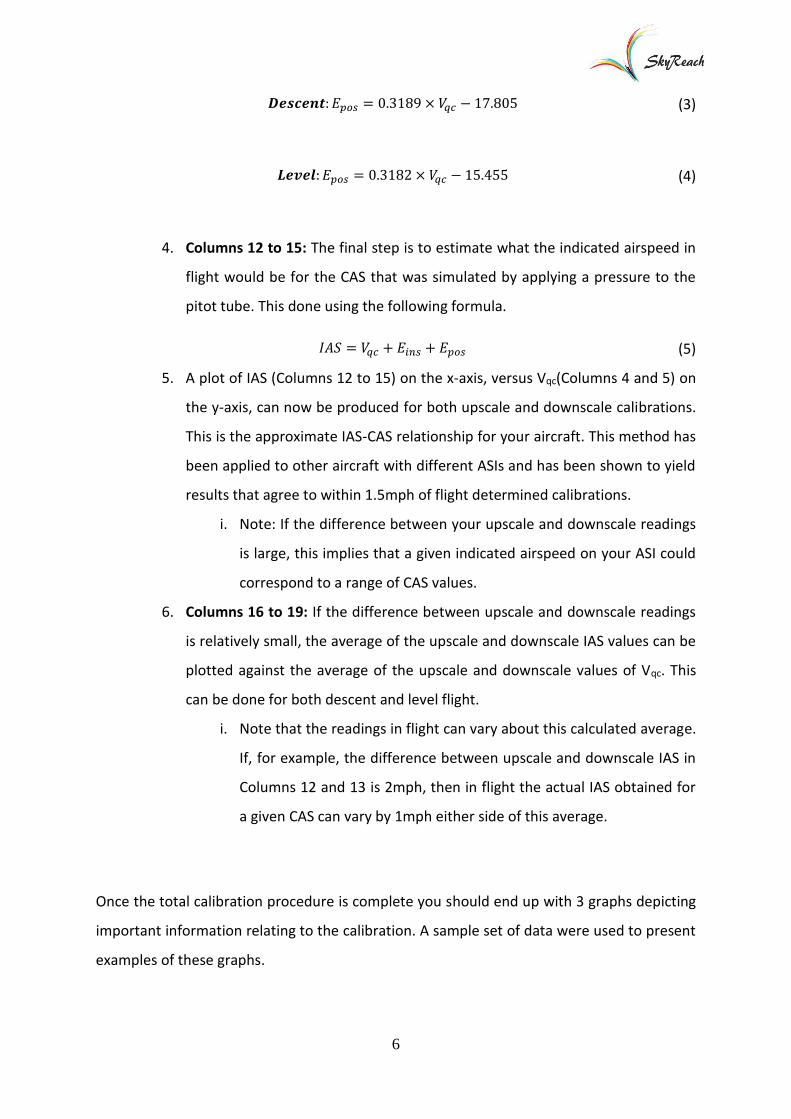
Figure 2 shows the instrument error present for a sample ASI. For this aircraft, the spread
between upscale and downscale readings was about 5mph on average. Negative values
represent an overread error. Thus, for this example aircraft, the ASI would overread by
between 0.5 and 6.5 mph when it is indicating 40mph (and so the real value, excluding any
position error, would be between 40.5mph and 46.5mph).
Figure 2 IAS instrument error sample
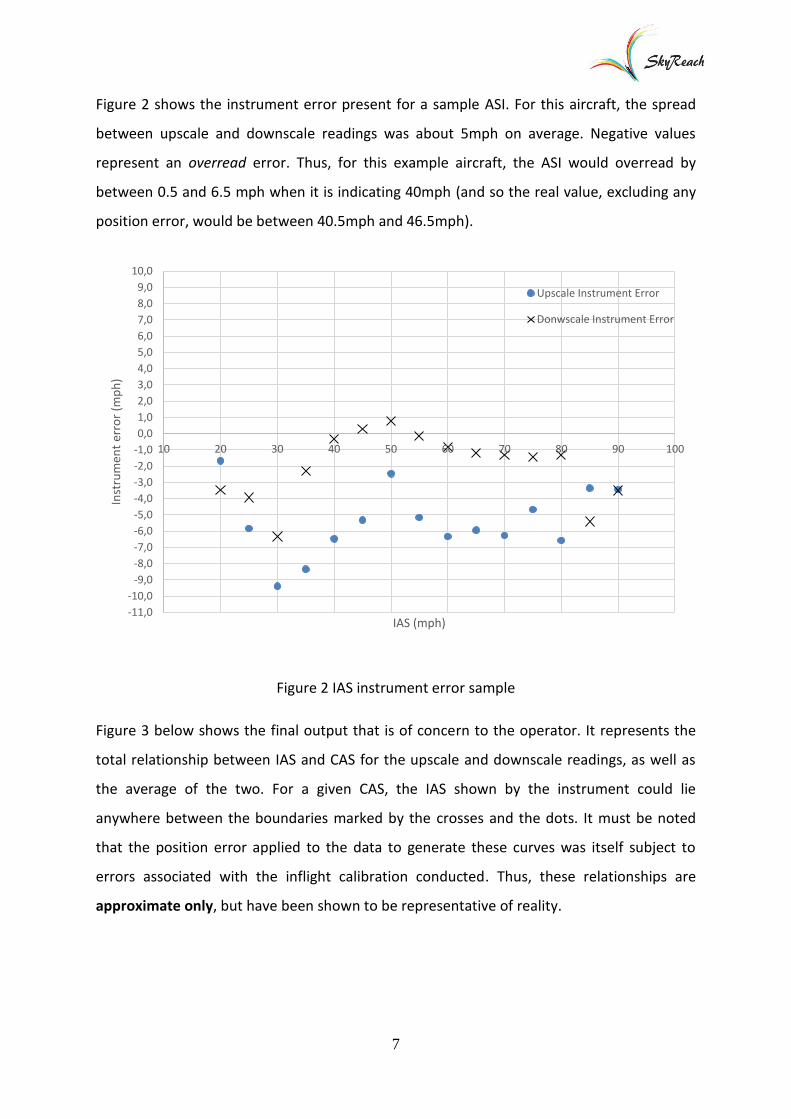
Figure 3 below shows the final output that is of concern to the operator. It represents the
total relationship between IAS and CAS for the upscale and downscale readings, as well as
the average of the two. For a given CAS, the IAS shown by the instrument could lie
anywhere between the boundaries marked by the crosses and the dots. It must be noted
that the position error applied to the data to generate these curves was itself subject to
errors associated with the inflight calibration conducted. Thus, these relationships are
approximate only, but have been shown to be representative of reality.
-11,0
-10,0
-9,0
-8,0
-7,0
-6,0
-5,0
-4,0
-3,0
-2,0
-1,0
0,0
1,0
2,0
3,0
4,0
5,0
6,0
7,0
8,0
9,0
10,0
10 20 30 40 50 60 70 80 90 100
Inst
rum
ent
erro
r (m
ph
)
IAS (mph)
Upscale Instrument Error
Donwscale Instrument Error
8
More accurate relationships can be determined using flight test methods that are beyond
the scope of this text.
Figure 3Sample relationship between IAS and CAS for power off descent
Section intentionally left blank.
30,0
35,0
40,0
45,0
50,0
55,0
60,0
65,0
70,0
75,0
80,0
30,0 35,0 40,0 45,0 50,0 55,0 60,0 65,0 70,0 75,0 80,0
Des
cen
t C
AS
(mp
h)
IAS (mph)
Downscale CAS
Upscale CAS
Average line
Zero-error line
9
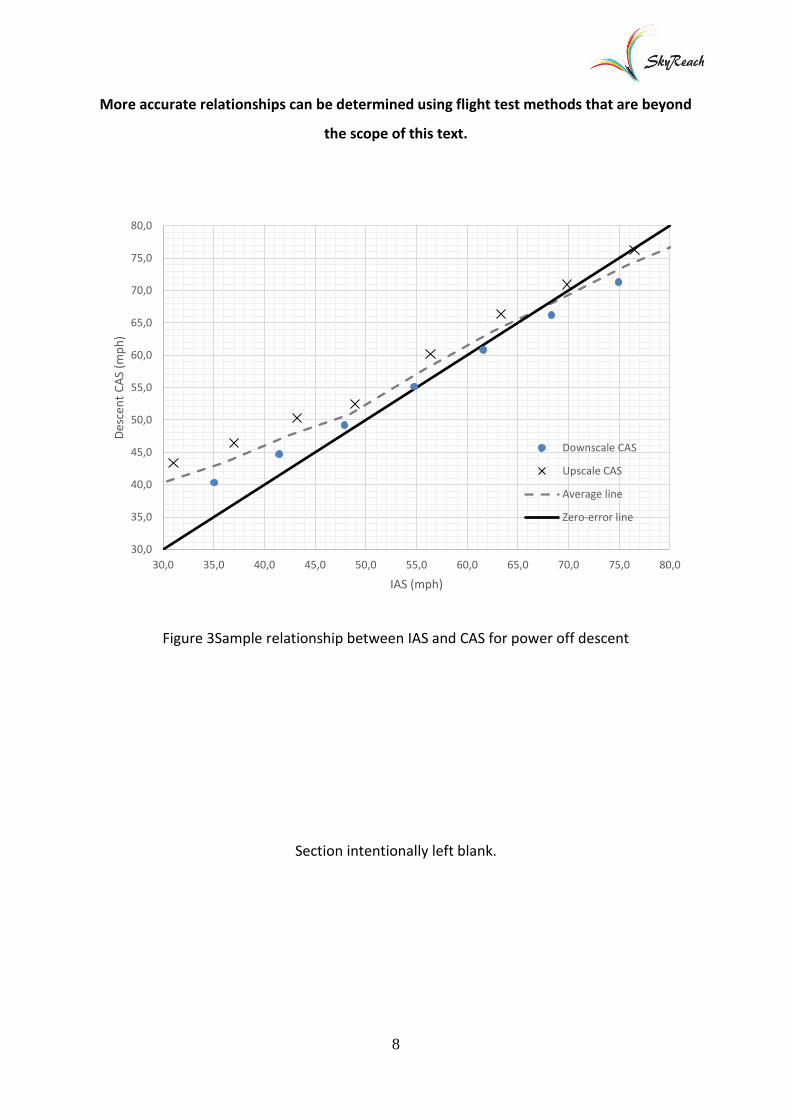
4. CORRECT ALIGNMENT OF THE PITOT TUBE
The flight determined position error data were captured with the pitot tube aligned in the
position as shown in the Figures below. The angular alignment of the pitot tube mounting
bracket can be adjusted to obtain the correct position.
Looking directly down the tube from the front, align the tube with the zip on the bottom
surface of the wing, as shown below.
Figure 4 Longitudinal alignment of pitot tube
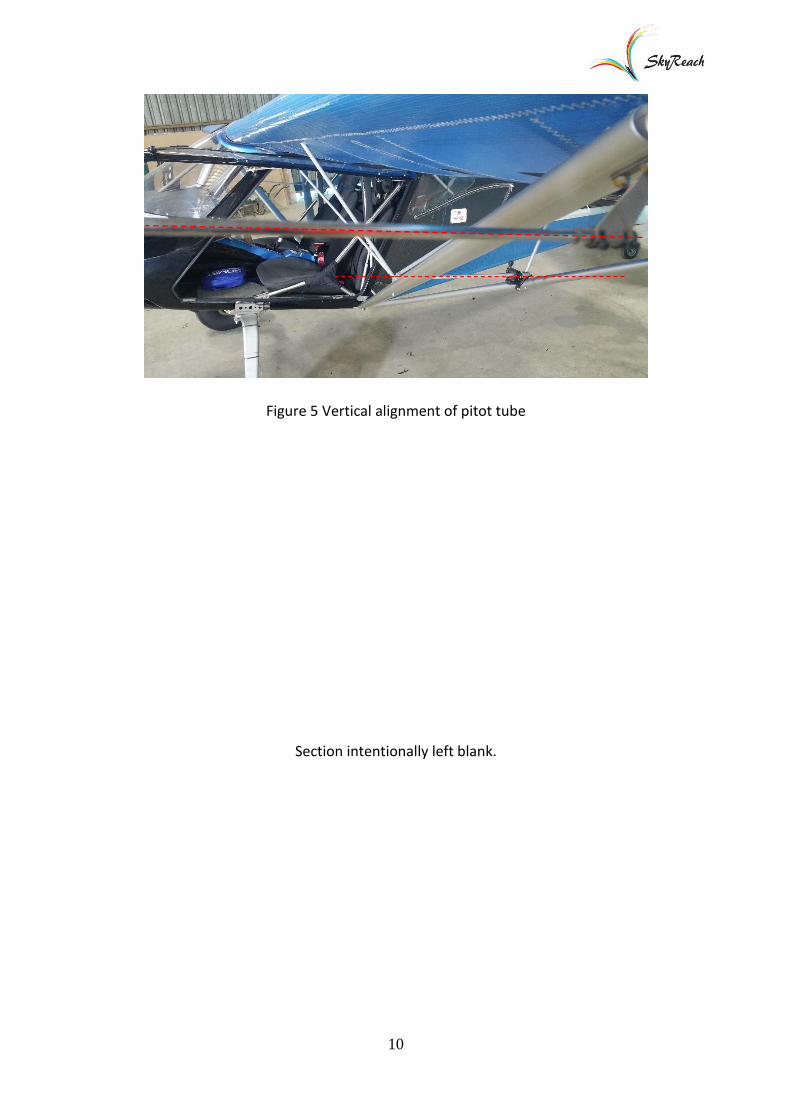
Looking at the pitot tube from the outboard side, align it with the horizontal jury strut sitting
between the two main struts of the wing, as shown by the dashed red lines in Figure 5
below. These checks can be incorporated in the pre-flight check to ensure correct alignment
before each flight. Care should be taken when removing and replacing the pitot cover during
operational flying to keep prevent misaligning the pitot tube.
10
Figure 5 Vertical alignment of pitot tube
Section intentionally left blank.
11
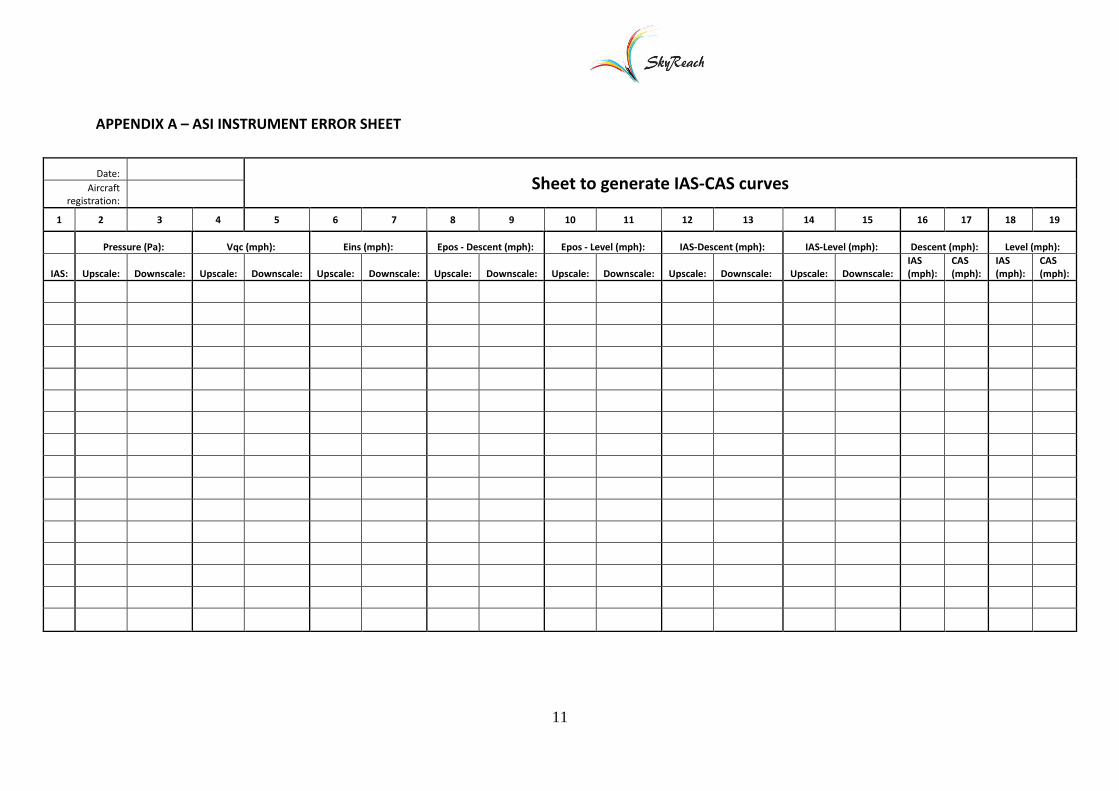
APPENDIX A – ASI INSTRUMENT ERROR SHEET
Date: Sheet to generate IAS-CAS curves Aircraft
registration:
1 2 3 4 5 6 7 8 9 10 11 12 13 14 15 16 17 18 19
Pressure (Pa): Vqc (mph): Eins (mph): Epos - Descent (mph): Epos - Level (mph): IAS-Descent (mph): IAS-Level (mph): Descent (mph): Level (mph):
IAS: Upscale: Downscale: Upscale: Downscale: Upscale: Downscale: Upscale: Downscale: Upscale: Downscale: Upscale: Downscale: Upscale: Downscale: IAS (mph):
CAS (mph):
IAS (mph):
CAS (mph):


![Countersink Depth Gage Calibration Instructions - Trulok · Depth Gage Calibration Instructions Indicator model: 543-342BTL . Turn the indicator on by pressing the [ON/OFF] button](https://img.pdfslide.us/doc/110x75/5ce1542c88c993700d8c1c78/countersink-depth-gage-calibration-instructions-depth-gage-calibration-instructions.jpg)