Embed Size (px)
Citation preview
Airports of Thailand Plc.Airports of Thailand Plc.ForFor 66 Months ofMonths of Fiscal YearFiscal Year 20142014For For 6 6 Months of Months of Fiscal Year Fiscal Year 20142014
(October (October 2013 2013 –– March March 20142014))
Investor Relations Center, E-mail: [email protected], Tel: (662) 535-5900, Fax (662) 535-5909

Disclaimer
This presentation is intended to assist investors to better understanding the company’sThis presentation is intended to assist investors to better understanding the company s business and financial status.
This presentation may contain forward looking statements relate to analysis and other information which are based on forecast of future results and estimates of amounts notinformation which are based on forecast of future results and estimates of amounts not yet determinable.
These statements reflect our current views with respect to future events which relate to our future prospects developments and business strategies and are not guarantee ofour future prospects, developments and business strategies and are not guarantee of future performance.
Such forward looking statements involve know and unknown risks and uncertainties.
The Actual result may differ materially from information contained in these statements.
2

Airports in ThailandTotal of 38 airports
Airports of Thailand Public Company Limited 1 2 in Bangkok and perimeter
MAE FAH LUANG-CHIANG RAI INTERNATIONAL AIRPORT CHIANG MAI
INTERNATIONAL AIRPORT
Pai
Sukhothai Nakhon Phanom
Udon Thani
Loei
LampangPhrae
NanMae Hong Son
Tak
2 in Bangkok and perimeter o Suvarnabhumi Airport (BKK) o Don Muang International Airport (DMK)
4 international airports at regional sites
Pai
Ubon RatchathaniBuri RamNakhon Ratchasima
Sakon Nakhorn
Roi Et
Khon KaenPhetchabun
PhitsanulokMae Soto Chiang Mai International Airport (CNX)
o Phuket International Airport (HKT) o Hat Yai International Airport (HDY)o Mae Fah Luang-Chiang Rai International Airport (CEI) 2
DON MUANG INTERNATIONALAIRPORT
SUVARNABHUMISUVARNABHUMI AIRPORTAIRPORT
Surin
Bangkok Airways Airports
DCA Airports
AOT AirportsU-Tapao
Hua Hin
Ch
Trad
Department of Civil Aviation (DCA) o 28 regional airports
R l Th i N
SUVARNABHUMISUVARNABHUMI AIRPORTAIRPORT
Royal Thai Navy Airport
Chumpon
Samui
Nakhon Si Thammarat
Ranong
Surattani
Royal Thai Navyo U-Tapao Pattaya International Airport
Bangkok Airways Companyo Sukhothai Airport
HAT YAI
INTERNATIONAL Krabi
Trang PattaniNarathiwat
o Sukhothai Airporto Samui Airporto Trad Airport
PHUKET INTERNATIONAL AIRPORT
AIRPORT
Note: 1. AOT’s traffics account for 83% of Thailand’s air traffics.2 Changing from Chiang Rai International Airport to Mae Fah2.Changing from Chiang Rai International Airport to Mae Fah
Luang–Chiang Rai International Airport since March 13, 2010.
3

Business OverviewFact Sheet Listed on 11 March 2004 Shares outstanding 1,428.57 Million Shareholders
Shareholders Information (As of April 4, 2014)
1. MINISTRY OF FINANCE 70.000%
2 THAI NVDR COMPANY LIMITED 5 171% Shareholders•Ministry Of Finance 70%•Free Float 30%
Average Daily Market Cap (Oct 13 – Mar 14)•BHT 265 777 90 Million
2. THAI NVDR COMPANY LIMITED 5.171%
3. STATE STREET BANK EUROPE LIMITED 2.098%
4. HSBC (SINGAPORE) NOMINEES PTE LTD 1.225%•BHT 265,777.90 Million
5. SOCIAL SECURITY OFFICE (2 CASES) 1.184%
6. STATE STREET BANK AND TRUST COMPANY 0.794%Fiscal Year
EPS (Baht)1
(The Company)Dividend per share
(Baht)
Dividend payout ratio
Dividend Yield
7. THE BANK OF NEW YORK (NOMINEES) LIMITED 0.677%
8. GOVERNMENT PENSION FUND (EQ-TH) 0.677%
9. J.P. MORGAN IRELAND (NOMINEES) LIMITED 655 0.558%
(Baht) ratio
2007 0.84 0.40 47.61% 0.64%
2008 5.15 2.58 50.09% 8.32%
Dividend Policy
9. J.P. MORGAN IRELAND (NOMINEES) LIMITED 655
10. MORGAN STANLEY & CO. INTERNATIONAL PLC 0.549%2009 0.60 0.42 70.00% 0.99%
2010 1.05 0.55 52.38% 1.33%
Not less than 25% of net profit of the company for each year after deduction of all specified reserves, subject to our investment plans and other considerations that our Board of Directors deems
2011 1.82 0.80 43.96% 2.03%
2012 4.54 1.80 39.65% 2.26%considerations that our Board of Directors deems appropriate
4Note: 1. EPS using for calculating the dividend is from the company financial statements.
2013 11.43 4.60 40.23% 2.44%

Aircraft Movement Statistics (6 months)
(Unit: Thousand)
AOT Traffics LCCs Traffics
559.42 184.99
(Unit: Thousand) • Domestic (3 airlines)
Thai Air Asia
Nok Air
Major LCCs Airline
92 10102.66
118.09193.05 211.75242.90
143 81
116.40132.73
316.67
441.44 480.34 152.80
276.67 89.91
One-Two-Go/Orient
Thai Airlines
• International (22 airlines)
Air Asia
Thai Air Asia
40.63 50.14 66.9030.88 40.35
92.1059.03
76.05
248.39 268.59 316.52
154.44 172.86
122.23 143.81
FY
Thai Air Asia
Tiger Airways
Jetstar Asia
Jetstar Airways
CEBU Pacific Air2011 2012 2013 6M 2013 6M 2014
International Domestic2011 2012 2013 6M 2013 6M 2014
International Domestic
FY FYIndonesia Air Asia
Condor Flugdienst
Jeju Air
Jin AirFi fl
6M 2013 6M 2014 YoY%
BKK 141 544 155 289 9 71%
6M 2013 6M 2014 YoY%
BKK 8 596 12 739 48 20%Firefly
Tomsonfly
IndiGO Airlines
Eastar Jet
T'Way Airlines
BKK 141,544 155,289 9.71%
DMK 66,909 82,412 23.17%
BKK+DMK 208,453 237,701 14.03%
CNX 21,300 26,117 22.62%
BKK 8,596 12,739 48.20%
DMK 51,579 67,101 30.09%
BKK+DMK 60,175 79,840 32.68%
CNX 8,936 12,055 34.90%T Way Airlines
Scoot
Spring Airlines
Mandala Airlines
Golden Myanmar Airlines
HDY 8,444 9,332 10.52%
HKT 34,782 38,652 11.13%
CEI 3,688 4,872 32.10%
HDY 6,682 7,727 15.64%
HKT 11,845 13,471 13.73%
CEI 2,268 3,302 45.59%
5
Note: 1. Fiscal Year starting from October to September2. The percentage growth as shown is calculated from
the full number of the air traffic statistics
Juneyao Airlines
VietJetAir Norwegian Air Shuttle
Total 276,667 316,674 14.46% Total 89,906 116,395 29.46%
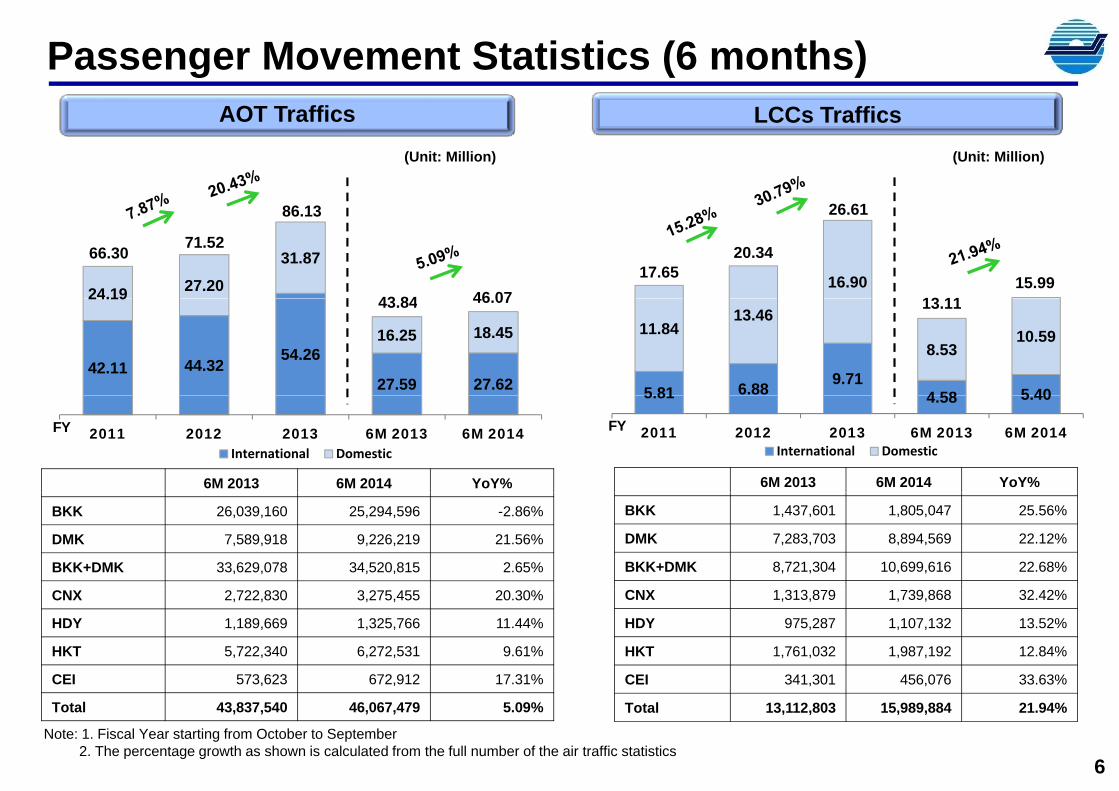
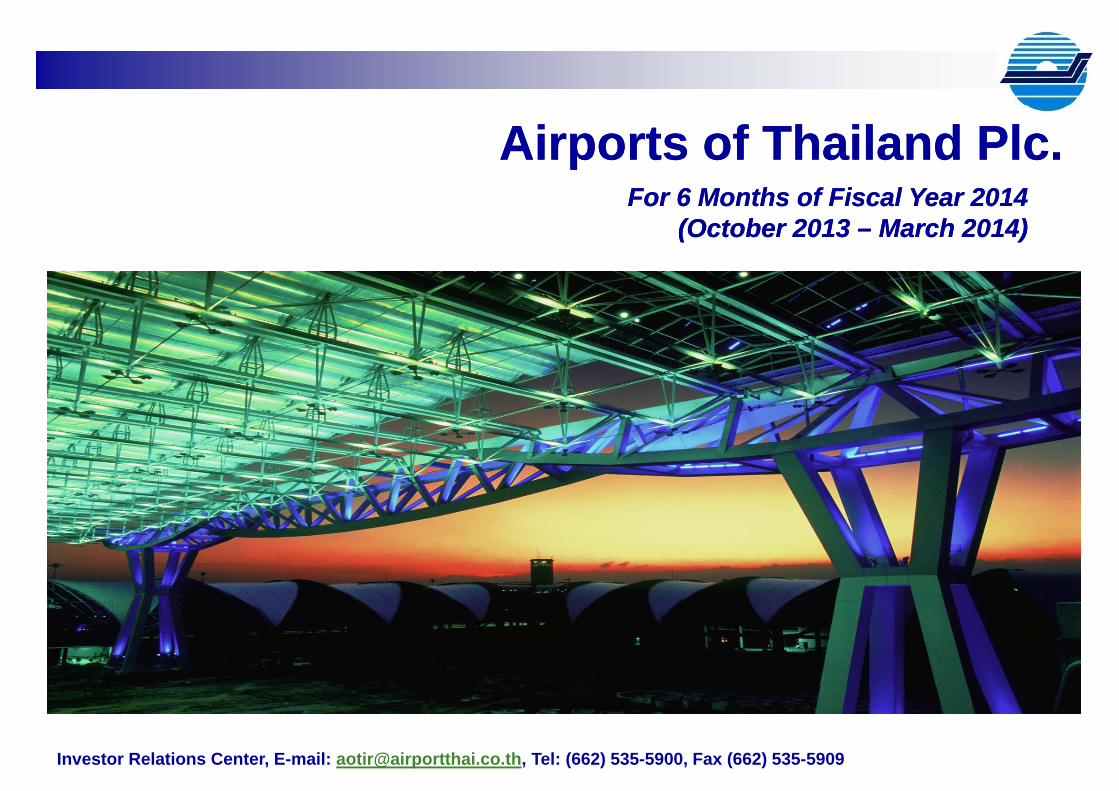
Passenger Movement Statistics (6 months)AOT Traffics LCCs Traffics
(Unit: Million)(Unit: Million)
16.9024.19 27.20
31.87
43 84
66.30
13 11
17.65
86.13
20.3471.52
26.61
46 0715.99
5 81 6.88 9.714 58 5 40
11.8413.46
8.5310.59
42.11 44.32 54.26
27.59 27.62
24.19
16.25 18.45
43.84 13.1146.07
5.81 4.58 5.40
2011 2012 2013 6M 2013 6M 2014International Domestic
2011 2012 2013 6M 2013 6M 2014International Domestic
FY FY
6M 2013 6M 2014 YoY% 6M 2013 6M 2014 YoY%
BKK 26,039,160 25,294,596 -2.86%
DMK 7,589,918 9,226,219 21.56%
BKK+DMK 33,629,078 34,520,815 2.65%
BKK 1,437,601 1,805,047 25.56%
DMK 7,283,703 8,894,569 22.12%
BKK+DMK 8,721,304 10,699,616 22.68%
CNX 2,722,830 3,275,455 20.30%
HDY 1,189,669 1,325,766 11.44%
HKT 5,722,340 6,272,531 9.61%
CEI 573,623 672,912 17.31%
CNX 1,313,879 1,739,868 32.42%
HDY 975,287 1,107,132 13.52%
HKT 1,761,032 1,987,192 12.84%
CEI 341,301 456,076 33.63%
6Note: 1. Fiscal Year starting from October to September
2. The percentage growth as shown is calculated from the full number of the air traffic statistics
, ,
Total 43,837,540 46,067,479 5.09%
, ,
Total 13,112,803 15,989,884 21.94%

Monthly Air Traffic Movements: FY 2010 - 2014(Unit: Thousand)(Unit: Thousand)
50
55
60
FY 2010
Aircraft Movements35
40
45FY 2010
FY 2011
FY 2012
25
30
35
ct v c n b r pr y n ul g p
FY 2013
FY 2014
(Oct-Mar)
(Unit: Million)
Oct Nov Dec Jan
Feb Mar AprMay Ju
n Jul
Aug Sep
8
9
Passenger Movements6
7
8FY 2010
FY 2011
FY 2012
4
5 FY 2013
FY 2014
(Oct-Mar)
7
3
Oct Nov Dec Jan
Feb Mar AprMay Ju
n Jul
Aug Sep
(Oct Mar)

Airport Revenues (6M FY2014)
Landing & Parking Charges 20% increased on Jan 1st, 2005
15% increased on Apr 1st, 2007Aeronautical
Passenger Service Charges (PSC) Effective on Feb 1st, 2007
THB 500 to THB 700 - International PSC
THB 50 to THB 100 Domestic PSC
Aeronautical
59%
(For 6M FY2014) THB 50 to THB 100 - Domestic PSC
Aircraft Service Charges Fees paid by airlines for use of boarding bridges, varies by maximum take off weight of the aircraft and length of time at a gate
(For 6M FY2014)
Office & State Property Rental Rental tenants include airline, government agencies and concession tenants. Rents are determined based on the tenants’ business use at each of our airports.
Service Varies by activities such as Utilities, Check-in Counter Services, Airline Announcement Services, Hydrant
Non-Aeronautical
41%System Services, etc.
Concession Varies by activities such as Duty Free, Souvenirs, Food & Beverage, Airline Catering, Fueling Services, Car Parking, Advertising, Banking, etc.
41%
(For 6M FY2014)
8

Revenues Breakdown (6M FY2014)
12 9%
Total Revenue By proportion(Unit: Million)
6M FY2013 6M FY201412.59%
25.22%14.29%
25.72%
28 640 6930,405.28
36,810.41
45.96%
1 49%
4.82%
9.92%43.48%
1.48%4.54%
10.49%28,640.69
18,367.3419,813.47
1.49%
By Growth(Unit: Million Baht)
2011 2012 2013 6M 2013 6M 2014
FY2011 FY2012 FY2013 6M FY13 6M FY14 YoY
LPC 4,370.34 4,755.88 4,760.80 2,311.77 2,832.17 22.51%
PSC 12,334.06 13,183.06 16,684.47 8,441.51 8,615.13 2.06%
(Unit: Million Baht)
L di & P ki h (LPC)
FY
ASC 465.00 489.27 534.31 274.15 292.68 6.76%
OPR 1,718.26 1,593.08 1,756.52 884.84 899.75 1.69%
SVR 3,311.25 3,303.21 3,775.01 1,822.18 2,077.76 14.03%
CCR 6 441 77 7 080 78 9 299 29 4 632 90 5 095 98 10 00%
Landing & Parking charges (LPC)
Passenger service charges (PSC)
A/C Service charges (ASC)Office and state property rents (OPR)
CCR 6,441.77 7,080.78 9,299.29 4,632.90 5,095.98 10.00%
Total 28,640.69 30,405.28 36,810.41 18,367.34 19,813.47 7.87%
9Note: Fiscal Year starting from October to September
Service revenues (SVR)
Concession revenues (CCR)

Airport Operating ExpensesEmployee Benefit Expenses Consisting of :
- employee salaries and bonuses, employee benefits, retirement payments and contributions to employee provident fund
th ti f AOT’ b d f di t d ti- the remuneration of AOT’s board of directors and executives as stated in the notice of Capital Market Supervisory Board
Utilities Expenses Consisting of electricity charges, cooling water system and water supply.
Outsourcing Expenses Consisting of security, limousine service, cleaner, gardener, trolley and etc.
Repairs and Maintenance Consisting of repair and maintenance of runways and taxiways, elevators, escalators and cover walkways, air conditioning systems, conveyor belts, transportation equipment and construction and electrical appliances.
State Property Rental Consisting of rental payments made to the Ministry of Finance under the airport land leases.
Depreciation and Amortization Consisting of depreciation charges in respect of the property, plant and equipment as well as amortization in respect of the intangible assets. Calculating on a straight-line basis over the assets’ useful lives (between 5 and 50 years).
10

Expenses Breakdown (6M FY2014)
24.88%27 20%
By proportion(Unit: Million)
Total Operating Expenses
6M FY2013 6M FY201419 910 32 24.88%27.20%
17,505.0718,948.7219,910.32 23.68%
12 64%
29.71%
13.81%
15.77%9.26%
9.08%
8,674.06 9,263.02
12.64%
14.94%9.92%
9.11%
2011 2012 2013 6M 2013 6M 2014
By Growth(Unit: Million Baht)FY 2011 2012 2013 6M 2013 6M 2014 ( )
FY2011 FY2012 FY2013 6M FY13 6M FY14 YoY
Employee 4,150.22 4,612.82 5,303.16 2,158.29 2,193.11 1.61%
Utilities 1,954.43 2,091.37 2,418.10 1,198.27 1,170.88 (2.29%), , , , , ( )
Outsourcing 2,387.93 2,518.00 2,821.85 1,367.66 1,384.48 1.23%
R&M 2,304.69 2,303.96 2,040.22 802.93 919.00 14.46%
SPR 1,247.40 1,310.02 1,590.15 787.85 843.52 7.07%
Employee Benefit expensesUtilities expenses
Repairs and maintenance (R&M)State property rental (SPR)
Outsourcing expenses
11
D&M 7,865.65 4,668.88 4,775.23 2,359.06 2,752.03 16.66%
Total 19,910.32 17,505.07 18,948.72 8,674.06 9,263.02 6.79%
State property rental (SPR)Depreciation and amortization (D&M)

( ll h )
Statements of Income (6M FY2014)(Unit: Million Baht)
FY2011 FY2012 FY2013 6M FY 2013 6M FY 2014
Total revenues 29 561 28 32 475 17 41 689 68 21 800 33 20 925 64Total revenues 29,561.28 32,475.17 41,689.68 21,800.33 20,925.64
Revenues from sales or services 28,640.69 30,405.28 36,810.41 18,367.34 19,813.47
Other incomes 920.59 2,069.89 4,879.27 3,432.98 1,112.17
Total expenses 25,894.55 22,474.96 20,463.41 11,107.67 11,381.80
Profit before income tax 3,666.73 10,000.21 21,226.27 10,692.66 9,543.84
Income tax expense 1,182.31 3,494.19 4,869.48 2,737.39 2,032.02
Net Profit 2,528.30 6,499.75 16,347.35 7,941.15 7,467.89
Total one-off items (1,896.00) (443.55) 6,395.07 2,534.61 104.72
Gain (Loss) from Exchange Rates (1,538.12) 222.74 3,134.90 2,652.65 135.93
Gain (Loss) on Reverse Impairment (357 88) (666 29) 3 260 17 (118 04) (31 21)Gain (Loss) on Reverse Impairment (357.88) (666.29) 3,260.17 (118.04) (31.21)
Normalized Profit 4,424.30 6,943.30 9,952.28 5,406.54 7,363.17
12

Financial Status
30 Sep 2013 31 Mar 2014
STATEMENTS OF FINANCIAL POSITION STATEMENTS OF CASH FLOW
Beginning Cash 6,612.84(Unit: Million Baht) (Unit: Million Baht)
Cash 6,617.68 4,762.63
Other Current Asset 36,914.51 38,519.57
Cash Flow from Operation 9,084.03
Cash Used in Investment (1,302.00)
C h U d i Fi i (9 632 24)Other Current Asset 36,914.51 38,519.57
Non Current Asset 109,528.76 107,382.24
Total Assets 153 060 95 150 664 44
Cash Used in Financing (9,632.24)
Ending Cash 4,762.63
(As of Mar 31, 2014)
Total Assets 153,060.95 150,664.44
Current Liabilities 19,452.02 17,916.81
Long Term Loan 37 324 98 34 634 24 Total Loan (Million Yen) 199 243 00
LONG-TERM LOANS
Long Term Loan 37,324.98 34,634.24
Other Non Current Liabilities 4,544.02 5,448.46
Total Liabilities 61 321 02 57 999 51
Total Loan (Million Yen) 199,243.00
Disbursed Amount (Million Yen) 194,409.73
Repayment Amount (Million Yen) (75,165.98)Total Liabilities 61,321.02 57,999.51
Shareholder’s Equity 91,739.93 92,664.93
T t l Li biliti &
Outstanding Amount (Million Yen) 119,243.75
Outstanding Amount (Million Baht) 37,964.59
13
Total Liabilities & Shareholder’s Equity 153,060.95 150,664.44 Hedged % of the remaining loan 94%
Average Interest Rate 4.86%

Financial Ratios
30 Sep 2010 30 Sep 2011 30 Sep 2012 30 Sep 2013 31 Mar 201430 Sep 2010
(FY2010)
30 Sep 2011
(FY2011)
30 Sep 2012
(FY2012)
30 Sep 2013
(FY2013)
31 Mar 2014
(6M FY2014)
Par Value (THB) 10 00 10 00 10 00 10 00 10 00Par Value (THB) 10.00 10.00 10.00 10.00 10.00
Market Price (THB) 41.50 39.50 79.50 188.50 194.00
BV/share 48.89 50.49 54.35 64.11 64.87
P/BV 0.85 0.78 1.46 2.94 2.99
EPS 1.43 1.55 4.55 11.44 5.23
P/E 29.02 25.48 17.47 16.48 17.46
D/E 1.03 1.08 0.92 0.67 0.63
ROA (%) 1 44 1 52 4 32 10 82 4 9ROA (%) 1.44 1.52 4.32 10.82 4.9
ROE (%) 2.92 3.12 8.68 19.32 8.1
14

Noise Compensation (Suvarnabhumi Airport Phase I)
NEF > 40
Proceeded(Unit: Million Baht)
(The cabinet resolution on May 29,2007)
Planned
Houses Amount
Purchased 131 672.61Summer Season (Unit: Houses)
Insulated 350 91.24
Total NEF> 40 481 763.85Total Impacted Houses10,918
Total Impacted Houses10,918
NEF 30 40
NEF > 40507
NEF > 40507
NEF 30-4010 412
NEF 30-4010 412
NEF 30 - 40Houses Amount
Insulated 9,404 1,883.59507507 10,41210,412
Total NEF30- 40 9,404 1,883.59
Sensitive Area 20 280 49Insulation358
Insulation358
Insulation10,412
Insulation10,412
Purchase149
Purchase149
Sensitive Area 20 280.49
KMITL 214.00
Grand total * 3,141.93
15
As of April30, 2014
,
Note: - * Accumulated from the first payment until April 30, 2014- KMITL is King Mongkut’s Institute of Technology Ladkrabang- NEF : Noise Exposure Forecast

Noise Compensation (Suvarnabhumi Airport Phase I)
ProceededPlanned
(Th bi t l ti A 31 2010)(Unit: Million Baht)
Winter Season (Unit: Houses)
(The cabinet resolution on Aug 31, 2010)NEF > 40
Houses Amount
Total Impacted Houses5 397
Total Impacted Houses5 397
Purchased 49 153.77
Insulated 74 23.09
Total NEF> 40 123 176.865,3975,397
NEF > 40NEF > 40 NEF 30-40NEF 30-40
NEF 30 - 40Houses Amount
NEF > 40133
NEF > 40133
NEF 30-405,264
NEF 30-405,264 Insulated 4,453 922.28
Total NEF30- 40 4,453 922.28
Sensitive Area 1 12.05
Grand total * 1,111.19
Insulation77
Insulation77
Insulation5,264
Insulation5,264
Purchase56
Purchase56
16
As of April 30, 2014Note: - * Accumulated from the first payment until April 30, 2014
- KMITL is King Mongkut’s Institute of Technology Ladkrabang- NEF : Noise Exposure Forecast

Future Airport Developments
Suvarnabhumi 1/ Investment Cost
(billion baht)Expected
TimeframeAdditional Capacity
1. Project Management 62.50 2011 - 2017 - 15 MAPj gConsultant (PMC)
2. 1st Midfield Satellite3. Apron around 1st Midfield
Satellite
- 28 contacted gates
Satellite4. South Tunnel and
Automated People Mover5. Main Terminal Extension6. Parking Garage and Airlines
Office7. Utilities
Phuket Investment Cost
(billion baht)Expected
TimeframeAdditional Capacity
1 N I t ti l 5 79 2009 2014 6 MAP
Note : 1/ The cabinet already approved on Aug 31, 2010
1. New International Passenger Terminal
2. Renovation of the Existing Terminal
5.79 2009 - 2014 - 6 MAP
- 4 contacted gates
17
3. Apron4. Other related facilities

Commercial Projects
Don Muang International Airport
• Private Jet TerminalSuvarnabhumi Airport
• Community MallPhuket International Airport
• Private Jet Terminal
• Community Mall• Central Warehouse• Hotel• Hospital • Private Jet Terminalp• Office Building • Exhibition Center• Export Exhibition Center Chiang Mai International Airport
• Private Jet Terminal
18

Appendix A: Airport Capacity vs. Utilization
Aircraft(Flights/Hour)
Passengers(Million/Year)
Cargoes(Million Metric Tons/Year)
Airport CapacityActual Utilization
CapacityActual Utilization
CapacityActual Utilization
FY12 FY13 FY12 FY13 FY12 FY13
BKK 68 66 59 45.0 52.37 50.90 1.700 1.357 1.232
DMK 44 23 39 18 5(T1) 2 72 15 56 0 860 0 004 0 017DMK 44 23 39 18.5(T1) 2.72 15.56 0.860 0.004 0.017
HKT 20 19 22 6.5 9.16 10.98 0.036 0.032 0.034
CNX 24 14 16 8 0 4 33 5 17 0 035 0 021 0 018CNX 24 14 16 8.0 4.33 5.17 0.035 0.021 0.018
HDY 20 10 9 2.5 2.01 2.47 0.014 0.016 0.015
CEI 12 5 7 3.0 0.93 1.05 0.003 0.005 0.005
19

A C it
Appendix B: AOT vs. Regional Airports Capacity
Airports
Area Capacity
RunwaysTotal Area
Terminal Area
Aircraft PassengersCargoes
(Million (Metres)Area (Acres)
Area (Sq.m.) (Flights/
Hour) (Million/Year)(Million Metric
Tons/Year)
BKK 8 000 563 000 68 45 0 1 700 2 60 x 3,700BKK 8,000 563,000 68 45.0 1.700 2 60 x 3,70060 x 4,000
DMK 1,552 148,462 44 18.5 (T1) 0.860 2 60 x 3,70045 x 3,500
HKT 578 31,500 20 6.5 0.036 1 45 x 3,000
CNX 642 35,863 24 8.0 0.035 1 45 x 3,100
HDY 1,188 14,940 20 2.5 0.014 1 45 x 3,050HDY 1,188 14,940 20 2.5 0.014 1 45 x 3,050
CEI 1,330 22,960 12 3.0 0.003 1 45 x 3,000
Chek Lap Kok 3,101 710,000 64 56.5 4 .000 2 60 x 3,800Kok
Changi 3,212 1,018,020 n/a 67.0 3.000 360 x 3,80060 x 4,00059 x 2,74860 4 000
20
Incheon 13,852 496,000 n/a 44.0 4.500 360 x 4,00060 x 3,75060 x 3,750

Appendix C: Market Share (By Aircraft) at Suvarnabhumi Airport – FY2013
Top 10 Airlines Top 10 LCCs
1. Thai Airways International 32.63%
2. Bangkok Airways 14.40%
3 Cathay Pacific Airways 2 38%
1. Tiger Airways 21.78%
2. Jetstar Asia Airways 12.25%
3 Indigo 11 54%3. Cathay Pacific Airways 2.38%
4. China Southern Airlines 1.77%
5. Emirates 1 66%
3. Indigo 11.54%
4. Jeju Air 8.22%
5 CEBU Pacific Air 7 40%5. Emirates 1.66%
6. Tiger Airways 1.52%
7. China Eastern Airlines 1.50%
5. CEBU Pacific Air 7.40%
6. Spring Airlines 6.15%
7. Mandala Airlines 6.10%
8. China Airlines 1.47%
9. Singapore Airlines 1.41%
8. Juneyao Airlines 4.49%
9. Eastar Jet 4.00%
10. Malaysia Airlines 1.31% 10. Scoot 3.59%
21

Appendix D: Market Share (By Passenger) at Suvarnabhumi Airport – FY2013
Top 10 Airlines
1 Th i Ai I t ti l 41 06%
Top 10 LCCs
1 Ti Ai 21 34%1. Thai Airways International 41.06%
2. Bangkok Airways 6.83%
3 Cathay Pacific Airways 3 41%
1. Tiger Airways 21.34%
2. Jetstar Asia Airways 11.48%
3 Indigo 11 02%3. Cathay Pacific Airways 3.41%
4. Emirates 2.94%
5. Singapore Airlines 1.76%
3. Indigo 11.02%
4. Jeju Air 8.30%
5. Scoot 7.63%5. Singapore Airlines 1.76%
6. China Airlines 1.70%
7. Qatar Airways 1.70%
5 Scoot 63%
6. Spring Airlines 6.54%
7. CEBU Pacific Air 5.88%
8. Etihad Airways 1.53%
9. Korean Air 1.52%
8. Mandala Airlines 5.42%
9. Eastar Jet 4.36%
10. SriLankan Airlines 1.41% 10. T'Way Airlines 3.65%
22

Appendix E: Market Share at Don Muang International Airport – FY2013
Top Airlines By Aircraft Top Airlines By Passenger1.Thai Air Asia 43.88%
2. Nok Air 26.17%
1. Thai Air Asia 53.69%
2. Nok Air 32.21%
3. Orient Thai Airlines 4.72%
4. Siam General Aviation 4.58%
3. Orient Thai Airlines 5.86%
4. Air Asia 3.82%
5. Air Asia 3.09% 5. Indonesia Air Asia 2.36%
23

Appendix F: Aircraft Movement Statistics (3 months)
(Unit: Thousand)
AOT Traffics LCCs Traffics
480.34559.42 184.99
(Unit: Thousand) • Domestic (3 airlines)
Thai Air Asia
Nok Air
Major LCCs Airline
92.10102.66
118.09193.05 211.75242.90 132.73
441.44480.34
152.80One-Two-Go/Orient
Thai Airlines
• International (22 airlines)
Air Asia
Thai Air Asia
40.63 50.14 66.9016.20 20.46
92.10
30.62 39.82248.39 268.59 316.52
79.58 85.2463.34 74.70
60.28159.94
FY
142.92 46.82Thai Air Asia
Tiger Airways
Jetstar Asia
Jetstar Airways
CEBU Pacific Air2011 2012 2013 Q2 2013 Q2 2014
International Domestic2011 2012 2013 Q2 2013 Q2 2014
International Domestic
FY FYIndonesia Air Asia
Condor Flugdienst
Jeju Air
Jin AirFi fl
Q2 2013 Q2 2014 YoY%
BKK 72 281 76 414 5 72%
Q2 2013 Q2 2014 YoY%
BKK 4 567 6 173 35 17%Firefly
Tomsonfly
IndiGO Airlines
Eastar Jet
T'Way Airlines
BKK 72,281 76,414 5.72%
DMK 35,137 42,520 21.01%
BKK+DMK 107,418 118,934 10.72%
CNX 11,066 13,812 24.81%
BKK 4,567 6,173 35.17%
DMK 26,796 34,862 30.10%
BKK+DMK 31,363 41,035 30.84%
CNX 4,792 6,687 39.55%T Way Airlines
Scoot
Spring Airlines
Mandala Airlines
Golden Myanmar Airlines
, ,
HDY 4,287 4,680 9.17%
HKT 18,349 19,828 8.06%
CEI 1,796 2,681 49.28%
, ,
HDY 3,445 3,925 13.93%
HKT 6,127 6,806 11.08%
CEI 1,094 1,822 66.54%
24
Note: 1. Fiscal Year starting from October to September2. The percentage growth as shown is calculated from
the full number of the air traffic statistics
Juneyao Airlines
VietJetAir Norwegian Air Shuttle
Total 142,916 159,935 11.91% Total 46,821 60,275 28.73%

Appendix G : Passenger Movement Statistics (3 months)
AOT Traffics LCCs Traffics(Unit: Million)(Unit: Million)
26 61
16.9024.19 27.20
31.8766.3017.65
86.13
20.3471.52
26.61
5 81 6.88 9.71
11.8413.46
4.53 5.5142.11 44.32 54.26
14 50 13 56
24.19
8.55 9.56
23.05 6.9523.12 8.18
5.812.42 2.67
2011 2012 2013 Q2 2013 Q2 2014International Domestic
14.50 13.56
2011 2012 2013 Q2 2013 Q2 2014International Domestic
FY FY
Q2 2013 Q2 2014 YoY% Q2 2013 Q2 2014 YoY%
BKK 13,525,381 12,318,063 -8.93%
DMK 4,035,815 4,755,643 17.84%
BKK+DMK 17,561,196 17,073,706 -2.78%
BKK 759,772 845,750 11.32%
DMK 3,849,159 4,586,571 19.16%
BKK+DMK 4,608,931 5,432,321 17.87%
CNX 1,434,237 1,695,683 18.23%
HDY 620,620 669,578 7.89%
HKT 3,146,466 3,333,703 5.95%
CEI 286,441 350,361 22.32%
CNX 705,140 931,810 32.15%
HDY 515,116 553,394 7.43%
HKT 951,773 1,023,009 7.48%
CEI 171,846 244,377 42.21%
Note: 1. Fiscal Year starting from October to September2. The percentage growth as shown is calculated from the full number of the air traffic statistics
C 86, 350,36 3 %
Total 23,048,960 23,123,031 0.32%
, ,
Total 6,952,806 8,184,911 17.72%
25