Embed Size (px)
Citation preview
2020 Airport MasterPlan Update for Peter Prince Field
Prepared By:
Mott MacDonald
10/7/2020

Airport Master Plan Update Prepared for: Peter Prince Field Santa Rosa County, Florida
July 2020
i | Mott MacDonald | Peter Prince Field 2020 Airport Master Plan Update | Santa Rosa County
Contents
1 Introduction 1
1.1 Purpose 1
1.2 Objectives and Goals 1
1.3 Prior Planning Studies 2
2 Existing Airport Facilities, Statistics, and Environs 4
2.1 Airport Description and Location 4
2.2 History 4
2.3 Airspace and Approach Procedures 8
2.3.1 Traffic Pattern 8
2.3.2 General Airport Information 9
2.4 FAR Part 77 Surfaces – Obstructions to Navigable Airspace 9
2.5 Existing Airside Facilities 10
2.5.1 Approach and Navigational Aids 10
2.5.2 Runways 11
2.5.3 Runway Safety Area (RSA) Evaluation 11
2.5.4 Taxiways 12
2.5.5 Aircraft Parking Apron 12
2.6 Existing Landside Facilities 13
2.6.1 FBO Terminal Building 13
2.6.2 Aircraft Hangars 14
2.6.3 Fixed Base Operations (FBO) 15
2.6.4 Fuel Facilities 15
2.6.5 Aircraft Rescue and Firefighting (ARFF) 15
2.6.6 Automobile Parking and Ground Access 16
2.7 Public Utilities 16
2.8 Stormwater Drainage 17
2.9 Meteorological Conditions 18
2.9.1 Climate 18
2.9.2 Wind 18
2.10 Land Use 19
2.11 Area-Wide Plans 20
2.11.1 Santa Rosa County Comprehensive Plan 21
2.11.2 Florida Aviation System Plan (FASP) 2012-2025 21
2.11.3 National Plan of Integrated Airport Systems (NPIAS) 2015-2019 22
2.12 Special Use Airspace and Airports in the Region 22
2.12.1 Special Use Airspace 22
2.12.2 NAS Whiting Field (NSE/NDZ) 24
2.12.3 Pensacola International Airport (PNS) 25
2.12.4 Destin-Fort Walton Beach Airport (VPS) 25
ii | Mott MacDonald | Peter Prince Field 2020 Airport Master Plan Update | Santa Rosa County
2.12.5 Brewton Municipal Airport (12J) 25
2.12.6 Bob Sikes Airport (CEW) 25
2.12.7 NAS Pensacola – Forrest Sherman Field (NPA) 26
2.12.8 Destin Executive Airport (DTS) 27
2.13 Aircraft Parking 27
2.14 Automobile Parking 27
3 Financial Plan – Draft Under Review with the County. Will be provided to the Aviation Advisory Committee week of 10/19. 28
4 Design Criteria 29
4.1 Airport Reference Code (ARC) and Critical Aircraft Determination 29
4.1.1 Critical Aircraft 30
4.2 Facility Design Criteria 30
4.2.1 Existing Airfield Facilities Versus Current Design Standards 32
4.2.2 Runways 33
4.2.3 Taxiways and Taxilanes 33
4.2.4 Aprons 33
4.2.5 Runway Protection Zone (RPZ) Dimensions 33
4.3 Pavement Design Aircraft Determination 33
4.4 FAR Part 77 Surfaces 34
5 Airfield Demand Capacity and Facility Requirements 37
5.1 Airfield Demand / Capacity Analysis 37
5.1.1 Analysis Assumptions 37
5.1.1.1 Runway Configuration 38
5.1.1.2 Aircraft Mix Index 38
5.1.1.3 Percent of Aircraft Arrivals 41
5.1.1.4 Percent of Aircraft Touch and Go Operations 41
5.1.1.5 Runway Exit Taxiway Configuration 42
5.1.1.6 Meteorological Conditions 42
5.1.2 Airfield Capacity Analysis 43
5.1.2.1 Hourly Capacity of the Runways 44
5.1.2.2 Annual Service Volume 44
5.2 Airfield Facility Requirements 46
5.2.1 Critical Aircraft and Airport Reference Code 46
5.2.2 FAA Design Standards 47
5.2.3 Runway Requirements 47
5.2.3.1 Runway Length Requirements 49
5.2.3.2 Runway Width 49
5.2.3.3 Runway Pavement Strength 51
5.2.3.4 Runway Pavement Conditions 51
5.2.3.5 Runway Shoulder Width 53
5.2.3.6 Runway Blast Pads 53

iii | Mott MacDonald | Peter Prince Field 2020 Airport Master Plan Update | Santa Rosa County
5.2.3.7 Runway to Taxiway Separation Distance 53
5.2.4 Airfield Safety Criteria 53
5.2.4.1 Runway Safety Area 53
5.2.4.2 Runway Object Free Area 54
5.2.4.3 Obstacle Free Zone 54
5.2.4.4 Runway Protection Zone 54
5.2.5 Taxiway Requirements 55
5.2.5.1 Taxiway A 55
5.2.5.2 Taxiway B 56
5.2.6 Airfield Facilities 56
5.2.6.1 Instrument Approach 56
56
57
57
58
58
5.2.6.2 Airfield Lighting
5.2.6.3 Airfield Signage
5.2.6.4 Pavement Markings
5.2.6.5 Visual Landing Aids
5.2.6.6 Wind Direction Indicators
5.2.7 Summary of Recommended Improvements 58
6 Environmental Overview 60
6.1 Airport Noise 61
6.1.1 Major Assumptions 61
62
62
62
63
6.1.2 Runway Utilization
6.1.3 Flight Tracks and Air Traffic Distribution
6.1.4 Activity Levels and Fleet Mix
6.1.5 Noise Analysis Conclusions
6.2 Land Use 66
676.2.1 Santa Rosa County Land Use
6.3 Social Impacts 69
6.4 Induced Socio-Economic Impacts 69
6.5 Air Quality 69
6.6 Water Quality 69
6.7 Department of Transportation Act, Section 4(f) Lands 70
6.8 Historical, Architectural, Archeological, and Cultural Resources 70
6.9 Biotic Communities 70
6.10 Endangered Species 71
6.11 Wetlands 73
6.12 Floodplains 73
6.13 Coastal Zone Management 73
6.14 Coastal Barriers 74
6.15 Wild and Scenic Rivers 74
6.16 Prime Farmland 74
6.17 Energy Supply and Natural Resources 74
6.18 Light Emissions 75
6.19 Solid Waste Impact 75
iv | Mott MacDonald | Peter Prince Field 2020 Airport Master Plan Update | Santa Rosa County
6.20 Construction Impacts 75
6.21 Summary 75
7 Airport Layout Plan Set 76
7.1 Cover Sheet 77
7.2 Airport Layout Plan 77
7.3 Drawing of Existing Facilities 77
7.4 West FBO Terminal Area Plan 77
7.5 East FBO Terminal Area Plan 77
7.6 RPZ and Approach Profile Drawing 78
7.7 FAR Part 77 Airspace Surfaces 78
7.8 Existing On-airport Land Use Plan and Noise Contours 79
7.9 Future Off-Airport Land Use Plan and Noise Contours 79
7.10 Summary 79
Appendix A – Aviation Activity Forecast 80
Appendix B - Existing Conditions (2018) Noise Analysis 81
Tables
Table 2.1: Ground Access 16
Table 2.2: Land Uses in the Vicinity of Peter Prince Field 19
Table 2.3: Private Use GA Airports in the Region 22
Table 2.4: Military Airports in the Region 26
Table 4.1: Aircraft Approach Categories 29
Table 4.2: Airplane Design Groups 29
Table 4.3: FAA standards for Taxiway and Runway 31
Table 4.4: FAA Separation Standards 32
Table 4.5: Runway Protection Zone Dimensions 32
Table 4.6: FAR Part 77 Imaginary Surfaces 36
Table 5.1: Aircraft Weight Classification System 39
Table 5.2: Forecast of Aircraft Operations Per Airport Reference Code 40
Table 5.3: Optimum Runway Exit Range 42
Table 5.4: Operating Conditions for Airfield Capacity and Aircraft Delay Analysis 43
Table 5.5: Runway End Utilization 43
Table 5.6: Annual Service Volume Calculation Summary 45
Table 5.7: Balanced Field Runway Length Requirements 50
Table 6.1: Runway End Utilization 62
Table 6.2: Average Annual Daily Aircraft Itinerant and Local Operations (2018) 63
v | Mott MacDonald | Peter Prince Field 2020 Airport Master Plan Update | Santa Rosa County
Table 6.3: Estimated Population and Residences Within Aircraft Day-Night Average Sound Level Contours (2018) 64
Table 6.4: Area Within Aircraft Day-Night Average Sound Level Contours (2018) 64
Table 6.5: Future Land Use Designations 66
Figures
Figure 2.1: Vicinity Map 5
Figure 2.2: Location Map 6
Figure 2.3: Airspace 8
Figure 2.4: Airport Traffic Pattern 9
Figure 2.5: Typical Part 77 Surfaces 11
Figure 2.6: Runway and Taxiway Orientation 12
Figure 2.7: Aircraft Parking and Tie-Down Areas 13
Figure 2.8: Aircraft hangars 14
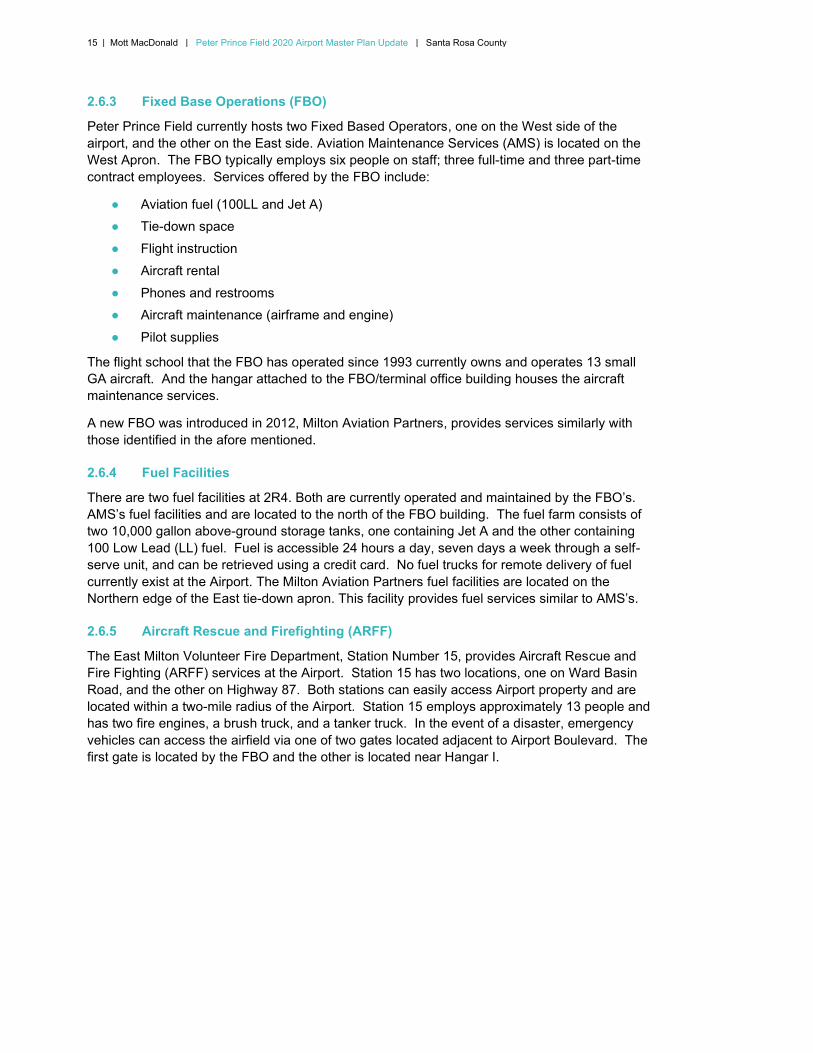
Figure 2.9: Auto Parking Areas 17
Figure 2.10: Existing Stormwater Drainage and retention areas 17
Figure 2.11: AII weather and IFR Wind Rose 19
Figure 2.12: Existing Land Use 20
Figure 2.13: Special use Airspace in the Region 23
Figure 2.14: Airports in the Region 24
Figure 4.1: FAR Part 77 Imaginary Surfaces 35
Figure 5.1: Runway Use Configuration 44
Figure 5.2: Existing Airfield Layout 48
Figure 5.3: Peter Prince Pavement Condition Index 52
Figure 5.4: Summary of Recommended Airfield Improvements 59
Figure 6.1: Existing Noise Contours (2018) 65
Figure 6.2: AICUZ Future Land Use Map 68
Charts
Chart 1.1: Steps in the Master Planning Process 3
Chart 5.1: Annual Service Volume vs. Projected Demand 46
1 | Mott MacDonald | Peter Prince Field 2020 Airport Master Plan Update | Santa Rosa County
1 Introduction
1.1 Purpose
The purpose of this Master Plan is to provide Santa Rosa County with a clear and concise planning guide for future development at Peter Prince Field (2R4) located in Milton, Florida. It is intended to correlate the planning of Airport facilities improvements with the forecasted demand for aviation services, thus accommodating both short-term and long-range requirements. Ultimately, this document will serve as a management tool for the implementation of necessary Airport improvements to accommodate expected growth in aviation demand over the next 20 years.
Funding for the 2020 Peter Prince Field Airport Master Plan Update is shared by the Florida Department of Transportation (FDOT), Federal Aviation Administration (FAA), and Santa Rosa County. Coordination with the local and regional offices of these agencies has occurred in phases throughout the preparation of this Master Plan Update. Public input has been obtained through public meetings with the Airport Advisory Committee at key points in the planning process, and continuously by the Airport management and associated consultants in preparing information for this study.
The Peter Prince Field Airport Master Plan Update has been prepared in accordance with the guidelines and standards set forth in the Federal Aviation Administration (FAA) Advisory Circulars AC 150/5070-6B, “Airport Master Plans,” and AC 150/5300-13A, “Airport Design,” and the Florida Department of Transportation, Guidebook for Airport Master Planning. Additionally, guidance from the FAA Airport District Office (Orlando), FDOT Aviation Office, Santa Rosa County staff, and Airport Advisory Committee has been included in the development of this study.
1.2 Objectives and Goals
The overall objectives of the Airport Master Plan Update are multifaceted. In general, the Airport Master Plan Update provides a guideline for future development of the Airport in an effort to satisfy anticipated demand, helps ensure compatibility with the environment surrounding the Airport, provides a detailed report that can be understood by the community that the Airport serves, and is consistent with the developmental requirements of local agencies.
In addition, specific objectives have been identified for this study:
• Develop a detailed inventory of current landside and airside Airport facilities.
• Review public forecasts of aviation activity and identify a realistic forecast of estimated aviation demand.
• Assess and prioritize the need for additional development.
• Provide a plan, including cost estimates and financial analysis, for additional development or rehabilitation at the Airport.
These objectives are used throughout the master planning process in an effort to achieve desired end goals. In this instance, these goals include development of the Airport to serve existing and future aviation needs, attainment of compatible land uses within the vicinity of the airfield, and provision of the highest possible public benefit from the investment represented by the Airport.
2 | Mott MacDonald | Peter Prince Field 2020 Airport Master Plan Update | Santa Rosa County
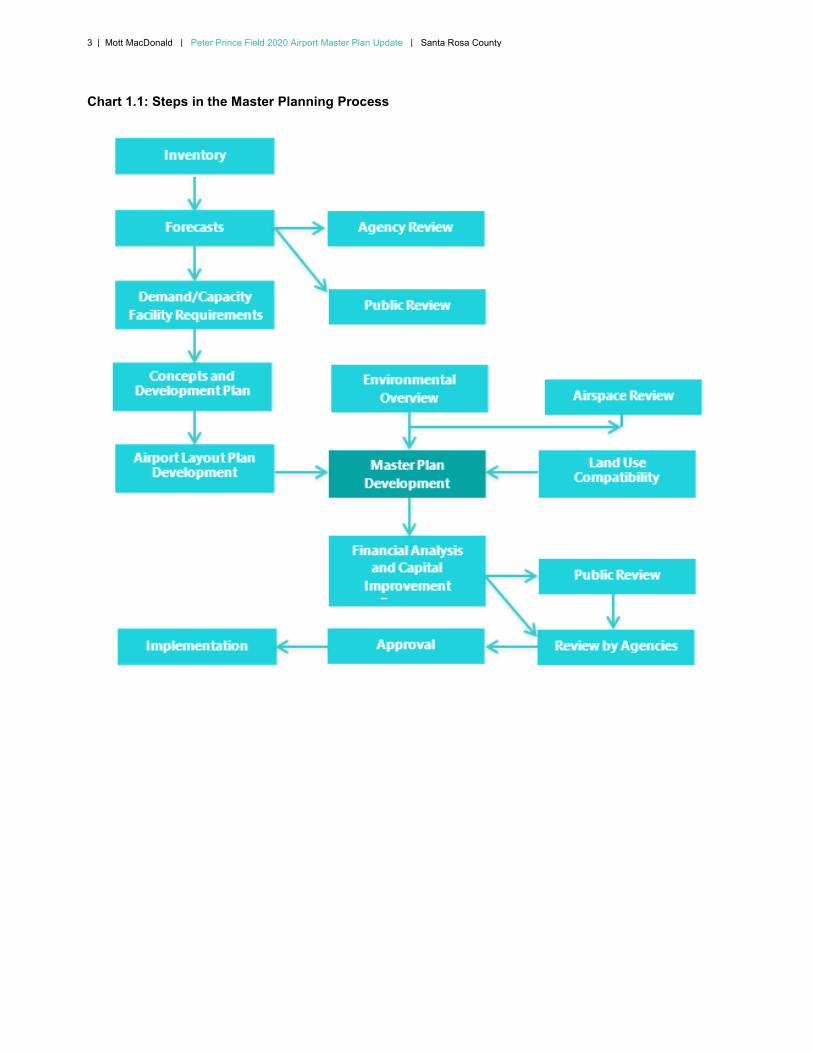
The Master Plan is a written articulation and graphical representation of the ultimate conceptual development of the Airport over the course of the planning period. Though many changes are likely to take place before facilities are designed, approved, and constructed, an approved Airport Layout Plan is essential for an airport to qualify for and receive federal and/or state assistance, and will prove as an invaluable guide for management decisions. The steps that will be followed during the development of the Airport Master Plan are illustrated in Chart 1.1, Steps
in the Master Planning Process.
1.3 Prior Planning Studies
In the development of this Master Plan Update, prior studies and reports on 2R4 within the past 33 years were identified and used as supporting material. The information derived from these materials has been revised and included in this Master Plan Update. These studies are as follows:
• Peter Prince Airport Master Plan Update, 2003 – prepared by PBS&J. – issued in April 2003.
• Peter Prince Airport Layout Plans, 1992 – prepared by Greiner, Inc. – issued in July 1992.
• Peter Prince Airport Master Plan Update, 1992 – prepared by Greiner, Inc. – issued in July 1992.
• Milton T. Master Plan Update, 1987 – prepared by Baskerville Donovan Engineers, Inc. – issued in December 1987.
These objectives are used throughout the master planning process in an effort to achieve desired end goals. In this instance, these goals include development of the Airport to serve existing and future aviation needs, attainment of compatible land uses within the vicinity of the airfield, and provision of the highest possible public benefit from the investment represented by the Airport.
3 | Mott MacDonald | Peter Prince Field 2020 Airport Master Plan Update | Santa Rosa County
Chart 1.1: Steps in the Master Planning Process
4 | Mott MacDonald | Peter Prince Field 2020 Airport Master Plan Update | Santa Rosa County
2 Existing Airport Facilities, Statistics, and Environs
2.1 Airport Description and Location
Peter Prince Field (2R4) is located in central Santa Rosa County in the Northwest region of Florida between Mobile, Alabama and Ft. Walton, Florida. The Airport is located approximately 20 statute miles northeast of Pensacola, Florida, and approximately 3 statute miles east-northeast of the City of Milton central business district.
Peter Prince Field is the only airport dedicated to general aviation within and is owned and operated by Santa Rosa County. It provides several general aviation (GA) services to the surrounding community. Of the 221.3 acres of airport property approximately ten acres are county-controlled easements and rights-of-way. Peter Prince Field serves the general aviation community, including general aviation and business flyers, with two FBOs: Aircraft Management Services (AMS) and Milton Aviation Partners, LLC.
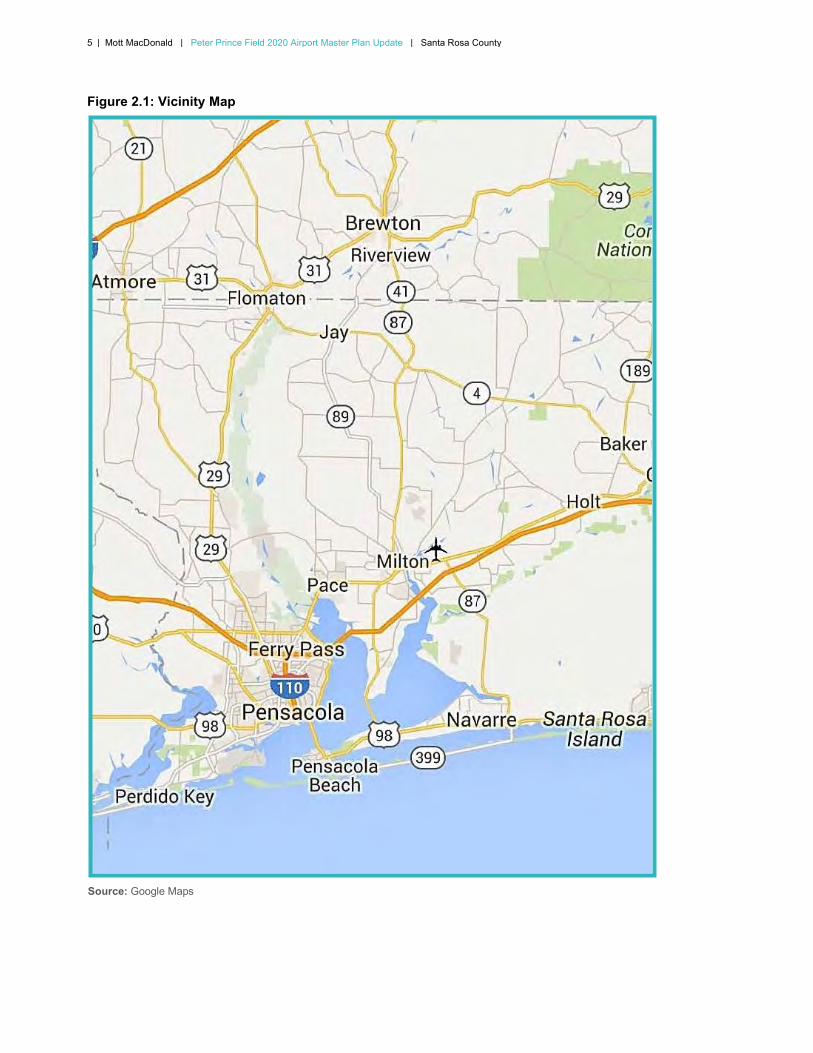
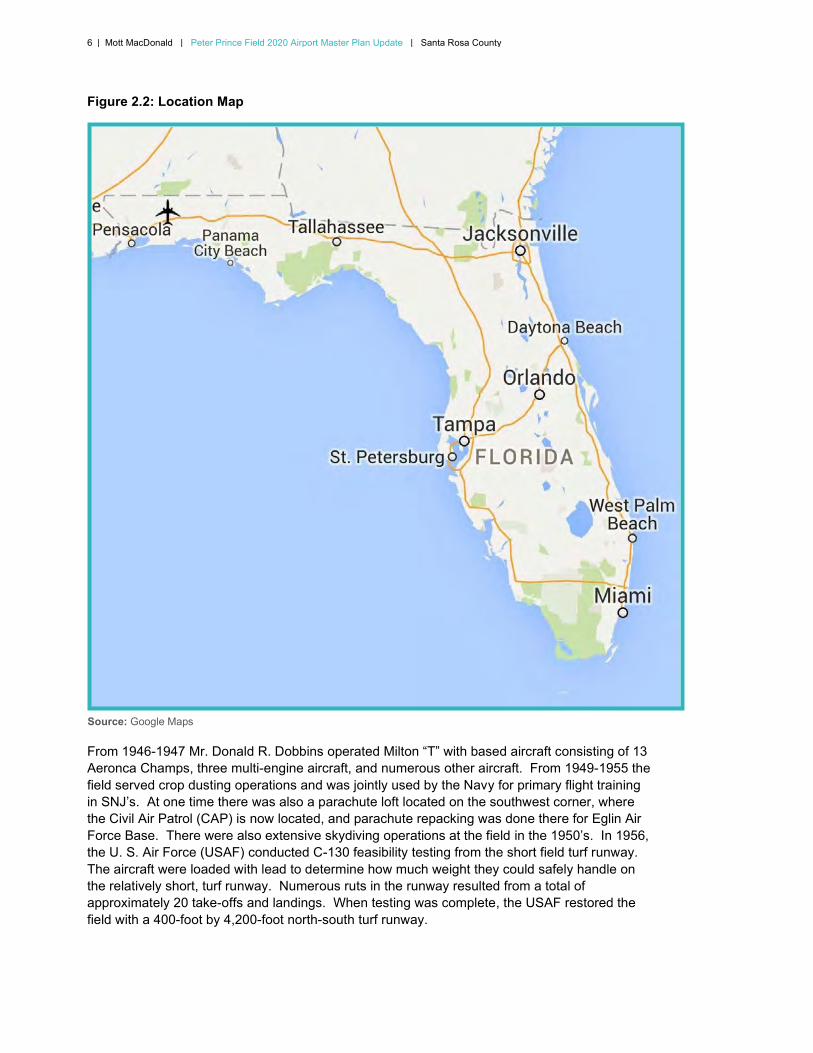
Santa Rosa County, the 16th largest county in the state, is comprised of 1,023 square miles of land, the majority of which is in timber according to the latest Santa Rosa County Comprehensive Plan. Latest estimates show that 90 percent of the county’s population live in unincorporated areas. The largest incorporated area is the City of Milton, which has a population of approximately 9,986. Topographical features of Santa Rosa vary from sea level to about 280 feet above sea level. Figure 2.1 illustrates the Airport vicinity in relation to the surrounding communities, and Figure 2.2 depicts a location map showing the Airport and the City of Milton in relation to the state of Florida.
2.2 History
Peter Prince Field, previously Milton “T”, has been in use as an “aircraft land facility” since the early 1930’s. At that time, a rotating beacon was installed by the Civil Aeronautics Administration (CAA) to identify an emergency landing strip to be used with their night navigation network. The advent of radio beam navigation was cause for the CAA to abandon the facility and for Santa Rosa County to obtain title to the property on August 23, 1934. During World War II, the site of Peter Prince Field was used an auxiliary field by the Navy, with SNJ’s, the Navy’s version of the T-6, doing touch and go operations on the turf runway.
5 | Mott MacDonald | Peter Prince Field 2020 Airport Master Plan Update | Santa Rosa County
Figure 2.1: Vicinity Map
Source: Google Maps
Northwest Florida FASPPlanning Region
6 | Mott MacDonald | Peter Prince Field 2020 Airport Master Plan Update | Santa Rosa County
Figure 2.2: Location Map
Source: Google Maps
From 1946-1947 Mr. Donald R. Dobbins operated Milton “T” with based aircraft consisting of 13 Aeronca Champs, three multi-engine aircraft, and numerous other aircraft. From 1949-1955 the field served crop dusting operations and was jointly used by the Navy for primary flight training in SNJ’s. At one time there was also a parachute loft located on the southwest corner, where the Civil Air Patrol (CAP) is now located, and parachute repacking was done there for Eglin Air Force Base. There were also extensive skydiving operations at the field in the 1950’s. In 1956, the U. S. Air Force (USAF) conducted C-130 feasibility testing from the short field turf runway. The aircraft were loaded with lead to determine how much weight they could safely handle on the relatively short, turf runway. Numerous ruts in the runway resulted from a total of approximately 20 take-offs and landings. When testing was complete, the USAF restored the field with a 400-foot by 4,200-foot north-south turf runway.
7 | Mott MacDonald | Peter Prince Field 2020 Airport Master Plan Update | Santa Rosa County
During his tenure at the fixed based operator (FBO), Mr. Dobbins constructed a hangar that measured 40 feet by 60 feet. In 1948, Mr. Peter Prince became the FBO and added a 90-foot by 70-foot extension to the hangar, along with the parachute loft that was about 40 feet high, for hanging and drying parachutes prior to repacking. A tornado demolished all of these buildings in the late 1960’s and they were replaced with a metal office/hangar building along the western side of Runway 18-36 in 1970.
In 1968, at the instruction of the Santa Rosa County Board of County Commissioners, Runway 18-36 was designed, paved, and lighted and a rotating beacon and wind tee were installed. At about this time Mr. Bill Weaver became the FBO.
In 1974, the FBO passed to Mr. Earl Butts, who built a shade hangar capable of holding 15 aircraft. It was demolished by a hurricane in 1995.
In 1984, Mr. Bill Smathers, Mr. George Brewer, and Ms. Sandy Rowden formed a partnership and assumed the FBO function.
In 1990, three six-unit T-hangars, and one four-unit T-hangar for twin engine aircraft were constructed, together with a full-length parallel taxiway on the east side of Runway 18-36, and an apron with 21 tie-down spaces. The Airport was then renamed Peter Prince Field in 1991, in honor of Mr. Peter Prince.
In 1993, three additional six-unit T-hangars were built. During that same year, a new partnership consisting of Mr. Davis Glass and Mr. Carlos Diaz took over the FBO function at the Airport, and in November of that year an aboveground fuel storage system containing two 10,000-gallon storage tanks was installed on the north side of the FBO apron. The system contained one tank for 100LL and one for Jet–A.
In 1996, five more six-unit T-hangars were built, plus a large three-unit corporate hangar facility. In addition, a taxiway was installed from the midfield to the approach end of Runway 18 on the west side of Runway 18-36.
In 2001-2006 projects included in the first phase of the master plan were completed. Projects include the construction of 24 T-Hangar units on the southwest corner of the airfield, and corresponding T-hangar access taxiways. Additional projects include the installation of Runway End Identifier lights (REIL), a lighted wind sock, non-precision runway markings to coincide with existing GPS approach, and additional road signage to aid in locating the Airport.
Milton Aviation Partners broke ground at the Airport in the fourth quarter of 2011, with initial construction of a 5,000-square-foot hangar dedicated to aircraft maintenance. Construction of a self-serve fuel farm providing 12,000 gallons of aviation gasoline (avgas) and a 1,600-square-foot passenger terminal was completed in the second quarter of 2012.
In 2015, through the funding of Florida Department of Transportation, fifteen (15) additional T-Hangars were constructed.
In 2019, two new cross-taxiways were constructed at the southern end of runway 18-36 with upgraded LED lighting, and taxiways A2, A3 and B3 were demolished to remove direct connections from aprons to the runway. Additionally, two more taxi lanes were constructed south of the East apron to support future T-hangars.
In 2020, thirteen (13) new T-hangars were constructed on the East side of runway 18-36 with FDOT funding.
8 | Mott MacDonald | Peter Prince Field 2020 Airport Master Plan Update | Santa Rosa County
2.3 Airspace and Approach Procedures
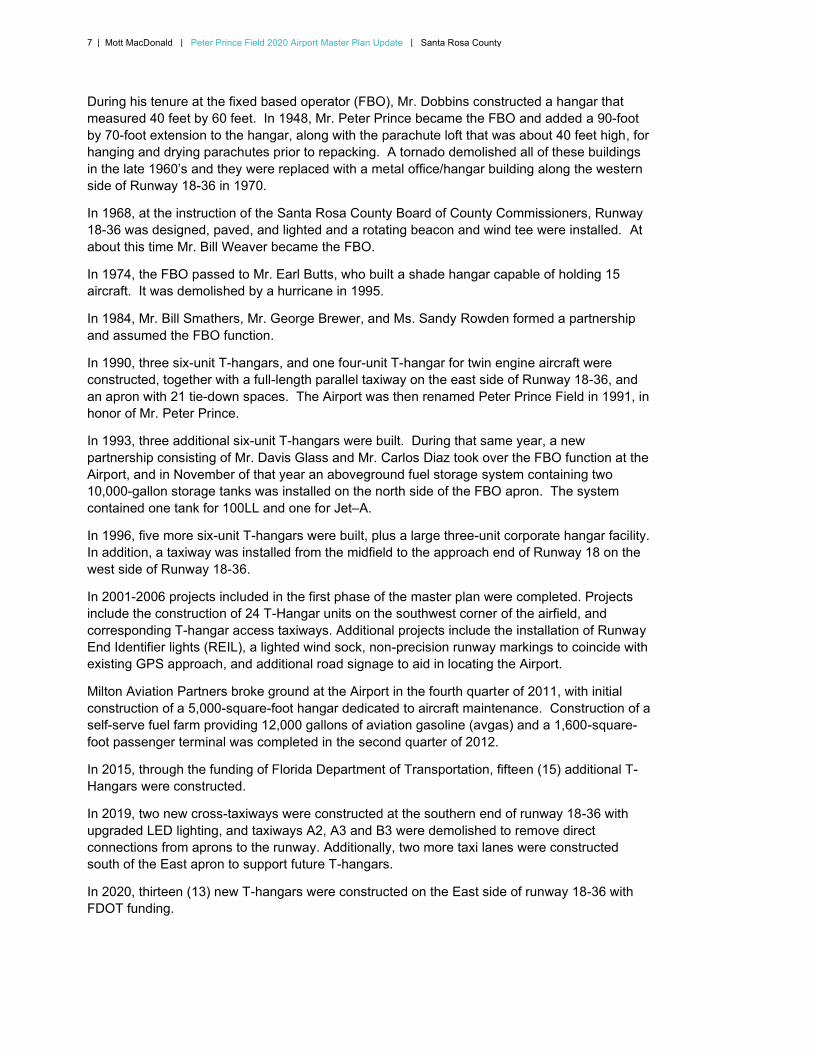
2R4 is located within class E airspace and does not have an Air Traffic Control Tower (ATCT) in operation. The airfield is therefore considered ‘uncontrolled’. The class E airspace surrounding 2R4 has a floor of 700 feet mean sea level (MSL) and extends upward to 18,000 feet MSL. Figure 2.3 depicts an example of standard Class E airspace in relation to all other airspace.
Figure 2.3: Airspace
Source: Federal Aviation Administration, Pilots Handbooks of Aeronautical Knowledge, Chapter 14 “Airspace.”
2.3.1 Traffic Pattern
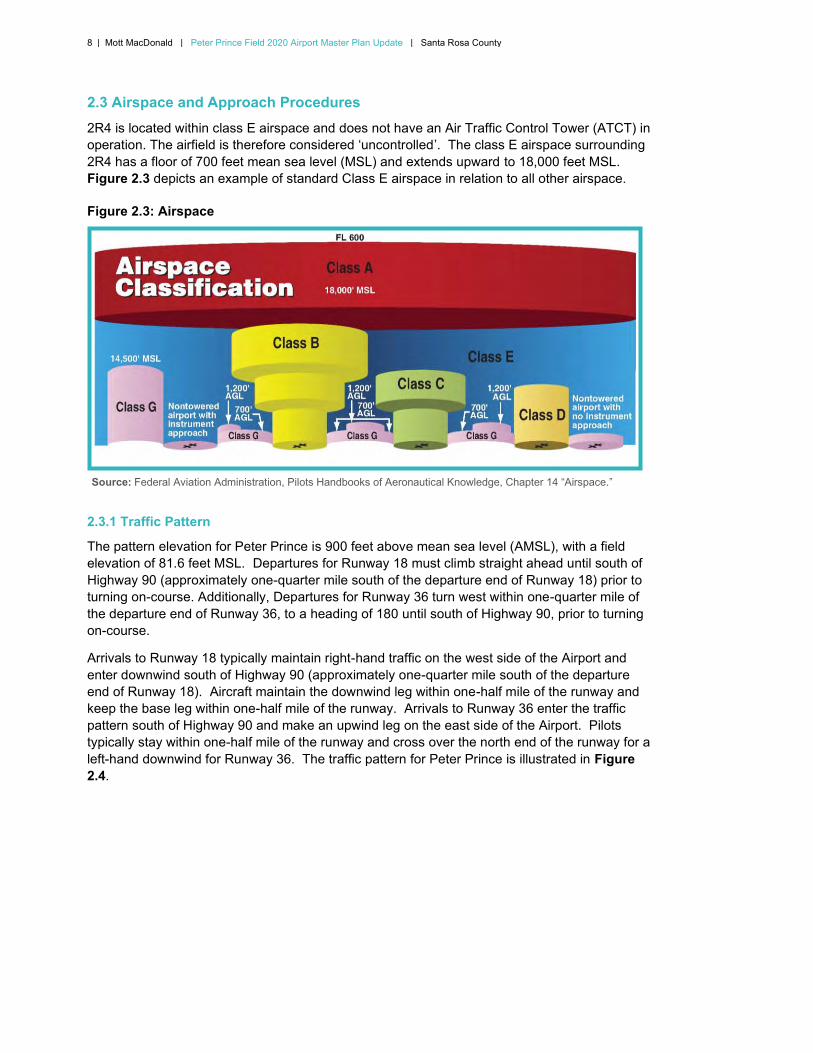
The pattern elevation for Peter Prince is 900 feet above mean sea level (AMSL), with a field elevation of 81.6 feet MSL. Departures for Runway 18 must climb straight ahead until south of Highway 90 (approximately one-quarter mile south of the departure end of Runway 18) prior to turning on-course. Additionally, Departures for Runway 36 turn west within one-quarter mile of the departure end of Runway 36, to a heading of 180 until south of Highway 90, prior to turning on-course.
Arrivals to Runway 18 typically maintain right-hand traffic on the west side of the Airport and enter downwind south of Highway 90 (approximately one-quarter mile south of the departure end of Runway 18). Aircraft maintain the downwind leg within one-half mile of the runway and keep the base leg within one-half mile of the runway. Arrivals to Runway 36 enter the traffic pattern south of Highway 90 and make an upwind leg on the east side of the Airport. Pilots typically stay within one-half mile of the runway and cross over the north end of the runway for a left-hand downwind for Runway 36. The traffic pattern for Peter Prince is illustrated in Figure 2.4.
9 | Mott MacDonald | Peter Prince Field 2020 Airport Master Plan Update | Santa Rosa County
Figure 2.4: Airport Traffic Pattern
2.3.2 General Airport Information
Use of a close-in traffic pattern and strict adherence to this pattern at the Airport is important. The airspace at 2R4 is essentially a one-mile cutout of Naval Air Station (NAS) Whiting Field’s Class C airspace. Pilots and aircraft that wish to use instrument procedures at 2R4 may utilize a straight-in or circling GPS approach to Runway 36. To aid this procedure, precision approach path indicators (PAPI’s) are located on the left sides of Runways 18 and 36, providing adequate clearance of existing obstructions.
The Airport facilities directory reports that pilots may expect turbulence below the tree line on approach and landing to Runways 18 and 36 in the presence of a moderate crosswind component (especially east). Additionally, pilots must be particularly aware of R-2915 A, a restricted flight area located approximately 4 miles east of 2R4. This airspace encompasses surface to unlimited altitudes in an area bound by Highway 87 on the west, the railroad track north of Highway 90 on the north, and the Gulf of Mexico on the south. Furthermore, it is recommended that pilots remain north of the railroad tracks located north of Highway 90 in order to avoid Restricted Area 2915A.
Aircraft en route to, or in the vicinity of, 2R4 may receive pertinent information about the Airport, weather, and current traffic patterns, through Unicom frequency 122.8 (CTAF). Local air traffic should be monitored through this frequency while conducting operations at the Airport.
2.4 FAR Part 77 Surfaces – Obstructions to Navigable Airspace
Federal Aviation Regulations (FAR) Part 77 Obstructions to Navigable Airspace establishes standards for determining obstructions in navigable airspace. An obstruction is defined as any object of natural growth, terrain, or permanent or temporary construction and/or alteration, including related equipment and materials used therein, which penetrates any portion of the “imaginary surfaces”. FAR Part 77 defines “imaginary surfaces” which govern the vertical height of obstacles within the vicinity of airports. These surfaces will vary in size and slope depending on the aircraft operating along with the available approaches at each runway end.
10 | Mott MacDonald | Peter Prince Field 2020 Airport Master Plan Update | Santa Rosa County
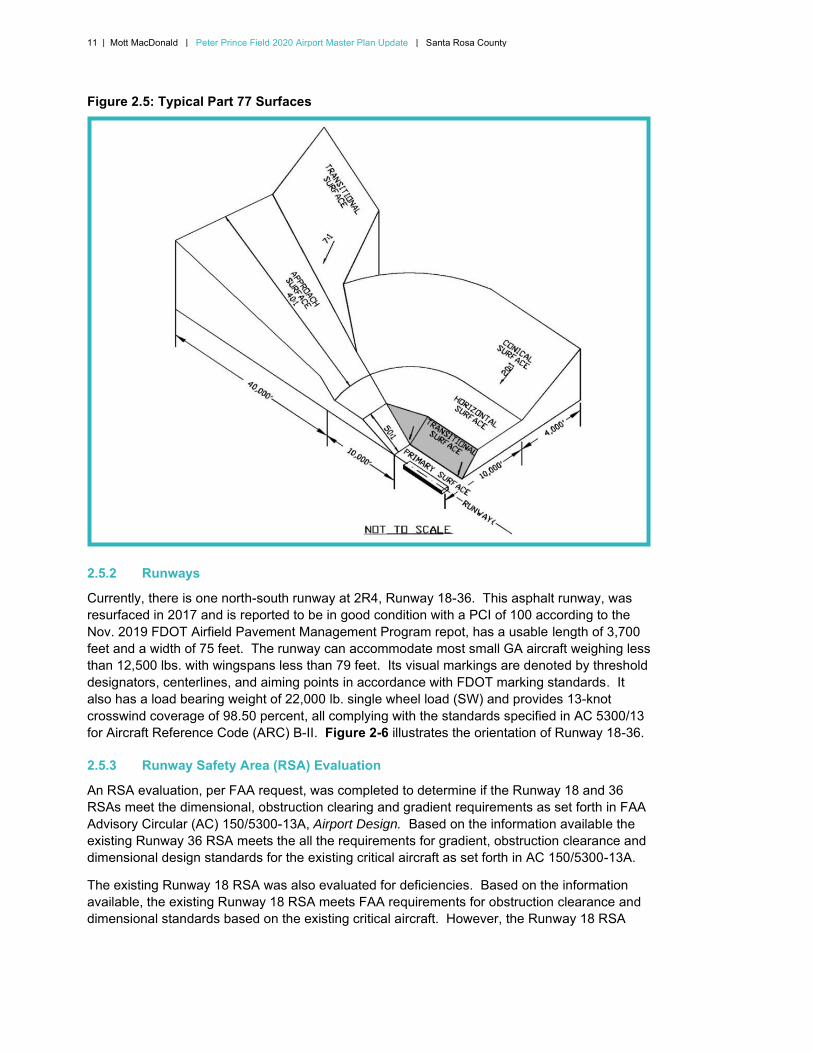
By superimposing these “imaginary surfaces” over the Airport, it is possible to determine the severity of existing obstructions. The Part 77 Surfaces also provide vertical boundaries for existing construction alterations as well as new construction. Once objects have been identified as obstructions, the Federal Aviation Administration (FAA) must review them to determine if they pose a “hazard to air navigation”. If determined as such, the obstacle must be removed or altered to eliminate the penetration. If the obstruction were to remain, dramatic changes to the airfield and/or approach procedures may be required. An example of such changes may be a displaced runway threshold or increasing approach minimums to provide obstruction clearance. Figure 2.5 illustrates typical FAR Part 77 surfaces.
2.5 Existing Airside Facilities
2.5.1 Approach and Navigational Aids
The Airport currently utilizes several visual navigational aids (NAVAIDS). PAPIs are located at both runway ends. PAPIs consist of a light array, situated perpendicular to the runway, that serves as a visual reference to guide pilots. A typical four light array will display two white lights and two red lights when the aircraft is flying ‘on’ the glide slope. Aircraft flying below glide slope will see the PAPI’s as all red and to those flying above the glide slope the PAPI’s will appear all white.
The Runway at 2R4 is equipped with medium intensity runway lighting (MIRL). Runway edge lights are used to outline the edge of the runway during periods of darkness or restricted visibility conditions. Pilots must use the Unicom/CTAF frequency 122.975 in order to activate the MIRL and PAPI’s at 2R4.
Pilots en route to or from the Airport may use a Very High Frequency Omni-directional Range/Tactical Air Navigation (VORTAC) at Crestview, frequency 115.9, channel 106, located approximately 20 nautical miles northeast of 2R4. Additionally, a global positioning system (GPS) approach to Runway 36 is available for approaches in less than visual flight rules (VFR) conditions. Weather minimums must be at least one-mile visibility and 500-foot ceilings to use this approach. The Unicom frequency 122.975 and/or Notice to Airmen (NOTAM) announcements are also available for Airport information
11 | Mott MacDonald | Peter Prince Field 2020 Airport Master Plan Update | Santa Rosa County
Figure 2.5: Typical Part 77 Surfaces
2.5.2 Runways
Currently, there is one north-south runway at 2R4, Runway 18-36. This asphalt runway, was resurfaced in 2017 and is reported to be in good condition with a PCI of 100 according to the Nov. 2019 FDOT Airfield Pavement Management Program repot, has a usable length of 3,700 feet and a width of 75 feet. The runway can accommodate most small GA aircraft weighing less than 12,500 lbs. with wingspans less than 79 feet. Its visual markings are denoted by threshold designators, centerlines, and aiming points in accordance with FDOT marking standards. It also has a load bearing weight of 22,000 lb. single wheel load (SW) and provides 13-knot crosswind coverage of 98.50 percent, all complying with the standards specified in AC 5300/13 for Aircraft Reference Code (ARC) B-II. Figure 2-6 illustrates the orientation of Runway 18-36.
2.5.3 Runway Safety Area (RSA) Evaluation
An RSA evaluation, per FAA request, was completed to determine if the Runway 18 and 36 RSAs meet the dimensional, obstruction clearing and gradient requirements as set forth in FAA Advisory Circular (AC) 150/5300-13A, Airport Design. Based on the information available the existing Runway 36 RSA meets the all the requirements for gradient, obstruction clearance and dimensional design standards for the existing critical aircraft as set forth in AC 150/5300-13A.
The existing Runway 18 RSA was also evaluated for deficiencies. Based on the information available, the existing Runway 18 RSA meets FAA requirements for obstruction clearance and dimensional standards based on the existing critical aircraft. However, the Runway 18 RSA
12 | Mott MacDonald | Peter Prince Field 2020 Airport Master Plan Update | Santa Rosa County
does not comply with the FAA surface gradient standards set forth in AC 150/5300-13A, paragraph 502(b).
2.5.4 Taxiways
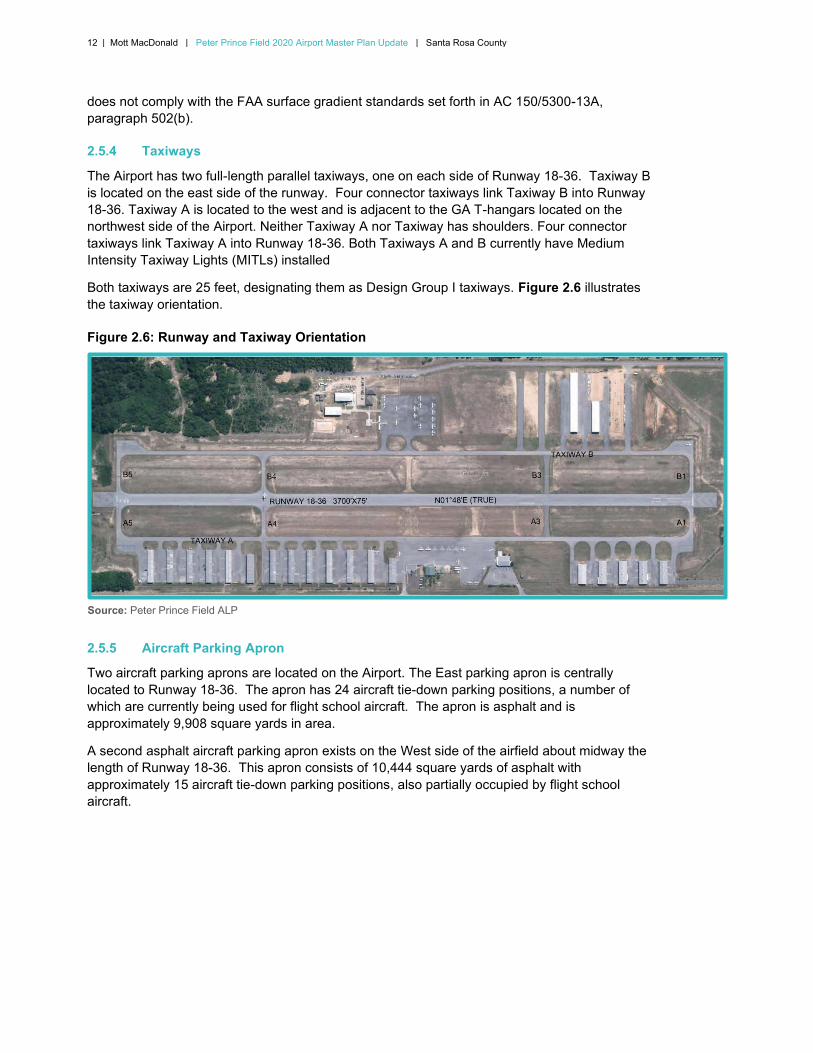
The Airport has two full-length parallel taxiways, one on each side of Runway 18-36. Taxiway B is located on the east side of the runway. Four connector taxiways link Taxiway B into Runway 18-36. Taxiway A is located to the west and is adjacent to the GA T-hangars located on the northwest side of the Airport. Neither Taxiway A nor Taxiway has shoulders. Four connector taxiways link Taxiway A into Runway 18-36. Both Taxiways A and B currently have Medium Intensity Taxiway Lights (MITLs) installed
Both taxiways are 25 feet, designating them as Design Group I taxiways. Figure 2.6 illustrates the taxiway orientation.
Figure 2.6: Runway and Taxiway Orientation
Source: Peter Prince Field ALP
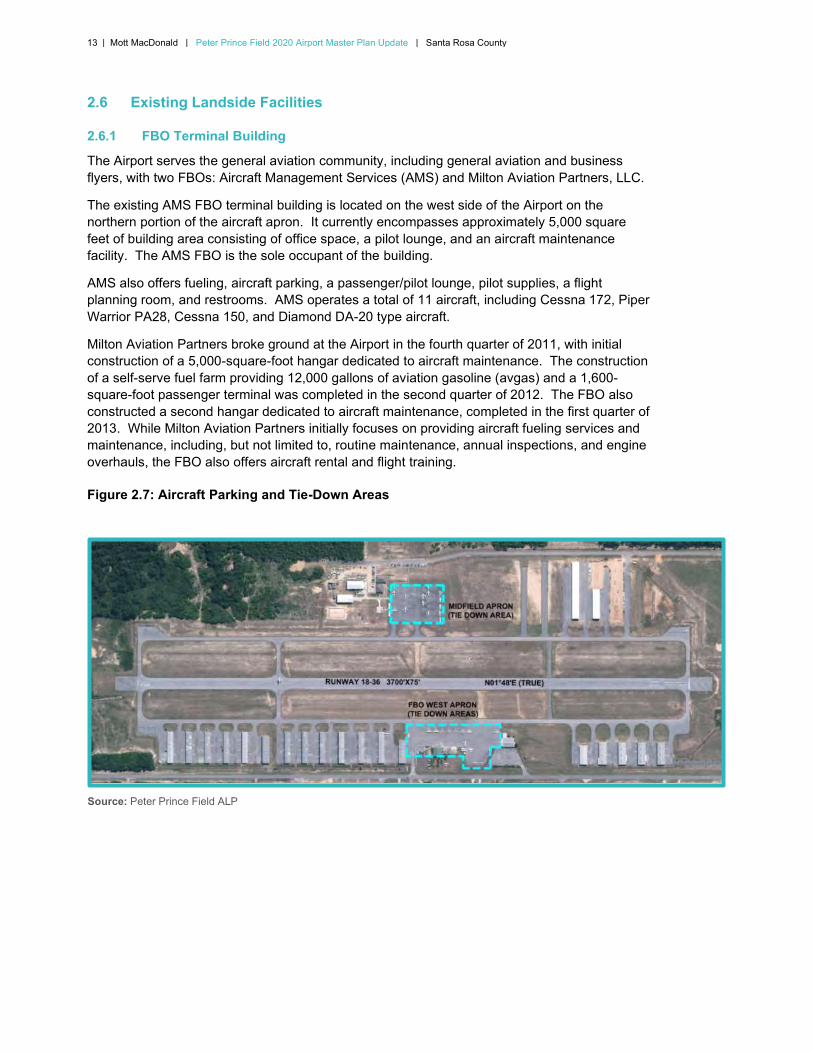
2.5.5 Aircraft Parking Apron
Two aircraft parking aprons are located on the Airport. The East parking apron is centrally located to Runway 18-36. The apron has 24 aircraft tie-down parking positions, a number of which are currently being used for flight school aircraft. The apron is asphalt and is approximately 9,908 square yards in area.
A second asphalt aircraft parking apron exists on the West side of the airfield about midway the length of Runway 18-36. This apron consists of 10,444 square yards of asphalt with approximately 15 aircraft tie-down parking positions, also partially occupied by flight school aircraft.
13 | Mott MacDonald | Peter Prince Field 2020 Airport Master Plan Update | Santa Rosa County
2.6 Existing Landside Facilities
2.6.1 FBO Terminal Building
The Airport serves the general aviation community, including general aviation and business flyers, with two FBOs: Aircraft Management Services (AMS) and Milton Aviation Partners, LLC.
The existing AMS FBO terminal building is located on the west side of the Airport on the northern portion of the aircraft apron. It currently encompasses approximately 5,000 square feet of building area consisting of office space, a pilot lounge, and an aircraft maintenance facility. The AMS FBO is the sole occupant of the building.
AMS also offers fueling, aircraft parking, a passenger/pilot lounge, pilot supplies, a flight planning room, and restrooms. AMS operates a total of 11 aircraft, including Cessna 172, Piper Warrior PA28, Cessna 150, and Diamond DA-20 type aircraft.
Milton Aviation Partners broke ground at the Airport in the fourth quarter of 2011, with initial construction of a 5,000-square-foot hangar dedicated to aircraft maintenance. The construction of a self-serve fuel farm providing 12,000 gallons of aviation gasoline (avgas) and a 1,600-square-foot passenger terminal was completed in the second quarter of 2012. The FBO also constructed a second hangar dedicated to aircraft maintenance, completed in the first quarter of 2013. While Milton Aviation Partners initially focuses on providing aircraft fueling services and maintenance, including, but not limited to, routine maintenance, annual inspections, and engine overhauls, the FBO also offers aircraft rental and flight training.
Figure 2.7: Aircraft Parking and Tie-Down Areas
Source: Peter Prince Field ALP
14 | Mott MacDonald | Peter Prince Field 2020 Airport Master Plan Update | Santa Rosa County
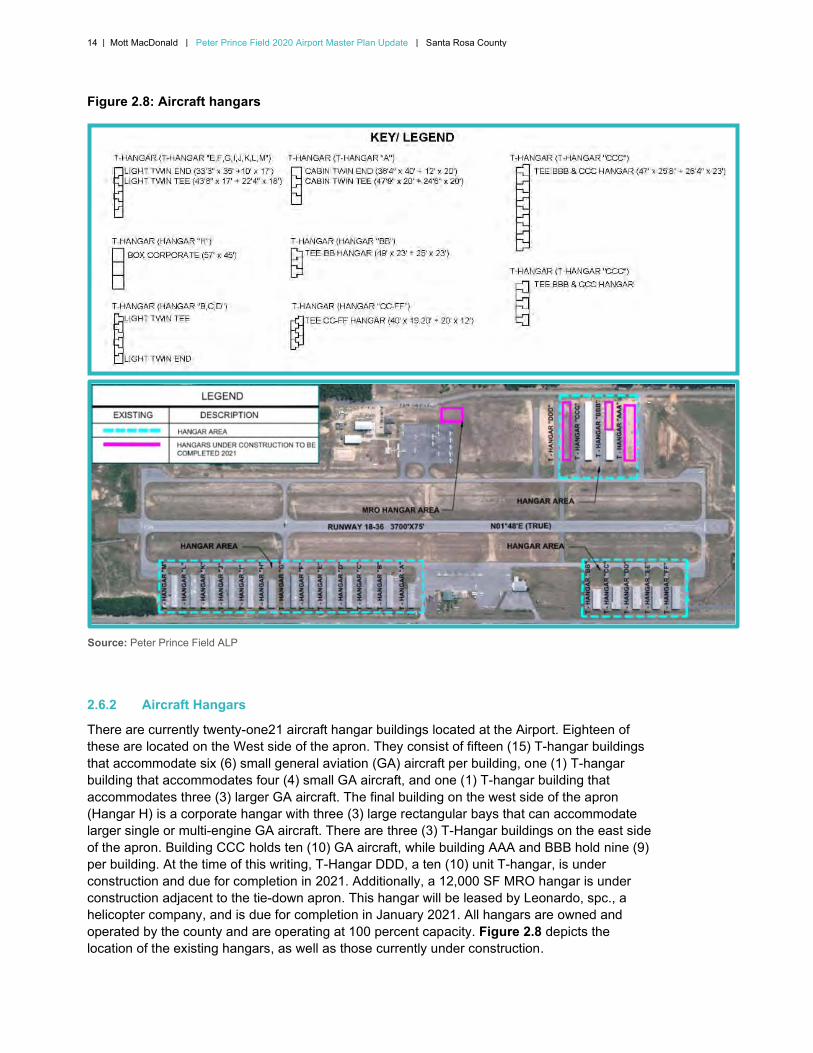
Figure 2.8: Aircraft hangars
Source: Peter Prince Field ALP
2.6.2 Aircraft Hangars
There are currently twenty-one21 aircraft hangar buildings located at the Airport. Eighteen of these are located on the West side of the apron. They consist of fifteen (15) T-hangar buildings that accommodate six (6) small general aviation (GA) aircraft per building, one (1) T-hangar building that accommodates four (4) small GA aircraft, and one (1) T-hangar building that accommodates three (3) larger GA aircraft. The final building on the west side of the apron (Hangar H) is a corporate hangar with three (3) large rectangular bays that can accommodate larger single or multi-engine GA aircraft. There are three (3) T-Hangar buildings on the east side of the apron. Building CCC holds ten (10) GA aircraft, while building AAA and BBB hold nine (9) per building. At the time of this writing, T-Hangar DDD, a ten (10) unit T-hangar, is under construction and due for completion in 2021. Additionally, a 12,000 SF MRO hangar is under construction adjacent to the tie-down apron. This hangar will be leased by Leonardo, spc., a helicopter company, and is due for completion in January 2021. All hangars are owned and operated by the county and are operating at 100 percent capacity. Figure 2.8 depicts the location of the existing hangars, as well as those currently under construction.
15 | Mott MacDonald | Peter Prince Field 2020 Airport Master Plan Update | Santa Rosa County
2.6.3 Fixed Base Operations (FBO)
Peter Prince Field currently hosts two Fixed Based Operators, one on the West side of the airport, and the other on the East side. Aviation Maintenance Services (AMS) is located on the West Apron. The FBO typically employs six people on staff; three full-time and three part-time contract employees. Services offered by the FBO include:
● Aviation fuel (100LL and Jet A) ● Tie-down space
● Flight instruction
● Aircraft rental ● Phones and restrooms
● Aircraft maintenance (airframe and engine) ● Pilot supplies
The flight school that the FBO has operated since 1993 currently owns and operates 13 small GA aircraft. And the hangar attached to the FBO/terminal office building houses the aircraft maintenance services.
A new FBO was introduced in 2012, Milton Aviation Partners, provides services similarly with those identified in the afore mentioned.
2.6.4 Fuel Facilities
There are two fuel facilities at 2R4. Both are currently operated and maintained by the FBO’s. AMS’s fuel facilities and are located to the north of the FBO building. The fuel farm consists of two 10,000 gallon above-ground storage tanks, one containing Jet A and the other containing 100 Low Lead (LL) fuel. Fuel is accessible 24 hours a day, seven days a week through a self-serve unit, and can be retrieved using a credit card. No fuel trucks for remote delivery of fuel currently exist at the Airport. The Milton Aviation Partners fuel facilities are located on the Northern edge of the East tie-down apron. This facility provides fuel services similar to AMS’s.
2.6.5 Aircraft Rescue and Firefighting (ARFF)
The East Milton Volunteer Fire Department, Station Number 15, provides Aircraft Rescue and Fire Fighting (ARFF) services at the Airport. Station 15 has two locations, one on Ward Basin Road, and the other on Highway 87. Both stations can easily access Airport property and are located within a two-mile radius of the Airport. Station 15 employs approximately 13 people and has two fire engines, a brush truck, and a tanker truck. In the event of a disaster, emergency vehicles can access the airfield via one of two gates located adjacent to Airport Boulevard. The first gate is located by the FBO and the other is located near Hangar I.

16 | Mott MacDonald | Peter Prince Field 2020 Airport Master Plan Update | Santa Rosa County
2.6.6 Automobile Parking and Ground Access
An automobile parking lot is located to the west of the AMS FBO hangar and North of the office building office building. The maintenance hangar’s lot has a total of 55 parking spaces, with one space designated for handicap parking, while the office building has a parking lot with 13 spaces, including two handicap parking spaces.
On the East Apron there are 3 primary parking areas locates at the t-hangars, the tie-down apron, and the FBO facility. The T-hangars have a 33-space parking lot south of building AAA, and 6 spaces on the west face of the AAA building, including 1 handicap space. There are an additional two handicap paces on the northwest end of the CCC building. 24 parking spaces are located east of the tie-down apron along Aviation drive. This parking area is currently being expanded to provide additional parking for the helicopter hangar, which will add 15 more spaces including 2 handicap spaces. The Milton Aviation Partners FBO parking lot has 9 parking spaces, including 1 handicap space.
According to FBO management the parking lots have adequate capacity for their current operations. This is likely due, in part, to hangar tenants regularly driving their vehicles directly onto the airfield and parking near their respective hangar locations. Ground access to the Airport is achieved through several transportation routes, which are listed below in Table 2.1. Overall, the ground transportation routes in the vicinity of the Airport are considered sufficient for the current level of operations and aviation demand.
Table 2.1: Ground Access
Road Name Direction of Travel Number of Traffic Lanes
Interstate 10 East/West Four Lanes
Highway 90 East/West Two Lanes
Route 87 North/South Two Lanes
Airport Boulevard North/South Two Lanes
2.7 Public Utilities
Santa Rosa County provides water and sewer services. Water service is delivered to the Airport through a water main that accesses Airport property along Airport Boulevard on the west side of the field near the FBO hangar and office building. Wastewater and sewer are handled using the County’s sewer and wastewater treatment system. Additionally, water and sewer lines run to each of the hangar locations from Airport Boulevard.
Electrical service is provided to the Airport by Santa Rosa County Utilities. Tenants may request installation of an electric meter at individual hangars for an additional expense.
17 | Mott MacDonald | Peter Prince Field 2020 Airport Master Plan Update | Santa Rosa County
Figure 2.9: Auto Parking Areas
Source: Peter Prince Field ALP
2.8 Stormwater Drainage
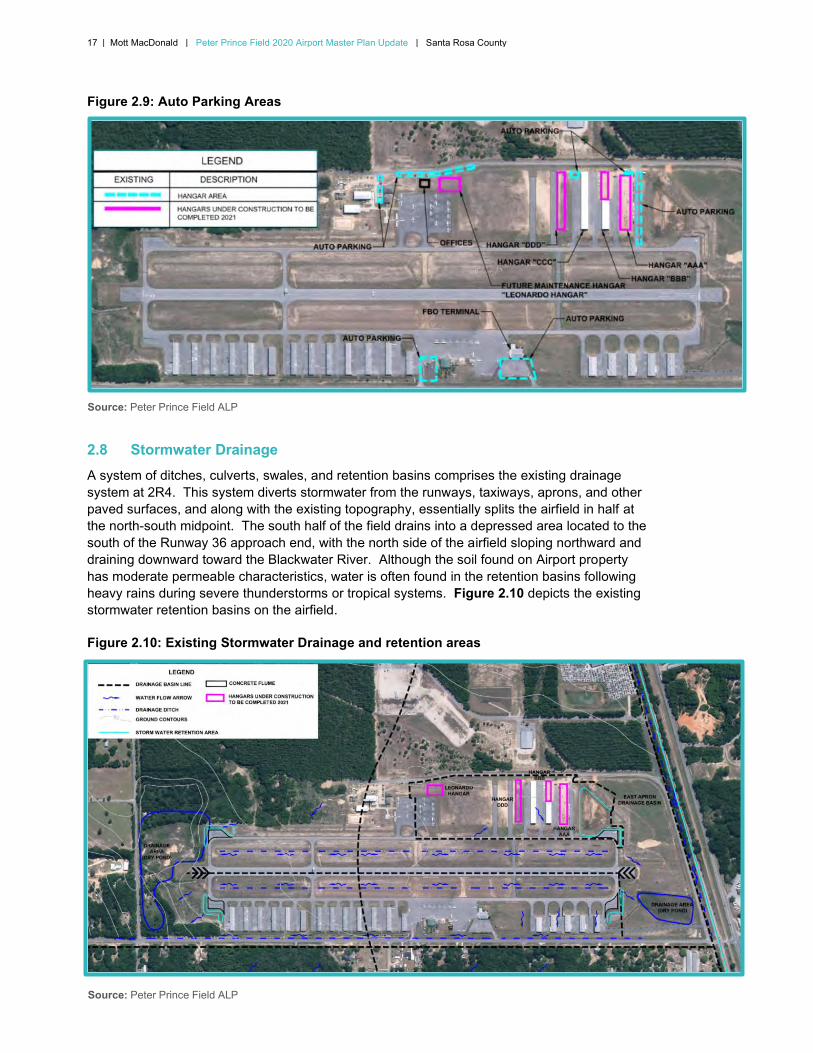
A system of ditches, culverts, swales, and retention basins comprises the existing drainage system at 2R4. This system diverts stormwater from the runways, taxiways, aprons, and other paved surfaces, and along with the existing topography, essentially splits the airfield in half at the north-south midpoint. The south half of the field drains into a depressed area located to the south of the Runway 36 approach end, with the north side of the airfield sloping northward and draining downward toward the Blackwater River. Although the soil found on Airport property has moderate permeable characteristics, water is often found in the retention basins following heavy rains during severe thunderstorms or tropical systems. Figure 2.10 depicts the existing stormwater retention basins on the airfield.
Figure 2.10: Existing Stormwater Drainage and retention areas
Source: Peter Prince Field ALP
18 | Mott MacDonald | Peter Prince Field 2020 Airport Master Plan Update | Santa Rosa County
2.9 Meteorological Conditions
Operations at airports are dramatically affected by weather patterns and associated regional meteorological conditions. The amount of rainfall, prevailing winds, and average amount of inclement weather all help to determine runway orientation, instrument approach types, and proposed NAVAIDS required to achieve the safest and most efficient operations possible.
2.9.1 Climate
Milton, Florida is positioned 30.63 degrees north of the equator and 87.04 degrees west of the prime meridian and is geographically located in the Florida panhandle. Hot summers and moderate winters are typical in the area’s tropical Florida climate. Temperature lows in January seldom dip below freezing, with a mean average of 49 degrees Fahrenheit. However, a record low of 3 degrees Fahrenheit was recorded for Milton in January 1985. High temperatures in the summer are regularly in the low to mid 90s, with the average hottest month (July) producing a mean average temperature of 81 degrees Fahrenheit. Nonetheless, in July of 1952 the city had a record high of 104 degrees Fahrenheit. During summer months afternoon showers are common, the wettest month, July, providing 7.70 inches of precipitation on average. The average annual rainfall for Santa Rosa County is 58.85 inches, surpassing the state of Florida average of 53 inches (135 cm) of rainfall per year. Occasionally, severe weather will occur in the form of hail in the earlier months (January-March), and flooding, tropical storms, and high winds in the later months (August-November).
2.9.2 Wind
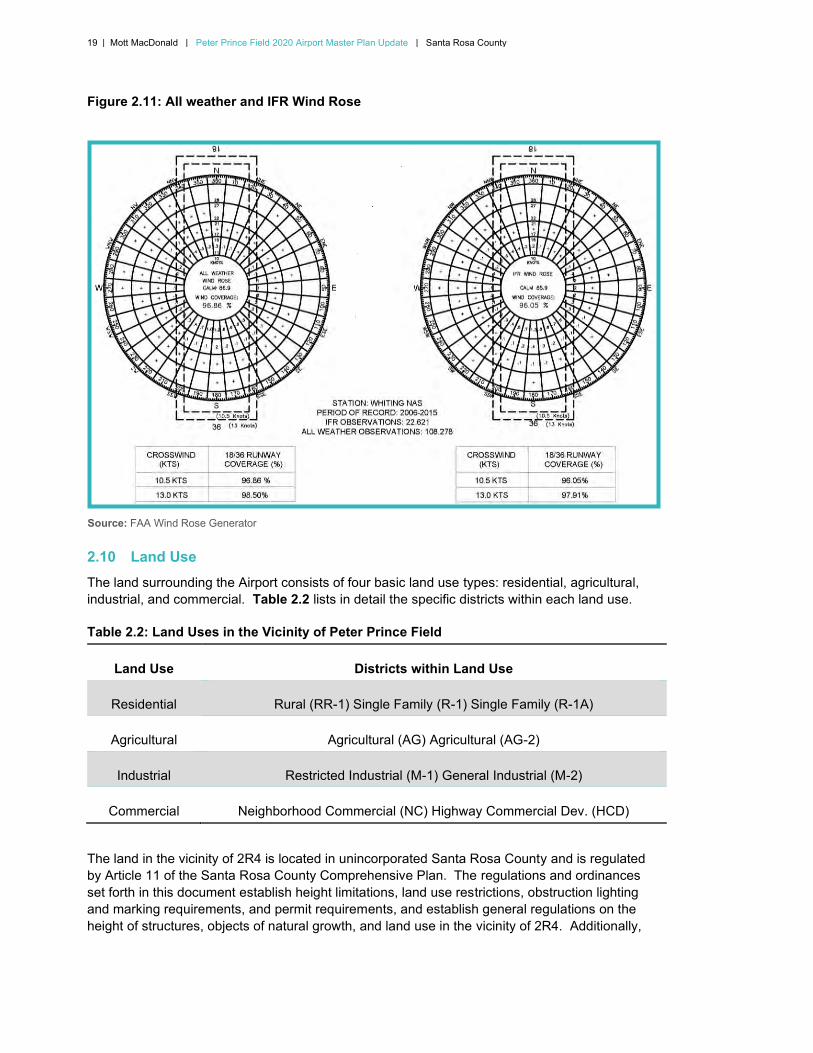
The main criterion for Runway orientation is wind coverage. The Runways should provide the maximum opportunity for operations into the wind. Wind data is filed in a database at the National Climatic Data Center in Asheville, North Carolina. Wind conditions specific to 2R4 were gathered and studied to determine the crosswind coverage afforded by Runway 18-36.
The prevailing wind patterns at 2R4 run primarily north and south in alignment with the 18-36 Runway. Predominately, the wind direction travels from the south to the north varying approximately 30 degrees east and west of a due north direction. Through the duration of the summer months – beginning with June, the winds shift to a more southerly to southwesterly direction. The winds shift back to their normal pattern as the winter months approach. A wind analysis was conducted using version 4.2D of the FAA computer program “Airport Design for Microcomputers,” with crosswind components of 10.5, 13, 16, and 20 knots. A 10.5-knot crosswind for Runway 18-36 was applied according to the existing ARC for this runway. This analysis yielded 97.67 percent coverage for all weather conditions and 96.71 percent coverage for IFR conditions. Wind data for 2R4 is illustrated in the wind rose shown in Figure 2.11.
19 | Mott MacDonald | Peter Prince Field 2020 Airport Master Plan Update | Santa Rosa County
Figure 2.11: AII weather and IFR Wind Rose
Source: FAA Wind Rose Generator
2.10 Land Use
The land surrounding the Airport consists of four basic land use types: residential, agricultural, industrial, and commercial. Table 2.2 lists in detail the specific districts within each land use.
Table 2.2: Land Uses in the Vicinity of Peter Prince Field
Land Use Districts within Land Use
Residential Rural (RR-1) Single Family (R-1) Single Family (R-1A)
Agricultural Agricultural (AG) Agricultural (AG-2)
Industrial Restricted Industrial (M-1) General Industrial (M-2)
Commercial Neighborhood Commercial (NC) Highway Commercial Dev. (HCD)
The land in the vicinity of 2R4 is located in unincorporated Santa Rosa County and is regulated by Article 11 of the Santa Rosa County Comprehensive Plan. The regulations and ordinances set forth in this document establish height limitations, land use restrictions, obstruction lighting and marking requirements, and permit requirements, and establish general regulations on the height of structures, objects of natural growth, and land use in the vicinity of 2R4. Additionally,
20 | Mott MacDonald | Peter Prince Field 2020 Airport Master Plan Update | Santa Rosa County
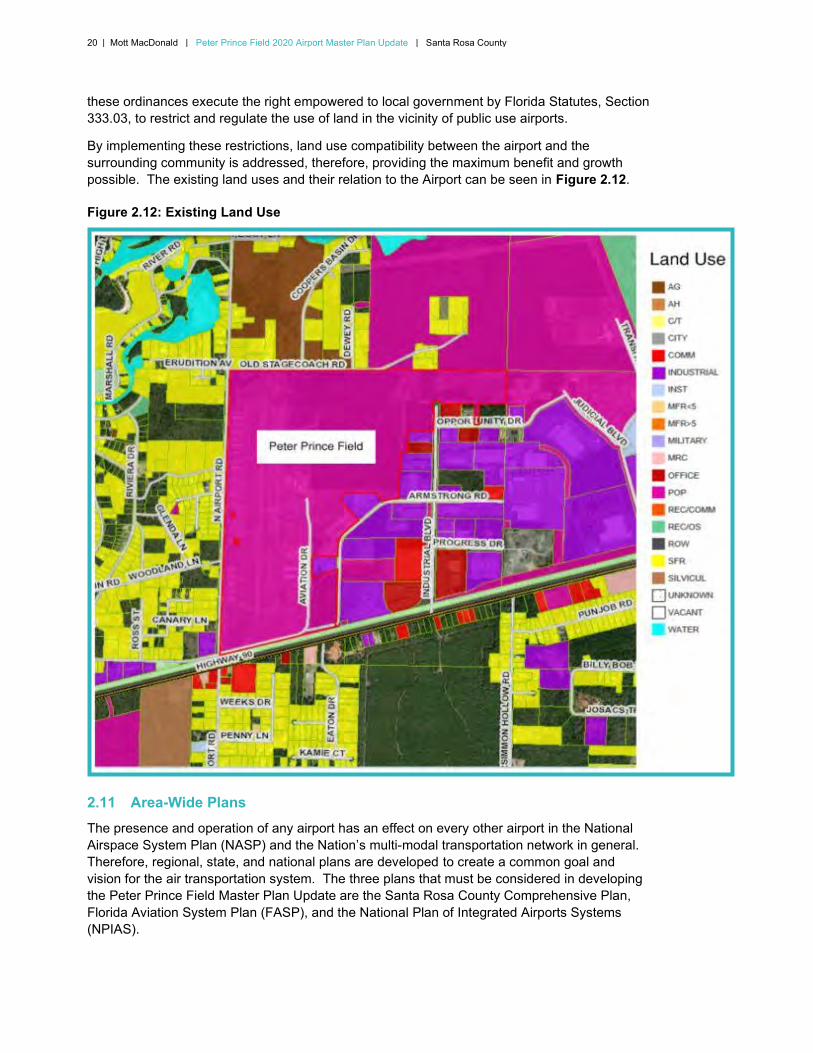
these ordinances execute the right empowered to local government by Florida Statutes, Section 333.03, to restrict and regulate the use of land in the vicinity of public use airports.
By implementing these restrictions, land use compatibility between the airport and the surrounding community is addressed, therefore, providing the maximum benefit and growth possible. The existing land uses and their relation to the Airport can be seen in Figure 2.12.
Figure 2.12: Existing Land Use
2.11 Area-Wide Plans
The presence and operation of any airport has an effect on every other airport in the National Airspace System Plan (NASP) and the Nation’s multi-modal transportation network in general. Therefore, regional, state, and national plans are developed to create a common goal and vision for the air transportation system. The three plans that must be considered in developing the Peter Prince Field Master Plan Update are the Santa Rosa County Comprehensive Plan, Florida Aviation System Plan (FASP), and the National Plan of Integrated Airports Systems (NPIAS).
21 | Mott MacDonald | Peter Prince Field 2020 Airport Master Plan Update | Santa Rosa County
2.11.1 Santa Rosa County Comprehensive Plan
The Santa Rosa County Comprehensive Plan acts as a guide for all planning and development within unincorporated Santa Rosa County. Article 2 of the county’s comprehensive plan (adopted Dec. 8, 2016) specifically addresses the Airport environs. The plan identifies regulations for land use that are applicable to all lands within the vicinity of the Airport. Acceptable types of development and specific areas where such development might occur are also identified. Therefore, coordination with county officials to establish a clear vision for the future development of 2R4 is a necessary and vital element in the development of this Master Plan. The goal of this coordination is to incorporate the Master Plan as an integral part of the county comprehensive plan.
Additionally, as a result of 2002 legislation, an airport master plan and any subsequent amendments to the airport master plan prepared by a licensed publicly owned and operated airport may be incorporated into the local government’s comprehensive plan by the local government having jurisdiction for the area in which the airport is located. The amendment that adopts the airport master plan into the comprehensive plan must address land use compatibility consistent with chapter 333, provisions for regional transportation facilities and the efficient use of the transportation system and airport, consistency with the local government transportation element and MPO long-range planning goals, execution of any necessary inter-local agreements in order to maintain the adopted level of service standards and airport and aviation related development. Once these areas have been addressed, any development or expansion of an airport or airport and aviation related development that is consistent with the adopted airport master plan and the local government comprehensive plan will not be considered a development of regional impact (DRI) and thus, will not be subject to the DRI review process.
Every Local government that contains an airport hazard area within its territorial limits shall adopt, administer, and enforce airport protection zoning regulations for such airport hazard areas, consistent with the requirements of chapter 333.03 F.S. As specified in the transition provisions in section 333.135 any existing airport zoning regulations, or political subdivisions containing an airport in their territorial limits that have not adopted airport zoning regulations shall be amended to conform to the requirements of chapter 333 by July 1, 2017.
Therefore, it is important that an airport and local government work together to incorporate the airport master plan into the local comprehensive plan in order to facilitate the expansion and overall development of the airport. By reducing the need for DRI reviews an airport can expedite the implementation of an incorporated development plan and realize the economic benefits to the airport and surrounding community much sooner than in the past.
2.11.2 Florida Aviation System Plan (FASP) 2012-2025
2R4 is located in the Northwest Florida region, which consists of the 16 counties listed below. Of these counties, those marked with a star are within the West Florida Regional Planning Council (WFRPC).
● Bay* ● Jefferson
● Calhoun ● Leon
● Escambia* ● Liberty
● Franklin ● Okaloosa*
● Gadsden ● Santa Rosa*
● Gulf ● Wakulla
22 | Mott MacDonald | Peter Prince Field 2020 Airport Master Plan Update | Santa Rosa County
● Holmes* ● Walton*
● Jackson ● Washington*
A graphical depiction of the Northwest Florida Region can be seen in Figure 2.2.
According to the Nov. 2017 FASP, the Airport accommodates 13.8 percent of total aircraft operations and affords storage for over 12 percent of the aircraft based in its region. The study recommends that primary development concerns should be directed to expanding the runways, taxiways, apron areas, and hangars.
2.11.3 National Plan of Integrated Airport Systems (NPIAS) 2015-2019
The NPIAS is a federal plan, developed by the FAA biannually for the U.S. Congress or as required by the Airport and Airway Improvement Act of 1982. It is a congressionally mandated program for development of a national system approach in planning for new airports, and expansions and improvements at existing airports. NPIAS identifies the estimated airport development and planning costs necessary to expand and improve the national system of airports. Per the FAA 2019 NPIAS update GA airports are divided into five categories based on existing aviation activity to. 2R4 is categorized as a Local GA airport, meeting the criteria of serving local-regional markets with moderate levels of activity with some multi-engine propeller aircraft, averaging about 33 based propeller-driven aircraft and no jets. NPIAS provides a list of all airports that are eligible to receive federal grants under the Airport Improvement Program (AIP).
2.12 Special Use Airspace and Airports in the Region
Military operation areas and airports located in the surrounding region are of considerable importance when evaluating sources of competition for airspace and aviation services. 2R4 has many neighboring aviation facilities consisting of public, private, and military operated installations. A number of airports within a 30-nautical mile radius of 2R4 have been examined and are discussed in this section.
The private use GA airports within the region can be seen in Figure 2.13 and are listed below in Table 2.3.
Table 2.3: Private Use GA Airports in the Region
Private Use GA Airports in the Region
● Golden Harvest ● Blackwater ● Jay
● Odom ● Dotson ● Chumuckla
● Odom 2 ● Sky Ranch ● J22
● Yellow River ● Collier ● Coastal ● McCutchan ● Jordan ● Ft. Walton Beach
2.12.1 Special Use Airspace
In respect to aviation, the military has a significant presence in the Florida Panhandle Region. Pensacola Naval Air Station (NAS Pensacola) houses one of the Navy’s largest aviation training facilities. Many training exercises take place in the numerous special use airspace areas surrounding 2R4. These Special Use Airspace areas include Alert Areas, Military Operating Areas (MOAs), and Restricted Areas, and extend from Mobile, Alabama eastward to
23 | Mott MacDonald | Peter Prince Field 2020 Airport Master Plan Update | Santa Rosa County
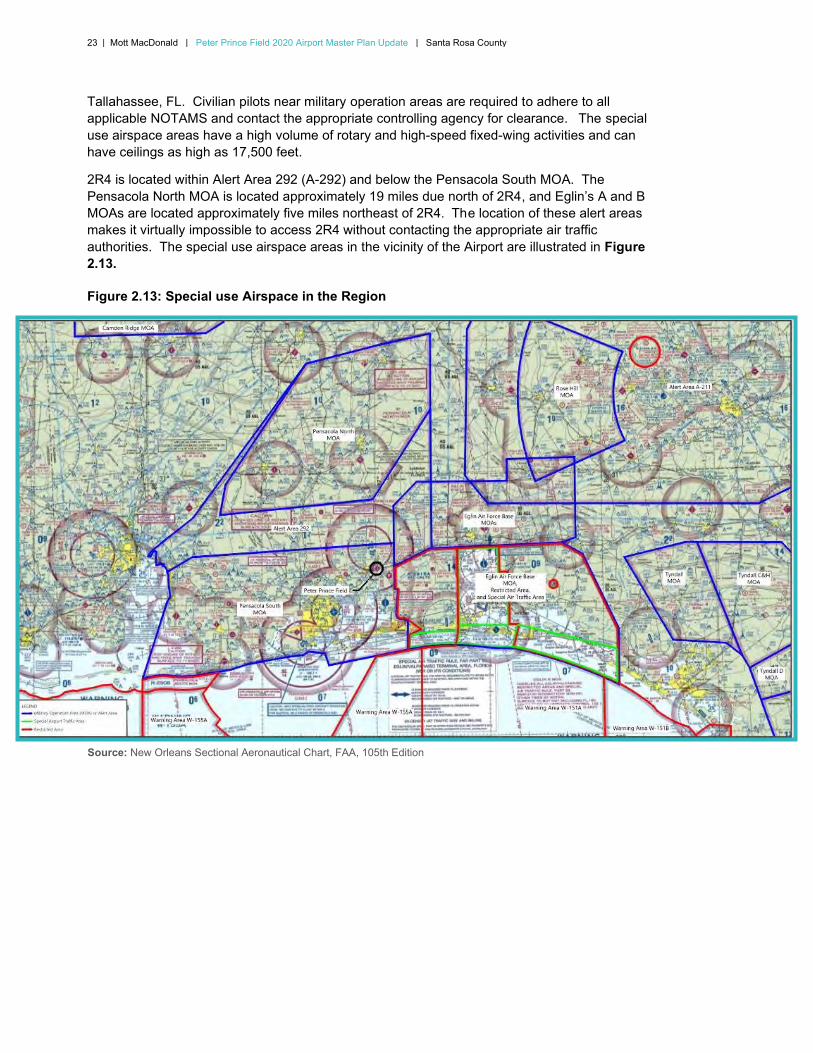
Tallahassee, FL. Civilian pilots near military operation areas are required to adhere to all applicable NOTAMS and contact the appropriate controlling agency for clearance. The special use airspace areas have a high volume of rotary and high-speed fixed-wing activities and can have ceilings as high as 17,500 feet.
2R4 is located within Alert Area 292 (A-292) and below the Pensacola South MOA. The Pensacola North MOA is located approximately 19 miles due north of 2R4, and Eglin’s A and B MOAs are located approximately five miles northeast of 2R4. The location of these alert areas makes it virtually impossible to access 2R4 without contacting the appropriate air traffic authorities. The special use airspace areas in the vicinity of the Airport are illustrated in Figure 2.13.
Figure 2.13: Special use Airspace in the Region
Source: New Orleans Sectional Aeronautical Chart, FAA, 105th Edition
24 | Mott MacDonald | Peter Prince Field 2020 Airport Master Plan Update | Santa Rosa County
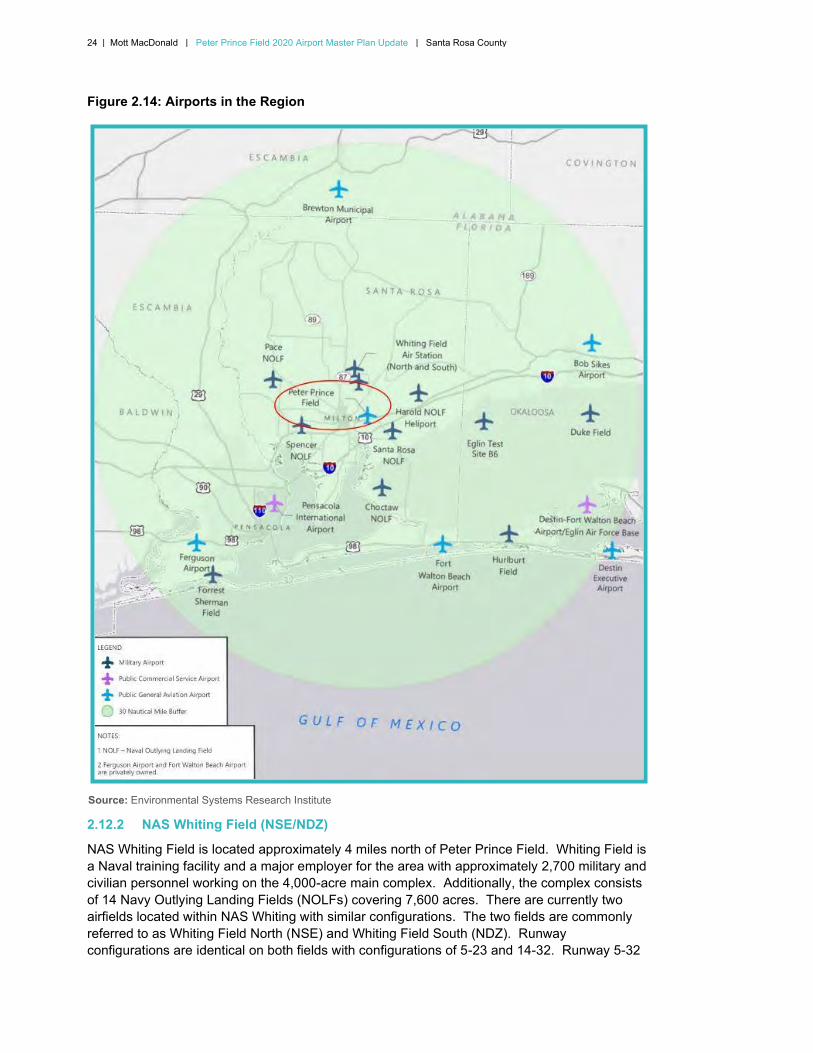
Figure 2.14: Airports in the Region
Source: Environmental Systems Research Institute
2.12.2 NAS Whiting Field (NSE/NDZ)
NAS Whiting Field is located approximately 4 miles north of Peter Prince Field. Whiting Field is a Naval training facility and a major employer for the area with approximately 2,700 military and civilian personnel working on the 4,000-acre main complex. Additionally, the complex consists of 14 Navy Outlying Landing Fields (NOLFs) covering 7,600 acres. There are currently two airfields located within NAS Whiting with similar configurations. The two fields are commonly referred to as Whiting Field North (NSE) and Whiting Field South (NDZ). Runway configurations are identical on both fields with configurations of 5-23 and 14-32. Runway 5-32

25 | Mott MacDonald | Peter Prince Field 2020 Airport Master Plan Update | Santa Rosa County
and Runway 14-32 are both 6,000 feet by 200 feet. The airspace at 2R4 is essentially a cutout of Whiting field’s airspace, aircraft typically travel within a one-half mile radius north of the airfield in order to avoid entering the military airspace. Approximately 152,000 flight operations are split between the North and South fields; 78,000 and 72,000 respectively. The NAS Whiting Field complex includes the NOLFs (Barin, Brewton, Choctaw, Evergreen, Saufley, Silverhill, Summerdale, and Wolf). The H-57 helicopters conduct their training at NOLFs Harold, Pace, Santa Rosa, Site 8, and Spencer. Additionally, the T-34C and H57 aircraft routinely conduct training at Crestview, Duke Field, and Destin-Fort Walton Beach Airport. The air station’s effect on retail sales, real estate, and payroll contributes to the economic stability of the entire county. The location of NSE and NDZ can be seen in Figure 2.14.
2.12.3 Pensacola International Airport (PNS)
Pensacola International Airport is located approximately 15 miles southeast of 2R4. Pensacola International Airport has a cross configuration with Runways 8-26 and 17-35. Runway 8-26 has a length of 5,999 feet and is 150 feet wide. Runway 17-35 has a length of 7,004 feet with a width of 150 feet. Runway 8-26 is asphalt and 17-35 is concrete. Both are reported to be in good condition.
Services and facilities are provided by Pensacola Aviation and include 100LL fuel, oxygen, aircraft parking, pilot lounge, flight school, aircraft rentals, charters, and aircraft maintenance and parts. Pensacola International Airport currently houses 105 aircraft, which include 73 single engine, 14 multi-engine, 16 business jets, and 2 helicopters. Year 2018 annual operations for Pensacola International Airport totaled 115,270. Operational activity for Pensacola International Airport was comprised of 17,176 air carrier ops, 11,520 air taxi ops, 37,871 GA local ops, 31,430 GA itinerant ops, and 17,273 military operations.
2.12.4 Destin-Fort Walton Beach Airport (VPS)
Destin-Fort Walton Beach Airport (VPS) is the only active military/commercial joint use airport in the United States today. It is approximately 25 miles east-southeast of 2R4 and has two runways in a split ‘V’ configuration. Runway 01-19 is 10,012 feet long by 300 feet wide and Runway 12-30 is 12,005 feet long by 300 feet wide. Destin-Fort Walton Beach Airport has rental car facilities within the commercial terminal that service several airlines, and an airfield that is lighted from dusk to dawn and has an ATCT. Destin-Fort Walton Beach Airport conducted approximately 14,967 operations in the year 2018, with 12,924 Air Carrier operations, 2,043 Air Taxi operations. The location of Destin-Fort Walton Beach Airport can be seen in Figure 2.14.
2.12.5 Brewton Municipal Airport (12J)
Brewton Municipal Airport (12J) is located approximately 25 miles due north of 2R4, just north of the Florida border into the state of Alabama. Brewton’s three runways are in a triangular configuration, with the designations: 06/24, 12/30, and 18/36. Runway 06/24 is 150 feet wide and has a total length of 5,135 feet. Runway 12/30 is 150 feet wide and has a total length of 5,000 feet. Runway 18/36 is 150 feet wide and has a total length of 4,100 feet. Brewton has a total of 12 single-engine based aircraft and 6 helicopters. Brewton Municipal reported 165,500 annual operations during the year 2018. These operations consisted of 1,500 air taxi ops, 7,000 GA local ops, 7,000 GA itinerant ops, and 150,000 military operations. NAS Whiting Field leases Brewton as a NOLF for flight training.
2.12.6 Bob Sikes Airport (CEW)
Bob Sikes Airport (CEW) is located approximately 30 miles east/northeast of 2R4. CEW has a single asphalt Runway (17-35) with a length of 8,005 feet and a width of 150 feet. Fuel, oxygen, aircraft parking, flight school training, aircraft rentals, maintenance, charters, car rentals, pilot

26 | Mott MacDonald | Peter Prince Field 2020 Airport Master Plan Update | Santa Rosa County
lounge, restrooms, and other services are offered through Ideal Aviation and Sunshine Aero Industries. Annual operations at CEW totaled 49,738 in the year 2018 with 203 air taxi ops, 15,901 GA ops, 29,634 GA itinerant ops, and 4,000 military operations. CEW has 36 based aircraft consisting of 19 single-engine aircraft, 12 multi-engine aircraft, and 5 jets.
2.12.7 NAS Pensacola – Forrest Sherman Field (NPA)
NAS Pensacola is located approximately 25 miles southwest of 2R4. NAS Pensacola has a parallel Runway configuration 7L-25R and 7R-25L with a perpendicular Runway 01-19. Runway 7L-25R and Runway 7R-25L are both 8,000 feet long and 200 feet wide, and Runway 01-19 has an overall length of 7,137 feet and is 200 feet wide. NAS Pensacola conducted over 100,000 operations in 2000. The 131 based aircraft include 62 T-34C, 35 T-39, 6 T-1, 14 T-2, and 3 H-3 aircraft. Additionally, NAS Pensacola is home to the United States Navy’s Flight Demonstration Team. The Blue Angels have 10 F/A-18 and one C-130 aircraft. All military fields within a 25-mile radius of 2R4 are listed in Table 2.4.
Table 2.4: Military Airports in the Region Distance/Direction Air Traffic Control Airport Name Runway(s)/Length(s) Notes from 2R4 Tower (ATCT)
Destin-Fort Walton Beach Airport
30 mi SE 1-19/10,012’, 12-30/ 12,005’
Yes Joint Use Military/ Commercial Facility
NOLF Holley 16 mi SSE 09-27/3,600’, 17-35/ 3,600’
No Fixed Wing Navy Outer Lying Field
NOLF Saufley 24 mi WSW 05-23/4,000’, 14-32/ 4,000’
No Fixed Wing Navy Outer Lying Field
Pensacola NAS 25 mi SW 01-19/7,137’, 07L-25R/8,000’, 07R-
25L/8,000’
Yes NAS Training Facility
Hurlburt Field USAF 24 mi SE 18/36 – 9,600’ Yes USAF
NOLF Santa Rosa 4 mi ESE Courses Flown: 9/27, 18/36
No Navy Outlying Landing Field
NOLF Choctaw 10 mi SSE 18-36/8,000’ Yes Fixed Wing Navy Outlying Landing Field
NAS Whiting Field (North) 5 mi NNW 05-23/6,000’, 14-32/ 6,000’
Yes NAS Training Facility
NAS Whiting Field (South) 4 mi NNW 05-23/6,000’, 14-32/ 6,000’
Yes NAS Training Facility
NOLF Harold 7 mi E Courses Flown: 9/27, 18/36 (turf)
No Helicopter Navy Outlying Landing Field
NOLF Spencer 9 mi W Courses Flown: 9/27, 18/36 (turf)
No Helicopter Navy Outlying Landing Field
NOLF Pace 13 mi WNW Courses Flown: 9/27, 18/36 (turf)
No Helicopter Navy Outlying Landing Field
NOLF Site 8 24 mi WSW Courses Flown: 9/27, 18/36 (turf)
No Helicopter Navy Outlying Landing Field
Duke Field 25 mi E 18/36 – 8,000’ x 150’ 180/360 – 3,500 X 60’
Yes USAF
27 | Mott MacDonald | Peter Prince Field 2020 Airport Master Plan Update | Santa Rosa County
2.12.8 Destin Executive Airport (DTS)
Destin Executive Airport (DTS) is located approximately 35 miles southeast of 2R4. Destin has a single runway configuration with the designation 14-32, which is 4,999 feet long and 100 feet wide. Services and facilities are offered by Destin Jet and include 100LL fuel, oxygen, aircraft parking, passenger and pilot lounges, flight school, aircraft rentals, charters, parts, and other aviation supplies. In the year 2018 Destin Executive Airport had 53,969 operations, 3,173 Air taxi ops, 7,757 GA local ops, 39,073 GA itinerant ops, and 3,958 military operations. Destin Executive Airport has 22 based aircraft consisting of 15 single engine, 4 multi-engine, and 3 jets.
2.13 Aircraft Parking
2R4 has a total of 19,542 square yards of aircraft parking apron, located in two separate locations. The main apron is located on the west side of the airfield between the FBO hangar/office building and T-hangars. The west side apron has a total of 10,444 square yards of space with 3 aircraft tie down areas. The east side apron was expanded in 2014 to 9,908 square yards. The apron exists on the east side of the airfield about midway the length of Runway 18-36, with approximately 25 aircraft tie-down parking positions. Based and itinerant aircraft jointly share the aircraft parking apron.
2.14 Automobile Parking
Auto parking is located near the MRO and FBO buildings, providing a total of 142 paved parking spaces. The MRO parking is located on the east side of the apron, near their office and training facilities. The parking consists of a 24-space lot accessed by Aviation Drive located north of the offices, and 30 spaces outside of the offices, including paved and unpaved. Parking on the west side of the Airport includes the spaces provided by two paved lots located west of the FBO terminal building and north of the T-hangars. One lot has 55 paved parking spaces that are used for public parking, and the other lot provides 12 spaces directly north of the FBO building with additional unpaved parking area. Access to the lot is provided from Airport Boulevard. Additionally, hangar tenants often park outside of their leased hangar space.
From the annual GA passenger data and a planning factor of 1.5 parking spaces per busy-hour passenger, it was estimated that a total of 63 parking spaces are required to meet demand in 2039. The forecast auto parking and necessary facility improvements will be discussed further in later sections.

28 | Mott MacDonald | Peter Prince Field 2020 Airport Master Plan Update | Santa Rosa County
3 Financial Plan
Draft Under Review with the County. Will be provided to the Aviation Advisory Committee week of 10/19.
29 | Mott MacDonald | Peter Prince Field 2020 Airport Master Plan Update | Santa Rosa County
4 Design Criteria
This chapter presents the design criteria as the basis for the demand/capacity analysis and facility requirements analysis at Peter Prince Field (2R4). All design standards presented in this section are established by the Federal Aviation Administration (FAA) for developing airport facilities to meet existing and forecast levels of activity.
4.1 Airport Reference Code (ARC) and Critical Aircraft Determination
The airport reference code (ARC) is an airport specific operational and physical design-criteria coding system that is based on aircraft operating characteristics. The ARC is made up of two components, which are derived from the airport’s design aircraft. The first component, depicted by an alpha character, is the aircraft approach category, which indicates the approach speed (operational characteristic). The second component, depicted by a Roman numeral, is the airplane design group, which indicates the wingspan (physical characteristic). Generally, runway design standards are aircraft approach speed specific, whereas, taxiways, taxilanes, and aprons are wingspan specific. The aircraft approach category and airplane design group classifications, as defined by FAA Advisory Circular AC 150/5300-13A, “Airport Design,” follow in Table 4.1 and Table 4.2.
Table 4.1: Aircraft Approach Categories
Aircraft Approach Category Approach Speed
A Less than 91 knots
B 91 knots to less than 121 knots
C 121 knots to less than 141 knots
D 141 knots to less than 166 knots
E 166 knots or more
Source: Federal Aviation Administration, Advisory Circular 150/5300-13, Airport Design, Change 18
Table 4.2: Airplane Design Groups
Airplane Design Group Wingspan
I
II
III
IV
V
49 feet and less
49 feet up to but not including 79 feet
79 feet up to but not including 118 feet
118 feet up to but not including 171 feet
171 feet up to but not including 214 feet
VI 214 feet up to but not including 262 feet
Source: Federal Aviation Administration, Advisory Circular 150/5300-13, Airport Design, Change 18.
30 | Mott MacDonald | Peter Prince Field 2020 Airport Master Plan Update | Santa Rosa County
Typically, the critical aircraft (primarily based on the aircraft with the longest wingspan and the highest approach speeds), that consistently makes substantial use of the Airport, determine the ARC. FAA AC 150/5000-17, Critical Aircraft and Regular Use Determination, defines substantial use as, 500 or more annual aircraft operations or scheduled commercial service.
Additional information on the existing and future ARC for Peter Prince Field is discussed in the Aviation Activity Forecast presented in Appendix A.
4.1.1 Critical Aircraft
The current critical aircraft for 2R4 are aircraft with an ARC of B-I, Small Aircraft. According to the Aviation Forecast provided by Ricondo and Associates in Appendix A, this includes aircraft models such as the Beech Barron, Cessna 150/182, and Piper Archer. These aircraft fall under taxiway design group (TDG) 1A.
The runway can accommodate aircraft with ARC’s of B-II, such as the KingAir 200. The previous Master Plan included plans for a new runway with an ARC of D-II to accommodate business aircraft such as the Gulfstream IV. During the time of this writing, the new runway, Runway 02-20, was removed from consideration in this Master Plan Update, and is no longer a viable alternative for Santa Rosa County. Nevertheless, the forecasts presented in Appendix A show a future demand for small business and corporate aircraft. These types of aircraft can be predominately found in the B-II, C-II, or D-II categories. Significant improvements and modifications would be necessary in order to accommodate C-II or D-II aircraft at 2R4. However, minimal changes could be made to the existing airfield configuration in order to accommodate aircraft within the B-II design classification. Yet, B-II aircraft are not anticipated to perform 500 or more annual operations, and therefore would not become the critical aircraft for basis of design.
4.2 Facility Design Criteria
Airfield improvements are developed according to the established ARC for the Airport, and then for each runway. Tables 4.3 and 4.4 depict the design criteria required for ARC B-I, while Table 4.5 depicts the existing runway protection zone (RPZ) dimensions for ARC B-I.
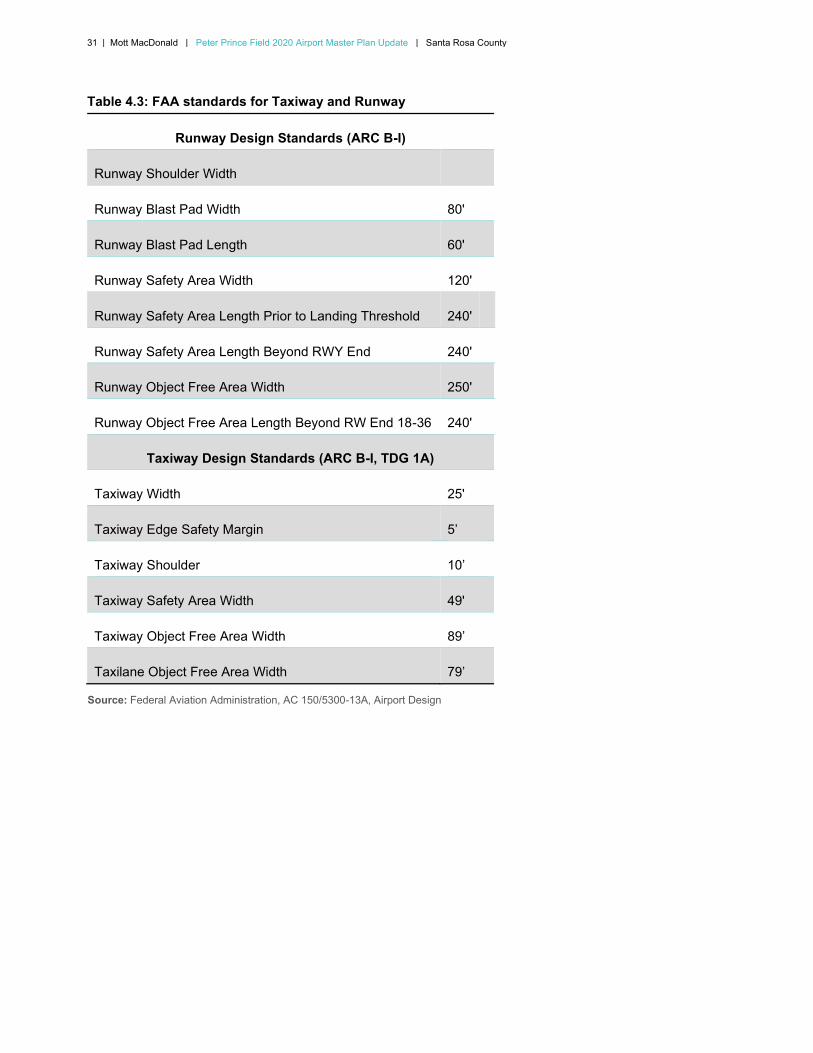
31 | Mott MacDonald | Peter Prince Field 2020 Airport Master Plan Update | Santa Rosa County
Table 4.3: FAA standards for Taxiway and Runway
Runway Design Standards (ARC B-I)
Runway Shoulder Width 10’
Runway Blast Pad Width 80'
Runway Blast Pad Length 60'
Runway Safety Area Width 120'
Runway Safety Area Length Prior to Landing Threshold 240'
Runway Safety Area Length Beyond RWY End 240'
Runway Object Free Area Width 250'
Runway Object Free Area Length Beyond RW End 18-36 240'
Taxiway Design Standards (ARC B-I, TDG 1A)
Taxiway Width 25'
Taxiway Edge Safety Margin 5’
Taxiway Shoulder 10’
Taxiway Safety Area Width 49'
Taxiway Object Free Area Width 89’
Taxilane Object Free Area Width 79’
Source: Federal Aviation Administration, AC 150/5300-13A, Airport Design
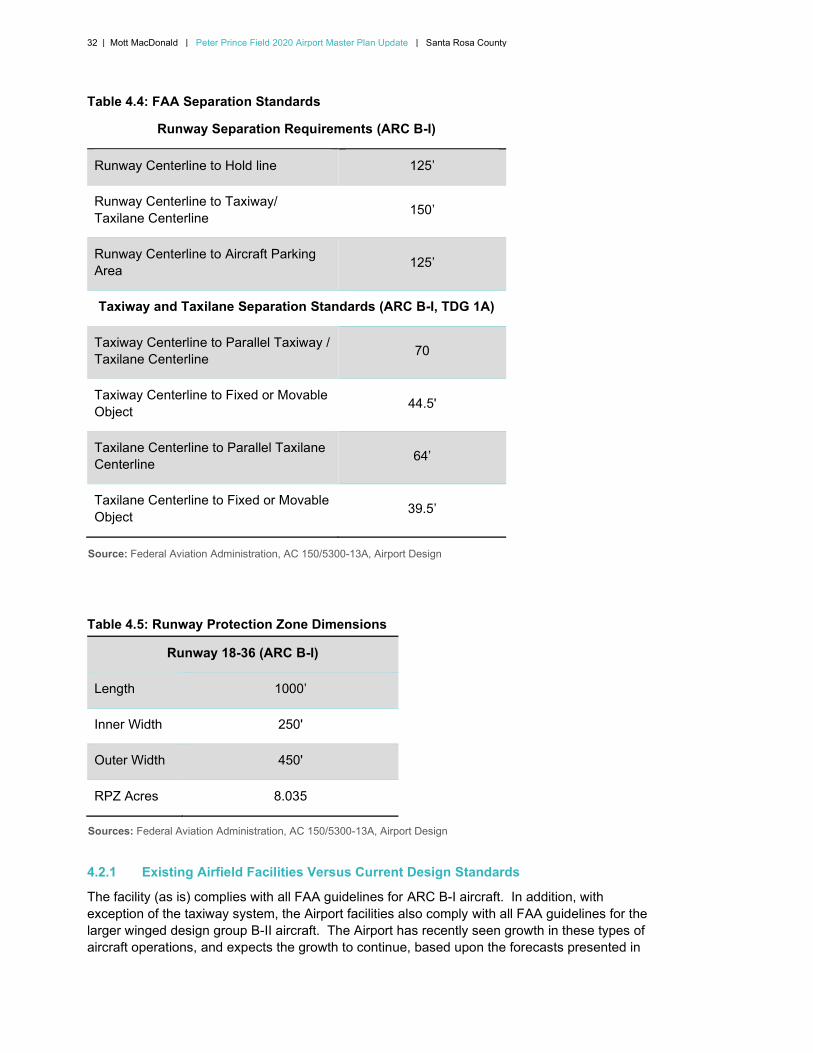
32 | Mott MacDonald | Peter Prince Field 2020 Airport Master Plan Update | Santa Rosa County
Table 4.4: FAA Separation Standards
Runway Separation Requirements (ARC B-I)
Runway Centerline to Hold line 125’
Runway Centerline to Taxiway/ 150’ Taxilane Centerline
Runway Centerline to Aircraft Parking 125’ Area
Taxiway and Taxilane Separation Standards (ARC B-I, TDG 1A)
Taxiway Centerline to Parallel Taxiway / 70Taxilane Centerline
Taxiway Centerline to Fixed or Movable 44.5'Object
Taxilane Centerline to Parallel Taxilane 64’Centerline
Taxilane Centerline to Fixed or Movable 39.5’ Object
Source: Federal Aviation Administration, AC 150/5300-13A, Airport Design
Table 4.5: Runway Protection Zone Dimensions
Runway 18-36 (ARC B-I)
Length 1000’
Inner Width 250'
Outer Width 450'
RPZ Acres 8.035
Sources: Federal Aviation Administration, AC 150/5300-13A, Airport Design
4.2.1 Existing Airfield Facilities Versus Current Design Standards
The facility (as is) complies with all FAA guidelines for ARC B-I aircraft. In addition, with exception of the taxiway system, the Airport facilities also comply with all FAA guidelines for the larger winged design group B-II aircraft. The Airport has recently seen growth in these types of aircraft operations, and expects the growth to continue, based upon the forecasts presented in
33 | Mott MacDonald | Peter Prince Field 2020 Airport Master Plan Update | Santa Rosa County
Appendix A. However, only design standards for ARC B-I will be discussed in the following sections as it is not anticipated that ARC B-II aircraft will perform more than 500 annual operations.
4.2.2 Runways
Runway 18-36 is an asphalt runway that is 3,701 feet long and 75 feet wide.
4.2.3 Taxiways and Taxilanes
The existing taxiway system at 2R4 has a common width of 25 feet in compliance with FAA standards for Group I aircraft. The runway centerline to Taxiway A centerline separation is 250 feet, while the separation between the runway centerline and Taxiway B centerline is 300 feet. The parking apron, which is near the FBO facility on the west side of the Airport, has a painted taxilane line for aircraft movements through the apron area. The outer perimeter of this west apron is currently being used as an aircraft parking area. The existing taxiway separations and safety areas at 2R4 comply with the FAA guidelines for group II aircraft as specified in AC150/5300-13A Change 6.
4.2.4 Aprons
The positioning of the existing aircraft parking aprons at 2R4 is within the required FAA standards for the B-I ARC designation. The current separation from Runway 18-36 centerline to the west aircraft-parking apron is 275 feet, and 400 feet to the east apron. The separation from Taxiway B centerline to the east apron is 110 feet and meets FAA standards for B-I ARC designations. The separation from Taxiway A centerline to the west apron is 65.5 feet and meets FAA requirements for a B-I ARC. Table 4.4 shows the separation requirements for B-I and B-II ARC designations.
4.2.5 Runway Protection Zone (RPZ) Dimensions
The RPZ is an area of land off of the runway ends, maintained for departing and arriving aircraft, that must be evenly graded and remain clear of objects. The dimensions of the approach and departure Runway Protection Zones for both runways (existing and future conditions) are length – 1,000 feet, inner width – 250 feet, and outer width – 450 feet. These dimensions are reflective of an ARC of B-I Small Aircraft and an approach visibility minimum of not lower than 1-mile for Runway 36 and visual for Runway 18. Table 4.5 illustrates the similar RPZ requirement for B-I aircraft.
4.3 Pavement Design Aircraft Determination
Aircraft weight characteristics can also affect the design of an airport. Pavement design of the runways, taxiways, and aprons is based on a design aircraft. The design aircraft is different from the critical aircraft described previously. The design aircraft is determined by landing gear configuration (i.e., single wheel, dual wheels, etc.), and the known or forecasted number of operations of aircraft with the heaviest maximum gross takeoff weights. The single wheel 4,800-pound Cessna 310 is the existing design aircraft at 2R4.
However, the runway and main taxiway pavement strengths at 2R4 can accommodate load-bearing weights up to 22,000 pounds per single wheel. Any future improvements to the runway and taxiway system to accommodate larger aircraft should strengthen the pavement to a minimum of 25,000 pounds single wheel and 50,000 pounds dual wheel load.
34 | Mott MacDonald | Peter Prince Field 2020 Airport Master Plan Update | Santa Rosa County
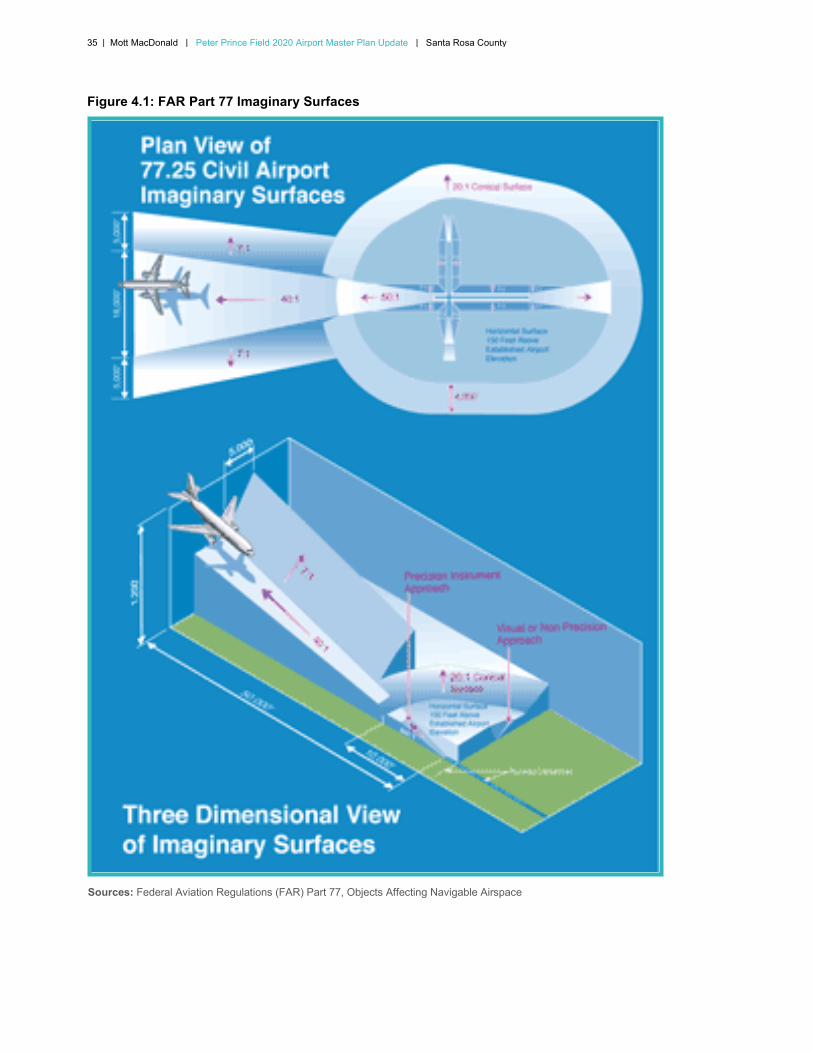
4.4 FAR Part 77 Surfaces
Federal Aviation Regulations (FAR) Part 77, Objects Affecting Navigable Airspace, defines standards for determining obstructions to navigable airspace. These imaginary surfaces are used to protect operations around airports from high structures that can pose a threat to aircraft landing or departing the airport facility. Obstructions are primarily determined by superimposing the Part 77 “imaginary surfaces” over the airport and surrounding areas. An analysis is performed to determine the elevations of various objects (structures, terrain, towers, etc.). The objects elevation is then compared to the elevation of the associated Part 77 Surface. Objects that are found to be higher than the Part 77 surfaces are considered an obstruction. Within the ALP set developed in conjunction with this Master Plan Update, an Airport airspace sheet will illustrate the various obstructions and objects located within the Part 77 areas. A reduced version of this set can also be found in Chapter 7 of this report.
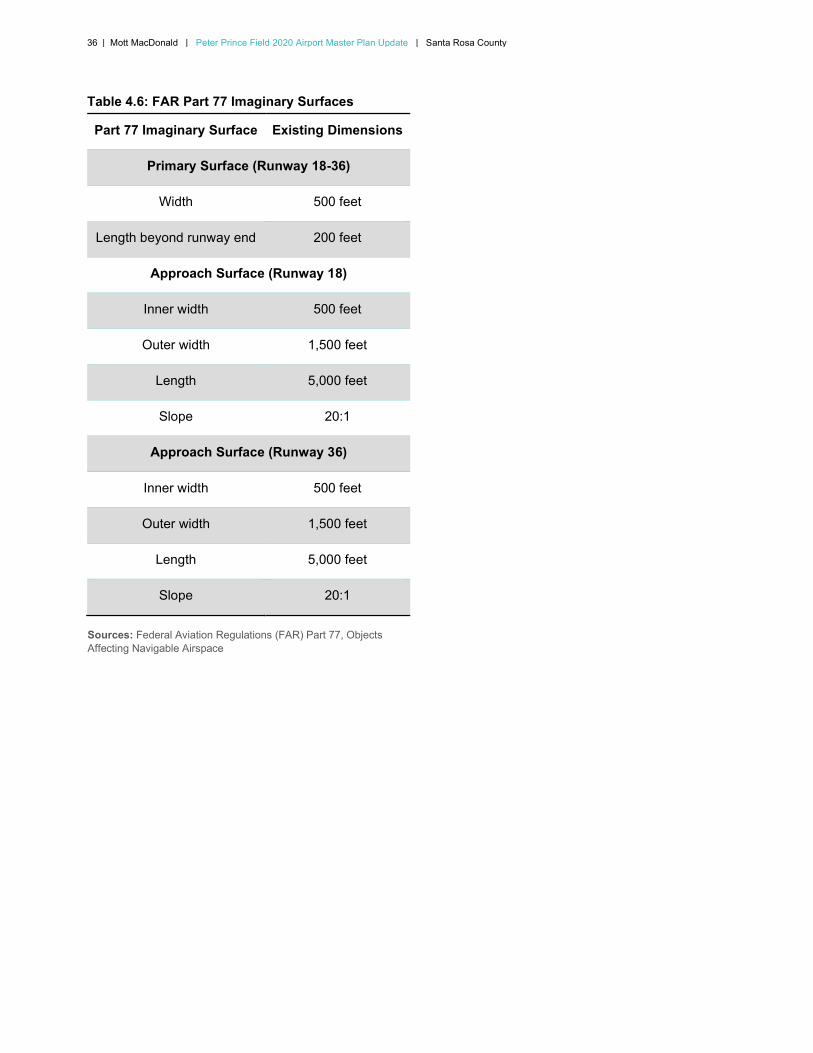
Dimensions of the “imaginary surfaces” are derived from the type of approach, and the type of aircraft operating at the Airport. Federal regulations require that the Part 77 surfaces of the most demanding approach be applied to the entire runway. Therefore, any future instrument approaches to Runway 18-36 must be designed in conjunction with the imaginary surfaces associated with the most stringent approach to the runway. The existing requirements of the Part 77 surfaces at 2R4 are illustrated in Table 4.6.
All airports licensed by the State of Florida shall comply with the minimum airfield standards defined under FAC 14-60 including protection of the imaginary surfaces defined by FAR Part 77, seen in Figure 4.1.
35 | Mott MacDonald | Peter Prince Field 2020 Airport Master Plan Update | Santa Rosa County
Figure 4.1: FAR Part 77 Imaginary Surfaces
Sources: Federal Aviation Regulations (FAR) Part 77, Objects Affecting Navigable Airspace
36 | Mott MacDonald | Peter Prince Field 2020 Airport Master Plan Update | Santa Rosa County
Table 4.6: FAR Part 77 Imaginary Surfaces
Part 77 Imaginary Surface Existing Dimensions
Primary Surface (Runway 18-36)
Width 500 feet
Length beyond runway end 200 feet
Approach Surface (Runway 18)
Inner width 500 feet
Outer width 1,500 feet
Length 5,000 feet
Slope 20:1
Approach Surface (Runway 36)
Inner width 500 feet
Outer width 1,500 feet
Length 5,000 feet
Slope 20:1
Sources: Federal Aviation Regulations (FAR) Part 77, Objects Affecting Navigable Airspace
37 | Mott MacDonald | Peter Prince Field 2020 Airport Master Plan Update | Santa Rosa County
5 Airfield Demand Capacity and Facility Requirements
This section of the Facility Requirements Chapter serves to determine the airside facilities that will become inadequate to meet the forecast demand levels, projected through 2039. This information provides the basis for the next step in the planning process: the definition and evaluation of airside development alternatives, which is presented in the following chapter.
5.1 Airfield Demand / Capacity Analysis
The purpose of this Airfield Demand/Capacity Analysis is to determine the capability of the airfield to meet the projected levels of aircraft operations and fleet mix. The calculated capacity is compared to the forecasted demands to determine if the airfield configuration will adequately meet those demands without creating unacceptable delays for its users. The airfield analysis is expressed in terms of the hourly processing capacity and the annual service volume. Specific recommendations to address any capacity shortfalls will be addressed in the next section, Airfield Facility Requirements.
5.1.1 Analysis Assumptions
Methods for determining airport capacity and delay are detailed in Federal Aviation Administration (FAA) Advisory Circular 150/5060-5 (including changes 1 and 2), Airport
Capacity and Delay. This Advisory Circular provides a systematic approach for determining the hourly runway and annual airfield capacities. Each of these was calculated for the existing condition as well as for key study years over the 20-year planning period. The capacity of the existing runway depends on several factors including the aircraft fleet mix operating at the Airport and the runway configuration to determine the hourly runway capacity and Annual Service Volume (ASV).
There are four levels of analysis implied by AC 150/5056-5 that can be used to determine the hourly capacity and ASV for airports:
1. Lookup tables. The lookup table method is discussed in Chapter 2 of the AC and provides a high-level capacity analysis. This method it typically used for small airports where airfield capacity is not an issue.
2. Charts, Nomographs, and Spreadsheets. This method is discussed in Chapter 3 of the AC and is typically applied to moderate size airfields with little complexity. The analysis covers a larger variety of runway configurations and operating alternatives than those provided in the lookup table method.
3. Analytical Capacity and Delay Models. This method is described in Chapter 5 of the AC and, which refers to computer programs that calculate airfield capacity and delay based on the methods described in chapter 3 of the AC. This method it typically used for airfields of moderate complexity.
4. Airfield Simulation Models. This method is described in Chapter 5 of the AC and refers to models and computer programs such as the FAA Airport and Airspace Simulation Model (SIMMOD), FAA Airfield Delay Simulation Model (ADSIM), and proprietary software. This method is used for detailed capacity planning of complex airfields or regional airspace systems.
38 | Mott MacDonald | Peter Prince Field 2020 Airport Master Plan Update | Santa Rosa County
The lookup table method was selected for the capacity planning analysis in this chapter as it applies to small master plans and airports with little airfield complexity.
It should be noted that Peter Prince Field does not meet the assumption of having an ILS equipped runway as discussed in the analysis requirements of Chapters 2 and 3 of the AC. Therefore, there may be a reduction in the estimation. However, based on the projections of the Aviation Activity Forecast no future delays are predicted. Furthermore, there are no existing airfield capacity and/or delay issues as confirmed by the FBO’s currently operating at the airport.
5.1.1.1 Runway Configuration
The number of runways at an airport and how they are positioned in relation to one another determines how many arrivals and departures can occur within an hour. For example, if an airport has two runways that are oriented parallel to each other then it is generally possible to have arrivals and departures on both runways at the same time. However, if the two runways intersect, an aircraft departing on one runway must wait for operations on the other to be completed prior to starting its takeoff. As noted in the previous chapters of the Master Plan, the Airport is equipped with one runway, Runway 18-36, which is oriented in a north/south direction. This corresponds to runway use configuration No. 1 as shown in Figure 2-1 of AC 150/5060-5 (Figure 5.1 below).
5.1.1.2 Aircraft Mix Index
In Advisory Circular 150/5060-5, Airport Capacity and Delay, the FAA classifies aircraft based on their maximum certified operational weight. The mix index is a calculated ratio of the aircraft fleet based upon a weight classification system (Refer to Table 5.1). As the number of heavier aircraft increases, so does the mix index. The hourly runway capacity decreases as the mix index increases because the FAA requires that heavier aircraft be spaced further apart from other aircraft for safety reasons.

39 | Mott MacDonald | Peter Prince Field 2020 Airport Master Plan Update | Santa Rosa County
Table 5.1: Aircraft Weight Classification System
Maximum Aircraft Certificated Take- Representative Representative Aircraft ModelsClassification off Weight Aircraft Types
(pounds)
Small 12,500 or less Piston
Piper PA-23, Cessna C-180, Cessna C-207, Cessna C-182 & Beechcraft King
Air C90
Small+ 12,500 - 41,000 Turboprop/Very Light, Light Jets, and Midsize Jets
Beechcraft King Air 350, Cessna Citation V, LearJet 31A, Beechjet 400A
Large 41,001 – 300,000 Heavy
jets/Commercial Airliners
Gulfstream IV (G300 and G400), Bombardier Global Express, Boeing 737
Heavy 300,000 or more Commercial
Airliners Boeing 767, Boeing 747, Airbus A330,
Airbus A380, Antonov 124
Single/Twin Engine
Sources: Adapted from Federal Aviation Administration AC 150/5060-5, Airport Capacity and Delay and Order JO 7360.1
Another way the aircraft fleet influences the airfield’s capacity is based on the time needed for the aircraft to clear the runway either on arrival or departure. As aircraft size and weight increases, so does the time needed for it to slow to a safe taxiing speed or to achieve the needed speed for takeoff. Therefore, a larger aircraft generally requires more runway occupancy time than a smaller aircraft. Thus, as additional larger aircraft enter an airport’s operating fleet the lower the capacity will likely be for that airfield. The aircraft classifications, shown in Table 5.1, are based upon the aircraft maximum certificated takeoff weight, the number of engines, and the wake turbulence classifications. The mix index is defined as the percent of “Small+” and “Large” aircraft plus three times the percent of “Heavy” aircraft. The percent of “Small” aircraft is not considered because the wake turbulence generated by these aircraft dissipates fairly rapidly. Small aircraft can also be spaced closer than “Large” or “Heavy” class aircraft.
For this analysis, the aircraft operational fleet mix was determined based on a review of the Aviation Activity Forecasts. A summary of the percent of operations by aircraft classification is presented in Table 5.2. This table reflects the type of operations conducted at the Airport where “small” and “small+” aircraft make up 100 percent of the daily activity as indicated in the Aviation Activity Forecasts, it is estimated that single engine piston operations made up approximately 82 percent of the daily activity and twin engine piston operations accounted for approximately 13 percent of total daily operations in 2019. The remaining 5 percent included rotorcraft operations.

40 | Mott MacDonald | Peter Prince Field 2020 Airport Master Plan Update | Santa Rosa County
Table 5.2: Forecast of Aircraft Operations Per Airport Reference Code
Airport 2019 Reference Aircraft Aircraft Representative Baseline Anticipated Aircraft Fleet
Code Category Classification Aircraft (Typical) Fleet Mix (%) (ARC) Mix (%)
2019 2024 2029 2039
A-I Single Engine Piston
Small Beech Baron, Cessna 150/182, Piper Archer 81.94% 81.94% 81.94% 81.94%
A-II
B-I
Twin-Engine Piston/Single
Engine Turboprop
Twin-Engine Piston/Light
Jets
Small
Small
Beech E18S, DHC-6 Twin Otter, Cessna
208
Beechcraft Baron 58/ Citation Mustang,
Piper Aerostar 601P
11.52%
1.40%
11.51%
1.40%
11.50%
1.40%
11.46%
1.40%
B-II Turboprop & Midsize Jets
Small+ Beechcraft King Air,
Falcon 10, Citation II, III, IV, V
0.12% 0.14% 0.15% 0.18%
B-III Heavy Jets Small+ Falcon 7X 0.00% 0.00% 0.00% 0.00%
C-I Midsize Jets Small+ Learjet 35, 45 & 55,
Hawker Siddeley HS-125
0.00% 0.00% 0.00% 0.00%
C-II Heavy
Turboprops & Jets
Small+
Beechcraft Super King Air 350,
Gulfstream G150, G200
0.00% 0.00% 0.00% 0.00%
C-III Heavy Jets Large Global
Express/Gulfstream G550
0.00% 0.00% 0.00% 0.00%
D-I Heavy Jets Large Gulfstream G450 0.00% 0.00% 0.00% 0.00%
N/A Helicopter Robinson R44, Eurocopter EC135T2
5.01% 5.01% 5.01% 5.01%
Note: N/A – Not Applicable. Totals may be slightly higher or lower than 100 percent due to rounding.
Sources: Ricondo & Associates, Inc., Existing Condition (2018) Noise Analysis, October 2019; Ricondo & Associates, Inc., April 2020.
41 | Mott MacDonald | Peter Prince Field 2020 Airport Master Plan Update | Santa Rosa County
As shown on Table 5.2, the existing and projected fleet mix at 2R4 includes aircraft categorized as “Small” and “Small+”.
● All single-engine and multi-engine aircraft in the general aviation aircraft fleet that are currently operated and will be operated at 2R4 within the planning period are classified as “Small” and “Small+” aircraft.
● By the end of the planning period, light and midsize jets weighing over 12,500 but less than 41,000 pounds (i.e. falling within the “Small+” category) are anticipated to account for 0.18 percent of the projected fleet mix by 2039. The remainder of the jet aircraft fleet anticipated at the Airport was assumed to fall within the “Small” category.
As indicated in the Aviation Activity Forecasts, an increase in jet aircraft traffic is anticipated through the planning period. However, as previously discussed and noted in the assumptions, this increase in activity will likely be limited to very light, light, and midsize jets, weighting less than 41,000 pounds at maximum takeoff weight. As a result, the mix index is anticipated to remain at zero during the planning period as described below.
The mix index formula provided in AC 150/5060-5 is defined as:
Mix Index (%) = C + 3D, where C equals the percent of Class C aircraft plus 3 times the percent of class D aircraft.
According to Table 1-20 of the Aviation Activity Forecast provided by Ricondo and Associates (Appendix A) no Class C or Class D aircraft forecasted in the in the Aircraft Fleet Mix through the planning period. Therefore, the mix index for Peter Prince is calculated as:
Mix Index (%) = 0 + 3(0) = 0%
5.1.1.3 Percent of Aircraft Arrivals
An arriving aircraft occupies a runway longer than a departing aircraft. The hourly runway capacity, therefore, decreases as the percentage of aircraft arrivals increases. At the Airport, the percentage of aircraft arrivals is expected to remain at 50 percent throughout the planning period.
5.1.1.4 Percent of Aircraft Touch and Go Operations
A touch-and-go operation is defined as an operation by a single aircraft that lands and departs without stopping or exiting the runway. Pilots conducting touch-and-go operations are usually conducting training exercises and, thus, stay in the airport traffic pattern. Airfield capacity, in terms of the number of aircraft operations, increases as the number of touch-and-go operations increases.
This increase in capacity is a result of aircraft continually making approaches and departures without requiring significant runway occupancy time. However, continuous touch-and-go operations reduce the availability of the runway for other non-training operations or may impede aircraft operations on nearby or intersecting runways.
Based on interviews with airport tenants, the level of touch-and-go operations at the Airport is significant. Unfortunately, no official counts are made. Therefore, it was assumed that 55 percent of the local operations were considered to be in the pattern, conducting touch-and-go type operations. Since local operations constitute 92 percent of total operations at the Airport, it is estimated that the current touch-and-go operation represents approximately 51 percent of the Airport total annual operations based on the forecast of operations data provided by Ricondo and Associates in Table 1-16 of Appendix A.
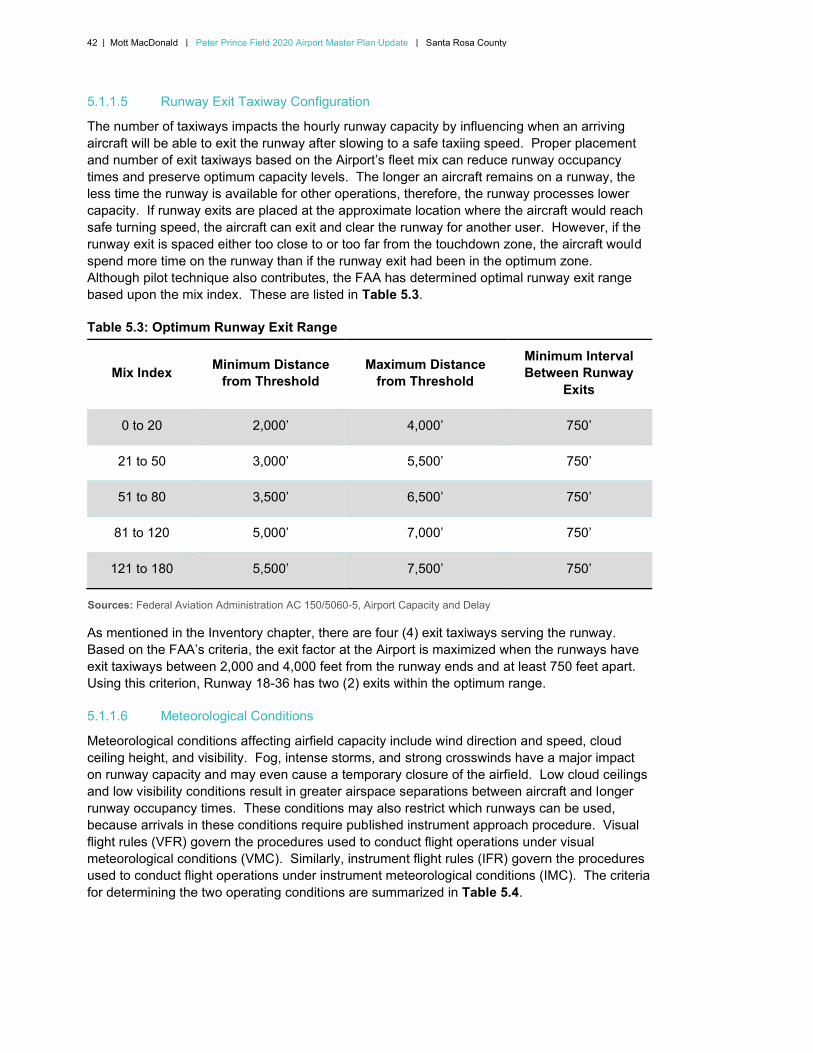
42 | Mott MacDonald | Peter Prince Field 2020 Airport Master Plan Update | Santa Rosa County
5.1.1.5 Runway Exit Taxiway Configuration
The number of taxiways impacts the hourly runway capacity by influencing when an arriving aircraft will be able to exit the runway after slowing to a safe taxiing speed. Proper placement and number of exit taxiways based on the Airport’s fleet mix can reduce runway occupancy times and preserve optimum capacity levels. The longer an aircraft remains on a runway, the less time the runway is available for other operations, therefore, the runway processes lower capacity. If runway exits are placed at the approximate location where the aircraft would reach safe turning speed, the aircraft can exit and clear the runway for another user. However, if the runway exit is spaced either too close to or too far from the touchdown zone, the aircraft would spend more time on the runway than if the runway exit had been in the optimum zone. Although pilot technique also contributes, the FAA has determined optimal runway exit range based upon the mix index. These are listed in Table 5.3.
Table 5.3: Optimum Runway Exit Range
Mix Index Minimum Distance
from Threshold Maximum Distance
from Threshold
Minimum Interval Between Runway
Exits
0 to 20 2,000’ 4,000’ 750’
21 to 50 3,000’ 5,500’ 750’
51 to 80 3,500’ 6,500’ 750’
81 to 120 5,000’ 7,000’ 750’
121 to 180 5,500’ 7,500’ 750’
Sources: Federal Aviation Administration AC 150/5060-5, Airport Capacity and Delay
As mentioned in the Inventory chapter, there are four (4) exit taxiways serving the runway. Based on the FAA’s criteria, the exit factor at the Airport is maximized when the runways have exit taxiways between 2,000 and 4,000 feet from the runway ends and at least 750 feet apart. Using this criterion, Runway 18-36 has two (2) exits within the optimum range.
5.1.1.6 Meteorological Conditions
Meteorological conditions affecting airfield capacity include wind direction and speed, cloud ceiling height, and visibility. Fog, intense storms, and strong crosswinds have a major impact on runway capacity and may even cause a temporary closure of the airfield. Low cloud ceilings and low visibility conditions result in greater airspace separations between aircraft and longer runway occupancy times. These conditions may also restrict which runways can be used, because arrivals in these conditions require published instrument approach procedure. Visual flight rules (VFR) govern the procedures used to conduct flight operations under visual meteorological conditions (VMC). Similarly, instrument flight rules (IFR) govern the procedures used to conduct flight operations under instrument meteorological conditions (IMC). The criteria for determining the two operating conditions are summarized in Table 5.4.
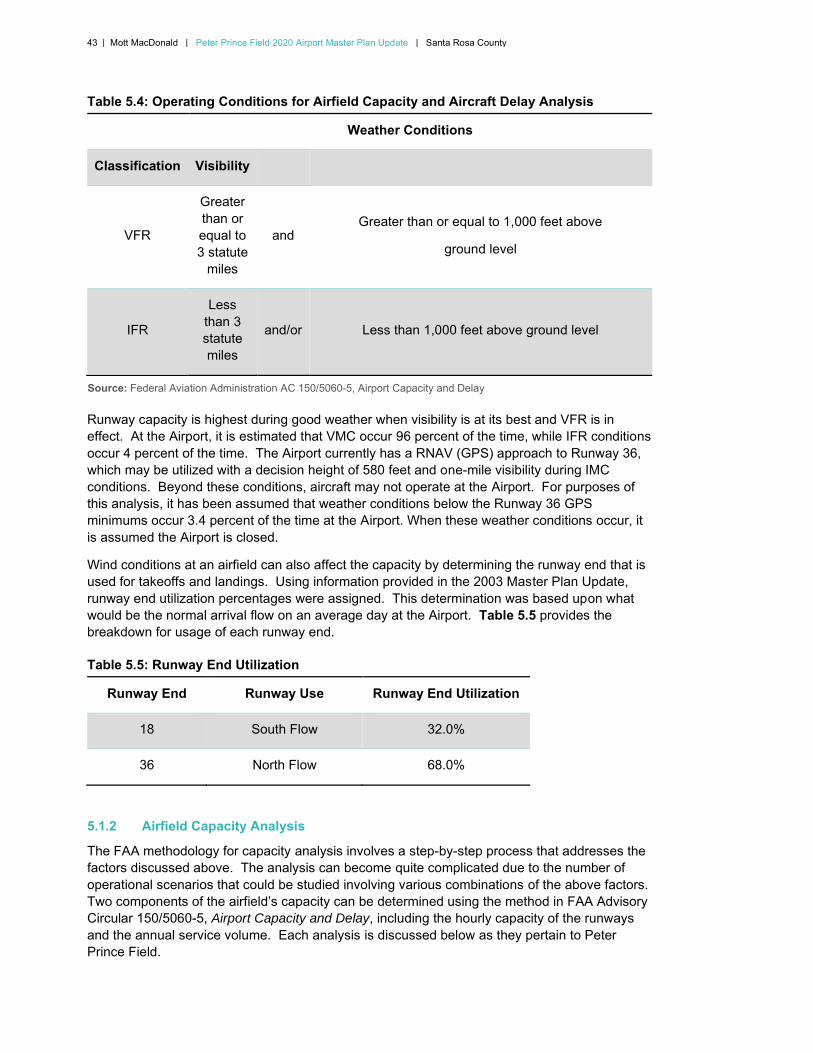
43 | Mott MacDonald | Peter Prince Field 2020 Airport Master Plan Update | Santa Rosa County
Table 5.4: Operating Conditions for Airfield Capacity and Aircraft Delay Analysis
Weather Conditions
Classification Visibility Cloud Ceiling
VFR
Greater than or equal to 3 statute
miles
and Greater than or equal to 1,000 feet above
ground level
IFR
Less than 3 statute miles
and/or Less than 1,000 feet above ground level
Source: Federal Aviation Administration AC 150/5060-5, Airport Capacity and Delay
Runway capacity is highest during good weather when visibility is at its best and VFR is in effect. At the Airport, it is estimated that VMC occur 96 percent of the time, while IFR conditions occur 4 percent of the time. The Airport currently has a RNAV (GPS) approach to Runway 36, which may be utilized with a decision height of 580 feet and one-mile visibility during IMC conditions. Beyond these conditions, aircraft may not operate at the Airport. For purposes of this analysis, it has been assumed that weather conditions below the Runway 36 GPS minimums occur 3.4 percent of the time at the Airport. When these weather conditions occur, it is assumed the Airport is closed.
Wind conditions at an airfield can also affect the capacity by determining the runway end that is used for takeoffs and landings. Using information provided in the 2003 Master Plan Update, runway end utilization percentages were assigned. This determination was based upon what would be the normal arrival flow on an average day at the Airport. Table 5.5 provides the breakdown for usage of each runway end.
Table 5.5: Runway End Utilization
Runway End Runway Use Runway End Utilization
18 South Flow 32.0%
36 North Flow 68.0%
5.1.2 Airfield Capacity Analysis
The FAA methodology for capacity analysis involves a step-by-step process that addresses the factors discussed above. The analysis can become quite complicated due to the number of operational scenarios that could be studied involving various combinations of the above factors. Two components of the airfield’s capacity can be determined using the method in FAA Advisory Circular 150/5060-5, Airport Capacity and Delay, including the hourly capacity of the runways and the annual service volume. Each analysis is discussed below as they pertain to Peter Prince Field.
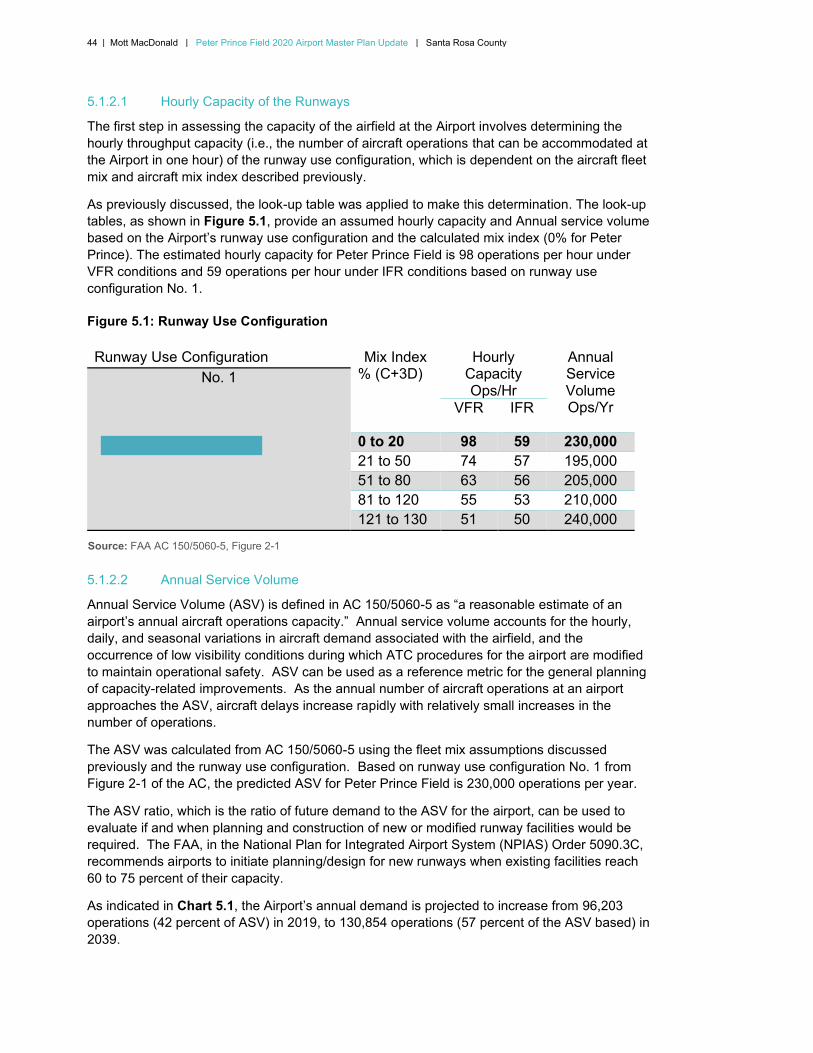
44 | Mott MacDonald | Peter Prince Field 2020 Airport Master Plan Update | Santa Rosa County
5.1.2.1 Hourly Capacity of the Runways
The first step in assessing the capacity of the airfield at the Airport involves determining the hourly throughput capacity (i.e., the number of aircraft operations that can be accommodated at the Airport in one hour) of the runway use configuration, which is dependent on the aircraft fleet mix and aircraft mix index described previously.
As previously discussed, the look-up table was applied to make this determination. The look-up tables, as shown in Figure 5.1, provide an assumed hourly capacity and Annual service volume based on the Airport’s runway use configuration and the calculated mix index (0% for Peter Prince). The estimated hourly capacity for Peter Prince Field is 98 operations per hour under VFR conditions and 59 operations per hour under IFR conditions based on runway use configuration No. 1.
Figure 5.1: Runway Use Configuration
Runway Use Configuration Mix Index Hourly Annual % (C+3D) Capacity
Ops/Hr Service Volume Ops/Yr
No. 1
VFR IFR
0 to 20 98 59 230,000 21 to 50 74 57 195,000 51 to 80 63 56 205,000 81 to 120 55 53 210,000 121 to 130 51 50 240,000
Source: FAA AC 150/5060-5, Figure 2-1
5.1.2.2 Annual Service Volume
Annual Service Volume (ASV) is defined in AC 150/5060-5 as “a reasonable estimate of an airport’s annual aircraft operations capacity.” Annual service volume accounts for the hourly, daily, and seasonal variations in aircraft demand associated with the airfield, and the occurrence of low visibility conditions during which ATC procedures for the airport are modified to maintain operational safety. ASV can be used as a reference metric for the general planning of capacity-related improvements. As the annual number of aircraft operations at an airport approaches the ASV, aircraft delays increase rapidly with relatively small increases in the number of operations.
The ASV was calculated from AC 150/5060-5 using the fleet mix assumptions discussed previously and the runway use configuration. Based on runway use configuration No. 1 from Figure 2-1 of the AC, the predicted ASV for Peter Prince Field is 230,000 operations per year.
The ASV ratio, which is the ratio of future demand to the ASV for the airport, can be used to evaluate if and when planning and construction of new or modified runway facilities would be required. The FAA, in the National Plan for Integrated Airport System (NPIAS) Order 5090.3C, recommends airports to initiate planning/design for new runways when existing facilities reach 60 to 75 percent of their capacity.
As indicated in Chart 5.1, the Airport’s annual demand is projected to increase from 96,203 operations (42 percent of ASV) in 2019, to 130,854 operations (57 percent of the ASV based) in 2039.
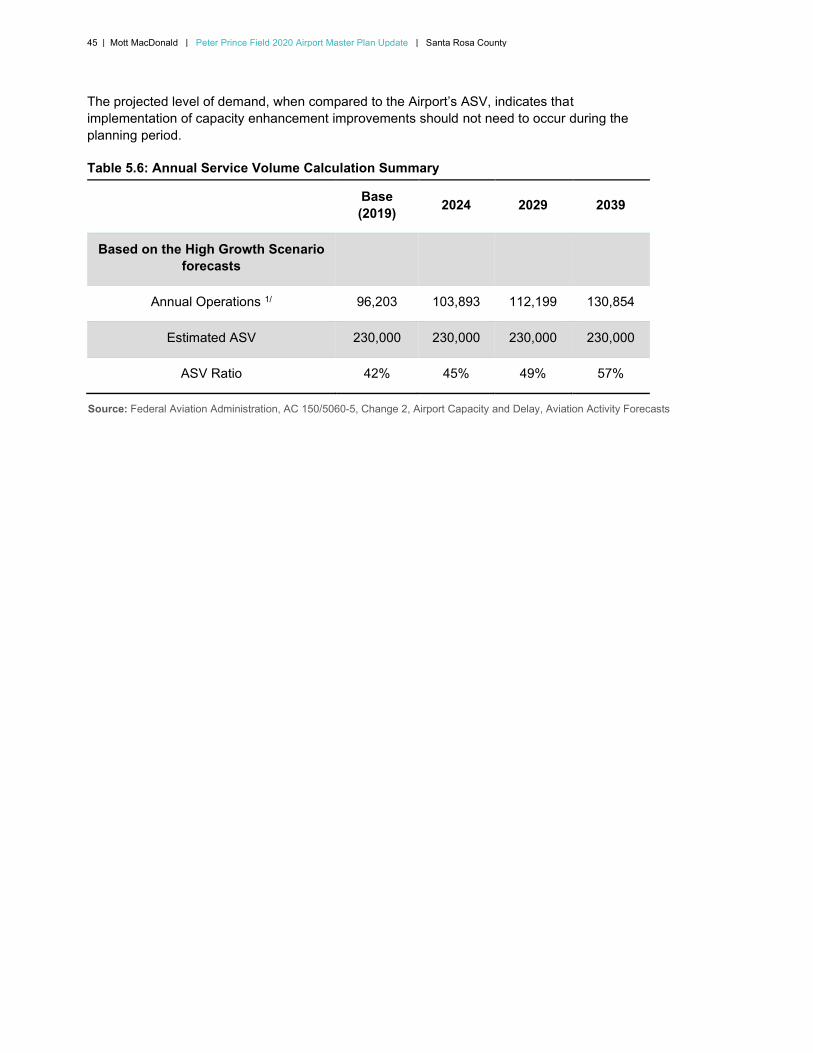
45 | Mott MacDonald | Peter Prince Field 2020 Airport Master Plan Update | Santa Rosa County
The projected level of demand, when compared to the Airport’s ASV, indicates that implementation of capacity enhancement improvements should not need to occur during the planning period.
Table 5.6: Annual Service Volume Calculation Summary
Base 2024 2029 2039(2019)
Based on the High Growth Scenario forecasts
Annual Operations 1/ 96,203 103,893 112,199 130,854
Estimated ASV 230,000 230,000 230,000 230,000
ASV Ratio 42% 45% 49% 57%
Source: Federal Aviation Administration, AC 150/5060-5, Change 2, Airport Capacity and Delay, Aviation Activity Forecasts
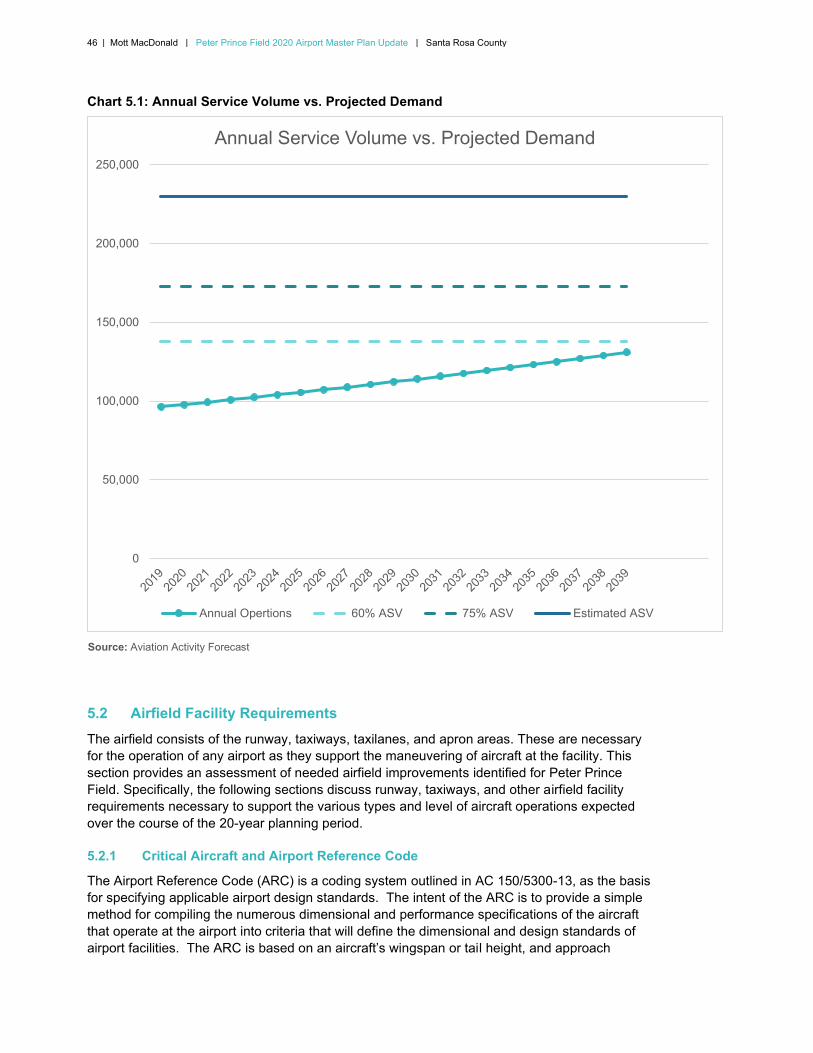
46 | Mott MacDonald | Peter Prince Field 2020 Airport Master Plan Update | Santa Rosa County
Chart 5.1: Annual Service Volume vs. Projected Demand
0
50,000
100,000
150,000
200,000
250,000
Annual Service Volume vs. Projected Demand
Annual Opertions 60% ASV 75% ASV Estimated ASV
Source: Aviation Activity Forecast
5.2 Airfield Facility Requirements
The airfield consists of the runway, taxiways, taxilanes, and apron areas. These are necessary for the operation of any airport as they support the maneuvering of aircraft at the facility. This section provides an assessment of needed airfield improvements identified for Peter Prince Field. Specifically, the following sections discuss runway, taxiways, and other airfield facility requirements necessary to support the various types and level of aircraft operations expected over the course of the 20-year planning period.
5.2.1 Critical Aircraft and Airport Reference Code
The Airport Reference Code (ARC) is a coding system outlined in AC 150/5300-13, as the basis for specifying applicable airport design standards. The intent of the ARC is to provide a simple method for compiling the numerous dimensional and performance specifications of the aircraft that operate at the airport into criteria that will define the dimensional and design standards of airport facilities. The ARC is based on an aircraft’s wingspan or tail height, and approach
47 | Mott MacDonald | Peter Prince Field 2020 Airport Master Plan Update | Santa Rosa County
speed. It relates the operational and physical characteristics of the most demanding aircraft expected to operate at, or make substantial use of the airport, to airport design criteria. The airport design criterion includes the size of runway safety areas, runway and taxiway/taxilane length, and width, and separation distances. As discussed in Chapter 4 and in the Aviation Activity Forecast (Appendix A) the Airport falls within the ARC B-I category.
5.2.2 FAA Design Standards
Tables 4.3 – 4.5 from Chapter 4: Design Criteria present the dimensional design standards for ARC B-I as listed in FAA AC 150/5300-13, as well as the existing airfield facilities key dimensions. This table provides the foundation for assessing future facility needs and airfield geometric standards. Further details on future runway, taxiways, and navigational aids needs are provided in the following sections. The existing airfield layout, which currently meets the ARC B-I standards, is illustrated in Figure 5.2.
5.2.3 Runway Requirements
As indicated in the Airfield Demand/Capacity section, the Airport will not experience significant runway capacity related problems during the planning period and no major airfield improvement, such as the construction of a new runway, will be needed over the next 20 years. Future runway requirements, including length, width, shoulders, and etc. are discussed in the following subsections.

48 | Mott MacDonald | Peter Prince Field 2020 Airport Master Plan Update | Santa Rosa County
Figure 5.2: Existing Airfield Layout
49 | Mott MacDonald | Peter Prince Field 2020 Airport Master Plan Update | Santa Rosa County
5.2.3.1 Runway Length Requirements
The following sections discuss the runway length needs that would allow the Airport to meet the operational requirements of current and projected users. Runway length is a critical component at each airport. While insufficient runway length may restrict operations by some aircraft, too long of a runway may result in unnecessary maintenance costs. This section provides a high-level overview of runway length requirements based on a review of aircraft’s published balanced field length1. However, no detailed analysis has been conducted to account for the Airport elevation, the mean and maximum average daily temperatures, and runway centerline elevation. Runway extension alternatives are discussed in the next Chapter of this Master Plan Update.
As reflected in the Inventory chapter, Runway 18-36 has an overall length of 3,701 feet and a width of 75 feet. Table 5.7 presents balanced field runway length requirements for the operational fleet mix identified in the Aviation Activity Forecast. As shown, all turboprop aircraft known or anticipated to operate at the Airport require a minimum runway length ranging between 2,079 and 3,415 feet. Similarly, minimum runway length requirements for light jets vary between 2,427 and 3,300 feet. Finally, minimum runway length requirements for midsize jets vary between 3,160 and 5,489 feet.
Considering the balanced field runway length requirements listed in Table 5.7 and in light of the feedback provided by the existing FBO representatives, a minimum runway length of between 4,500 and 5,000 feet, as previously recommended in the previous Master Plan, should be considered to meet the demands associated with the fleet of aircraft, especially if very light and light jet business jet that could operate into the Airport become more frequent than anticipated. This runway extension would provide an opportunity to accommodate a broader range of aircraft type, could help spur additional itinerant traffic at the Airport, and would give pilots greater flexibility in meeting their stage length and payload requirements. The practicality of a runway extension at the Airport will be discussed in the Airport Development Alternatives chapter.
5.2.3.2 Runway Width
The FAA has determined runway width requirements based upon the critical aircraft’s approach speed and wingspan. The various widths provide a certain margin of error to account for wind effects on aircraft landing and taking off. Since the Airport has been determined to have an ARC of B-I throughout the planning period, Runway 18-36 should be maintained at its existing width of 75 feet.
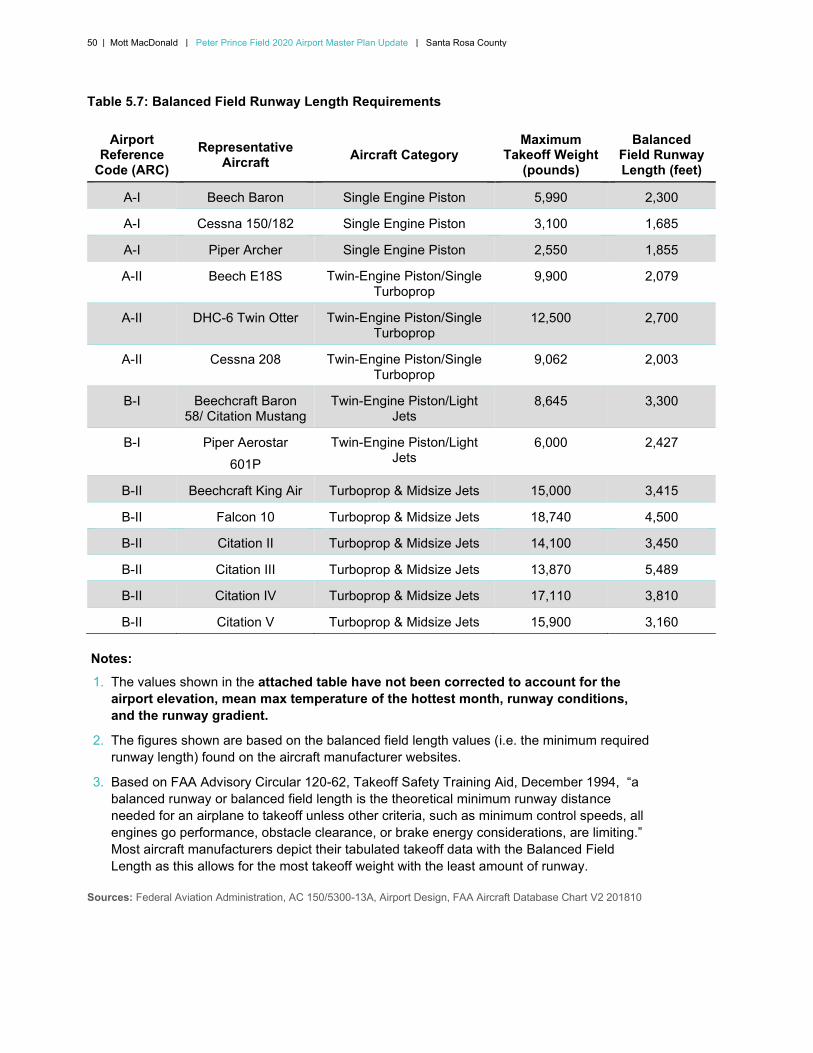
50 | Mott MacDonald | Peter Prince Field 2020 Airport Master Plan Update | Santa Rosa County
Table 5.7: Balanced Field Runway Length Requirements
AirportReference
Code (ARC) Representative
Aircraft Aircraft Category Maximum
Takeoff Weight(pounds)
Balanced Field RunwayLength (feet)
A-I Beech Baron Single Engine Piston 5,990 2,300
A-I Cessna 150/182 Single Engine Piston 3,100 1,685
A-I Piper Archer Single Engine Piston 2,550 1,855
A-II Beech E18S Twin-Engine Piston/Single 9,900 2,079 Turboprop
A-II DHC-6 Twin Otter Twin-Engine Piston/Single Turboprop
12,500 2,700
A-II Cessna 208 Twin-Engine Piston/Single 9,062 2,003 Turboprop
B-I Beechcraft Baron 58/ Citation Mustang
Twin-Engine Piston/Light Jets
8,645 3,300
B-I Piper Aerostar 601P
Twin-Engine Piston/Light Jets
6,000 2,427
B-II Beechcraft King Air Turboprop & Midsize Jets 15,000 3,415
B-II Falcon 10 Turboprop & Midsize Jets 18,740 4,500
B-II Citation II Turboprop & Midsize Jets 14,100 3,450
B-II Citation III Turboprop & Midsize Jets 13,870 5,489
B-II Citation IV Turboprop & Midsize Jets 17,110 3,810
B-II Citation V Turboprop & Midsize Jets 15,900 3,160
Notes: 1. The values shown in the attached table have not been corrected to account for the
airport elevation, mean max temperature of the hottest month, runway conditions, and the runway gradient.
2. The figures shown are based on the balanced field length values (i.e. the minimum required runway length) found on the aircraft manufacturer websites.
3. Based on FAA Advisory Circular 120-62, Takeoff Safety Training Aid, December 1994, “a balanced runway or balanced field length is the theoretical minimum runway distance needed for an airplane to takeoff unless other criteria, such as minimum control speeds, all engines go performance, obstacle clearance, or brake energy considerations, are limiting.” Most aircraft manufacturers depict their tabulated takeoff data with the Balanced Field Length as this allows for the most takeoff weight with the least amount of runway.
Sources: Federal Aviation Administration, AC 150/5300-13A, Airport Design, FAA Aircraft Database Chart V2 201810

51 | Mott MacDonald | Peter Prince Field 2020 Airport Master Plan Update | Santa Rosa County
5.2.3.3 Runway Pavement Strength
Runway pavement strength can be expressed as single-wheel loading, dual-wheel loading, and dual-tandem-wheel loading. The aircraft gear type and configurations dictate how the aircraft weight is distributed on the pavement and determine pavement response to loading. Examination of gear configuration, tire contact areas, and tire pressure in common use areas, indicates that pavement strength is related to aircraft maximum take-off weight.
As noted in the Airport Master Record (FAA Form 5010), Runway 18-36 has a single-wheel capacity of 22,000 pounds. Non-jet aircraft within the ARC B-II category or below generally have gross maximum weights of less than 12,500 pounds. As indicated in Table 5.7, light and midsize jet aircraft have reported gross weight ranging from 6,000 to 19,000 pounds. Therefore, the existing pavement strength is appropriate for the forecasted operational fleet mix. Pavement strengthening should only occur if it has been demonstrated that a significant increase in larger aircraft is imminent or occurring.
5.2.3.4 Runway Pavement Conditions
The pavement condition index (PCI) of Runway 18-36 averages 100, indicating that the runway is in good condition according to the FDOT Statewide Airfield Pavement Management Program report (November 2019) as shown in Figure 5.3. The runway was re-surfaced in 2016. While no major pavement rehabilitation is anticipated in the short-term future, the Santa Rosa County should continue conducting regular pavement repairs such as crack sealing when needed.
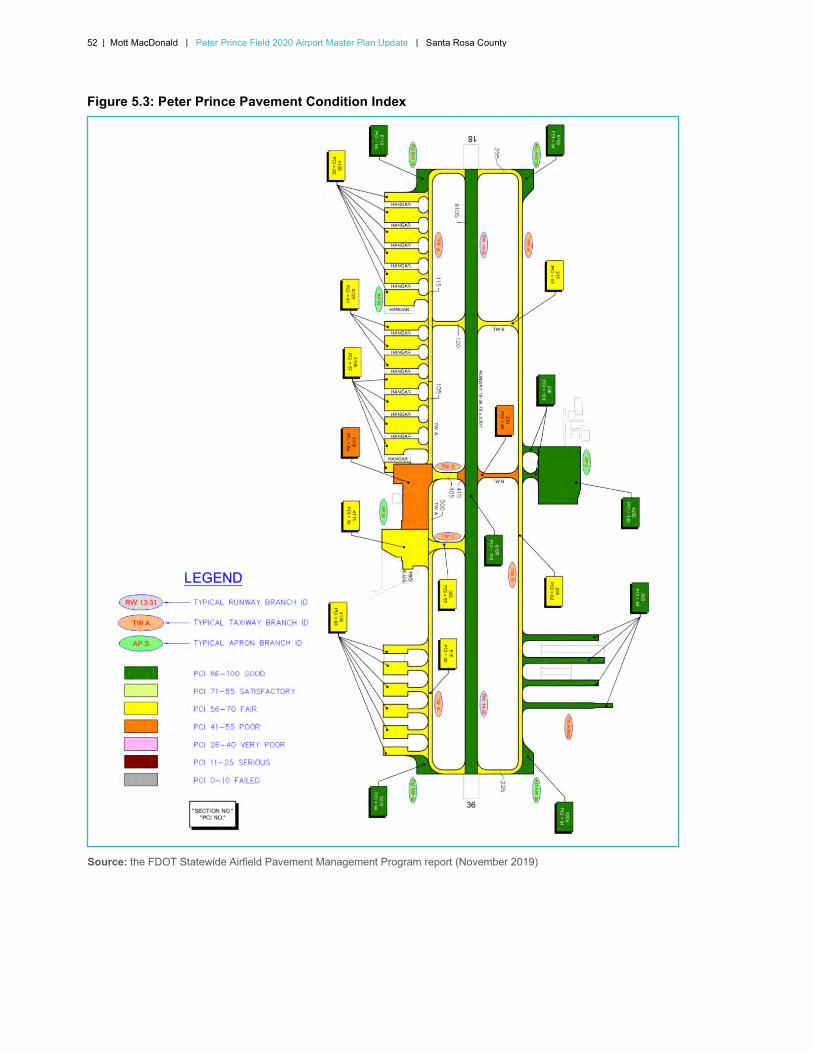
52 | Mott MacDonald | Peter Prince Field 2020 Airport Master Plan Update | Santa Rosa County
Figure 5.3: Peter Prince Pavement Condition Index
Source: the FDOT Statewide Airfield Pavement Management Program report (November 2019)

53 | Mott MacDonald | Peter Prince Field 2020 Airport Master Plan Update | Santa Rosa County
5.2.3.5 Runway Shoulder Width
Currently, Runway 18-36 does not have paved shoulders. Runway shoulders are not required or recommended for runways with an ARC of B-I. Therefore, there is no runway shoulder deficiency.
5.2.3.6 Runway Blast Pads
ADG I aircraft require a blast pad width of 80 feet and a length of 60 feet per AC 150/5300-13A Appendix 7, Table A7-1. These areas are paved but are not usually constructed of full-strength pavement. They serve to reduce erosion formed by jet blast produced upon aircraft takeoff. The existing runway blast pads meet current FAA design standards for up to ADG II aircraft, which requires a width of 95 feet and a length of 150 feet.
5.2.3.7 Runway to Taxiway Separation Distance
The FAA’s design standards for runway to taxiway separation distances ensure that aircraft can safely operate on parallel taxiways without encroaching the runway safety area, obstacle free zone, runway protection zone or navigational aids critical areas. For B-I runways, the FAA requires a 150-foot separation distance between the runway centerline and parallel taxiway centerline. The existing runway centerline to Taxiway A centerline separation is 250 feet, which exceeds FAA standards. Similarly, the existing runway centerline to Taxiway B centerline separation is 300 feet, which also exceeds FAA standards.
5.2.4 Airfield Safety Criteria
The FAA’s design standards for the various airfield safety areas, as they relate to the Airport, are presented in this section. The following is a list of the airfield safety protection areas that were evaluated for the Airport:
● Runway Safety Areas (RSA) ● Runway Object Free Areas (ROFA) ● Obstacle Free Zones (OFZ) ● Runway OFZ
● Runway Protection Zones (RPZ)
The existing Airport Layout Plan (ALP) was used to determine the locations of objects which may affect navigation.
5.2.4.1 Runway Safety Area
Runway Safety Areas (RSAs) are rectangular areas centered on runway centerlines, which, under normal (dry) conditions, are capable of supporting aircraft without causing structural damage to the aircraft or injury to its occupants, should an aircraft inadvertently leave the paved runway surface. To serve this function, the FAA requires RSAs to be (1) cleared and graded, (2) drained by grading or storm sewers to prevent water accumulation, and (3) free of objects, except those that need to be located in the RSA because of their function (e.g., approach lighting, other NAVAIDS).
Based on the FAA B-I design standards, the RSA for the existing runway should be 120 feet wide and extend 240 feet beyond the runway ends. The existing RSA meets the B-I criteria.
54 | Mott MacDonald | Peter Prince Field 2020 Airport Master Plan Update | Santa Rosa County
5.2.4.2 Runway Object Free Area
The Runway Object Free Areas (ROFAs) are rectangular areas centered on runway centerlines that are required to be clear of objects protruding above the RSA edge elevation, except for those objects that are essential to air navigation or aircraft ground maneuvering. Objects that are nonessential for either air navigation or aircraft ground maneuvering are not permitted within the ROFA.
For runways serving ARC B-I aircraft, ROFAs must be 250 feet wide (i.e., 125 feet on either side of the runway centerline) and extend 240 feet beyond the end of the runway or stopway. The ROFA for the existing runway meets the ARC B-I requirements.
5.2.4.3 Obstacle Free Zone
The Obstacle Free Zones (OFZs) are three-dimensional volumes of airspace that support the transition of ground to airborne aircraft (and vice versa). The OFZ clearance standards established by the FAA prohibit taxiing and parking aircraft or locating other objects where they would penetrate this airspace, except frangible NAVAIDS or fixed-function objects. The OFZ consists of the airspace below 150 feet above the established airport elevation, which is 82 feet, and along the runway and extended runway centerline. The OFZ can be further categorized as inner-approach OFZs and inner-transitional OFZs.
The required runway OFZ for runways serving aircraft less than 12,500 pounds is typically 250 feet wide and extends 200 feet beyond each end of the runway. The OFZs for the existing runway meet current FAA standards. Currently, the only objects within the runway OFZs are NAVAIDS required to be located there because of their function.
5.2.4.4 Runway Protection Zone
The Runway Protection Zone (RPZ) is a trapezoidal area centered on the extended runway centerline. The length and width of the RPZ are contingent on the size of the aircraft operating on the runway as well as the type of approach (i.e., visual, instrument) and approach minimums available. As a result, the criteria for the RPZ may vary for each end.
RPZs are designed to enhance the protection of people and property on the ground. To achieve this goal, the FAA recommends that the airport operator own the property in the RPZ. This area should be free of land uses that create glare and smoke. Also, the FAA recommends that airport operators keep the RPZs clear of incompatible land uses, specifically residences, fuel storage facilities, and places of public assembly (e.g., churches, schools, office buildings, and shopping centers). Typically, a single RPZ is associated with each runway end; however, the FAA has suggested that separate approach and departure RPZs be defined for any runway end with a displaced arrival threshold.
According to the FAA-approved ALP, the RPZs for the runway ends have an inner width of 250 feet, an outer width of 450 feet, and extend 1,000 feet. These RPZs, which begin 200 feet from the runway ends, encompass approximately 8.035 acres. Given the airspace restrictions currently in place at the Airport and the number of military airfields near the Airport, Runway 36 is not likely to offer precision approach capability, with lower than one statute-mile approach visibility minimums. Similarly, given the proximity of Naval Air Station (NAS) Whiting Field, Runway 18 is not likely to offer non-precision or precision approach capability in the future. Therefore, the future dimensions of the RPZs are anticipated to remain the same during the planning period.
55 | Mott MacDonald | Peter Prince Field 2020 Airport Master Plan Update | Santa Rosa County
Since the RPZ extends beyond the existing property limits, however, it is recommended that the Santa Rosa County acquire fee title (when feasible or financially viable) to all land within the RPZ and/or acquire avigation easements that adequately restricts current and future use of the land surface to preclude incompatible uses and convey the right of flight with inherent noise and vibration below the approach surface, the right to remove obstructions encroaching existing and future approach surfaces, and a restriction against the establishment of future obstructions.
Numerous trees have been identified as obstructions within the RPZ and penetrating the 20:1 approach slope at both ends of Runway 18-36, as noted in the FDOT’s June 2020 Airport Inspection Record. These trees should be removed from the RPZ/Approach surface to avoid any potential obstruction hazards upon approach.
5.2.5 Taxiway Requirements
The existing airport taxiways serve as routes for aircraft to maneuver to and from various portions of the Airport. FAA taxiway design standards are determined by aircraft wingspan for the critical aircraft routinely using the taxiway. These standards allow an appropriate safety margin beyond the maximum wingspan for the Airplane Design Group and Taxiway Design Group. The followings sections discuss the existing taxiways and required improvements to meet the ARC B-I standards. It should be noted that other taxiway improvements might be identified during the alternatives analysis to provide appropriate access to new development areas.
It should be noted that in 2014 FAA AC 150/5300-13A was updated to Change 1, which primarily includes updates to the standards for taxiway fillet design. Taxiways A and B, as well as connector Taxiways A4 and B4, were constructed prior to the implementation of this rule. Therefore, any future upgrades to the taxiways will require compliance with the new design fillets. In 2019, connector taxiways A2, A3, and B3 were demolished to remove direct connections from the aprons to the runway. Taxiways A3 and B3 were reconstructed approximately 900 feet south of their previous locations and were designed and constructed according to the new taxiway fillet criteria in FAA AC 150/5300-13A Change 1.
Taxiways A and B have PCI’s of 62 indicating that they are in fair condition according to the FDOT Statewide Airfield Pavement Management Program report (November 2019) as shown in Figure 5.3. Taxiway A will be re-surfaced in 2021. This project will also include the demolition and reconstruction of cross-taxiway A4 to bring it into compliance with the latest FAA taxiway fillet geometry standards. Similarly, it is anticipated that Taxiway B will be resurfaced in 2022 including the demolition/reconstruction of cross taxiway B4.
Additionally, Taxilanes on the West side of the Airport have PCI’s ranging from 56-70 and are therefore in fair condition. The West Apron has a PCI of 54 and is in poor condition. While taxilanes on the East side of the Airport and the East Apron are currently in good condition, normal deterioration will occur due to use and exposure to the elements. Therefore, the taxilanes on both sides of the Airfield will need resurfacing during the planning period to maintain functionality.
5.2.5.1 Taxiway A
Taxiway A, which serves as a full-length parallel taxiway along the east side of Runway 18-36, meets the B-I standards. This taxiway, which is 25 feet wide, maintains a runway to taxiway centerline separation of 250 feet. Design Group I safety and clearance criteria include the safety area with a width of 49 feet and the OFA with a width of 89 feet. Both widths are centered on the designated taxiway centerline. Taxiway A meets these two requirements.
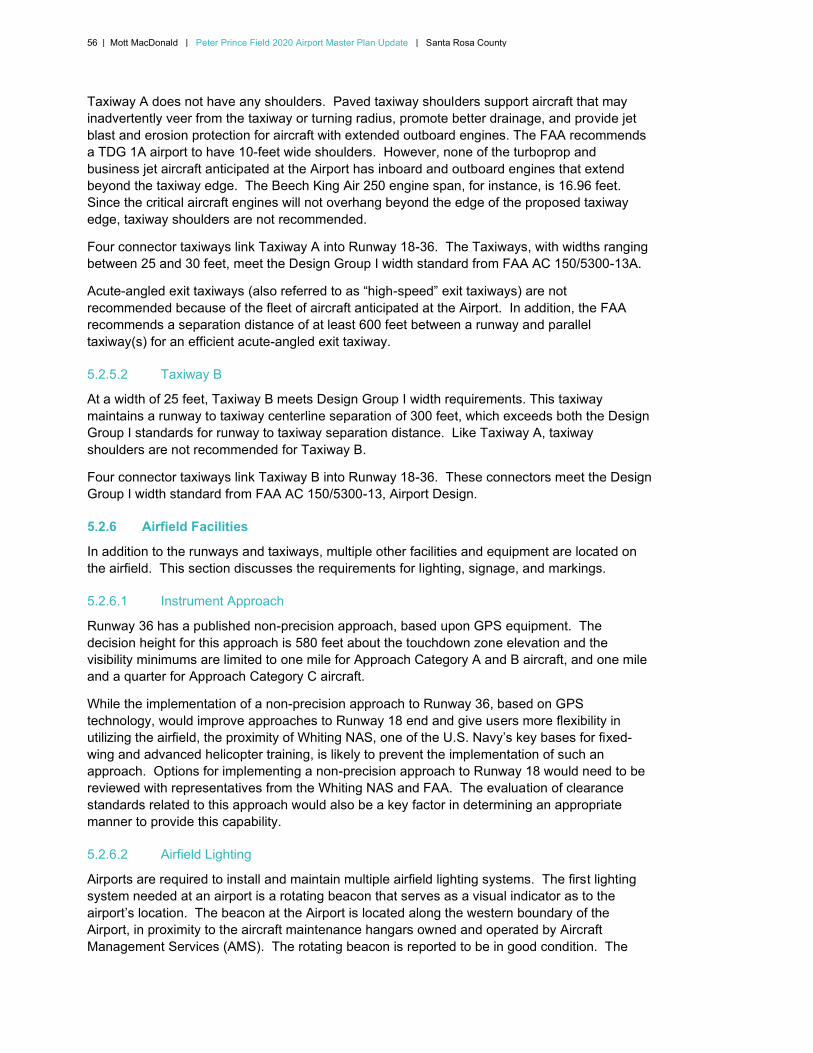
56 | Mott MacDonald | Peter Prince Field 2020 Airport Master Plan Update | Santa Rosa County
Taxiway A does not have any shoulders. Paved taxiway shoulders support aircraft that may inadvertently veer from the taxiway or turning radius, promote better drainage, and provide jet blast and erosion protection for aircraft with extended outboard engines. The FAA recommends a TDG 1A airport to have 10-feet wide shoulders. However, none of the turboprop and business jet aircraft anticipated at the Airport has inboard and outboard engines that extend beyond the taxiway edge. The Beech King Air 250 engine span, for instance, is 16.96 feet. Since the critical aircraft engines will not overhang beyond the edge of the proposed taxiway edge, taxiway shoulders are not recommended.
Four connector taxiways link Taxiway A into Runway 18-36. The Taxiways, with widths ranging between 25 and 30 feet, meet the Design Group I width standard from FAA AC 150/5300-13A.
Acute-angled exit taxiways (also referred to as “high-speed” exit taxiways) are not recommended because of the fleet of aircraft anticipated at the Airport. In addition, the FAA recommends a separation distance of at least 600 feet between a runway and parallel taxiway(s) for an efficient acute-angled exit taxiway.
5.2.5.2 Taxiway B
At a width of 25 feet, Taxiway B meets Design Group I width requirements. This taxiway maintains a runway to taxiway centerline separation of 300 feet, which exceeds both the Design Group I standards for runway to taxiway separation distance. Like Taxiway A, taxiway shoulders are not recommended for Taxiway B.
Four connector taxiways link Taxiway B into Runway 18-36. These connectors meet the Design Group I width standard from FAA AC 150/5300-13, Airport Design.
5.2.6 Airfield Facilities
In addition to the runways and taxiways, multiple other facilities and equipment are located on the airfield. This section discusses the requirements for lighting, signage, and markings.
5.2.6.1 Instrument Approach
Runway 36 has a published non-precision approach, based upon GPS equipment. The decision height for this approach is 580 feet about the touchdown zone elevation and the visibility minimums are limited to one mile for Approach Category A and B aircraft, and one mile and a quarter for Approach Category C aircraft.
While the implementation of a non-precision approach to Runway 36, based on GPS technology, would improve approaches to Runway 18 end and give users more flexibility in utilizing the airfield, the proximity of Whiting NAS, one of the U.S. Navy’s key bases for fixed-wing and advanced helicopter training, is likely to prevent the implementation of such an approach. Options for implementing a non-precision approach to Runway 18 would need to be reviewed with representatives from the Whiting NAS and FAA. The evaluation of clearance standards related to this approach would also be a key factor in determining an appropriate manner to provide this capability.
5.2.6.2 Airfield Lighting
Airports are required to install and maintain multiple airfield lighting systems. The first lighting system needed at an airport is a rotating beacon that serves as a visual indicator as to the airport’s location. The beacon at the Airport is located along the western boundary of the Airport, in proximity to the aircraft maintenance hangars owned and operated by Aircraft Management Services (AMS). The rotating beacon is reported to be in good condition. The

57 | Mott MacDonald | Peter Prince Field 2020 Airport Master Plan Update | Santa Rosa County
FAA, however, estimates a 15 to 20-year life for airport beacons; thus, this beacon will be due for rehabilitation within this planning period.
The runway is equipped with a Medium Intensity Runway Lights (MIRL) system for night operations and restricted visibility. Both Taxiways A and B currently have Medium Intensity Taxiway Lights (MITLs) installed. However, numerous lights are broken and approximately half the length of Taxiway A is unlit. It is anticipated that new LED lighting will be constructed along Taxiway A in 2021 as part of the FAA funded Taxiway A rehabilitation project. Further, Taxiways B and B4 will likely undergo the same rehabilitation and lighting improvements in 2022. The airport aims to upgrade all airfield lighting to LED lights in the future, including the Runway.
In 2019, connector taxiways A3 and B3 were updated with new LED taxiway edge lighting as part of the taxiway relocation project.
The existing lighting systems should be expanded with any runway or taxiway extensions. Additionally, replacement of the lighting system should be considered if the frequency of maintenance activities on these systems increases significantly.
5.2.6.3 Airfield Signage
Throughout the planning period, existing signage should be maintained in proper working order. Additionally, as other airfield pavement projects are conducted, new signage should be installed meeting FAA design criteria. The types and number of new signs that are likely to be required during the planning period will depend upon the selected development alternatives.
5.2.6.4 Pavement Markings
Airport pavements are marked with painted lines and numbers in order to aid in the identification of the runway(s) from the air and to provide information to the pilot during the approach phase of flight. There are three standard sets of markings used depending on the type of runway:
● Basic - For runways with only visual or circle to land procedures. These markings consist of runway designation markers and a centerline stripe.
● Non-precision - For runways to which a straight-in, non-precision instrument approach has been approved. These markings consist of runway designation markers, a centerline stripe, and threshold markings.
● Precision - For runways with a precision instrument approach. These markings consist of the non-precision markings plus aiming point markings, touchdown zone stripes, and side stripes indicating the extent of the full-strength pavement.
Depending on the type of aircraft activity and physical characteristics of the pavement, additional markings may be required for any of the three categories above. Runway pavement and displaced threshold markings are painted white, while taxiway pavement markings are painted yellow.
A description of the existing markings on airfield pavement areas was provided in the Inventory chapter. All areas have the appropriate markings for the existing conditions; however, the markings are in need of refreshing to maintain visibility. This should typically occur every 10 years.
Runway 36 has non-precision approach markings, including threshold marking, whereas Runway 18 has the basic runway markings. Both Taxiways A and B are marked with centerline markings. In addition, lead-in lines and taxilane centerlines are provided on the pavement areas leading to the existing T-hangars.
58 | Mott MacDonald | Peter Prince Field 2020 Airport Master Plan Update | Santa Rosa County
All runway and taxiway markings periodically need to be remarked so that they remain visible to the users of the Airport. As future pavement improvements are made, airfield markings should be put in place that comply with FAA AC 150/5340-1M, Standards for Airport Markings (or the most current version of the AC in existence at that time).
5.2.6.5 Visual Landing Aids
The runway ends are equipped with 2-box Precision Approach Path Indicator (PAPI) lighting systems that provide aircraft with a visual descent reference during approach. As indicated in Figure 1-2, the PAPIs are located on the left side of Runways 18 and on the left side of Runway 36. In addition, both runway ends are equipped with runway end identifier lights (REIL)s. The REILs consist of two synchronized flashing lights, located on each side of the runway threshold, that provide rapid and positive identification of the runway end. Throughout the planning period, existing visual landing aids should be maintained in proper working order. However, no additional visual landing aids are anticipated at the Airport.
5.2.6.6 Wind Direction Indicators
The lighted segmented circle and wind cone is in good condition. No improvements are recommended to the existing system, beyond routine maintenance.
5.2.7 Summary of Recommended Improvements
Figure 5.4 highlights the airfield improvements based on the discussions above. The Airport will not experience significant runway capacity related problems during the planning period and no major airfield improvement, such as the construction of a new runway, will be needed over the next 20 years. Further, the Airport meets the FAA’s dimensional and design standards for airport facilities serving ARC B-I aircraft as discussed in FAA Advisory Circular 150/5300-13A. Therefore, recommended improvements are primarily maintenance activities in nature. These projects include pavement rehabilitation for taxilanes and taxiways, refreshment of airfield pavement markings, and removal of obstructions within the approach slope. Additionally, the airport seeks to upgrade the airfield lights to LED throughout the planning period. Funding for these projects, as well as other desired improvements at the airport, are further discussed in the Capital Improvements Plan.
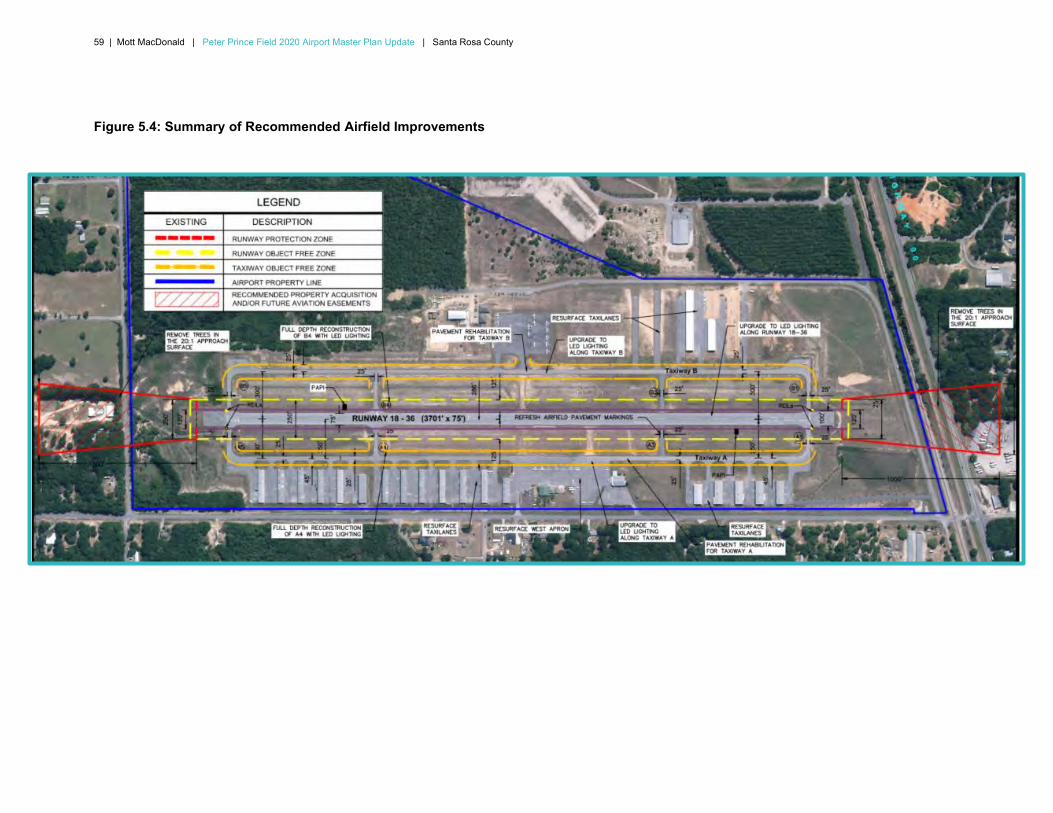
59 | Mott MacDonald | Peter Prince Field 2020 Airport Master Plan Update | Santa Rosa County
Figure 5.4: Summary of Recommended Airfield Improvements
60 | Mott MacDonald | Peter Prince Field 2020 Airport Master Plan Update | Santa Rosa County
6 Environmental Overview
The purpose of this chapter is to present an overview of the existing environmental conditions at Peter Prince Field (2R4). Such an overview does not constitute an Environmental Assessment (EA), as defined by the Federal Aviation Administration (FAA) Order 5050.4B, National
Environmental Policy Act (NEPA) Implementing Instructions for Airport Actions; however, the analysis in this section is conducted in accordance with the guidelines set forth in the FAA order entitled, “Airport Environmental Handbook.” Under this document, 20 categories have been determined as possible areas of impact and must be addressed. These categories are:
● Airport Noise
● Land Use
● Social Impacts
● Induced Socio-Economic Impacts
● Air Quality
● Water Quality
● Department of Transportation Act, Section 4(f) lands
● Historical, Architectural, Archeological, and Cultural Resources
● Biotic Communities
● Threatened and Endangered Species of Flora and Fauna
● Wetlands
● Floodplains
● Coastal Zone Management ● Coastal Barriers
● Wild and Scenic Rivers
● Prime Farmland
● Energy Supply and Natural Resources
● Light Emissions
● Solid Waste Impacts
● Construction Impacts
For the purposes of this study, these environmental categories will be addressed only as they apply specifically to 2R4 and will otherwise be noted as not applicable to the Airport. In considering potential environmental impacts within this framework, the following Environmental Overview points out those categories that may warrant more detailed analysis in a formal EA for the preferred development alternative.
61 | Mott MacDonald | Peter Prince Field 2020 Airport Master Plan Update | Santa Rosa County
6.1 Airport Noise
Noise is the most apparent environmental impact from an airport, receiving most complaints from nearby residents, and therefore, most mitigation efforts. The DNL, or average day-night sound level in decibel values, is recommended by the FAA as the national standard for measuring airport noise, with a sound level of 65 DNL or less compatible with most residential land uses. Therefore, noise levels greater than this measurement should be contained within the Airport property lines to the greatest degree possible. In areas around the Airport where noise levels exceed 65 DNL, other methods of mitigation such as land acquisition, zoning requirements, and the purchase of easements may be utilized as possible remedies for incompatible land uses.
A recent noise analysis was conducted at Peter Prince Field to determine noise impacts as of 2018. The noise analysis, Existing Conditions (2018) Noise Analysis (Appendix B) conducted by Ricondo and Associates, utilizes Aviation Environmental Design Tool (ADET) Version 2D to produce the aircraft noise exposure contours. The noise analysis completed in this Master Plan does not constitute a Part 150 Noise Study. Figure 6.1 illustrates the existing (2018) noise contours at the Airport.
6.1.1 Major Assumptions
Existing Development Scenarios: The updated contours reflect the airport fleet mix and activity level as they exist in the year 2018. At the direction of Santa Rosa County, the 2018 FAA Terminal Area Forecast (TAF) was used to input the 2018 fiscal year annual operations, and 4,160 local general aviation operations in the FAA TAF were allocated to local military (equivalent to 2,080 touch-and-goes). It was further assumed that runway 36 was utilized 68% of the time and runway 18 was utilized 32% of the time. These assumptions, along with arrival and departure flight tracks were verified for accuracy with Santa Rosa County and representative from the FBO’s and the Navy.
Day/Night Operations: Most traffic to 2R4 flies during daytime hours. However, some operations do take place at night. The computer program computes the impact of night operations by multiplying their perceived sound intensity level by a factor of 10 dBa. For the purposes of noise modeling, the FAA defines night operations as those that take place between the hours of 10 p.m. and 7 a.m.
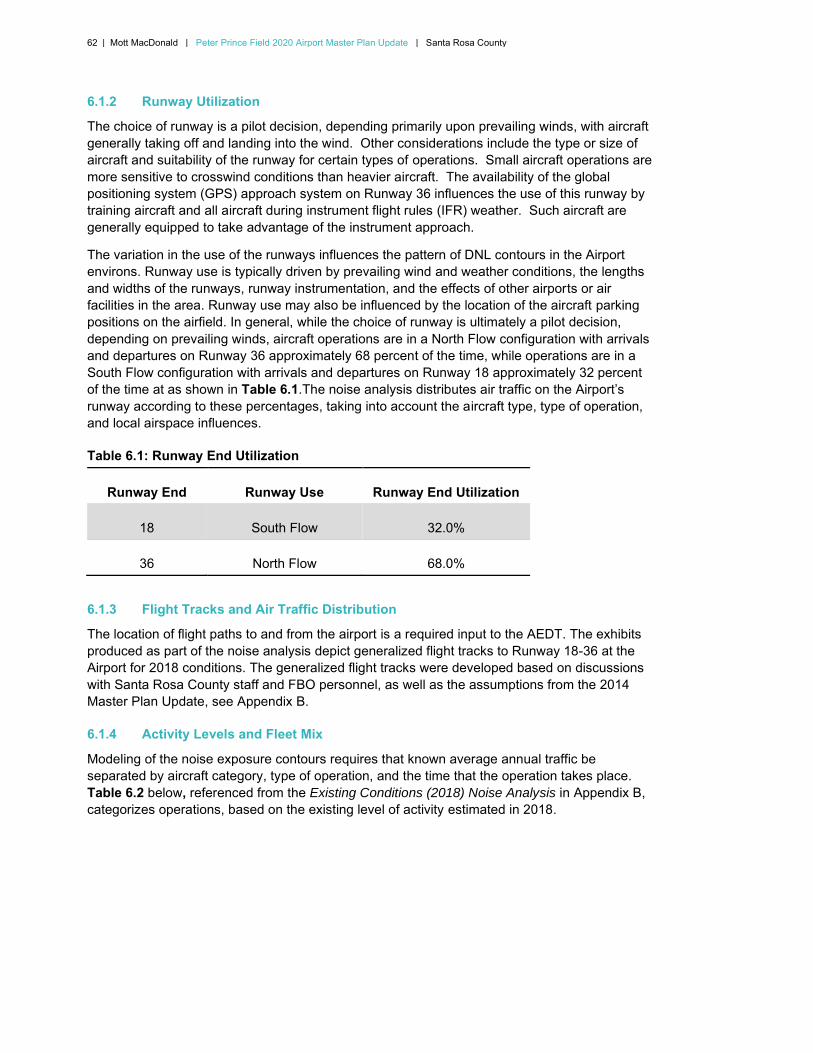
62 | Mott MacDonald | Peter Prince Field 2020 Airport Master Plan Update | Santa Rosa County
6.1.2 Runway Utilization
The choice of runway is a pilot decision, depending primarily upon prevailing winds, with aircraft generally taking off and landing into the wind. Other considerations include the type or size of aircraft and suitability of the runway for certain types of operations. Small aircraft operations are more sensitive to crosswind conditions than heavier aircraft. The availability of the global positioning system (GPS) approach system on Runway 36 influences the use of this runway by training aircraft and all aircraft during instrument flight rules (IFR) weather. Such aircraft are generally equipped to take advantage of the instrument approach.
The variation in the use of the runways influences the pattern of DNL contours in the Airport environs. Runway use is typically driven by prevailing wind and weather conditions, the lengths and widths of the runways, runway instrumentation, and the effects of other airports or air facilities in the area. Runway use may also be influenced by the location of the aircraft parking positions on the airfield. In general, while the choice of runway is ultimately a pilot decision, depending on prevailing winds, aircraft operations are in a North Flow configuration with arrivals and departures on Runway 36 approximately 68 percent of the time, while operations are in a South Flow configuration with arrivals and departures on Runway 18 approximately 32 percent of the time at as shown in Table 6.1.The noise analysis distributes air traffic on the Airport’s runway according to these percentages, taking into account the aircraft type, type of operation, and local airspace influences.
Table 6.1: Runway End Utilization
Runway End Runway Use Runway End Utilization
18 South Flow 32.0%
36 North Flow 68.0%
6.1.3 Flight Tracks and Air Traffic Distribution
The location of flight paths to and from the airport is a required input to the AEDT. The exhibits produced as part of the noise analysis depict generalized flight tracks to Runway 18-36 at the Airport for 2018 conditions. The generalized flight tracks were developed based on discussions with Santa Rosa County staff and FBO personnel, as well as the assumptions from the 2014 Master Plan Update, see Appendix B.
6.1.4 Activity Levels and Fleet Mix
Modeling of the noise exposure contours requires that known average annual traffic be separated by aircraft category, type of operation, and the time that the operation takes place. Table 6.2 below, referenced from the Existing Conditions (2018) Noise Analysis in Appendix B, categorizes operations, based on the existing level of activity estimated in 2018.
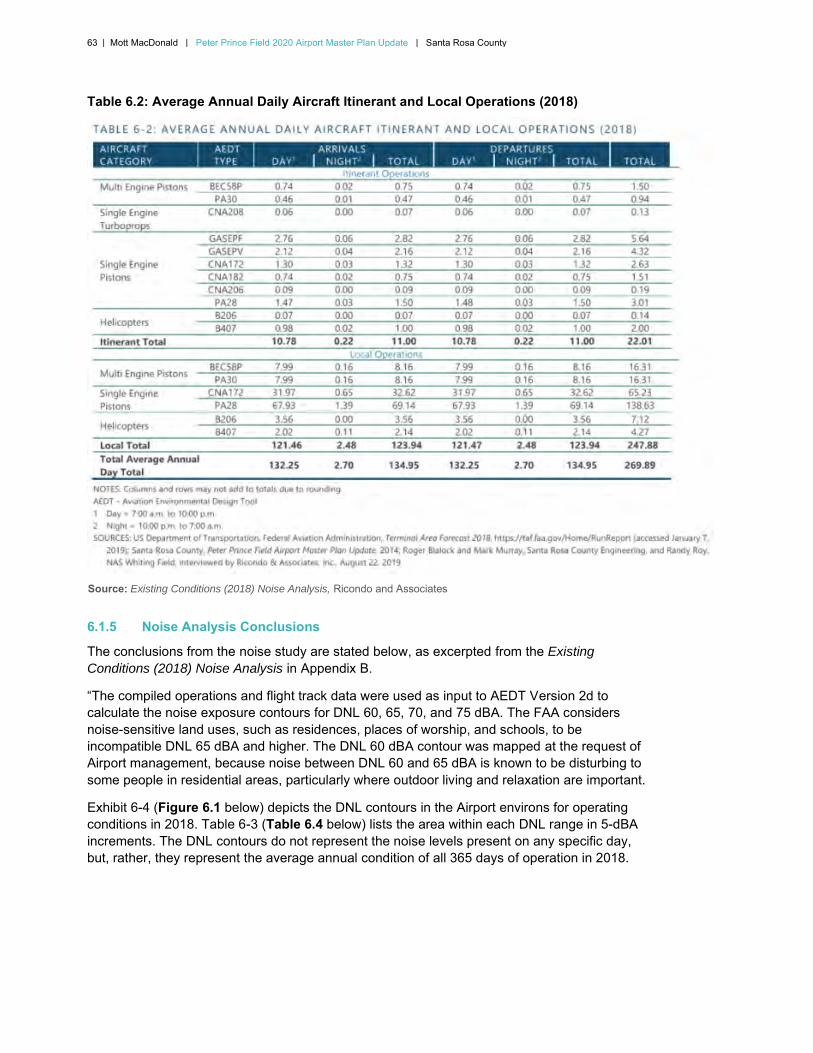
63 | Mott MacDonald | Peter Prince Field 2020 Airport Master Plan Update | Santa Rosa County
Table 6.2: Average Annual Daily Aircraft Itinerant and Local Operations (2018)
Source: Existing Conditions (2018) Noise Analysis, Ricondo and Associates
6.1.5 Noise Analysis Conclusions
The conclusions from the noise study are stated below, as excerpted from the Existing
Conditions (2018) Noise Analysis in Appendix B.
“The compiled operations and flight track data were used as input to AEDT Version 2d to calculate the noise exposure contours for DNL 60, 65, 70, and 75 dBA. The FAA considers noise-sensitive land uses, such as residences, places of worship, and schools, to be incompatible DNL 65 dBA and higher. The DNL 60 dBA contour was mapped at the request of Airport management, because noise between DNL 60 and 65 dBA is known to be disturbing to some people in residential areas, particularly where outdoor living and relaxation are important.
Exhibit 6-4 (Figure 6.1 below) depicts the DNL contours in the Airport environs for operating conditions in 2018. Table 6-3 (Table 6.4 below) lists the area within each DNL range in 5-dBA increments. The DNL contours do not represent the noise levels present on any specific day, but, rather, they represent the average annual condition of all 365 days of operation in 2018.
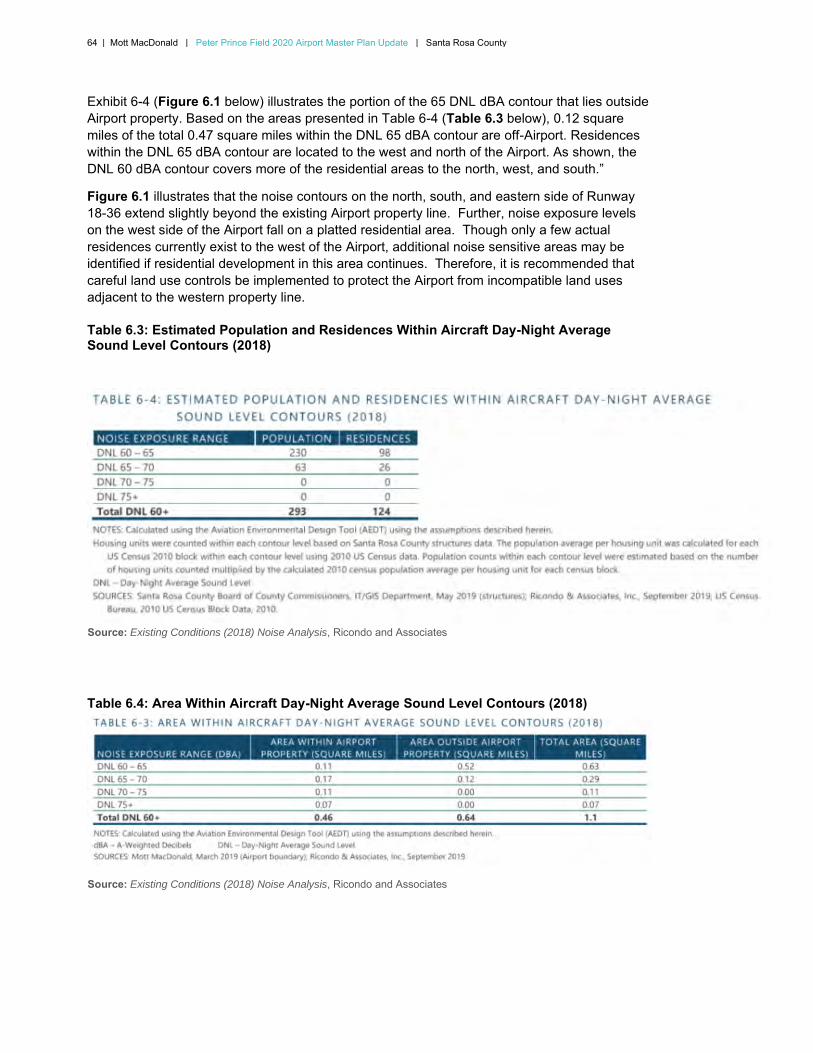
64 | Mott MacDonald | Peter Prince Field 2020 Airport Master Plan Update | Santa Rosa County
Exhibit 6-4 (Figure 6.1 below) illustrates the portion of the 65 DNL dBA contour that lies outside Airport property. Based on the areas presented in Table 6-4 (Table 6.3 below), 0.12 square miles of the total 0.47 square miles within the DNL 65 dBA contour are off-Airport. Residences within the DNL 65 dBA contour are located to the west and north of the Airport. As shown, the DNL 60 dBA contour covers more of the residential areas to the north, west, and south.”
Figure 6.1 illustrates that the noise contours on the north, south, and eastern side of Runway 18-36 extend slightly beyond the existing Airport property line. Further, noise exposure levels on the west side of the Airport fall on a platted residential area. Though only a few actual residences currently exist to the west of the Airport, additional noise sensitive areas may be identified if residential development in this area continues. Therefore, it is recommended that careful land use controls be implemented to protect the Airport from incompatible land uses adjacent to the western property line.
Table 6.3: Estimated Population and Residences Within Aircraft Day-Night Average Sound Level Contours (2018)
Source: Existing Conditions (2018) Noise Analysis, Ricondo and Associates
Table 6.4: Area Within Aircraft Day-Night Average Sound Level Contours (2018)
Source: Existing Conditions (2018) Noise Analysis, Ricondo and Associates
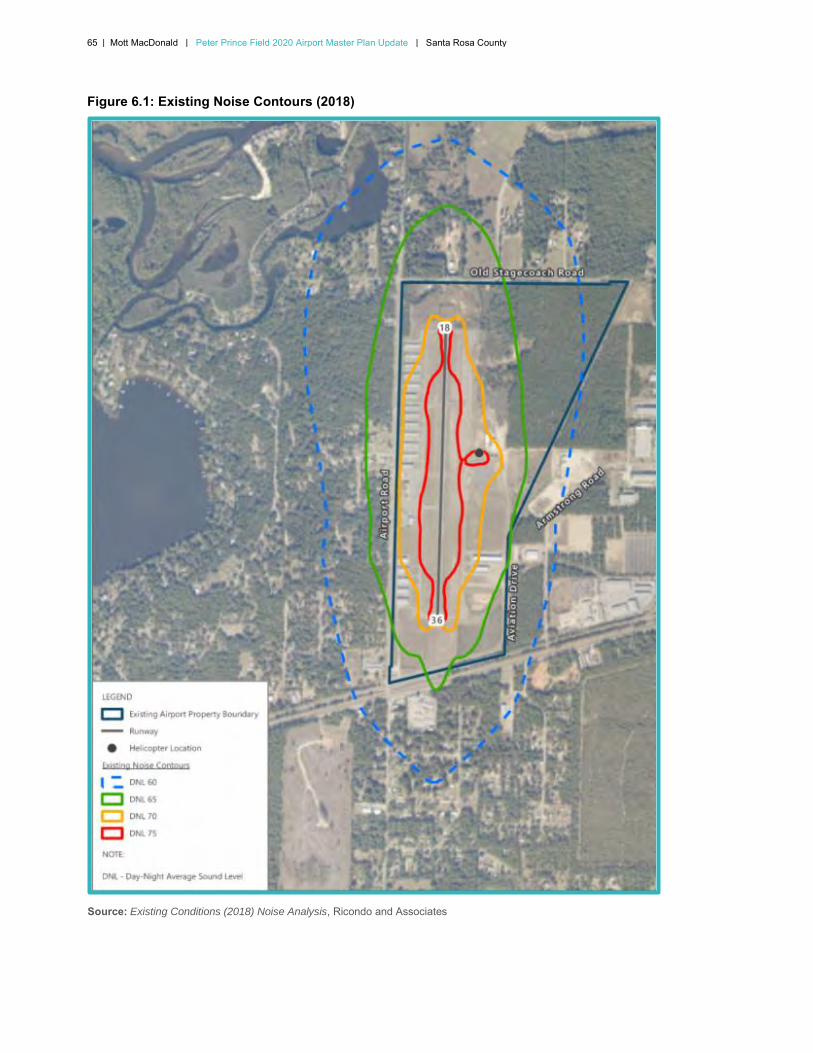
65 | Mott MacDonald | Peter Prince Field 2020 Airport Master Plan Update | Santa Rosa County
Figure 6.1: Existing Noise Contours (2018)
Source: Existing Conditions (2018) Noise Analysis, Ricondo and Associates
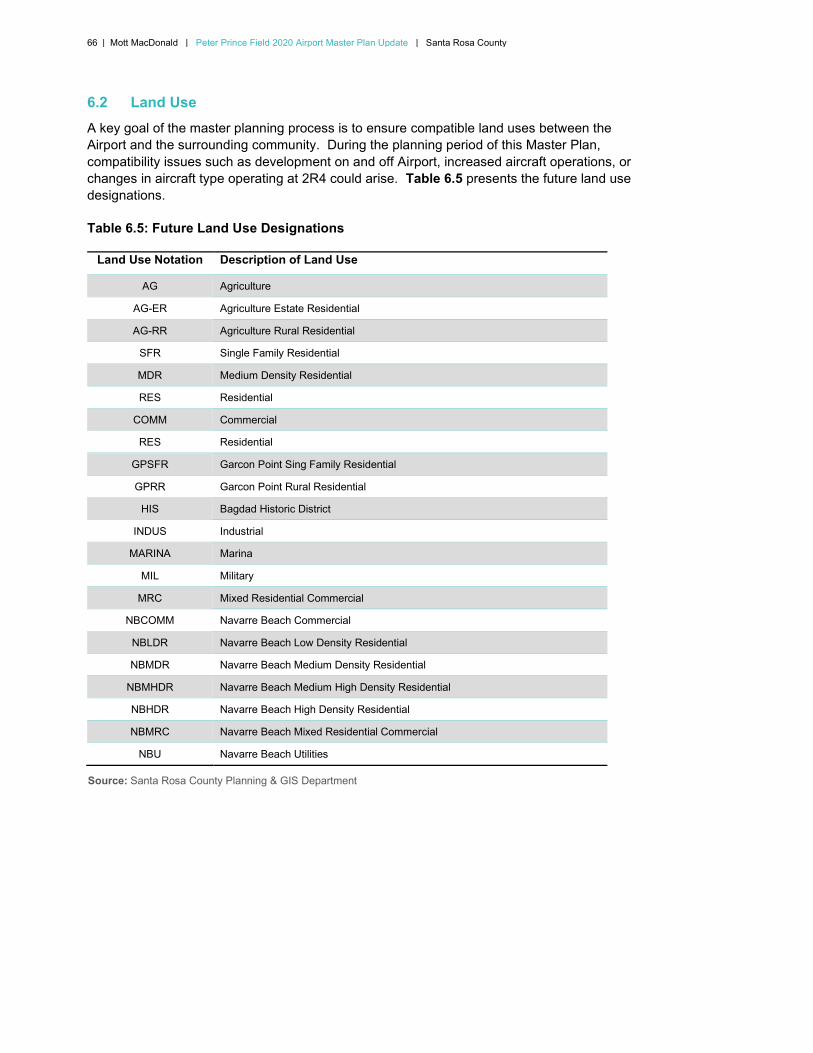
66 | Mott MacDonald | Peter Prince Field 2020 Airport Master Plan Update | Santa Rosa County
6.2 Land Use
A key goal of the master planning process is to ensure compatible land uses between the Airport and the surrounding community. During the planning period of this Master Plan, compatibility issues such as development on and off Airport, increased aircraft operations, or changes in aircraft type operating at 2R4 could arise. Table 6.5 presents the future land use designations.
Table 6.5: Future Land Use Designations
Land Use Notation Description of Land Use
AG Agriculture
AG-ER Agriculture Estate Residential
AG-RR Agriculture Rural Residential
SFR Single Family Residential
MDR Medium Density Residential
RES Residential
COMM Commercial
RES Residential
GPSFR Garcon Point Sing Family Residential
GPRR Garcon Point Rural Residential
HIS Bagdad Historic District
INDUS Industrial
MARINA Marina
MIL Military
MRC Mixed Residential Commercial
NBCOMM Navarre Beach Commercial
NBLDR Navarre Beach Low Density Residential
NBMDR Navarre Beach Medium Density Residential
NBMHDR Navarre Beach Medium High Density Residential
NBHDR Navarre Beach High Density Residential
NBMRC Navarre Beach Mixed Residential Commercial
NBU Navarre Beach Utilities
Source: Santa Rosa County Planning & GIS Department
67 | Mott MacDonald | Peter Prince Field 2020 Airport Master Plan Update | Santa Rosa County
6.2.1 Santa Rosa County Land Use
Lands in the vicinity of 2R4 are under the county’s jurisdiction. Aviation/land use issues in this area are subject to Article Eleven of the Land Development Code titled Airport Environs. The provisions set fort therein provide guidance and restrictions the height of structures and objects of natural growth, lighting and marking of objects, and regulates the use of land in the vicinity of the Airport. These sections define Airport hazard areas, height restrictions, noise restrictions, land use restrictions, and other control methods. The right to establish such an ordinance is empowered to the county by Section 333.03 Requirement to Adopt Airport Zoning Regulations
of the Florida Statutes.
The Santa Rosa County 2040 Comprehensive Plan was adopted in 2016. This document’s primary goal as it relates to airfields is “To protect the current and long term viability of military and public airfields for purposes of promoting a diverse local economy that supports rewarding jobs and quality of life for County residents, and support effective and safe training environments for the Nation’s military forces while protecting the health and safety of the County’s citizens.”
The two objectives related to this goal are:
Objective 1.3.A: The County will ensure that future development within adopted Military Airport Zones (MAZs) and Public Airport Zones (PAZs) will not negatively impact current and long-term viable use of the airfield, will promote health and welfare by limiting incompatible land uses, and allow compatible land uses within such areas.
Objective 1.3.B: Continue to foster meaningful intergovernmental coordination between the County, the military and the Federal Aviation Administration to ensure that land use decisions are not in conflict with military operations or federal aviation standards, and that such decisions promote the health and safety of the County’s public.
The policies described in the document under each objective are designed to help the county and its stakeholders to adhere to the objectives laid forth in the document, and to ensure that the future land use designated for these areas remain compatible with these goals and objectives.
The Airport Installation Compatible Use Zones (AICUZ) Future Land Use Map is provided in Figure 6.2 below.
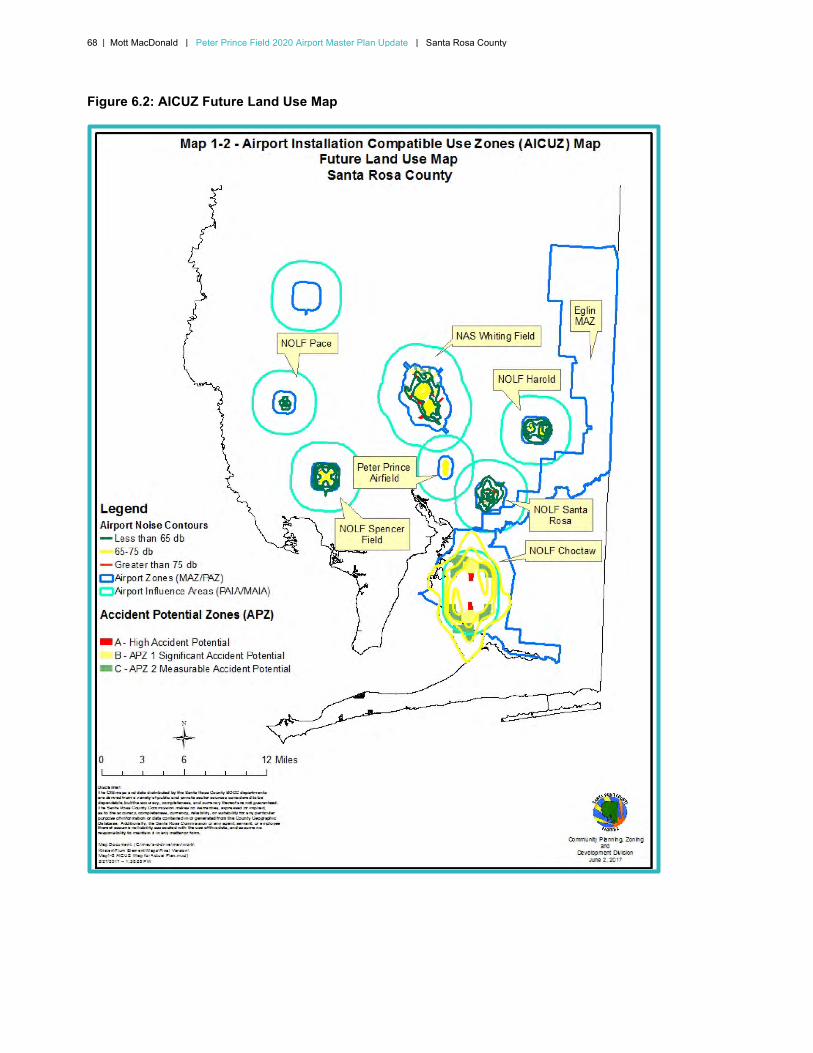
68 | Mott MacDonald | Peter Prince Field 2020 Airport Master Plan Update | Santa Rosa County
Figure 6.2: AICUZ Future Land Use Map
69 | Mott MacDonald | Peter Prince Field 2020 Airport Master Plan Update | Santa Rosa County
6.3 Social Impacts
The principal social impacts that must be considered are; the relocation of business and/or residence, alteration of surface transportation patterns, the division or disruption of established communities, disruption of orderly planned development, and the creation of an appreciable change in employment. If any relocation of residential or commercial properties is required, compensation shall be made under the Uniform Relocations Assistance and Real Property Acquisition Policies Act of 1970, as amended by the Surface Transportation and Uniform Relocation Act of 1987 and its implementing regulations (49 CFR Part 24).
There are no proposed projects or development alternatives that require the relocation of businesses and/or residences or will alter or disrupt transportation and existing communities in the vicinity of 2R4.
6.4 Induced Socio-Economic Impacts
Induced socio-economic impacts are those impacts on surrounding communities that are generally produced by large-scale development projects. The scope of such development may create shifts in population movement and growth patterns, public service and demand, and changes in commercial and economic activity. Development activity on this scale is not anticipated at 2R4 within the term of this study.
6.5 Air Quality
Guidelines for regulating air quality have been established by the Federal Clean Air Act and all implementation and enforcement of these guidelines is the responsibility of the Environmental Protection Agency (EPA). Section 110 of this act requires that states develop a State Implementation Plan (SIP) to comply with federal air quality standards. National Ambient Air Quality Standards have been established under Section 109 to protect public health. The FAA must ensure that all Federal airport actions, such as financial awards and grants, conform to the state plan for controlling air pollution impacts.
Since the state of Florida does not have indirect source review requirements, compliance with state and federal guidelines is accomplished by reviewing the forecasted operational level of the Airport. No air quality analysis is needed if the projected levels of GA activity are below 180,000 operations and 1.3 million GA passengers. The current and forecast level of GA operations and passengers at 2R4 fall below this level. Therefore, no air quality analysis is required.
Air quality standards at 2R4 and Santa Rosa County as a whole meet those established by the previously mentioned federal and state legislation. However, as initiated by the Airport Act of 1982, an air quality certification from the State of Florida is required prior to any construction to ensure that federal and state air quality standards will be met.
6.6 Water Quality
Water quality at 2R4 is regulated by federal and state legislation. The Federal Water Pollution Control Act as amended by the Clean Water Act provides the authority to establish water control standards control discharges into surface and subsurface waters develop waste treatment management plans and practices and issue permits for discharges and for dredged or filled materials into surface waters. The Fish and Wildlife Coordination Act requires consultation with the U.S. Fish and Wildlife Service and appropriate State agency when any alteration and/or impounding of water resources is expected. Additionally, the Federal National Pollution Discharge Elimination System (NPDES) provides regulations that govern the quality of stormwater discharged into the water resources of the U.S.

70 | Mott MacDonald | Peter Prince Field 2020 Airport Master Plan Update | Santa Rosa County
Permitting requirements for construction that exceeds one acre are specified by NPDES and are administered by the Florida Department of Environmental Protection (FDEP). Coordination with both the FDEP and the appropriate Florida Water Management District is necessary to ensure water quality. All necessary discharge permits are in place and substandard water quality at 2R4 does not currently exist. NPDES permits will be required for any proposed development having greater than 1 acre of disturbance.
6.7 Department of Transportation Act, Section 4(f) Lands
The Department of Transportation Act Section 4(f) provides that no project which requires the use of any land from a public park or recreational area wildlife and waterfowl refuge or historic site be approved by the Secretary of the Interior unless there is no viable alternative and provisions to minimize any possible harm are included in the planning. Enforcement of this legislation is the primary responsibility of the Department of the Interior. Assistance may be received, however by the U.S. Fish and Wildlife Service and Army Corps of Engineers.
There are no section 4(f) lands within the expandable area of 2R4. Therefore, Airport development is not expected to impact any of the abovementioned lands.
6.8 Historical, Architectural, Archeological, and Cultural Resources
The National Historic Preservation Act of 1966 and the Archeological and Historic Preservation Act of 1974 provide protection against development impacts that would cause change in the historical architectural archeological or cultural qualities of the property. A review of the National Register of Historic Places shows that no significant archeological or historical sites are present or eligible for listing in the vicinity of 2R4.
6.9 Biotic Communities
The Fish and Wildlife Coordination Act (48 Statute 401 as amended; 16 USC et seq.) requires consideration of possible impacts of airport development projects to habitat and wildlife. Section Two of this act requires consultation with the U.S. Fish and Wildlife Service, the U.S. Department of the Interior, and the state agencies that regulate wildlife and water resources. In the case of water resources, this would particularly apply to such instances where proposed development by any public or private agency would result in modification of the flow and/or shape or watershed of any stream or body of water.
The U.S. Fish and Wildlife Service has authority under this act to provide comments and recommendations concerning vegetation and wildlife resources. The State Department of Fish and Wildlife also provides comments and recommendations.
The Airport lands can be characterized as a series of generalized vegetative communities, many of which are disturbed from their natural state by Airport or related facilities development, or other human intervention, including agricultural and silvicultural activity for the last several decades. The character of vegetative communities is significant because the varying classes of vegetative cover provide habitat for wildlife, some of which are identified as species of note or of special concern by the relevant ecological legislation. Soil types, comparative elevation, and drainage characteristics in turn help determine the wetland or upland characteristics, and thereby, the type of dominant vegetation and subsequent habitat provided.
A site survey that can be used to assess specific vegetative community types and the possible presence of threatened and endangered species can be completed during the EA and/or Environmental Impact Statement (EIS) process as required for a project.
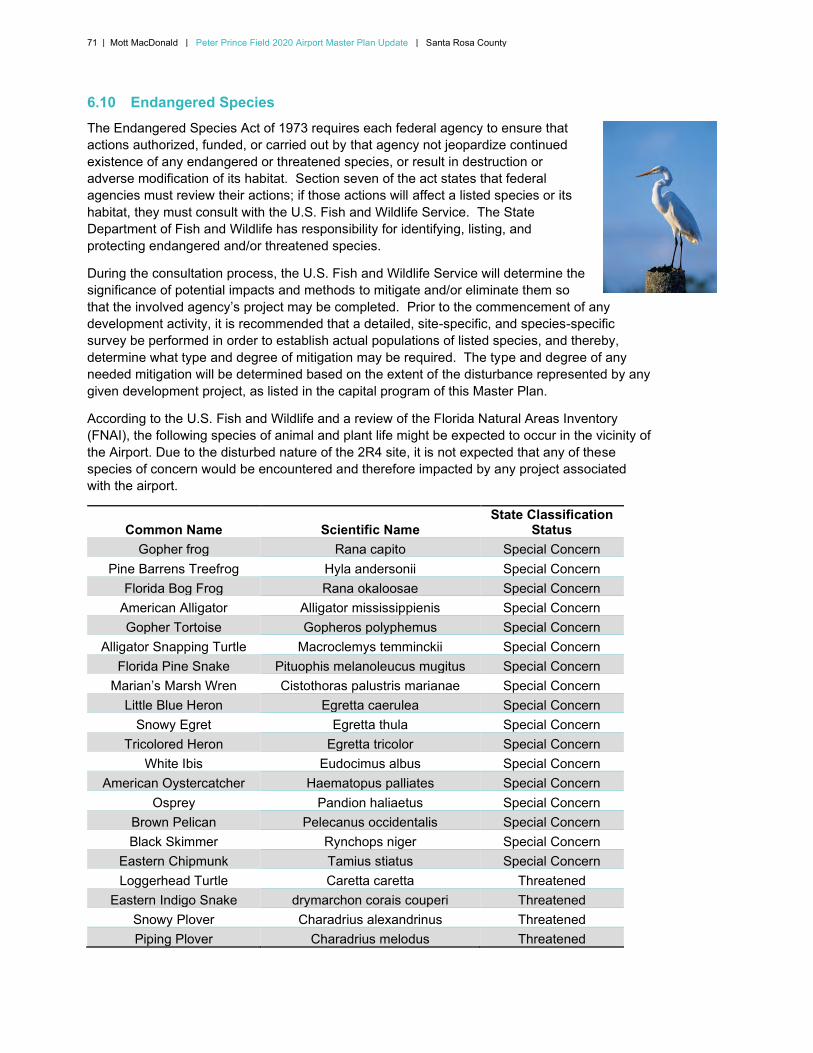
71 | Mott MacDonald | Peter Prince Field 2020 Airport Master Plan Update | Santa Rosa County
6.10 Endangered Species
The Endangered Species Act of 1973 requires each federal agency to ensure that actions authorized, funded, or carried out by that agency not jeopardize continued existence of any endangered or threatened species, or result in destruction or adverse modification of its habitat. Section seven of the act states that federal agencies must review their actions; if those actions will affect a listed species or its habitat, they must consult with the U.S. Fish and Wildlife Service. The State Department of Fish and Wildlife has responsibility for identifying, listing, and protecting endangered and/or threatened species.
During the consultation process, the U.S. Fish and Wildlife Service will determine the significance of potential impacts and methods to mitigate and/or eliminate them so that the involved agency’s project may be completed. Prior to the commencement of any development activity, it is recommended that a detailed, site-specific, and species-specific survey be performed in order to establish actual populations of listed species, and thereby, determine what type and degree of mitigation may be required. The type and degree of any needed mitigation will be determined based on the extent of the disturbance represented by any given development project, as listed in the capital program of this Master Plan.
According to the U.S. Fish and Wildlife and a review of the Florida Natural Areas Inventory (FNAI), the following species of animal and plant life might be expected to occur in the vicinity of the Airport. Due to the disturbed nature of the 2R4 site, it is not expected that any of these species of concern would be encountered and therefore impacted by any project associated with the airport.
State Classification Common Name Scientific Name Status
Gopher frog Rana capito Special Concern
Pine Barrens Treefrog Hyla andersonii Special Concern
Florida Bog Frog Rana okaloosae Special Concern
American Alligator Alligator mississippienis Special Concern
Gopher Tortoise Gopheros polyphemus Special Concern
Alligator Snapping Turtle Macroclemys temminckii Special Concern
Florida Pine Snake Pituophis melanoleucus mugitus Special Concern
Marian’s Marsh Wren Cistothoras palustris marianae Special Concern
Little Blue Heron Egretta caerulea Special Concern
Snowy Egret Egretta thula Special Concern
Tricolored Heron Egretta tricolor Special Concern
White Ibis Eudocimus albus Special Concern
American Oystercatcher Haematopus palliates Special Concern
Osprey Pandion haliaetus Special Concern
Brown Pelican Pelecanus occidentalis Special Concern
Black Skimmer Rynchops niger Special Concern
Eastern Chipmunk Tamius stiatus Special Concern
Loggerhead Turtle Caretta caretta Threatened
Eastern Indigo Snake drymarchon corais couperi Threatened
Snowy Plover Charadrius alexandrinus Threatened
Piping Plover Charadrius melodus Threatened
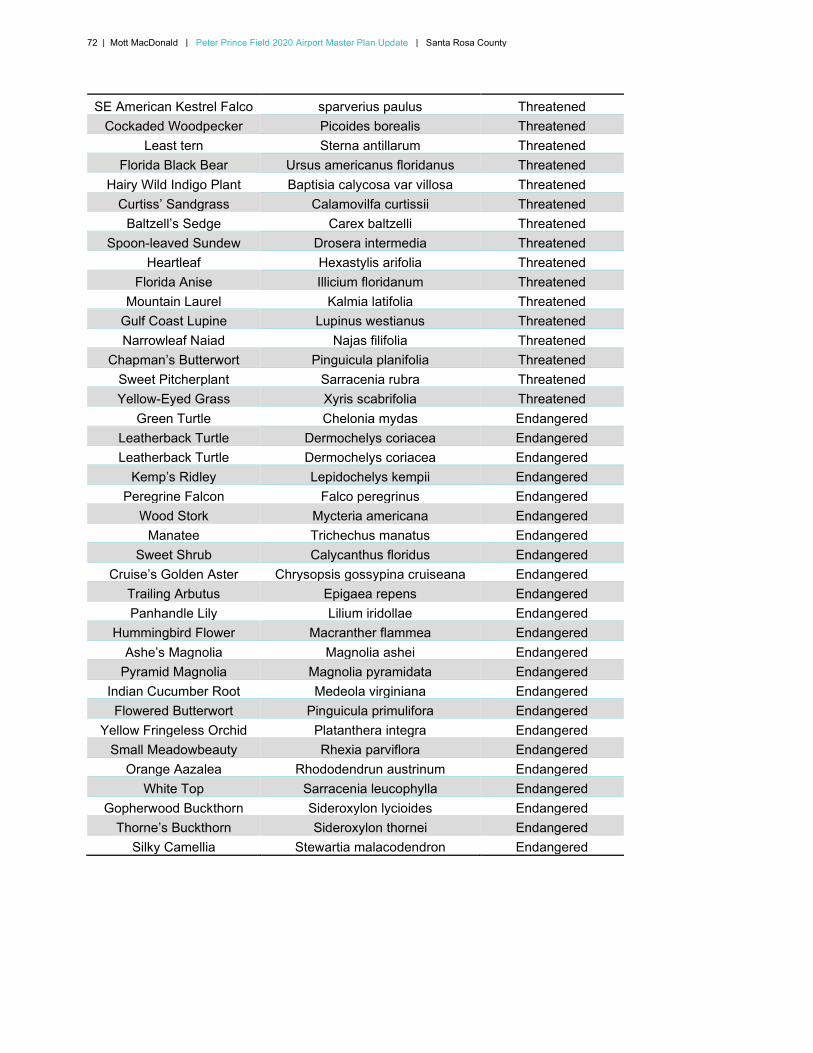
72 | Mott MacDonald | Peter Prince Field 2020 Airport Master Plan Update | Santa Rosa County
SE American Kestrel Falco sparverius paulus Threatened
Cockaded Woodpecker Picoides borealis Threatened
Least tern Sterna antillarum Threatened
Florida Black Bear Ursus americanus floridanus Threatened
Hairy Wild Indigo Plant Baptisia calycosa var villosa Threatened
Curtiss’ Sandgrass Calamovilfa curtissii Threatened
Baltzell’s Sedge Carex baltzelli Threatened
Spoon-leaved Sundew Drosera intermedia Threatened
Heartleaf Hexastylis arifolia Threatened
Florida Anise Illicium floridanum Threatened
Mountain Laurel Kalmia latifolia Threatened
Gulf Coast Lupine Lupinus westianus Threatened
Narrowleaf Naiad Najas filifolia Threatened
Chapman’s Butterwort Pinguicula planifolia Threatened
Sweet Pitcherplant Sarracenia rubra Threatened
Yellow-Eyed Grass Xyris scabrifolia Threatened
Green Turtle Chelonia mydas Endangered
Leatherback Turtle Dermochelys coriacea Endangered
Leatherback Turtle Dermochelys coriacea Endangered
Kemp’s Ridley Lepidochelys kempii Endangered
Peregrine Falcon Falco peregrinus Endangered
Wood Stork Mycteria americana Endangered
Manatee Trichechus manatus Endangered
Sweet Shrub Calycanthus floridus Endangered
Cruise’s Golden Aster Chrysopsis gossypina cruiseana Endangered
Trailing Arbutus Epigaea repens Endangered
Panhandle Lily Lilium iridollae Endangered
Hummingbird Flower Macranther flammea Endangered
Ashe’s Magnolia Magnolia ashei Endangered
Pyramid Magnolia Magnolia pyramidata Endangered
Indian Cucumber Root Medeola virginiana Endangered
Flowered Butterwort Pinguicula primulifora Endangered
Yellow Fringeless Orchid Platanthera integra Endangered
Small Meadowbeauty Rhexia parviflora Endangered
Orange Aazalea Rhododendrun austrinum Endangered
White Top Sarracenia leucophylla Endangered
Gopherwood Buckthorn Sideroxylon lycioides Endangered
Thorne’s Buckthorn Sideroxylon thornei Endangered
Silky Camellia Stewartia malacodendron Endangered
73 | Mott MacDonald | Peter Prince Field 2020 Airport Master Plan Update | Santa Rosa County
6.11 Wetlands
The two important federal laws regulating wetlands are the River and Harbors Act (RHA) of 1899 and the Clean Water Act (CWA). The focus of the RHA is protection of navigation while the focus of the CWA is prevention of water pollution. Additionally, the North American Wetlands Conservation Act of 1989 assigns preservation responsibilities to all federal agencies whose jurisdiction may involve the management or disposal of lands and waters under their control. The U.S. Army Corps of Engineers and Environmental Protection Agency have very broad definitions of navigable waterways and may encompass any wetland contiguous with waters of the U.S.
Other agencies with non-regulatory responsibilities to create or protect wetlands include the U.S. Fish and Wildlife Service the National Marine Fisheries Service and the Soil Conservation Service. The Fish and Wildlife Service functions as a resource agency that produces the National Wetlands Inventory Maps for each state. According to these maps, areas that would be considered wetlands do not exist on Airport property. However, a thorough wetland investigation would take place prior to construction of any project on the 2R4 site.
6.12 Floodplains
Floodplains are defined in Executive Order 11988, Floodplain Management. They include lowland areas adjoining inland and coastal waters, especially those areas subject to a one percent or greater chance of flooding in any given year.
The Federal Emergency Management Agency (FEMA) has produced flood insurance rate maps for communities participating in the National Flood Insurance Program. Detailed maps illustrate the 100- and 500-year base flood elevations. Descriptions of zones delineated on these maps include, Zone A – areas of 100-year flood, Zone B – areas between limits of 100- and 500-year flood, and Zone C – areas of minimal flooding.
The current Flood Insurance Rate Map of Santa Rosa County, Florida (Panel 340 of 657, Community-Panel Number 120274 0340 G, dated 12/19/06) indicates that 2R4 is in Zone X (areas determined to be outside the 0.2% annual chance floodplain) and is not within the 100-year floodplain.
The preliminary maps are expected to be in effect in 2021. A review of the Revised Preliminary Flood Insurance Rate Map of Santa Rosa County, Florida (Panel 340 of 657, Community-Panel Number 120274 0340 H, dated 7/29/19) also indicates that 2R4 is in Zone X and is not within the 100-year floodplain.
6.13 Coastal Zone Management The Coastal Zone Management Act requires that all federal projects occurring in applicable coastal zone areas comply with management guidelines established in the Coastal Zone Management Program. Procedures for determining consistency with approved coastal zone management programs are contained in the NOAA Regulations (15 CFR Part 930).
Santa Rosa County is contiguous with the waters of the Gulf of Mexico. Therefore the county is likely under the jurisdiction of the coastal zone management program and must obtain a consistency determination for any projects that may impact the coastal zone management plan.
74 | Mott MacDonald | Peter Prince Field 2020 Airport Master Plan Update | Santa Rosa County
6.14 Coastal Barriers
The Coastal Barriers Act of 1982 prohibits federal financial assistance for development within the coastal barrier resources system, which consists of undeveloped coastal barriers along the Atlantic and Gulf coasts. Maps that identify lands included in this system are available for inspection in the offices of the U.S. Fish and Wildlife Service.
As mentioned in Section 6.13, Santa Rosa County is contiguous with the waters of the Gulf of Mexico. Therefore, a coastal zone management consistency determination must be obtained for any projects that may impact the coastal barriers or coastal barrier resource system.
6.15 Wild and Scenic Rivers
The National Wild and Scenic Rivers Act of 1968 preserves certain rivers with outstanding natural cultural, or recreational features. Under provisions of this act federal agencies cannot assist by loan grant license, or otherwise in construction of any water resources project that would have direct and adverse impacts on river values. River segments protected under this legislation are administered by the U.S. Park Service.
The Florida Department of Natural Resources is the state agency charged with oversight of the wild and scenic rivers in the state. According to the official Federal National List of Inventory Rivers the only two wild and scenic rivers in the State of Florida are the Loxahatchchee River located in Palm Beach County and the Wekiva River located in Seminole County. Therefore, the regulations mandated by the abovementioned legislation do not apply to Santa Rosa County the 2R4 site.
6.16 Prime Farmland
Prime farmland is defined as land best suited for producing food, feed, forage, fiber, and oilseed crops. This land has the quality, growing season, and moisture supply necessary to produce sustained crop yields with minimal energy and economic input. If farmland is to be converted to a nonagricultural use by a federally funded project, consultation with the U.S. Department of Agriculture Soil Conservation Service is necessary to determine whether the farmland is classified as “prime” or “unique”. If it is, the Farmland Protection Act requires rating the farmland conversion impacts based on length of time farmed, amounts of farmland remaining in the area, level of local farm support services, and the level of urban land in the area.
The land on and in the immediate vicinity of 2R4 has not been designated as “prime farmland” and is not considered “prime farmland” according to the legislation.
6.17 Energy Supply and Natural Resources
Energy supply and natural resources may be affected by increased development at 2R4. Changes could occur in demand for electrical power due to increased electrical requirements from airfield lighting, navigational equipment, and/or tenant facilities and business operations. Proper planning with the appropriate city and county officials will limit and/or eliminate any possible negative impacts associated with increased energy demands.
75 | Mott MacDonald | Peter Prince Field 2020 Airport Master Plan Update | Santa Rosa County
6.18 Light Emissions
Standards do not exist for light emission impacts on residential areas. However, measures can and should be taken to mitigate any impacts on such incompatible areas within the vicinity of the Airport. Buffer zones consisting of vegetation or earthen berms could be constructed if necessary, to shield residential areas. Likewise, non-airport light emissions must be prevented from creating misleading and/or dangerous situations for aircraft operating at or in the immediate vicinity of 2R4. This can be accomplished through the use of zoning and land use planning as well as local ordinances.
6.19 Solid Waste Impact Laws that control solid waste management include the Resource Conservation and Recovery Act, FAA Modernization and Reform Act of 2012 (FMRA) and the Guidance on Airport Recycling, Reuse, and Waste Reductions Plans memorandum published in 2014. The Resource Conservation and Recovery Act provides for safe disposal of discarded materials, regulates hazardous waste, promotes recycling, and establishes criteria for sanitary landfills. The FAA documents listed above necessitate Airport Recycling, Reuse, and Waste Reduction plans for all airports included in the NPIAS.
Though increases in solid waste will likely be seen during periods of construction, no facilities are planned for 2R4 that would significantly and permanently increase the production of solid wastes. Further, it is recommended that an Airport Recycling, Reuse, and Waste Reduction plan be completed for 2R4.
6.20 Construction Impacts
During periods of development, extensive construction activities may occur. Construction activities may include and are not limited to earthmoving activities, delivery of equipment and materials, and removal of debris associated with runways and taxiways. The potential for impacts to off-airport communities in the vicinity of the Airport is greatest during the initial phases of development. These impacts may consist of increased traffic on local roads, noise, mud, dust, and other effects associated with heavy construction vehicle activity. All possible impacts related to development projects are minor and temporary. Nevertheless, the Airport management will exercise best practices to contain and minimize the impact of construction during building phases of projects proposed in the development plan.
6.21 Summary
This chapter serves as a cursory review of the potential for environmental impacts that may be associated with the continuing development of 2R4. Further environmental studies, such as an EA or EIS, could be necessary for some of the proposed developments within this Master Plan and as required by the National Environmental Policy Act (NEPA). Project specific impacts and any necessary mitigation measures will be determined and identified in these environmental documents.
76 | Mott MacDonald | Peter Prince Field 2020 Airport Master Plan Update | Santa Rosa County
7 Airport Layout Plan Set
Airport plans graphically illustrate the development of an airport over a 20-year development program. This section describes the Airport Layout Plan (ALP) for Peter Prince Field (2R4). A complete set of ALP’s is required by the Federal Aviation Administration (FAA) and the Florida Department of Transportation (FDOT) for consideration of future funding, as programming of FAA and FDOT funds are based on development projects depicted on the ALP. However, projects depicted on other plan sheets are also reviewed for programming of funds by the FAA and FDOT. The plans have been developed in accordance with the following:
● FAA Advisory Circular 150/5070-6A: Airport Layout Plans
● FAA Advisory Circular 150/5300-13A: Airport Design
● 3-Dimensional Airspace Analysis Program (3DAAP) ● Airport Layout Plan Checklist- Orlando Airport Districts Office (9/95) ● Florida Department of Transportation Guidebook for Airport Master Planning.
The airport plan set for Peter Prince Field (2R4) presents in graphic format, the proposed development of the Airport to meet forecast aviation demand and the overall goals of 2R4 and Santa Rosa County. The complete set of plans include the following:
● Cover Sheet ● Airport Layout Plan (ALP) ● Existing Facilities Layout Plan
● West Terminal Area Plan
● East Terminal Area Plan
● Inner Portion of the Approach Surface Plan
● FAR Part 77 Airspace Surfaces
● Existing on-Airport Land Use Plan and Noise Contours
● Future Airport Land Use Plan
The ALP drawings are produced on 34-inch by 22-inch sheets, reduced reproductions of the ALP are included in this report for illustration purposes. All ALP drawings were created using AutoCAD 19.
This chapter will present the drawings with a brief discussion of each. The ALP set is provided in conjunction with this report document and has been prepared according to the design requirements set forth in this document, the Federal Aviation Administration (FAA) Advisory Circulars and the Florida Department of Transportation (FDOT) Guidebook for Airport Master Planning.
77 | Mott MacDonald | Peter Prince Field 2020 Airport Master Plan Update | Santa Rosa County
7.1 Cover Sheet The cover sheet (Sheet 1 of 9) serves as an introduction to the ALP set. It provides basic airport data that is not found elsewhere on the ALP. The cover sheet includes project name, a location, and vicinity map. The location map indicates major roads and other features in the vicinity of the airport while the location map shows the location of major cities in Florida.
7.2 Airport Layout Plan
The ALP is the primary planning document for the Airport and is a graphic representation, to scale, of existing and proposed Airport facilities, their location, dimensional and clearance data, and the overall infrastructure of the Airport including runways, taxiways, and aprons. Additionally, FAA and FDOT officials refer to the ALP when considering grant applications for development assistance and off-airport development within the vicinity of the Airport.
The ALP was developed in accordance with the design criteria and guidelines contained in FAA Advisory Circular 150/5300-13A, Airport Design and Florida Department of Transportation
Guidebook for Airport Master Plans. The information and analysis presented in Chapter 4, Design Criteria, discusses in detail the design requirements that pertain to 2R4 and have been incorporated into the ALP. It should be noted that an adaptation to standards has been indicated on this sheet in order to request FAA approval for penetrations to the Federal Aviation Regulation (FAR) Part 77 and encroachment to the building restriction line. Sheet 2 of 9 illustrates the ALP for 2R4.
7.3 Drawing of Existing Facilities
The drawing of existing facilities is a graphic representation, to scale, of the Airport in its current configuration (year 2020). This drawing shows all existing Airport facilities, their location, pertinent dimensions and clearance information and the runway and taxiway infrastructure. The Existing Airport Facilities Drawing is shown on Sheet 3 of 9.
7.4 West FBO Terminal Area Plan
The Terminal Area Plans presents an enlarged area of the ALP at a scale of 1” = 40’. The plans denote the short and long-range developments and improvements affecting the FBO terminal and the adjacent apron, taxiway, and hangar areas. The West terminal, Sheet 5 of 9, includes the proposed reconfiguration of Taxiway A to the east of the terminal which shall create additional apron utilization for parking transient and based aircraft parking near the proposed terminal facility. The taxiway object-free areas (TOFAs) and the building restriction line (BRL) are also indicated on this sheet.
This plan sheet shows proposed general aviation area in development in greater detail. Major projects on this sheet include taxiway development to the new general aviation runway, additional T-Hangars, additional aircraft parking areas, and automobile parking areas.
7.5 East FBO Terminal Area Plan
The Terminal Area Plans presents an enlarged area of the ALP at a scale of 1” = 40’. The plans denote the short- and long-range developments and improvements affecting the FBO terminal and the adjacent apron, taxiway, and hangar areas. The new East terminal building northwest of the existing terminal facility has been incorporated into Sheet 4 of 9 along with proposed parking, ground access improvements to the new facility, future T-hangars, and office buildings.
78 | Mott MacDonald | Peter Prince Field 2020 Airport Master Plan Update | Santa Rosa County
7.6 RPZ and Approach Profile Drawing
The RPZ and Approach Profile drawing shows both plan and profile views for each runway’s RPZ and approaches as shown on the ALP. The purpose of these plans is to locate and document existing objects, which represent obstructions to navigable airspace and the existing and proposed approach slopes for each runway. Additionally, the drawing shows the ground profile and terrain features along the extended centerline at each runway end. The Inner Portion of the Approach Surface Drawing is shown on Sheet 6 of 9.
7.7 FAR Part 77 Airspace Surfaces
FAR Part 77, “Objects Affecting Navigable Airspace,” prescribes airspace standards, which establish criteria for evaluating navigable airspace. Airport imaginary surfaces are established relative to the airport and runways. The size of each imaginary surface is based on the runway category with respect to the existing and proposed visual, non-precision, or precision approaches for that runway. The slope and dimensions of the respective approach surfaces are determined by the most demanding, existing or proposed, approach for each runway. The imaginary surfaces definitions include:
● Primary Surface – A rectangular area symmetrically located about the runway centerline and extending a distance of 200 feet beyond each runway threshold. Its elevation is the same as that of the runway.
● Horizontal Surface – An oval shaped, flat area situated 150 feet above the published airport elevation. Its dimensions are determined by using 10,000-foot arcs (centered 200 feet beyond each runway end) connected with a line tangent to those arcs. The horizontal surface elevation for 2R4 is 239 feet above mean sea level (AMSL).
● Conical Surface – A sloping area whose inner perimeter conforms to the shape of the horizontal surface. It extends outward for a distance of 4,000 feet measured horizontally, and slopes upward at 20:1. 2R4’s conical surface extends upward to an elevation of 539 feet AMSL.
● Transitional Surface – There are three different transitional surfaces. The first is off the sides of the primary surface, the second is off the sides of the approach surface, and the last is outside the conical surface and pertains to precision runways only. All transitional surfaces have slopes of 7:1 that are measured perpendicular to the runway centerline.
● Approach Surface – This surface begins at the ends of the primary surface and slopes upward at a predetermined ratio while at the same time flaring out horizontally. The width and elevation of the inner ends conform to that of the primary surface, while the slope, length, and outer width are determined by the runway service category and existing or proposed instrument approach procedures.
Existing objects, which penetrate the above Part 77 surfaces, are tabulated on the Airport Airspace Drawing. The obstruction table presented on the airspace drawing contains data on the object elevation, elevation of the imaginary surface, and any action to be taken to mitigate the penetration. Sheet 7 of 9 shows the Part 77 Airspace Surfaces for 2R4.
79 | Mott MacDonald | Peter Prince Field 2020 Airport Master Plan Update | Santa Rosa County
7.8 Existing On-airport Land Use Plan and Noise Contours
The land use drawings, Existing Land Use Plan with Noise Contours (Sheet 8 of 9) and Proposed Land Use Plan with Noise Contours (Sheet 9 of 9), depict the existing and future land use of all land in and within the vicinity of the Airport. The utilization of this land is represented by several use categories, which are labeled in the legend of each drawing. Additionally, the existing noise contours from Chapter 6, Environmental Overview, have been superimposed on the appropriate drawing. This will give local authorities guidance and help to ensure appropriate aviation-compatible zoning is maintained in the future.
The On-Airport Land Use Plan depicts proposed development areas on the airport property. This plan was developed to achieve optimum utilization of the land within existing airport boundaries. Planning for land use on the airport is based on two basic objectives: 1) maximization of airport property for air transportation and 2) compatibility between the airport and its environs.
7.9 Future Off-Airport Land Use Plan and Noise Contours
This plan depicts the future surrounding land uses in the vicinity of the airport. The land use classification shown on the plan were developed from digital data provided by the county of Santa Rosa’s Planning and Zoning Department. As shown, the airport consists primarily of residential development. Some commercial, industrial and retail development is also located in the vicinity of the airport.
The FAA has established guidelines for land use compatibility related to airport-generated noise impacts. In most cases, noise- sensitive off-airport land uses are considered incompatible with noise impacts of 65 DNL and higher. However, the responsibility for determining the acceptable and permissible land uses remains with the local government authorities.
7.10 Summary
Airport plans were presented to the Aviation Advisory Committee for discussion and review. The drawings that follow represent the direction established by the committee’s staff and Santa Rosa County.

80 | Mott MacDonald | Peter Prince Field 2020 Airport Master Plan Update | Santa Rosa County
Appendix A – Aviation Activity Forecast
May 2020
Peter Prince Field
Aviation Activity Forecast
Prepared for :
Santa Rosa County
Prepared by: In associat ion with :
RICONDO Mott MacDonald
Ricondo & Associates, Inc. (Ricondo) prepared this document for the stated purposes as expressly set forth herein and for the sole use of Santa Rosa County and its intended recipients. The techniques and methodologies used in preparing this document are consistent with industry practices at the time of preparation and this Report should be read in its entirety for an understanding of the analysis, assumptions, and opinions presented. Ricondo & Associates, Inc. is not registered as a municipal advisor under Section 15B of the Securities Exchange Act of 1934 and does not provide financial advisory services within the meaning of such act.
PETER PRINCE FIELD MAY 2020
TABLE OF CONTENTS 1. Introduction............................................................................................................................. 1-2
1.1 Airport Setting ..................................................................................................................................................................1-2
1.1.1 Location ..............................................................................................................................................................1-2
1.1.2 Local Economy .................................................................................................................................................1-3
1.1.3 Airport Overview .............................................................................................................................................1-5
1.1.4 Historical Based Aircraft and Annual Operations ...............................................................................1-5
1.1.5 Federal Aviation Administration Classification....................................................................................1-7
1.1.6 Neighboring Airports ....................................................................................................................................1-8
1.1.7 Airspace............................................................................................................................................................ 1-12
1.2 Previous Aviation Activity Forecasts ...................................................................................................................... 1-18
1.2.1 2012 Master Plan Update ......................................................................................................................... 1-18
1.2.2 Federal Aviation Administration’s Terminal Area Forecast .......................................................... 1-20
1.2.3 Florida Aviation System Plan ................................................................................................................... 1-21
1.3 Forecast Aviation Activity .......................................................................................................................................... 1-21
1.3.1 Forecasting Approach ................................................................................................................................ 1-21
1.3.2 Global and National Market Trends ..................................................................................................... 1-22
1.3.3 Projections of Based Aircraft ................................................................................................................... 1-27
1.3.4 Projected Based Aircraft Fleet Mix ........................................................................................................ 1-29
1.3.5 Forecast Aircraft Operations .................................................................................................................... 1-31
1.3.6 Types of Aircraft Operations.................................................................................................................... 1-34
1.3.7 Summary of Activity Forecasts ................................................................................................................ 1-41
LIST OF TABLES
Table E-1 Summary of Based Aircraft Projections and Aircraft Operation Forecasts ...........................................1-1
Table 1-1 Major Employers in Santa Rosa County, Florida .............................................................................................1-3
Table 1-2 Historical Based Aircraft and Aircraft Operations at Peter Prince Field .................................................1-6
Table 1-3 Neighboring Airport Comparison...................................................................................................................... 1-10
Table 1-4 Special Use Airspace in the Airport Vicinity ................................................................................................... 1-17
Table 1-5 2012 Master Plan Based Aircraft Projections and Aircraft Operation Forecasts .............................. 1-18
Table 1-6 Fiscal Year 2019 (Released January 2020) Federal Aviation Administration Terminal Area Forecast ........................................................................................................................................................................ 1-20
Master Plan Update | i | Aviation Activity Forecast

PETER PRINCE FIELD MAY 2020
Table 1-7 2035 Florida Aviation System Plan Based Aircraft Projections and Aircraft Operation Forecasts ...................................................................................................................................................................... 1-21
Table 1-8 Active Airmen within Florida 2009-2019......................................................................................................... 1-24
Table 1-9 Federal Aviation Administration Projected National Active Aircraft Fleet ......................................... 1-25
Table 1-10 Projections of Based Aircraft................................................................................................................................ 1-27
Table 1-11 Selected Projection of Based Aircraft ............................................................................................................... 1-29
Table 1-12 Projected Based Aircraft Fleet Mix ..................................................................................................................... 1-31
Table 1-13 Forecast Aircraft Operations ................................................................................................................................ 1-32
Table 1-14 Selected Forecast of Aircraft Operations ........................................................................................................ 1-34
Table 1-15 Local vs. Itinerant Operations at Airports within 30 Nautical Miles ..................................................... 1-35
Table 1-16 Forecast of Local vs. Itinerant Operations at Peter Prince Field ............................................................. 1-36
Table 1-17 Projected Operational Fleet Mix......................................................................................................................... 1-37
Table 1-18 Federal Aviation Administration Aircraft Approach Categories and Design Standards ............... 1-38
Table 1-19 Based Aircraft Airport Reference Code Composition ................................................................................. 1-38
Table 1-20 Forecast of Aircraft Operations per Airport Reference Code.................................................................. 1-39
Table 1-21 Forecast Annual Instrument Operations ......................................................................................................... 1-40
Table 1-22 Forecast Peak Activity ............................................................................................................................................. 1-41
Table 1-23 Summary of Activity Projections and Forecasts ........................................................................................... 1-42
Table 1-24 Comparison Between Aviation Activity Forecasts for 2R4 and the FAA TAF .................................... 1-43
LIST OF EXHIBITS
Exhibit 1-1 Peter Prince Field Service Area...............................................................................................................................1-4
Exhibit 1-2 Historical Aircraft Activity at Peter Prince Field ...............................................................................................1-7
Exhibit 1-3 Public and Military Airports within 30 Nautical Miles of Peter Prince Field.........................................1-9
Exhibit 1-4 Airspace Classifications .......................................................................................................................................... 1-14
Exhibit 1-5 Airspace in the Airport Vicinity ........................................................................................................................... 1-16
Exhibit 1-6 Special Use Airspace Areas in the Airport Vicinity ...................................................................................... 1-19
Exhibit 1-7 General Aviation Aircraft Shipments (2009–2019) ...................................................................................... 1-23
Exhibit 1-8 Share of General Aviation Aircraft Shipments............................................................................................... 1-23
Exhibit 1-9 Active General Aviation Aircraft Projections (CY 2010-2040) ................................................................. 1-26
Exhibit 1-10 Historical and Projected Based Aircraft ........................................................................................................... 1-28
Exhibit 1-11 Fiscal Year 2019 Based Aircraft Fleet Mix ........................................................................................................ 1-29
Exhibit 1-12 Aircraft Fleet Mix Comparison ............................................................................................................................. 1-30
Master Plan Update | ii | Aviation Activity Forecast

PETER PRINCE FIELD MAY 2020
Exhibit 1-13 Historical and Forecast Aircraft Operations ................................................................................................... 1-33
Exhibit 1-14 Historical Local vs. Itinerant Aircraft Operations at Peter Prince Field ................................................ 1-35
Exhibit 1-15 Itinerant vs. Local Aircraft Operations at Selected Florida Airports (FY 2019) ................................. 1-36
Master Plan Update | iii | Aviation Activity Forecast
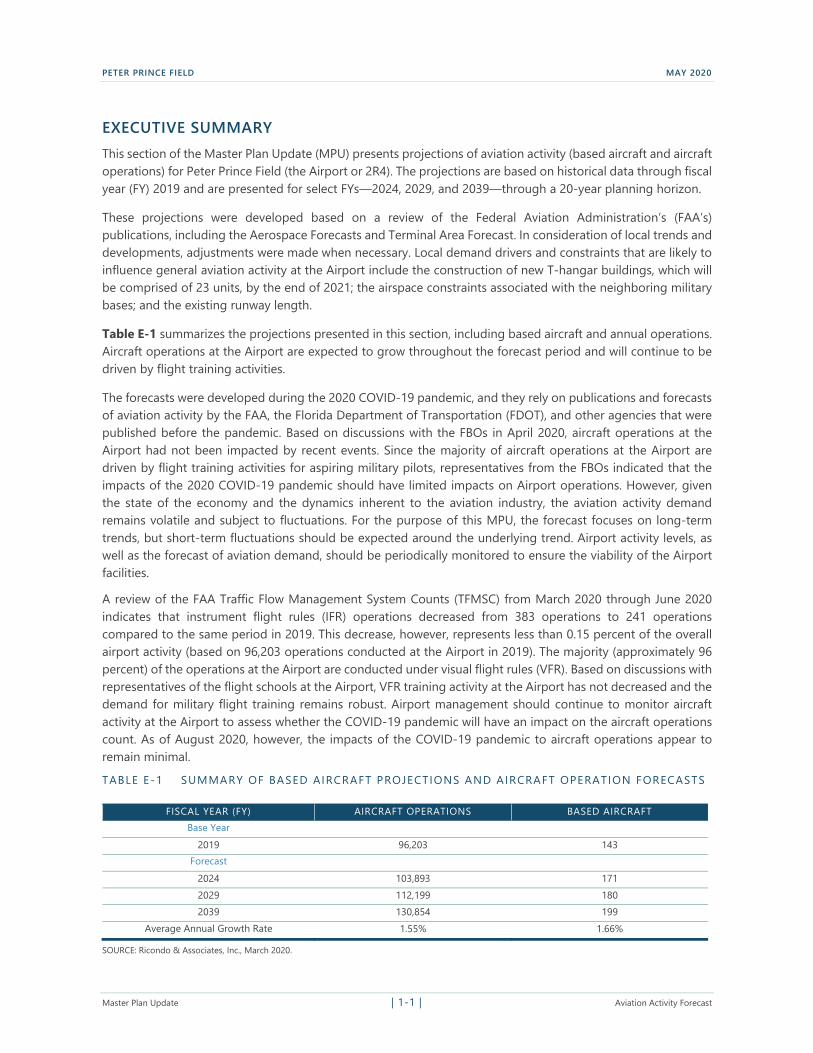
PETER PRINCE FIELD MAY 2020
EXECUTIVE SUMMARY This section of the Master Plan Update (MPU) presents projections of aviation activity (based aircraft and aircraft operations) for Peter Prince Field (the Airport or 2R4). The projections are based on historical data through fiscal year (FY) 2019 and are presented for select FYs—2024, 2029, and 2039—through a 20-year planning horizon.
These projections were developed based on a review of the Federal Aviation Administration’s (FAA’s) publications, including the Aerospace Forecasts and Terminal Area Forecast. In consideration of local trends and developments, adjustments were made when necessary. Local demand drivers and constraints that are likely to influence general aviation activity at the Airport include the construction of new T-hangar buildings, which will be comprised of 23 units, by the end of 2021; the airspace constraints associated with the neighboring military bases; and the existing runway length.
Table E-1 summarizes the projections presented in this section, including based aircraft and annual operations. Aircraft operations at the Airport are expected to grow throughout the forecast period and will continue to be driven by flight training activities.
The forecasts were developed during the 2020 COVID-19 pandemic, and they rely on publications and forecasts of aviation activity by the FAA, the Florida Department of Transportation (FDOT), and other agencies that were published before the pandemic. Based on discussions with the FBOs in April 2020, aircraft operations at the Airport had not been impacted by recent events. Since the majority of aircraft operations at the Airport are driven by flight training activities for aspiring military pilots, representatives from the FBOs indicated that the impacts of the 2020 COVID-19 pandemic should have limited impacts on Airport operations. However, given the state of the economy and the dynamics inherent to the aviation industry, the aviation activity demand remains volatile and subject to fluctuations. For the purpose of this MPU, the forecast focuses on long-term trends, but short-term fluctuations should be expected around the underlying trend. Airport activity levels, as well as the forecast of aviation demand, should be periodically monitored to ensure the viability of the Airport facilities. A review of the FAA Traffic Flow Management System Counts (TFMSC) from March 2020 through June 2020 indicates that instrument flight rules (IFR) operations decreased from 383 operations to 241 operations compared to the same period in 2019. This decrease, however, represents less than 0.15 percent of the overall airport activity (based on 96,203 operations conducted at the Airport in 2019). The majority (approximately 96 percent) of the operations at the Airport are conducted under visual flight rules (VFR). Based on discussions with representatives of the flight schools at the Airport, VFR training activity at the Airport has not decreased and the demand for military flight training remains robust. Airport management should continue to monitor aircraft activity at the Airport to assess whether the COVID-19 pandemic will have an impact on the aircraft operations count. As of August 2020, however, the impacts of the COVID-19 pandemic to aircraft operations appear to remain minimal. TABLE E-1 SUMMARY OF BASED AIRCRAFT PROJECTIONS AND AIRCRAFT OPERATION FORECASTS
FISCAL YEAR (FY) AIRCRAFT OPERATIONS BASED AIRCRAFT
Base Year 2019 96,203 143
Forecast 2024 103,893 171 2029 112,199 180 2039 130,854 199
Average Annual Growth Rate 1.55% 1.66% SOURCE: Ricondo & Associates, Inc., March 2020.
Master Plan Update | 1-1 | Aviation Activity Forecast
PETER PRINCE FIELD MAY 2020
1. INTRODUCTION
This section of the Master Plan Update (MPU) presents forecasts of aviation activity that will be used as the basis for facility planning for Peter Prince Field (the Airport or 2R4). The objective of forecasting is to provide an informed estimate of future levels of airport activity from which the demand for facilities can be derived. A credible and usable forecast is critical to ensuring the types and sizes of planned facilities are appropriate for future conditions. Forecasts presented in this section were based on historical data through fiscal year (FY) 2019
and are presented for select FY—2024, 2029, and 2039—through a 20-year planning horizon.
The Airport’s setting, including the operational activity and physical characteristics of surrounding airports, is
examined, as well as the recent and ongoing development at the Airport. A key focus of this section is how recent and ongoing general aviation (GA) industry trends and trend in historical aviation activity at the Airport affect aviation demand at the Airport. Historical information related to the evolution of traffic at the Airport is
discussed to provide the basis for these updated aviation demand forecasts.
GA activity, which includes all segments of the aviation industry except commercial airline and military operations, is predominant at the Airport. Attention is given to the factors that affect GA activity, including the
national and local economies. According to the Federal Aviation Administration’s (FAA’s) Aerospace Forecast Fiscal Years 2020-2040, the FAA projects a long-term decline in active GA fixed-wing piston aircraft, and hours flown by active GA fixed-wing aircraft.1 Nationwide, however, student pilot certificates have steadily increased between 2009 and 2019.
Despite the historic declining hours flown by active GA fixed-wing aircraft nationwide, operations at the Airport have continued to increase. The opening of a fixed-base operator (FBO), Peter Prince Aviation Center, in 2014 on the east side of the Airport contributed to an increase in aviation activity, including based aircraft and operations by student pilots trained by Peter Prince Aviation Center’s partnered-company, Trident Aircraft.
The following indicators of GA activity are forecast within this section of the MPU to aid in determining the types
and sizes of facilities that should be planned to accommodate demand at the Airport:
number of based aircraft
based aircraft fleet mix
annual aircraft operations
annual aircraft operations by Airport Reference Code
peak activity including peak month and peak day
1.1 AIRPORT SETTING
1.1.1 LOCATION 2R4 is a public airport owned and operated by Santa Rosa County, Florida. The Airport is located in Santa Rosa
County, approximately 3 miles east of the city of Milton and 20 miles northeast of Pensacola, Florida.
The Airport serves the greater Pensacola Bay area, the largest metropolitan area in the Florida panhandle. As
indicated on Exhibit 1-1, the geographical area estimated to be within a 30-minute drive time from the Airport encompasses the cities of Allentown, Bagdad, Ferry Pass, Harrold, Holley, Holt, Milton, Pace, and Riverview. Because of its central location in Santa Rosa County and its proximity to Interstate Highway 10 (I-10), the Airport
1 US Department of Transportation, Federal Aviation Administration, FAA Aerospace Forecast Fiscal Years 2020-2040, https://www.faa.gov/data_research/aviation/aerospace_forecasts/media/FY2020-40_FAA_Aerospace_Forecast.pdf (accessed March
2020).
Master Plan Update | 1-2 | Aviation Activity Forecast
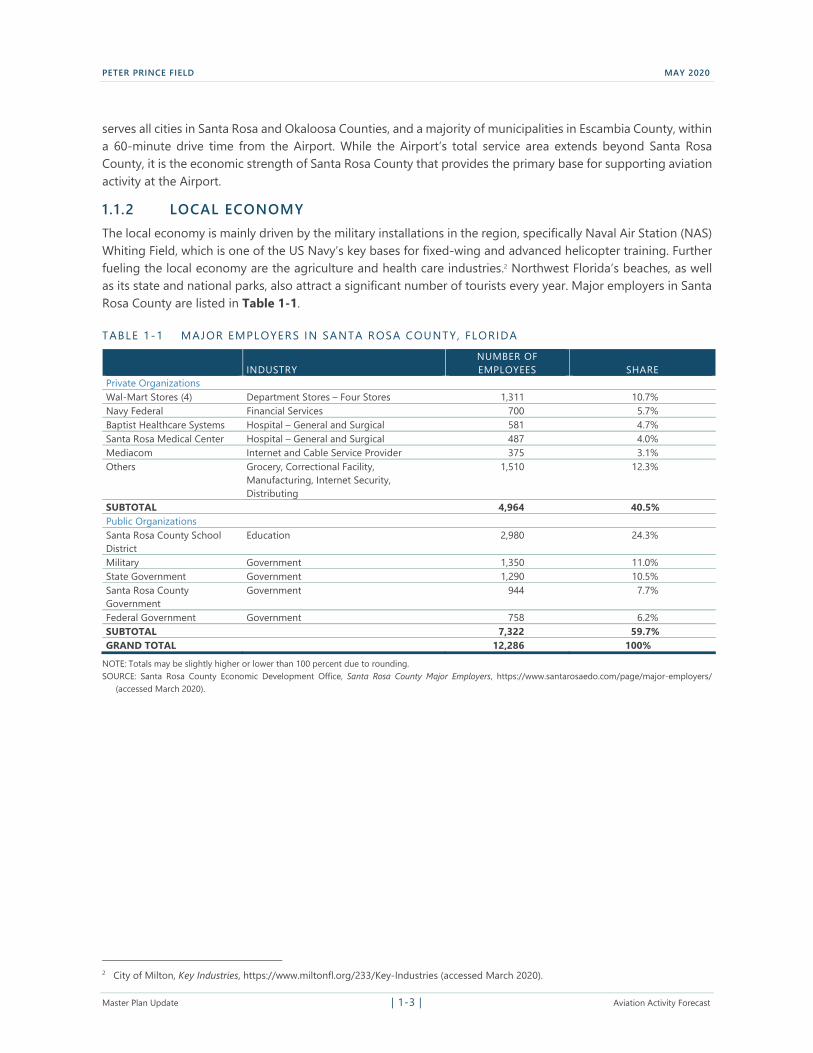
PETER PRINCE FIELD MAY 2020
serves all cities in Santa Rosa and Okaloosa Counties, and a majority of municipalities in Escambia County, within a 60-minute drive time from the Airport. While the Airport’s total service area extends beyond Santa Rosa County, it is the economic strength of Santa Rosa County that provides the primary base for supporting aviation
activity at the Airport.
1.1.2 LOCAL ECONOMY The local economy is mainly driven by the military installations in the region, specifically Naval Air Station (NAS) Whiting Field, which is one of the US Navy’s key bases for fixed-wing and advanced helicopter training. Further fueling the local economy are the agriculture and health care industries.2 Northwest Florida’s beaches, as well as its state and national parks, also attract a significant number of tourists every year. Major employers in Santa
Rosa County are listed in Table 1-1.
TABLE 1-1 MAJOR EMPLOYERS IN SANTA ROSA COUNTY, FLORIDA
INDUSTRY NUMBER OF EMPLOYEES SHARE
Private Organizations
Wal-Mart Stores (4) Department Stores – Four Stores 1,311 10.7% Navy Federal Financial Services 700 5.7%
Baptist Healthcare Systems Hospital – General and Surgical 581 4.7%
Santa Rosa Medical Center Hospital – General and Surgical 487 4.0% Mediacom Internet and Cable Service Provider 375 3.1%
Others Grocery, Correctional Facility, 1,510 12.3% Manufacturing, Internet Security, Distributing
SUBTOTAL 4,964 40.5% Public Organizations
Santa Rosa County School Education 2,980 24.3% District Military Government 1,350 11.0% State Government Government 1,290 10.5%
Santa Rosa County Government 944 7.7% Government Federal Government Government 758 6.2%
SUBTOTAL 7,322 59.7% GRAND TOTAL 12,286 100%
NOTE: Totals may be slightly higher or lower than 100 percent due to rounding. SOURCE: Santa Rosa County Economic Development Office, Santa Rosa County Major Employers, https://www.santarosaedo.com/page/major-employers/
(accessed March 2020).
City of Milton, Key Industries, https://www.miltonfl.org/233/Key-Industries (accessed March 2020).
Master Plan Update | 1-3 | Aviation Activity Forecast
2
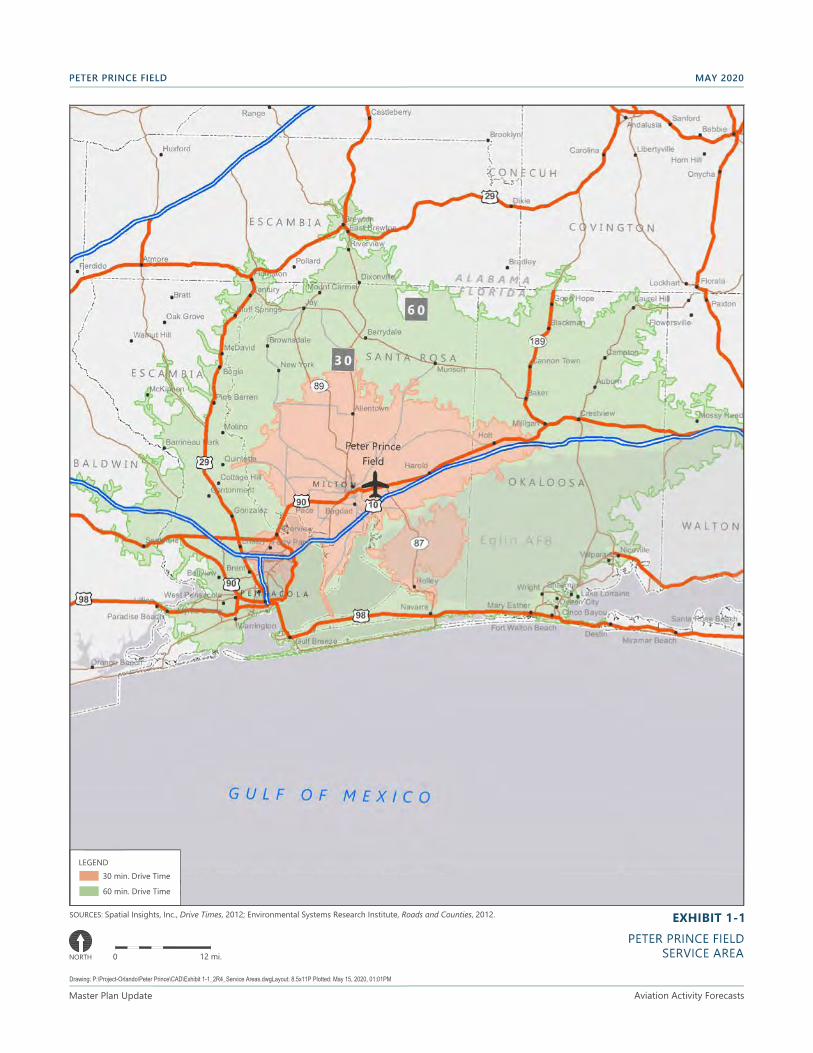
EXHIBIT 1-1PETER PRINCE FIELD
SERVICE AREA
PETER PRINCE FIELD MAY 2020
PRELIMINARY DRAFT
LEGEND
60 min. Drive Time
30 min. Drive Time
SOURCES: Spatial Insights, Inc., Drive Times, 2012; Environmental Systems Research Institute, Roads and Counties, 2012.
NORTH 0 12 mi.
Drawing: P:\Project-Orlando\Peter Prince\CAD\Exhibit 1-1_2R4_Service Areas.dwgLayout: 8.5x11P Plotted: May 15, 2020, 01:01PM
Master Plan Update Aviation Activity Forecasts
PETER PRINCE FIELD MAY 2020
1.1 .3 AIRPORT OVERVIEW
2R4 consists of approximately 565 acres3 of land and is accessible via Highway 90 (SR 10), which runs in an east– west direction along the southern boundary of the Airport property. The Airport has one runway, Runway 18-36, which is 3,701 feet long and 75 feet wide. The runway is equipped with medium intensity runway lights and precision approach path indicators and is served by two full-length parallel taxiways (Taxiways A and B).
The Airport serves the GA community, including business and corporate activity, with two FBOs: Aircraft Management Services (AMS) and Peter Prince Aviation Center.
AMS serves as an FBO and an FAA-approved Part 1414, 5 flight school offering flight training from the private pilot level through the multi-engine certified flight instructor level. AMS provides aircraft fueling and aircraft parking. The AMS facility includes a passenger/pilot lounge, a flight planning room, and restrooms. AMS is approved to receive Government Issue (GI) Bill benefits6 and provides Introductory Flight Screening (IFS) for the US Navy and the US Marine Corps. The IFS program, which provides between 13.5 to 15.0 hours of flight training, provides a means to screen aspiring military pilots by identifying those students who lack “the determination, motivation, or aeronautical adaptability required to succeed in primary flight training.”7 AMS also offers a rotor to fixed-wing transition program that transitions military helicopter pilots to fixed-wing aircraft. AMS operates
a fleet of single- and multi-engine aircraft available for rent, including Cessna 172, Piper Arrow PA28R-200, Piper Apache PA23R-235, and Piper Aztec PA23-250 type aircraft.8
The second FBO at the Airport, Peter Prince Aviation Center, formerly Milton Aviation Partners, started operating at the Airport in 2014. Peter Prince Aviation Center consists of several facilities, including two 5,000-square-foot hangars dedicated to maintenance, one 1,600-square-foot FBO facility, and one 2,688-square-foot training facility dedicated to Trident Aircraft (Trident), a Part 141 and Part 61 flight school partnered with Peter Prince
Aviation Center. A fuel farm and two helicopter parking pads also comprise Peter Prince Aviation Center facilities.
Flight training courses provided by Trident range from private pilot to multi-engine certified flight instructor. The flight school utilizes single- and multi-engine aircraft, including the Piper Warrior and Beechcraft Duchess.9
Similar to AMS, Trident is approved to receive GI Bill benefits and provides IFS for the US Navy and the US Marine Corps. Trident operates a rotary transition program that transitions military helicopter pilots to fixed-wing aircraft.10
1.1.4 HISTORICAL BASED AIRCRAFT AND ANNUAL OPERATIONS The majority of the aircraft operations at the Airport are associated with training activity and flight instruction, including touch-and-go operations and operations within a 20-nautical-mile radius of the Airport. The types of aircraft based at the Airport mainly consist of single- and twin-engine piston aircraft. Table 1-2 and Exhibit 1-
3 Mott MacDonald, Peter Prince Field Airport Layout Plan, https://www.santarosa.fl.gov/DocumentCenter/View/371/2017-Airport-Layout-Plan-PDF, (accessed March 2020).
4 Criteria for flight schools, including training courses, personnel, aircraft, and facilities, are defined under Title 14, Aeronautics
and Space, Chapter 1, “Federal Aviation Administration, Department of Transportation,” Part 141, Pilot Schools, commonly referred to as
Part 141. 5 AMS Flight School, http://amsflightschool.com/ (accessed March 2020). 6 AMS Flight School, http://amsflightschool.com/flight-school/professional-pilot/ (accessed March 2020). 7 US Department of the Navy, CNATRA INSTRUCTION 3501.1C, https://www.cnatra.navy.mil/pubs/folder2/3501.1C.pdf (accessed March
2020). 8 AMS Flight School, https://amsflightschool.com/fbo/aircraft-rental/ (accessed March 2020). 9 Trident Flight Training, https://www.tridentflighttraining.com/ (accessed March 2020). 10 Trident Flight Training, https://www.tridentflighttraining.com/ (accessed March 2020).
Master Plan Update | 1-5 | Aviation Activity Forecast
PETER PRINCE FIELD MAY 2020
2 present the historical numbers of based aircraft and annual aircraft operations recorded for the Airport from 2009 through 2019.
TABLE 1-2 HISTORICAL BASED AIRCRAFT AND AIRCRAFT OPERATIONS AT PETER PRINCE F IELD
BASED AIRCRAFT
YEAR 1 FAA TAF SANTA ROSA COUNTY
RECORDS FORM 5010
AIRCRAFT OPERATIONS
FAA TAF
2009 66 N/A N/A 93,950
2010 85 N/A N/A 93,950
2011 92 113 N/A 93,950
2012 92 N/A N/A 93,950
2013 101 N/A N/A 93,950
2014 96 N/A N/A 93,950
2015 91 N/A N/A 93,950
2016 89 N/A N/A 93,950
2017 72 N/A N/A 93,950
2018 53 122 N/A 93,950
2019 54 143 127 96,203
Average Annual Growth Rate -1.99% 2.99%2 N/A 0.24%
NOTES: FAA – Federal Aviation Administration; TAF – Terminal Area Forecast; FY – Fiscal Year; N/A – Not Available
1 Fiscal year data, except as noted. 2 Average annual growth rate is for the period extending from 2011 to 2019.
SOURCES: US Department of Transportation, Federal Aviation Administration, Terminal Area Forecast, January 2020; US Department of Transportation, Federal Aviation Administration, Form 5010, https://www.airportiq5010.com/5010web/dashboard/general, (accessed March 2020); Santa Rosa County, 2011; Santa Rosa County, 2020.
Master Plan Update | 1-6 | Aviation Activity Forecast
PETER PRINCE FIELD MAY 2020
EXHIBIT 1-2 HISTORICAL AIRCRAFT ACTIVITY AT PETER PRINCE FIELD
160 120,000
0
20,000
40,000
60,000
80,000
100,000
0
20
40
60
80
100
120
140
Airc
raft
Ope
ratio
ns
Base
d Ai
rcra
ft
2009 2010 2011 2012 2013 2014 2015 2016 2017 2018 2019
Years (Fiscal)
Aircraft Operations Based Aircraft (per Santa Rosa County records)
NOTE: 1 Based aircraft data from airport records have been interpolated to fill in missing values between 2009 and 2011 and 2011 and 2018. SOURCES: US Department of Transportation, Federal Aviation Administration, Terminal Area Forecast, January 2020; Santa Rosa County, 2003; Santa Rosa
County, 2011; Santa Rosa County, 2020.
The Terminal Area Forecast (TAF) provides historical data and official FAA forecasts of aviation activity for individual US airports included in the National Plan of Integrated Airport Systems (NPIAS). Historical and forecast aviation activity includes enplaned passengers (not applicable to 2R4), operations categorized as local or itinerant, and based aircraft. Historical information reported by the TAF for nontowered airports is sourced from
Form 5010 (Master Record) that is populated with operation estimates by FAA inspectors, sponsors, and state aviation activity surveys. Based aircraft reported on Form 5010 are derived from BasedAircraft.com, the FAA’s National Based Aircraft Inventory Program online database.
According to the TAF, over the past 10 fiscal years (FYs), the number of based aircraft at the Airport has
fluctuated, but overall it has decreased an average of 1.99 percent per year between 2009 and 2019. Annual aircraft operations remained constant through 2018 but increased by 2,253 operations in 2019, resulting in a
growth rate of 0.24 percent.
As noted in Table 1-2, the FAA TAF indicates that 54 aircraft were based at the Airport in 2019. Representatives of Santa Rosa County, however, provided a detailed spreadsheet including aircraft types and tail numbers that indicated 143 aircraft were based at the Airport. While Santa Rosa County records are not available for the entire 10-year period, available information for 2011, 2018, and 2019 indicates that the number of aircraft at the Airport is much higher than what is reported in the TAF. Based on the Santa Rosa County data, the number of based
aircraft at the Airport increased from 113 to 143 between 2011 and 2019, a compounded annual growth rate of 2.99 percent.
The lack of growth in aircraft operations reflected in the TAF over the last 10 years and the discrepancies in the
number of based aircraft likely indicate the FAA records were never updated to reflect current conditions.
1.1.5 FEDERAL AVIATION ADMINISTRATION CLASSIFICATION
Within the NPIAS, published every two years by the US Department of Transportation (DOT), 2R4 is categorized
as nonprimary, an airport primarily used by GA aircraft. Nonprimary airports are assigned one of five role
Master Plan Update | 1-7 | Aviation Activity Forecast
PETER PRINCE FIELD MAY 2020
classifications: national, regional, local, basic, or unclassified. The Airport is classified as local, an airport that supplements local communities by providing access to markets within a state or immediate region.11
1.1.6 NEIGHBORING AIRPORTS This section describes the public-use airports located within 30 nautical miles of the Airport. It forms the basis for an assessment of existing and competing GA facilities in the region.
As shown on Exhibit 1-3, seven12 public-use airports are located within 30 nautical miles of the Airport. Two of these airports offer commercial airline service: Pensacola International Airport (PNS) and Destin–Fort Walton Beach Airport (VPS). The remaining airports are dedicated to GA: Brewton Municipal Airport (12J), Bob Sikes Airport (CEW), Destin Executive Airport (DTS), Ferguson Airport (82J), and Fort Walton Beach Airport (1J9). Table 1-3 compares the facilities and basic services offered at these public airports.
11 US Department of Transportation, Federal Aviation Administration, Appendix C: Statutory and Policy Airport Categories Used in the NPIAS Report, https://www.faa.gov/airports/planning_capacity/npias/reports/media/NPIAS-Report-2019-2023-Appendix-C.pdf (accessed
March 2020). 12 This does not include Peter Prince Field, but it includes Destin–Fort Walton Beach Airport, which is located 30.6 nautical miles from
Peter Prince Field.
Master Plan Update | 1-8 | Aviation Activity Forecast
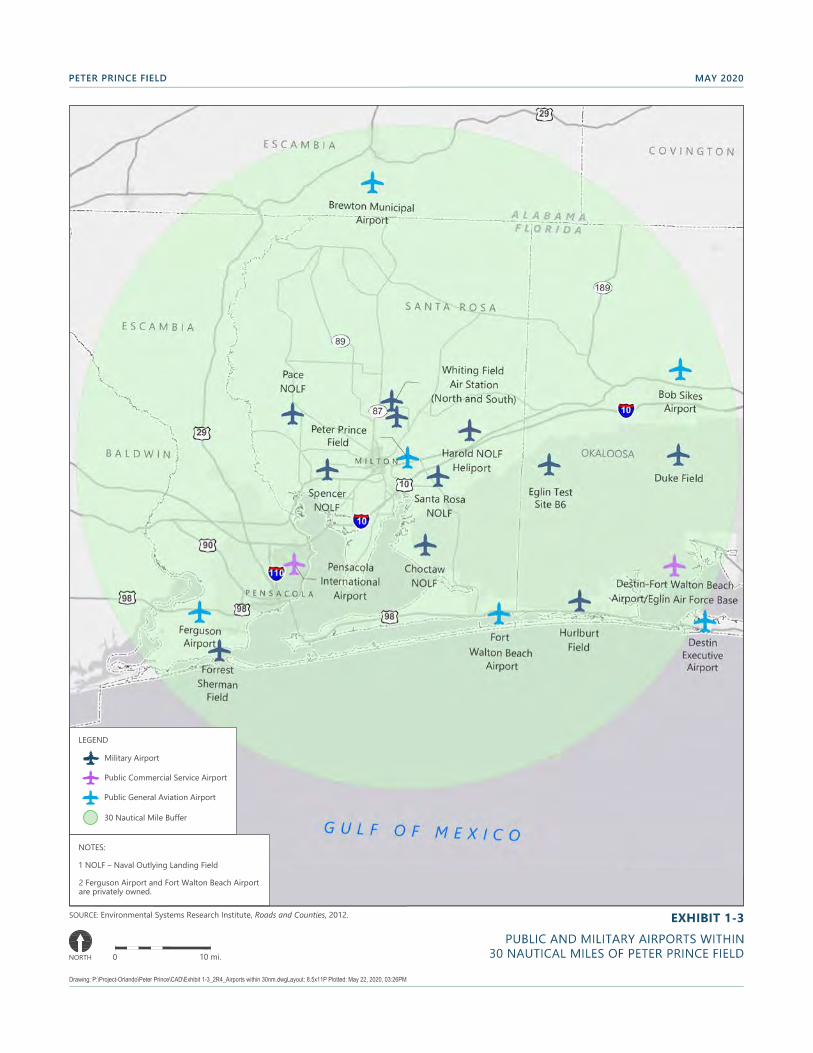
PETER PRINCE FIELD MAY 2020
PRELIMINARY DRAFT
EXHIBIT 1-3PUBLIC AND MILITARY AIRPORTS WITHIN
30 NAUTICAL MILES OF PETER PRINCE FIELD
NOTES:
1 NOLF – Naval Outlying Landing Field
2 Ferguson Airport and Fort Walton Beach Airportare privately owned.
LEGEND
Military Airport
Public Commercial Service Airport
Public General Aviation Airport
30 Nautical Mile Buffer
SOURCE: Environmental Systems Research Institute, Roads and Counties, 2012.
NORTH 0 10 mi.
Drawing: P:\Project-Orlando\Peter Prince\CAD\Exhibit 1-3_2R4_Airports within 30nm.dwgLayout: 8.5x11P Plotted: May 22, 2020, 03:26PM
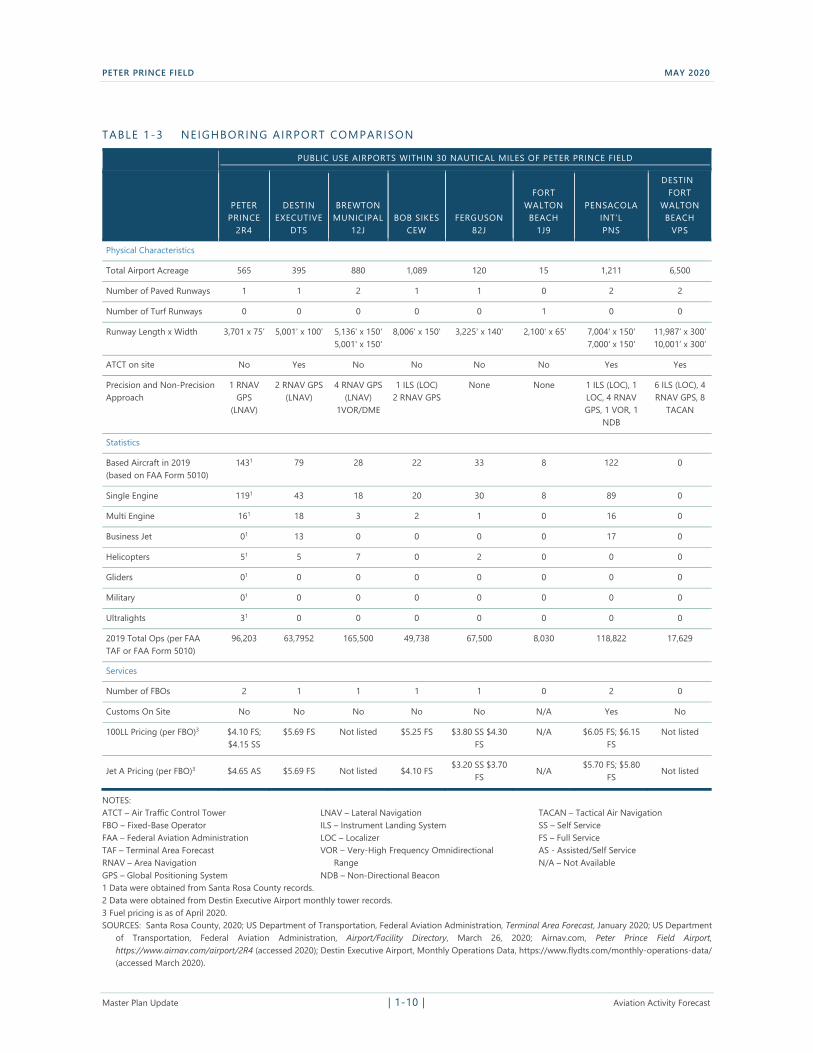
PETER PRINCE FIELD MAY 2020
TABLE 1-3 NEIGHBORING AIRPORT COMPARISON
PUBLIC USE AIRPORTS WITHIN 30 NAUTICAL MILES OF PETER PRINCE FIELD
PETER
PRINCE 2R4
DESTIN EXECUTIVE
DTS
BREWTON
MUNICIPAL 12J
BOB SIKES
CEW
FERGUSON
82J
FORT
WALTON BEACH
1J9
PENSACOLA INT’L
PNS
DESTIN
FORT WALTON
BEACH
VPS
–
Physical Characteristics
Total Airport Acreage 565 395 880 1,089 120 15 1,211 6,500
Number of Paved Runways 1 1 2 1 1 0 2 2
Number of Turf Runways 0 0 0 0 0 1 0 0
Runway Length x Width 3,701 x 75’ 5,001’ x 100’ 5,136' x 150' 8,006' x 150' 3,225' x 140' 2,100' x 65' 7,004' x 150' 11,987’ x 300’ 5,001' x 150' 7,000' x 150' 10,001’ x 300’
ATCT on site No Yes No No No No Yes Yes
Precision and Non-Precision 1 RNAV 2 RNAV GPS 4 RNAV GPS 1 ILS (LOC) None None 1 ILS (LOC), 1 6 ILS (LOC), 4 Approach GPS (LNAV) (LNAV) 2 RNAV GPS LOC, 4 RNAV RNAV GPS, 8
(LNAV) 1VOR/DME GPS, 1 VOR, 1 TACAN
NDB
Statistics
Based Aircraft in 2019 1431 79 28 22 33 8 122 0
(based on FAA Form 5010)
Single Engine 1191 43 18 20 30 8 89 0
Multi Engine 161 18 3 2 1 0 16 0
Business Jet 01 13 0 0 0 0 17 0
Helicopters 51 5 7 0 2 0 0 0
Gliders 01 0 0 0 0 0 0 0
Military 01 0 0 0 0 0 0 0
Ultralights 31 0 0 0 0 0 0 0
2019 Total Ops (per FAA 96,203 63,7952 165,500 49,738 67,500 8,030 118,822 17,629 TAF or FAA Form 5010)
Services
Number of FBOs 2 1 1 1 1 0 2 0
Customs On Site No No No No No N/A Yes No
100LL Pricing (per FBO)3 $4.10 FS; $5.69 FS Not listed $5.25 FS $3.80 SS $4.30 N/A $6.05 FS; $6.15 Not listed $4.15 SS FS FS
Jet A Pricing (per FBO)3 $4.65 AS $5.69 FS Not listed $4.10 FS $3.20 SS $3.70
FS N/A
$5.70 FS; $5.80 FS
Not listed
NOTES: ATCT – Air Traffic Control Tower LNAV – Lateral Navigation TACAN – Tactical Air Navigation
FBO – Fixed-Base Operator ILS – Instrument Landing System SS – Self Service FAA – Federal Aviation Administration LOC – Localizer FS – Full Service TAF – Terminal Area Forecast VOR – Very-High Frequency Omnidirectional AS - Assisted/Self Service RNAV – Area Navigation Range N/A – Not Available
GPS – Global Positioning System NDB – Non-Directional Beacon
1 Data were obtained from Santa Rosa County records. 2 Data were obtained from Destin Executive Airport monthly tower records. 3 Fuel pricing is as of April 2020. SOURCES: Santa Rosa County, 2020; US Department of Transportation, Federal Aviation Administration, Terminal Area Forecast, January 2020; US Department
of Transportation, Federal Aviation Administration, Airport/Facility Directory, March 26, 2020; Airnav.com, Peter Prince Field Airport, https://www.airnav.com/airport/2R4 (accessed 2020); Destin Executive Airport, Monthly Operations Data, https://www.flydts.com/monthly-operations-data/ (accessed March 2020).
Master Plan Update | 1-10 | Aviation Activity Forecast
PETER PRINCE FIELD MAY 2020
Eglin Air Force Base (AFB), one of the largest military bases in the United States, is collocated with VPS and is one of several military airfields located within a 30-nautical-mile radius of the Airport. These include NAS Whiting Field North and South; NAS Pensacola, also referred to as Forrest Sherman Field (NPA); Eglin Test Site B6 Airport; and Hurlburt Field (HRT). In addition, the military operates six auxiliary airfields, also known as Navy Outlying Landing Fields (NOLFs): Choctaw, Harold, Holley, Pace, Santa Rosa, and Spencer. The location of these installations is also depicted on Exhibit 1-3.
1 .1 .6 .1 NEIGHBORING AIRPORTS OFFERING COMMERCIAL AIRLINE SERVICE
PNS, owned and operated by the city of Pensacola, is located 14 nautical miles southwest of 2R4. PNS has two intersecting (perpendicular) runways: Runway 8-26 and Runway 17-35. Runway 8-26 is 7,000 feet long and 150
feet wide. Runway 17-35 is 7,004 feet long and 150 feet wide. In 2019, PNS accommodated approximately 118,82213 operations and had 122 based aircraft,14 including 89 single-engine aircraft, 16 multi-engine aircraft, 17 business jets, and 0 helicopters. Local and itinerant GA operations accounted for 60.3 percent of all aircraft operations at PNS.15 Two full-service FBOs currently serve GA traffic at PNS.
VPS is a joint civilian/military (joint-use) facility located 25.9 nautical miles southeast of 2R4 and within the Eglin
AFB boundary. VPS is currently served by five airlines, and it accommodates upwards of 350,000 passengers per year.16 Both runways at VPS exceed 10,000 feet in length and are 300 feet wide. In 2019, VPS accommodated approximately 17,629 aircraft operations,17 with the majority of these being air carrier operations. Local and itinerant GA operations accounted for 0.24 percent18 of all operations at VPS in 2019.
1 .1 .6 .2 NEIGHBORING GENERAL AVIATION AIRPORTS
12J, owned and operated by the City of Brewton, is located 25 nautical miles north of 2R4 in the state of Alabama. 12J has two intersecting asphalt runways: Runways 6-24 and 12-30. Both runways are 150 feet wide. Runway 6-24 is 5,136 feet long, and Runway 12-30 is 5,001 feet long. In 2019, 28 aircraft were based at 12J, including 18 single-engine aircraft, 3 multi-engine aircraft, and 7 helicopters. In 2019, 165,500 annual operations were reported at 12J, with 4.23 percent of these operations being transient. One full-service FBO currently serves 12J.
CEW is located 26 nautical miles northeast of 2R4 and 3 miles northeast of the city of Crestview in Okaloosa
County. CEW is owned and operated by Okaloosa County. CEW is served by a single asphalt runway; Runway 17-35 is 8,006 feet long and 150 feet wide. Based on FAA TAF data, CEW accommodated approximately 49,738 operations in 2019, of which 68.03 percent were transient. In 2019, 22 aircraft were based at CEW, including 20 single-engine aircraft and 2 multi-engine aircraft. One full-service FBO currently serves CEW.
DTS, also owned and operated by Okaloosa County, is located approximately 30 nautical miles southeast of 2R4. DTS is served by a single asphalt runway that is 5,001 feet long and 100 feet wide. Per DTS monthly operation records, the airport accommodated 63,795 operations in 2019, with 81 percent of those being transient. In 2019, 79 aircraft were based at DTS, including 43 single-engine aircraft, 18 multi-engine aircraft, 13 business jets, and
5 helicopters. One full-service FBO currently serves DTS.
13 US Department of Transportation, Federal Aviation Administration, Form 5010, https://www.airportiq5010.com/5010web/dashboard/basedaircraft (accessed May 2020)
14 Ibid. 15 US Department of Transportation, Federal Aviation Administration, The Operations Network (OPSNET) (accessed March 2020). 16 US Department of Transportation, Federal Aviation Administration, Terminal Area Forecast, January 2020
17 US Department of Transportation, Federal Aviation Administration, Form 5010, https://www.airportiq5010.com/5010web/dashboard/basedaircraft (accessed March 2020).
18 Ibid.
Master Plan Update | 1-11 | Aviation Activity Forecast
PETER PRINCE FIELD MAY 2020
82J is located 23 nautical miles southwest of 2R4 and 7 miles northwest of Pensacola. 82J is a privately owned public-use airport. There is one runway located on the airfield, Runway 18-36, which is 3,225 feet long and 140 feet wide. Form 5010 reported 67,500 operations and 33 based aircraft at 82J, including 30 single-engine aircraft, 1 multi-engine aircraft, and 2 helicopters. Of the 67,500 operations, 25.93 percent were reported as transient. One full-service FBO currently serves 82J.
1J9, a privately owned public-use airport is located 16 nautical miles southeast of 2R4 in the city of Navarre, Florida. 1J9 is served by a turf runway that is 2,100 feet long and 65 feet wide. Form 5010 reported 8 single-engine aircraft and 8,030 operations at the airport. Of the operations reported, 9 percent were transient. The airport is not served by an FBO.
1 .1 .6 .3 SUMMARY
2R4 is the only airport within the NPIAS dedicated to GA within Santa Rosa County. As shown on Exhibit 1-3, it is also the only dedicated GA airport within a 30-minute drive time from the city of Milton. The Airport, however, is surrounded by several military airfields, which, as discussed in the following section, makes the surrounding airspace complex and somewhat congested.
The Airport has one published non-precision instrument approach. CEW is the only GA airport within a 30-nautical-mile radius that maintains an instrument landing system to conduct precision approaches. The Airport accommodates the largest number of based aircraft in the region, and with two FBOs it provides services commensurate with those at surrounding airports. Additionally, the Airport offers competitive fuel prices for both 100LL Avgas and jet fuel (Jet-A).
1.1.7 AIRSPACE
The airspace in the Pensacola and Eglin AFB area is one of the most intensively used airspace in the nation
because of the high concentration of military and training activities. Eglin AFB, for instance, which occupies over 724 square miles of land, has a total of approximately 128,000 square miles of charted airspace, 2.5 percent of which is over land.19 As a result of the proximity of the Airport to the military bases in the region, specifically Eglin AFB, NAS Whiting Field, and Santa Rosa NOLF, special procedures are in place for both arrivals and
departures to and from the Airport. As airspace restrictions affect aircraft activity at the Airport, an overview of the airspace hierarchy and existing airspace areas surrounding the Airport is provided in this section.
1 .1 .7 .1 AIRSPACE HIERARCHY
To ensure a safe and efficient airspace environment for all aspects of aviation, the FAA has established an airspace structure to regulate and establish procedures for aircraft using the National Airspace System. The FAA has established three categories of airspace:
controlled airspace (Class A, B, C, D, and E airspace areas)
uncontrolled airspace (Class G)
special use airspace (restricted, military operations areas [MOAs], warning areas, and alert areas)
Each airspace category is discussed in the subsequent subsections.
19 Tetra Tech and Solin & Associates, Inc., Draft Eglin Air Force Base Joint Land Use Study, 2009.
Master Plan Update | 1-12 | Aviation Activity Forecast
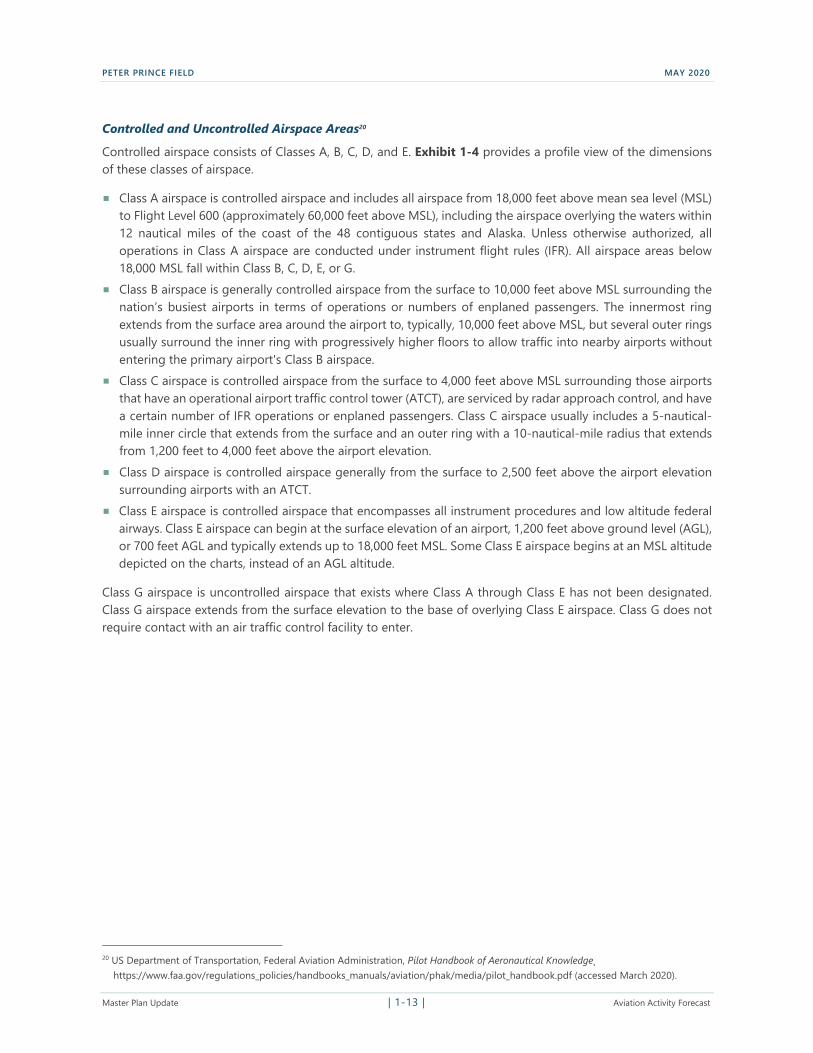
PETER PRINCE FIELD MAY 2020
Controlled and Uncontrolled Airspace Areas20
Controlled airspace consists of Classes A, B, C, D, and E. Exhibit 1-4 provides a profile view of the dimensions of these classes of airspace.
Class A airspace is controlled airspace and includes all airspace from 18,000 feet above mean sea level (MSL) to Flight Level 600 (approximately 60,000 feet above MSL), including the airspace overlying the waters within
12 nautical miles of the coast of the 48 contiguous states and Alaska. Unless otherwise authorized, all operations in Class A airspace are conducted under instrument flight rules (IFR). All airspace areas below 18,000 MSL fall within Class B, C, D, E, or G.
Class B airspace is generally controlled airspace from the surface to 10,000 feet above MSL surrounding the nation’s busiest airports in terms of operations or numbers of enplaned passengers. The innermost ring
extends from the surface area around the airport to, typically, 10,000 feet above MSL, but several outer rings usually surround the inner ring with progressively higher floors to allow traffic into nearby airports without entering the primary airport's Class B airspace.
Class C airspace is controlled airspace from the surface to 4,000 feet above MSL surrounding those airports
that have an operational airport traffic control tower (ATCT), are serviced by radar approach control, and have
a certain number of IFR operations or enplaned passengers. Class C airspace usually includes a 5-nautical-mile inner circle that extends from the surface and an outer ring with a 10-nautical-mile radius that extends from 1,200 feet to 4,000 feet above the airport elevation.
Class D airspace is controlled airspace generally from the surface to 2,500 feet above the airport elevation surrounding airports with an ATCT.
Class E airspace is controlled airspace that encompasses all instrument procedures and low altitude federal airways. Class E airspace can begin at the surface elevation of an airport, 1,200 feet above ground level (AGL), or 700 feet AGL and typically extends up to 18,000 feet MSL. Some Class E airspace begins at an MSL altitude depicted on the charts, instead of an AGL altitude.
Class G airspace is uncontrolled airspace that exists where Class A through Class E has not been designated. Class G airspace extends from the surface elevation to the base of overlying Class E airspace. Class G does not require contact with an air traffic control facility to enter.
20 US Department of Transportation, Federal Aviation Administration, Pilot Handbook of Aeronautical Knowledge¸ https://www.faa.gov/regulations_policies/handbooks_manuals/aviation/phak/media/pilot_handbook.pdf (accessed March 2020).
Master Plan Update | 1-13 | Aviation Activity Forecast
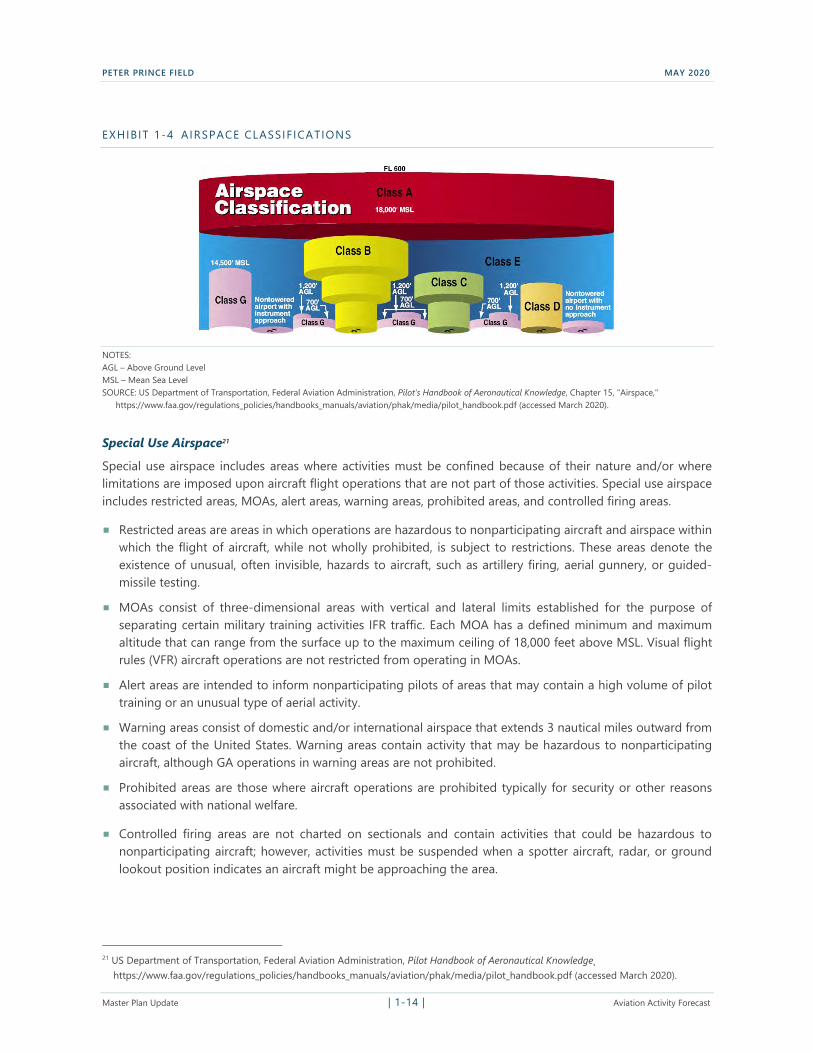
PETER PRINCE FIELD MAY 2020
EXHIBIT 1-4 AIRSPACE CLASSIF ICATIONS
NOTES: AGL – Above Ground Level MSL – Mean Sea Level SOURCE: US Department of Transportation, Federal Aviation Administration, Pilot’s Handbook of Aeronautical Knowledge, Chapter 15, "Airspace,"
https://www.faa.gov/regulations_policies/handbooks_manuals/aviation/phak/media/pilot_handbook.pdf (accessed March 2020).
Special Use Airspace21
Special use airspace includes areas where activities must be confined because of their nature and/or where limitations are imposed upon aircraft flight operations that are not part of those activities. Special use airspace includes restricted areas, MOAs, alert areas, warning areas, prohibited areas, and controlled firing areas.
Restricted areas are areas in which operations are hazardous to nonparticipating aircraft and airspace within which the flight of aircraft, while not wholly prohibited, is subject to restrictions. These areas denote the
existence of unusual, often invisible, hazards to aircraft, such as artillery firing, aerial gunnery, or guided-missile testing.
MOAs consist of three-dimensional areas with vertical and lateral limits established for the purpose of separating certain military training activities IFR traffic. Each MOA has a defined minimum and maximum altitude that can range from the surface up to the maximum ceiling of 18,000 feet above MSL. Visual flight rules (VFR) aircraft operations are not restricted from operating in MOAs.
Alert areas are intended to inform nonparticipating pilots of areas that may contain a high volume of pilot training or an unusual type of aerial activity.
Warning areas consist of domestic and/or international airspace that extends 3 nautical miles outward from
the coast of the United States. Warning areas contain activity that may be hazardous to nonparticipating aircraft, although GA operations in warning areas are not prohibited.
Prohibited areas are those where aircraft operations are prohibited typically for security or other reasons associated with national welfare.
Controlled firing areas are not charted on sectionals and contain activities that could be hazardous to nonparticipating aircraft; however, activities must be suspended when a spotter aircraft, radar, or ground lookout position indicates an aircraft might be approaching the area.
21 US Department of Transportation, Federal Aviation Administration, Pilot Handbook of Aeronautical Knowledge¸ https://www.faa.gov/regulations_policies/handbooks_manuals/aviation/phak/media/pilot_handbook.pdf (accessed March 2020).
Master Plan Update | 1-14 | Aviation Activity Forecast
PETER PRINCE FIELD MAY 2020
1 .1 .7 .2 AIRSPACE AREAS SURROUNDING THE AIRPORT
Exhibit 1-5 shows the immediate airspace surrounding the Airport, which is categorized as Class C airspace. The Class C airspace surrounding 2R4 is NAS Whiting Class C airspace. Class C airspace in this area is controlled by Pensacola Approach Control, which supervises, directs, and monitors the arrival and departure traffic in the greater Pensacola Bay area, including traffic originating at/leaving NAS Whiting Field. 2R4 is not included within the inner circle Class C airspace centered on NAS Whiting Field that begins at the surface elevation of the airfield
and extends to 4,200 feet MSL. As a result, aircraft activity in the immediate vicinity of 2R4 outside the inner circle Class C airspace and below 1,400 feet above MSL is uncontrolled Class G airspace. Flight operations over 1,400 feet above MSL require coordination with Pensacola Approach Control.
Because of the Airport’s close proximity to military bases, it is surrounded by MOAs, restricted areas, and special use air traffic areas. Specifically, the Airport is located within Alert Area 292 (A-292) and the Pensacola South MOA. The Airport is also located approximately 19 nautical miles south of the Pensacola North MOA. The Eglin AFB MOAs lie immediately east of the Airport. Additionally, restricted areas and special use air traffic areas exist southeast of the Airport, adjacent to the Pensacola South MOA. Table 1-4 lists the altitudes, time of use, and
controlling agencies of all special use airspace in the vicinity of the Airport.
Master Plan Update | 1-15 | Aviation Activity Forecast
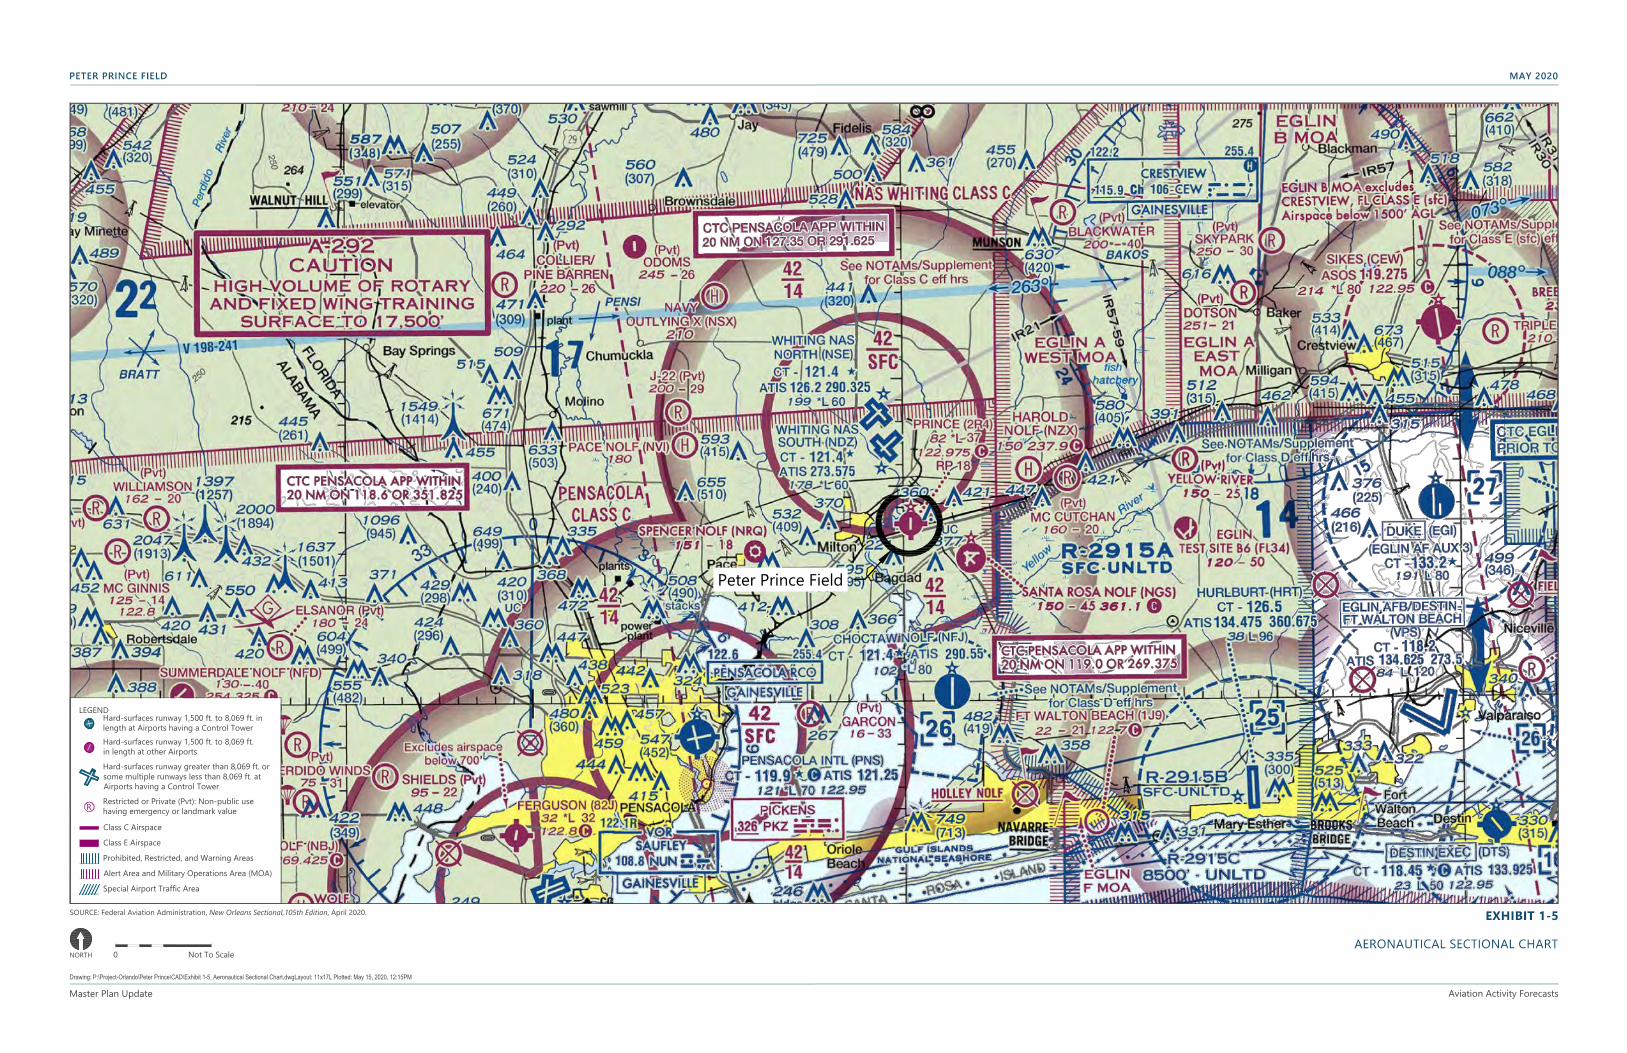
EXHIBIT 1-5
AERONAUTICAL SECTIONAL CHART
PETER PRINCE FIELD MAY 2020
PRELIMINARY DRAFT
Peter Prince Field
LEGEND
Hard-surfaces runway greater than 8,069 ft. or some multiple runways less than 8,069 ft. at Airports having a Control Tower
Hard-surfaces runway 1,500 ft. to 8,069 ft. in length at other Airports
Hard-surfaces runway 1,500 ft. to 8,069 ft. in length at Airports having a Control Tower
Special Airport Traffic Area
Alert Area and Military Operations Area (MOA)
Prohibited, Restricted, and Warning Areas
Restricted or Private (Pvt): Non-public use having emergency or landmark valueR
Class C Airspace
Class E Airspace
SOURCE: Federal Aviation Administration, New Orleans Sectional,105th Edition, April 2020.
NORTH 0 Not To Scale
Drawing: P:\Project-Orlando\Peter Prince\CAD\Exhibit 1-5_Aeronautical Sectional Chart.dwgLayout: 11x17L Plotted: May 15, 2020, 12:15PM
Master Plan Update Aviation Activity Forecasts
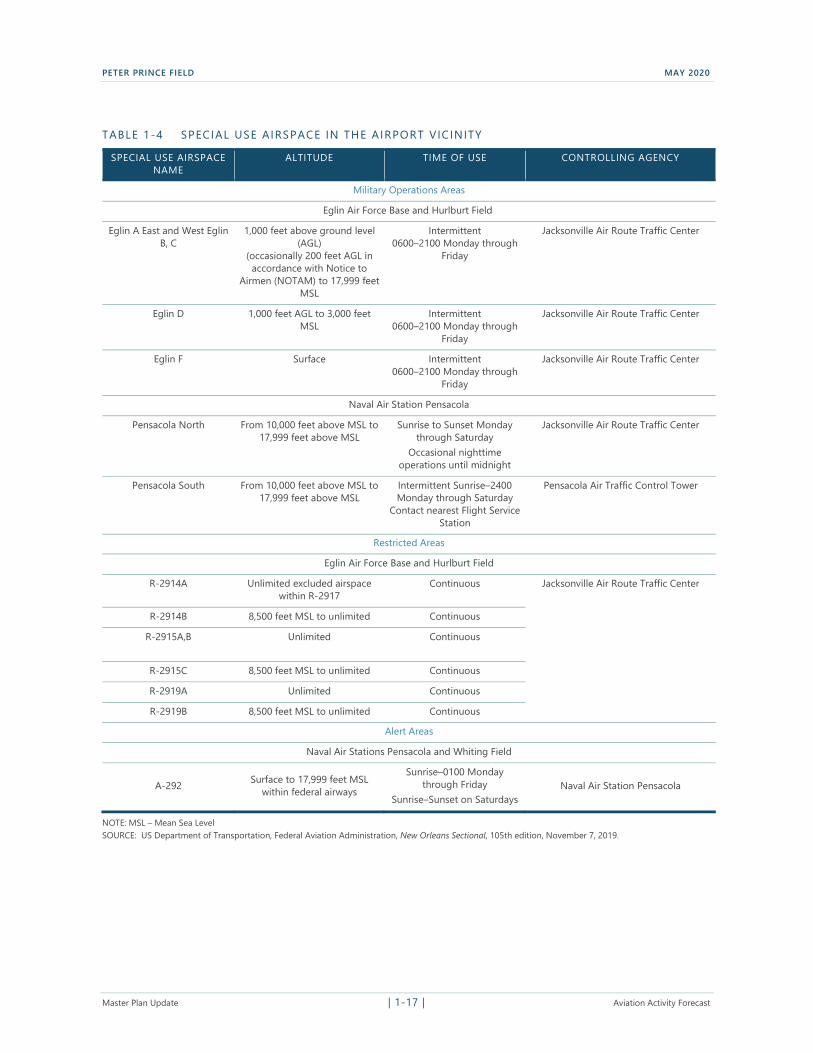
PETER PRINCE FIELD MAY 2020
TABLE 1-4 SPECIAL USE AIRSPACE IN THE AIRPORT VICINITY
SPECIAL USE AIRSPACE NAME
ALTITUDE TIME OF USE CONTROLLING AGENCY
Military Operations Areas
Eglin Air Force Base and Hurlburt Field
Eglin A East and West Eglin B, C
1,000 feet above ground level (AGL)
(occasionally 200 feet AGL in accordance with Notice to
Airmen (NOTAM) to 17,999 feet MSL
Intermittent 0600–2100 Monday through
Friday
Jacksonville Air Route Traffic Center
Eglin D 1,000 feet AGL to 3,000 feet MSL
Intermittent 0600–2100 Monday through
Friday
Jacksonville Air Route Traffic Center
Eglin F Surface Intermittent 0600–2100 Monday through
Friday
Jacksonville Air Route Traffic Center
Naval Air Station Pensacola
Pensacola North From 10,000 feet above MSL to 17,999 feet above MSL
Sunrise to Sunset Monday through Saturday
Occasional nighttime operations until midnight
Jacksonville Air Route Traffic Center
Pensacola South From 10,000 feet above MSL to 17,999 feet above MSL
Intermittent Sunrise–2400 Monday through Saturday
Contact nearest Flight Service Station
Pensacola Air Traffic Control Tower
Restricted Areas
Eglin Air Force Base and Hurlburt Field
R-2914A Unlimited excluded airspace within R-2917
Continuous Jacksonville Air Route Traffic Center
R-2914B 8,500 feet MSL to unlimited Continuous
R-2915A,B Unlimited Continuous
R-2915C 8,500 feet MSL to unlimited Continuous
R-2919A Unlimited Continuous
R-2919B 8,500 feet MSL to unlimited Continuous
Alert Areas
Naval Air Stations Pensacola and Whiting Field
A-292 Surface to 17,999 feet MSL within federal airways
Sunrise–0100 Monday through Friday
Sunrise–Sunset on Saturdays Naval Air Station Pensacola
NOTE: MSL – Mean Sea Level SOURCE: US Department of Transportation, Federal Aviation Administration, New Orleans Sectional, 105th edition, November 7, 2019.
Master Plan Update | 1-17 | Aviation Activity Forecast
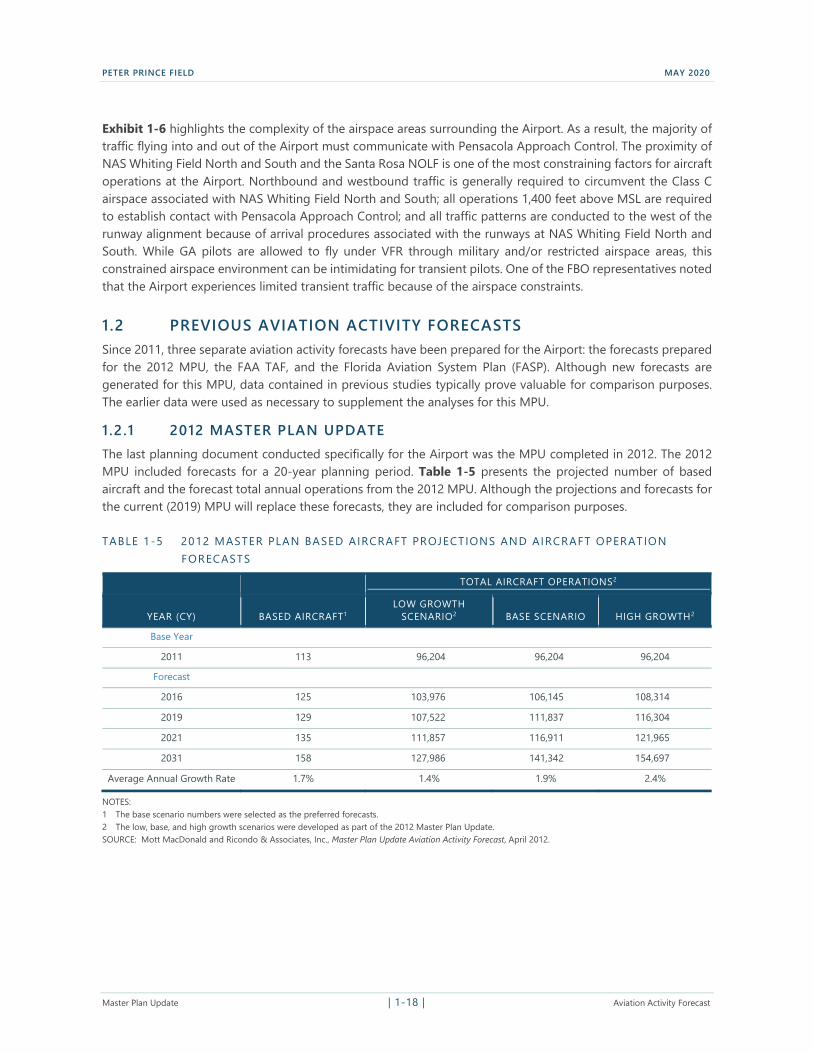
PETER PRINCE FIELD MAY 2020
Exhibit 1-6 highlights the complexity of the airspace areas surrounding the Airport. As a result, the majority of traffic flying into and out of the Airport must communicate with Pensacola Approach Control. The proximity of NAS Whiting Field North and South and the Santa Rosa NOLF is one of the most constraining factors for aircraft operations at the Airport. Northbound and westbound traffic is generally required to circumvent the Class C airspace associated with NAS Whiting Field North and South; all operations 1,400 feet above MSL are required to establish contact with Pensacola Approach Control; and all traffic patterns are conducted to the west of the runway alignment because of arrival procedures associated with the runways at NAS Whiting Field North and South. While GA pilots are allowed to fly under VFR through military and/or restricted airspace areas, this
constrained airspace environment can be intimidating for transient pilots. One of the FBO representatives noted that the Airport experiences limited transient traffic because of the airspace constraints.
1.2 PREVIOUS AVIATION ACTIVITY FORECASTS Since 2011, three separate aviation activity forecasts have been prepared for the Airport: the forecasts prepared for the 2012 MPU, the FAA TAF, and the Florida Aviation System Plan (FASP). Although new forecasts are generated for this MPU, data contained in previous studies typically prove valuable for comparison purposes. The earlier data were used as necessary to supplement the analyses for this MPU.
1.2.1 2012 MASTER PLAN UPDATE The last planning document conducted specifically for the Airport was the MPU completed in 2012. The 2012 MPU included forecasts for a 20-year planning period. Table 1-5 presents the projected number of based
aircraft and the forecast total annual operations from the 2012 MPU. Although the projections and forecasts for the current (2019) MPU will replace these forecasts, they are included for comparison purposes.
TABLE 1-5 2012 MASTER PLAN BASED AIRCRAFT PROJECTIONS AND AIRCRAFT OPERATION FORECASTS
TOTAL AIRCRAFT OPERATIONS2
YEAR (CY) BASED AIRCRAFT1
LOW GROWTH SCENARIO2 BASE SCENARIO HIGH GROWTH2
Base Year
2011 113 96,204 96,204 96,204
Forecast
2016 125 103,976 106,145 108,314
2019 129 107,522 111,837 116,304
2021 135 111,857 116,911 121,965
2031 158 127,986 141,342 154,697
Average Annual Growth Rate 1.7% 1.4% 1.9% 2.4%
NOTES: 1 The base scenario numbers were selected as the preferred forecasts. 2 The low, base, and high growth scenarios were developed as part of the 2012 Master Plan Update. SOURCE: Mott MacDonald and Ricondo & Associates, Inc., Master Plan Update Aviation Activity Forecast, April 2012.
Master Plan Update | 1-18 | Aviation Activity Forecast
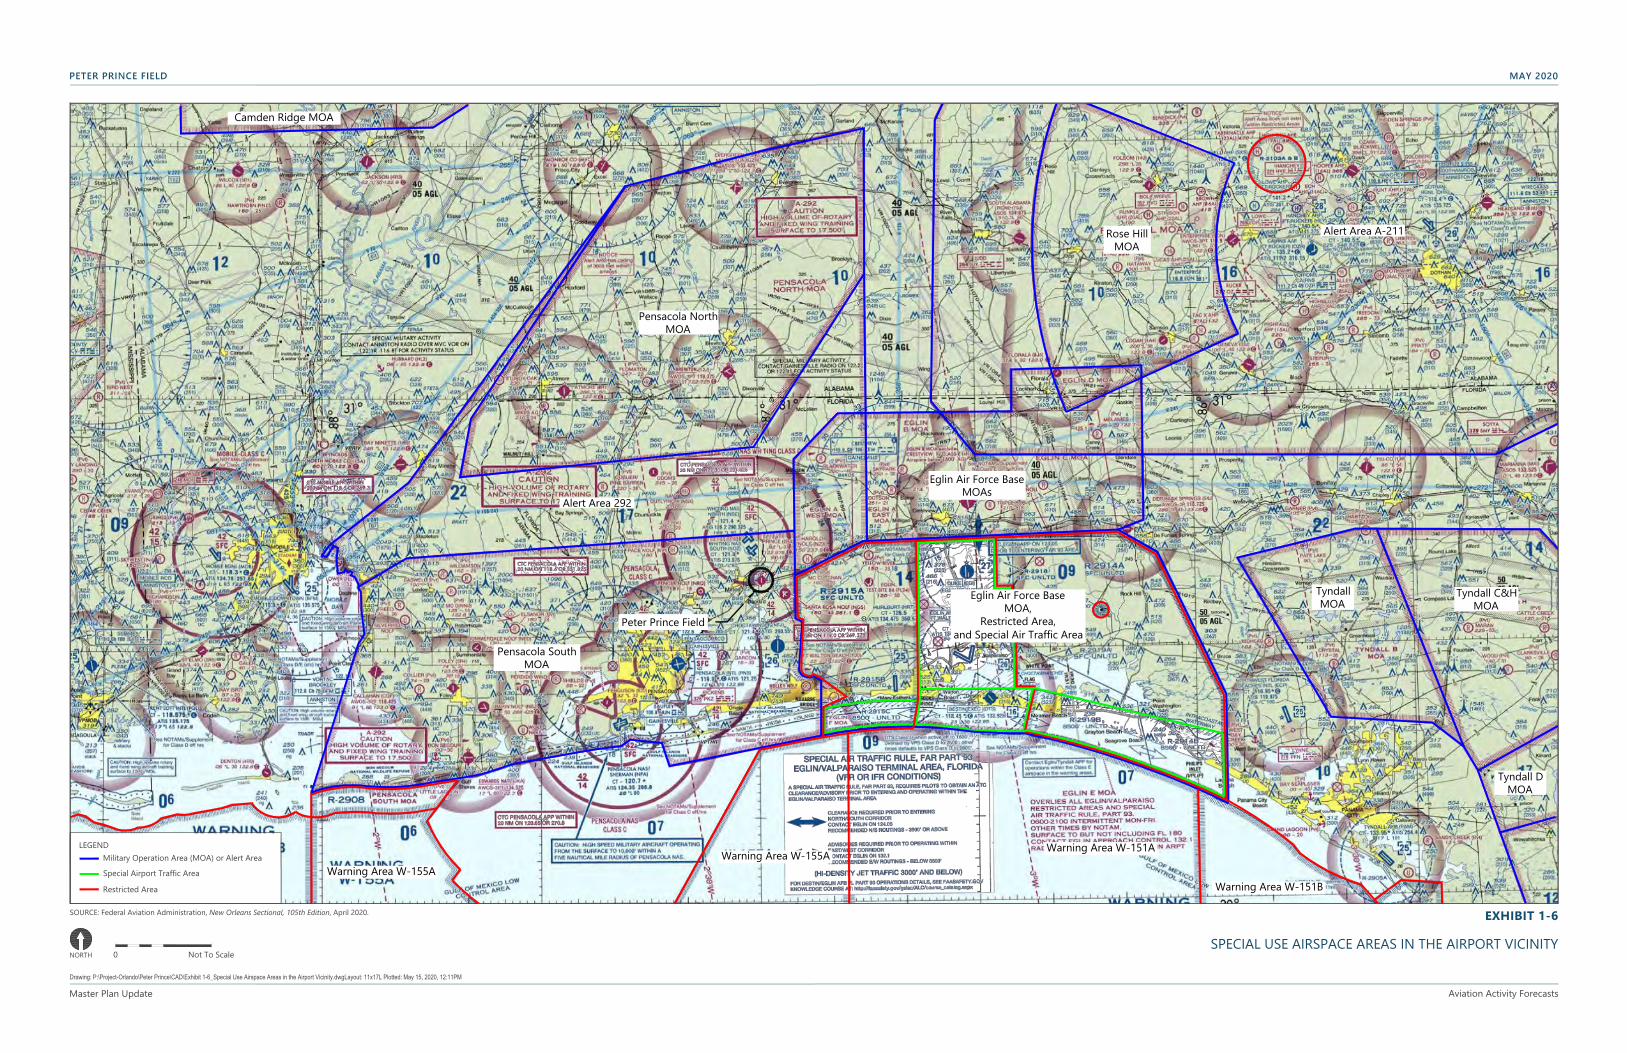
EXHIBIT 1-6
PETER PRINCE FIELD MAY 2020
PRELIMINARY DRAFT
Peter Prince Field
Pensacola South MOA
Pensacola North MOA
Alert Area 292
Eglin Air Force Base MOAs
Rose Hill MOA
Tyndall MOA
Tyndall C&H MOA
Eglin Air Force Base MOA,
Restricted Area, and Special Air Traffic Area
Alert Area A-211
Warning Area W-151B
Warning Area W-151AWarning Area W-155A
Warning Area W-155A
Tyndall D MOA
Camden Ridge MOA
LEGEND
Military Operation Area (MOA) or Alert Area
Special Airport Traffic Area
Restricted Area
SOURCE: Federal Aviation Administration, New Orleans Sectional, 105th Edition, April 2020.
SPECIAL USE AIRSPACE AREAS IN THE AIRPORT VICINITY Not To Scale
Drawing: P:\Project-Orlando\Peter Prince\CAD\Exhibit 1-6_Special Use Airspace Areas in the Airport Vicinity.dwgLayout: 11x17L Plotted: May 15, 2020, 12:11PM
NORTH
Master Plan Update Aviation Activity Forecasts
0
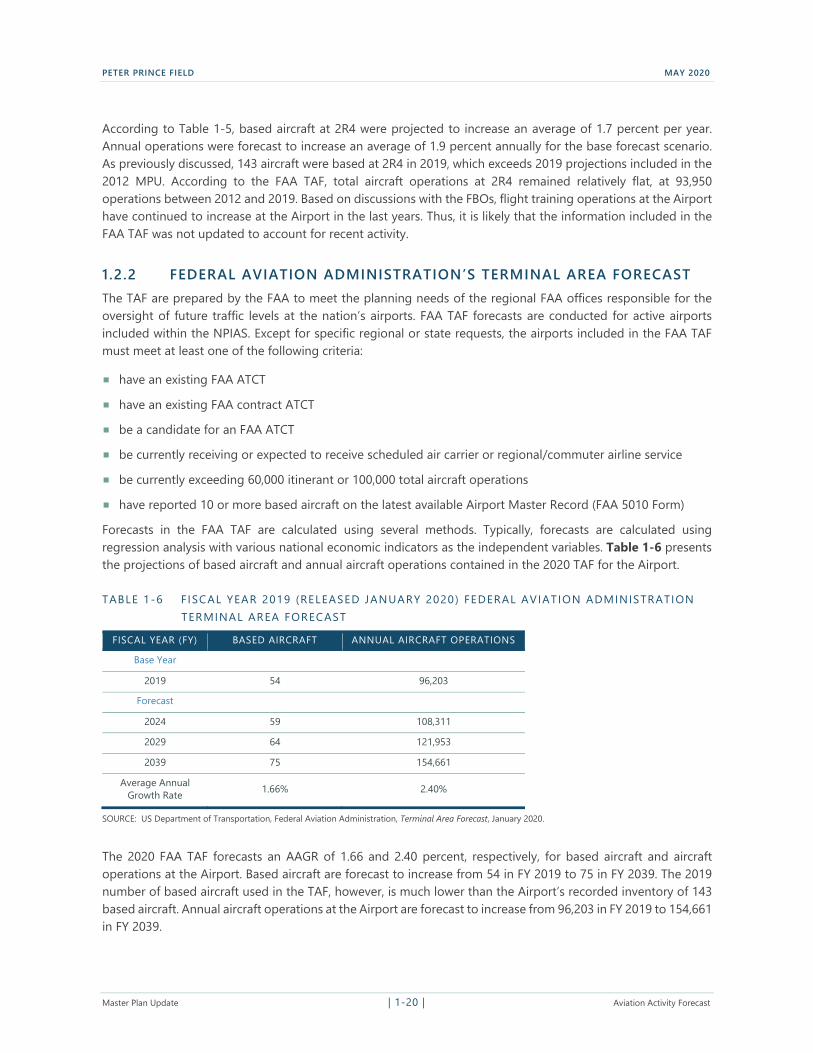
PETER PRINCE FIELD MAY 2020
According to Table 1-5, based aircraft at 2R4 were projected to increase an average of 1.7 percent per year. Annual operations were forecast to increase an average of 1.9 percent annually for the base forecast scenario. As previously discussed, 143 aircraft were based at 2R4 in 2019, which exceeds 2019 projections included in the 2012 MPU. According to the FAA TAF, total aircraft operations at 2R4 remained relatively flat, at 93,950 operations between 2012 and 2019. Based on discussions with the FBOs, flight training operations at the Airport have continued to increase at the Airport in the last years. Thus, it is likely that the information included in the FAA TAF was not updated to account for recent activity.
1.2.2 FEDERAL AVIATION ADMINISTRATION’S TERMINAL AREA FORECAST The TAF are prepared by the FAA to meet the planning needs of the regional FAA offices responsible for the oversight of future traffic levels at the nation’s airports. FAA TAF forecasts are conducted for active airports included within the NPIAS. Except for specific regional or state requests, the airports included in the FAA TAF must meet at least one of the following criteria:
have an existing FAA ATCT
have an existing FAA contract ATCT
be a candidate for an FAA ATCT
be currently receiving or expected to receive scheduled air carrier or regional/commuter airline service
be currently exceeding 60,000 itinerant or 100,000 total aircraft operations
have reported 10 or more based aircraft on the latest available Airport Master Record (FAA 5010 Form)
Forecasts in the FAA TAF are calculated using several methods. Typically, forecasts are calculated using regression analysis with various national economic indicators as the independent variables. Table 1-6 presents the projections of based aircraft and annual aircraft operations contained in the 2020 TAF for the Airport.
TABLE 1-6 FISCAL YEAR 2019 (RELEASED JANUARY 2020) FEDERAL AVIATION ADMINISTRATION
TERMINAL AREA FORECAST
FISCAL YEAR (FY) BASED AIRCRAFT ANNUAL AIRCRAFT OPERATIONS
Base Year
2019 54 96,203
Forecast
2024 59 108,311
2029 64 121,953
2039 75 154,661
Average Annual 1.66% 2.40% Growth Rate
SOURCE: US Department of Transportation, Federal Aviation Administration, Terminal Area Forecast, January 2020.
The 2020 FAA TAF forecasts an AAGR of 1.66 and 2.40 percent, respectively, for based aircraft and aircraft operations at the Airport. Based aircraft are forecast to increase from 54 in FY 2019 to 75 in FY 2039. The 2019 number of based aircraft used in the TAF, however, is much lower than the Airport’s recorded inventory of 143
based aircraft. Annual aircraft operations at the Airport are forecast to increase from 96,203 in FY 2019 to 154,661 in FY 2039.
Master Plan Update | 1-20 | Aviation Activity Forecast
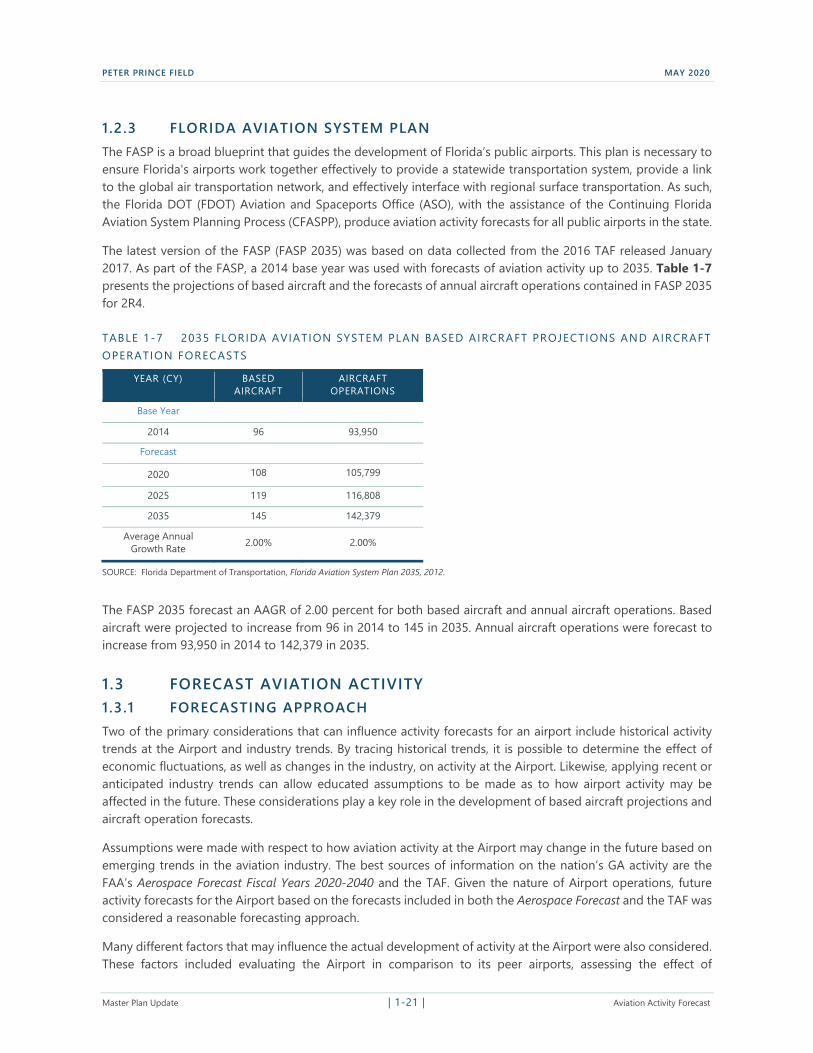
PETER PRINCE FIELD MAY 2020
1.2.3 FLORIDA AVIATION SYSTEM PLAN
The FASP is a broad blueprint that guides the development of Florida’s public airports. This plan is necessary to ensure Florida's airports work together effectively to provide a statewide transportation system, provide a link
to the global air transportation network, and effectively interface with regional surface transportation. As such, the Florida DOT (FDOT) Aviation and Spaceports Office (ASO), with the assistance of the Continuing Florida
Aviation System Planning Process (CFASPP), produce aviation activity forecasts for all public airports in the state.
The latest version of the FASP (FASP 2035) was based on data collected from the 2016 TAF released January 2017. As part of the FASP, a 2014 base year was used with forecasts of aviation activity up to 2035. Table 1-7 presents the projections of based aircraft and the forecasts of annual aircraft operations contained in FASP 2035 for 2R4.
TABLE 1-7 2035 FLORIDA AVIATION SYSTEM PLAN BASED AIRCRAFT PROJECTIONS AND AIRCRAFT
OPERATION FORECASTS
YEAR (CY) BASED AIRCRAFT
AIRCRAFT OPERATIONS
Base Year
2014 96 93,950
Forecast
2020 108 105,799
2025 119 116,808
2035 145 142,379
Average Annual 2.00% 2.00% Growth Rate
SOURCE: Florida Department of Transportation, Florida Aviation System Plan 2035, 2012.
The FASP 2035 forecast an AAGR of 2.00 percent for both based aircraft and annual aircraft operations. Based aircraft were projected to increase from 96 in 2014 to 145 in 2035. Annual aircraft operations were forecast to increase from 93,950 in 2014 to 142,379 in 2035.
1.3 FORECAST AVIATION ACTIVITY
1.3.1 FORECASTING APPROACH Two of the primary considerations that can influence activity forecasts for an airport include historical activity trends at the Airport and industry trends. By tracing historical trends, it is possible to determine the effect of economic fluctuations, as well as changes in the industry, on activity at the Airport. Likewise, applying recent or anticipated industry trends can allow educated assumptions to be made as to how airport activity may be affected in the future. These considerations play a key role in the development of based aircraft projections and aircraft operation forecasts.
Assumptions were made with respect to how aviation activity at the Airport may change in the future based on
emerging trends in the aviation industry. The best sources of information on the nation’s GA activity are the FAA’s Aerospace Forecast Fiscal Years 2020-2040 and the TAF. Given the nature of Airport operations, future activity forecasts for the Airport based on the forecasts included in both the Aerospace Forecast and the TAF was considered a reasonable forecasting approach.
Many different factors that may influence the actual development of activity at the Airport were also considered. These factors included evaluating the Airport in comparison to its peer airports, assessing the effect of
Master Plan Update | 1-21 | Aviation Activity Forecast
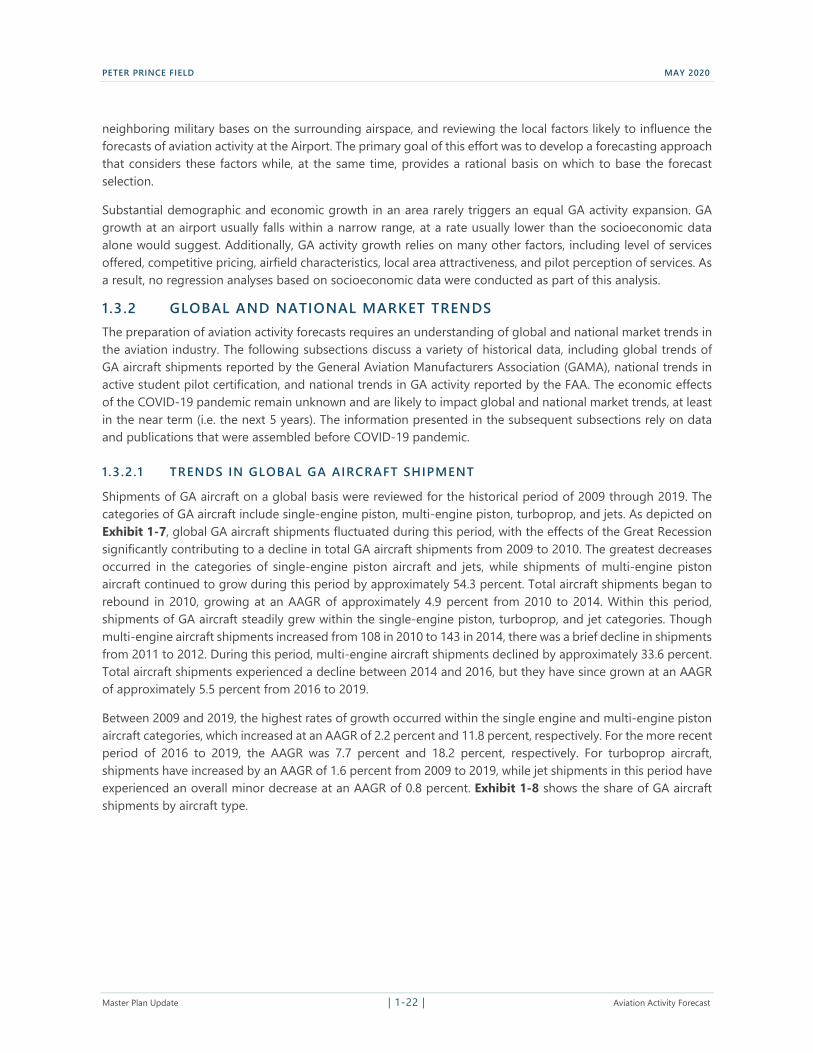
PETER PRINCE FIELD MAY 2020
neighboring military bases on the surrounding airspace, and reviewing the local factors likely to influence the forecasts of aviation activity at the Airport. The primary goal of this effort was to develop a forecasting approach that considers these factors while, at the same time, provides a rational basis on which to base the forecast selection.
Substantial demographic and economic growth in an area rarely triggers an equal GA activity expansion. GA growth at an airport usually falls within a narrow range, at a rate usually lower than the socioeconomic data
alone would suggest. Additionally, GA activity growth relies on many other factors, including level of services
offered, competitive pricing, airfield characteristics, local area attractiveness, and pilot perception of services. As a result, no regression analyses based on socioeconomic data were conducted as part of this analysis.
1.3.2 GLOBAL AND NATIONAL MARKET TRENDS
The preparation of aviation activity forecasts requires an understanding of global and national market trends in the aviation industry. The following subsections discuss a variety of historical data, including global trends of GA aircraft shipments reported by the General Aviation Manufacturers Association (GAMA), national trends in active student pilot certification, and national trends in GA activity reported by the FAA. The economic effects of the COVID-19 pandemic remain unknown and are likely to impact global and national market trends, at least in the near term (i.e. the next 5 years). The information presented in the subsequent subsections rely on data and publications that were assembled before COVID-19 pandemic.
1 .3 .2.1 TRENDS IN GLOBAL GA AIRCRAFT SHIPMENT
Shipments of GA aircraft on a global basis were reviewed for the historical period of 2009 through 2019. The categories of GA aircraft include single-engine piston, multi-engine piston, turboprop, and jets. As depicted on
Exhibit 1-7, global GA aircraft shipments fluctuated during this period, with the effects of the Great Recession significantly contributing to a decline in total GA aircraft shipments from 2009 to 2010. The greatest decreases occurred in the categories of single-engine piston aircraft and jets, while shipments of multi-engine piston aircraft continued to grow during this period by approximately 54.3 percent. Total aircraft shipments began to
rebound in 2010, growing at an AAGR of approximately 4.9 percent from 2010 to 2014. Within this period, shipments of GA aircraft steadily grew within the single-engine piston, turboprop, and jet categories. Though
multi-engine aircraft shipments increased from 108 in 2010 to 143 in 2014, there was a brief decline in shipments from 2011 to 2012. During this period, multi-engine aircraft shipments declined by approximately 33.6 percent. Total aircraft shipments experienced a decline between 2014 and 2016, but they have since grown at an AAGR of approximately 5.5 percent from 2016 to 2019.
Between 2009 and 2019, the highest rates of growth occurred within the single engine and multi-engine piston aircraft categories, which increased at an AAGR of 2.2 percent and 11.8 percent, respectively. For the more recent period of 2016 to 2019, the AAGR was 7.7 percent and 18.2 percent, respectively. For turboprop aircraft, shipments have increased by an AAGR of 1.6 percent from 2009 to 2019, while jet shipments in this period have experienced an overall minor decrease at an AAGR of 0.8 percent. Exhibit 1-8 shows the share of GA aircraft shipments by aircraft type.
Master Plan Update | 1-22 | Aviation Activity Forecast
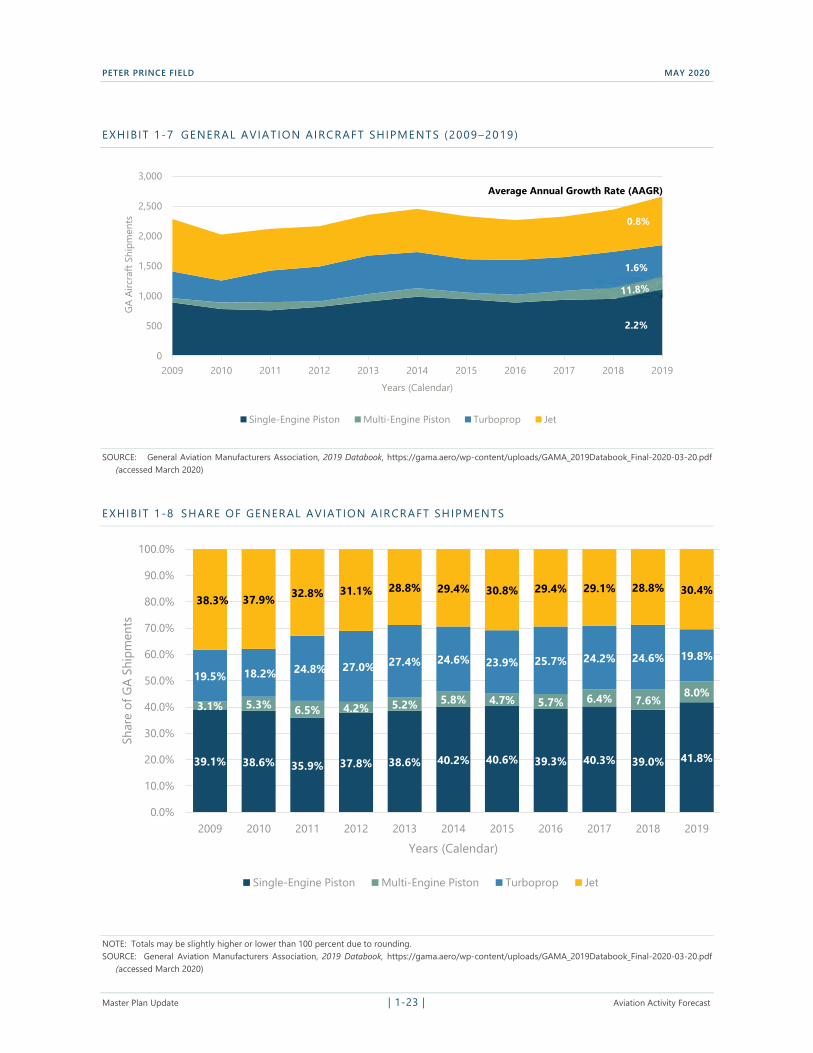
-
PETER PRINCE FIELD MAY 2020
EXHIBIT 1-7 GENERAL AVIATION AIRCRAFT SHIPMENTS (2009 –2019)
3,000
Average Annual Growth Rate (AAGR) 2,500
GA A
ircra
ft Sh
ipm
ents
0.8%
1.6%
2.2%
2009 2010 2011 2012 2013 2014 2015 2016 2017 2018 2019
2,000
1,500
1,000
500
0
Years (Calendar)
Single-Engine Piston Multi-Engine Piston Turboprop Jet
SOURCE: General Aviation Manufacturers Association, 2019 Databook, https://gama.aero/wp-content/uploads/GAMA_2019Databook_Final-2020-03-20.pdf (accessed March 2020)
EXHIB IT 1-8 SHARE OF GENERAL AVIATION AIRCRAFT SHIPMENTS
100.0%
90.0%
38.3%
19.5%
3.1%
39.1%
37.9%
18.2%
5.3%
38.6%
32.8%
24.8%
6.5%
35.9%
31.1%
27.0%
4.2%
37.8%
28.8%
27.4%
5.2%
38.6%
29.4%
24.6%
5.8%
40.2%
30.8%
23.9%
4.7%
40.6%
29.4%
25.7%
5.7%
39.3%
29.1%
24.2%
6.4%
40.3%
28.8%
24.6%
7.6%
39.0%
30.4%
19.8%
8.0%
41.8%
Shar
e of
GA
Ship
men
ts
80.0%
70.0%
60.0%
50.0%
40.0%
30.0%
20.0%
10.0%
0.0%
2009 2010 2011 2012 2013 2014 2015 2016 2017 2018 2019
Years (Calendar)
Single-Engine Piston Multi-Engine Piston Turboprop Jet
NOTE: Totals may be slightly higher or lower than 100 percent due to rounding. SOURCE: General Aviation Manufacturers Association, 2019 Databook, https://gama.aero/wp-content/uploads/GAMA_2019Databook_Final-2020-03-20.pdf
(accessed March 2020)
Master Plan Update | 1-23 | Aviation Activity Forecast
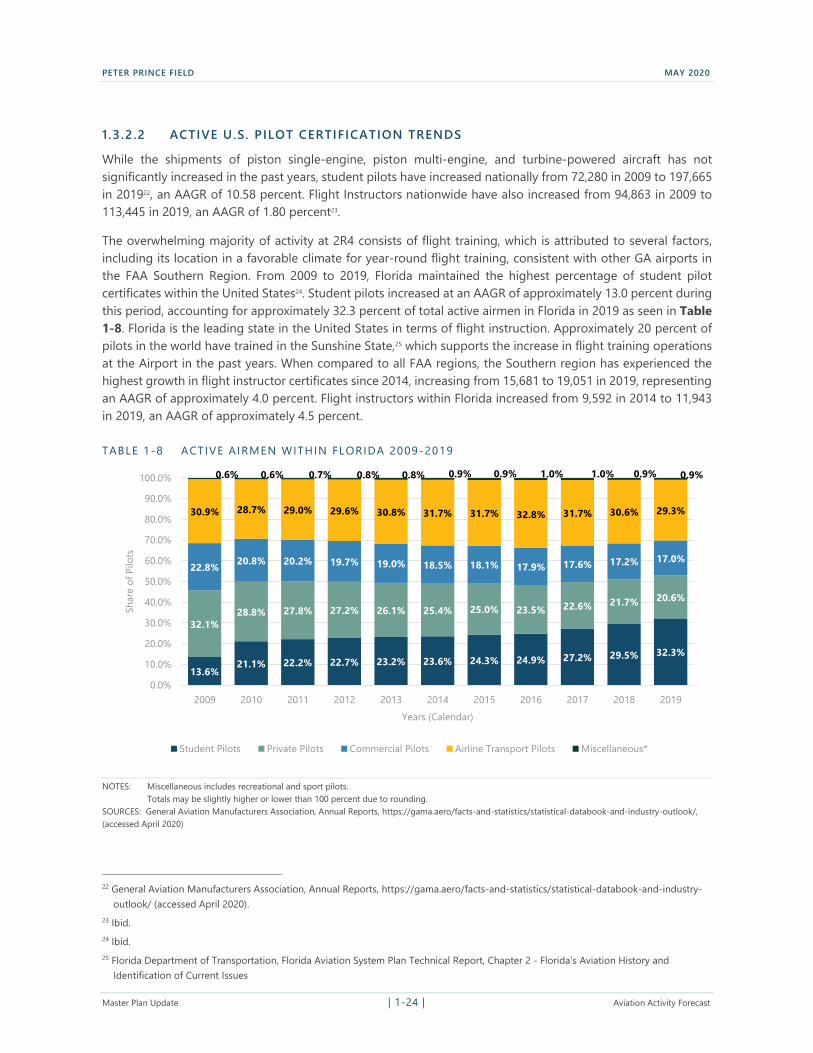
PETER PRINCE FIELD MAY 2020
1 .3 .2.2 ACTIVE U.S. PILOT CERTIFICATION TRENDS
While the shipments of piston single-engine, piston multi-engine, and turbine-powered aircraft has not significantly increased in the past years, student pilots have increased nationally from 72,280 in 2009 to 197,665
in 201922, an AAGR of 10.58 percent. Flight Instructors nationwide have also increased from 94,863 in 2009 to 113,445 in 2019, an AAGR of 1.80 percent23.
The overwhelming majority of activity at 2R4 consists of flight training, which is attributed to several factors, including its location in a favorable climate for year-round flight training, consistent with other GA airports in the FAA Southern Region. From 2009 to 2019, Florida maintained the highest percentage of student pilot certificates within the United States24. Student pilots increased at an AAGR of approximately 13.0 percent during this period, accounting for approximately 32.3 percent of total active airmen in Florida in 2019 as seen in Table 1-8. Florida is the leading state in the United States in terms of flight instruction. Approximately 20 percent of pilots in the world have trained in the Sunshine State,25 which supports the increase in flight training operations at the Airport in the past years. When compared to all FAA regions, the Southern region has experienced the highest growth in flight instructor certificates since 2014, increasing from 15,681 to 19,051 in 2019, representing
an AAGR of approximately 4.0 percent. Flight instructors within Florida increased from 9,592 in 2014 to 11,943
in 2019, an AAGR of approximately 4.5 percent.
TABLE 1-8 ACTIVE AIRMEN WITHIN FLORIDA 2009-2019
Shar
e of
Pilo
ts
100.0%
90.0%
80.0%
70.0%
60.0%
50.0%
40.0%
30.0%
20.0%
10.0%
0.0%
0.6% 0.6% 0.7% 0.8% 0.8% 0.9% 0.9% 1.0% 1.0% 0.9% 0.9%
13.6% 21.1% 22.2% 22.7% 23.2% 23.6% 24.3% 24.9% 27.2% 29.5% 32.3%
32.1% 28.8% 27.8% 27.2% 26.1% 25.4% 25.0% 23.5% 22.6% 21.7% 20.6%
22.8% 20.8% 20.2% 19.7% 19.0% 18.5% 18.1% 17.9% 17.6% 17.2% 17.0%
30.9% 28.7% 29.0% 29.6% 30.8% 31.7% 31.7% 32.8% 31.7% 30.6% 29.3%
2009 2010 2011 2012 2013 2014 2015 2016 2017 2018 2019
Years (Calendar)
Student Pilots Private Pilots Commercial Pilots Airline Transport Pilots Miscellaneous*
NOTES: Miscellaneous includes recreational and sport pilots. Totals may be slightly higher or lower than 100 percent due to rounding.
SOURCES: General Aviation Manufacturers Association, Annual Reports, https://gama.aero/facts-and-statistics/statistical-databook-and-industry-outlook/, (accessed April 2020)
22 General Aviation Manufacturers Association, Annual Reports, https://gama.aero/facts-and-statistics/statistical-databook-and-industry-outlook/ (accessed April 2020).
23 Ibid. 24 Ibid. 25 Florida Department of Transportation, Florida Aviation System Plan Technical Report, Chapter 2 - Florida’s Aviation History and
Identification of Current Issues
Master Plan Update | 1-24 | Aviation Activity Forecast
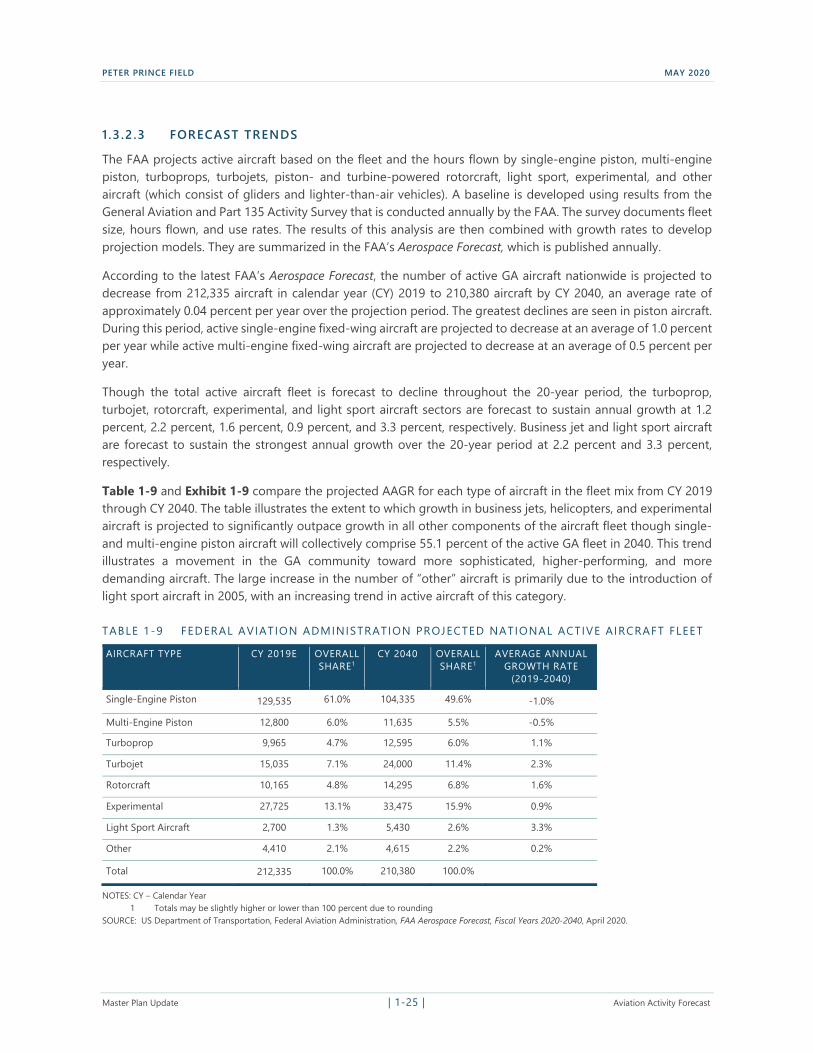
PETER PRINCE FIELD MAY 2020
1 .3 .2.3 FORECAST TRENDS
The FAA projects active aircraft based on the fleet and the hours flown by single-engine piston, multi-engine piston, turboprops, turbojets, piston- and turbine-powered rotorcraft, light sport, experimental, and other aircraft (which consist of gliders and lighter-than-air vehicles). A baseline is developed using results from the General Aviation and Part 135 Activity Survey that is conducted annually by the FAA. The survey documents fleet size, hours flown, and use rates. The results of this analysis are then combined with growth rates to develop projection models. They are summarized in the FAA’s Aerospace Forecast, which is published annually.
According to the latest FAA’s Aerospace Forecast, the number of active GA aircraft nationwide is projected to decrease from 212,335 aircraft in calendar year (CY) 2019 to 210,380 aircraft by CY 2040, an average rate of approximately 0.04 percent per year over the projection period. The greatest declines are seen in piston aircraft. During this period, active single-engine fixed-wing aircraft are projected to decrease at an average of 1.0 percent per year while active multi-engine fixed-wing aircraft are projected to decrease at an average of 0.5 percent per year.
Though the total active aircraft fleet is forecast to decline throughout the 20-year period, the turboprop, turbojet, rotorcraft, experimental, and light sport aircraft sectors are forecast to sustain annual growth at 1.2
percent, 2.2 percent, 1.6 percent, 0.9 percent, and 3.3 percent, respectively. Business jet and light sport aircraft are forecast to sustain the strongest annual growth over the 20-year period at 2.2 percent and 3.3 percent, respectively.
Table 1-9 and Exhibit 1-9 compare the projected AAGR for each type of aircraft in the fleet mix from CY 2019 through CY 2040. The table illustrates the extent to which growth in business jets, helicopters, and experimental aircraft is projected to significantly outpace growth in all other components of the aircraft fleet though single- and multi-engine piston aircraft will collectively comprise 55.1 percent of the active GA fleet in 2040. This trend illustrates a movement in the GA community toward more sophisticated, higher-performing, and more
demanding aircraft. The large increase in the number of “other” aircraft is primarily due to the introduction of light sport aircraft in 2005, with an increasing trend in active aircraft of this category.
TABLE 1-9 FEDERAL AVIATION ADMINISTRATION PROJECTED NATIONAL ACTIVE AIRCRAFT FLEET
AIRCRAFT TYPE CY 2019E OVERALL SHARE1
CY 2040 OVERALL SHARE1
AVERAGE ANNUAL GROWTH RATE
(2019-2040)
Single-Engine Piston 129,535 61.0% 104,335 49.6% -1.0%
Multi-Engine Piston 12,800 6.0% 11,635 5.5% -0.5%
Turboprop 9,965 4.7% 12,595 6.0% 1.1%
Turbojet 15,035 7.1% 24,000 11.4% 2.3%
Rotorcraft 10,165 4.8% 14,295 6.8% 1.6%
Experimental 27,725 13.1% 33,475 15.9% 0.9%
Light Sport Aircraft 2,700 1.3% 5,430 2.6% 3.3%
Other 4,410 2.1% 4,615 2.2% 0.2%
Total 212,335 100.0% 210,380 100.0%
NOTES: CY – Calendar Year Totals may be slightly higher or lower than 100 percent due to rounding
SOURCE: US Department of Transportation, Federal Aviation Administration, FAA Aerospace Forecast, Fiscal Years 2020-2040, April 2020.
Master Plan Update | 1-25 | Aviation Activity Forecast
1
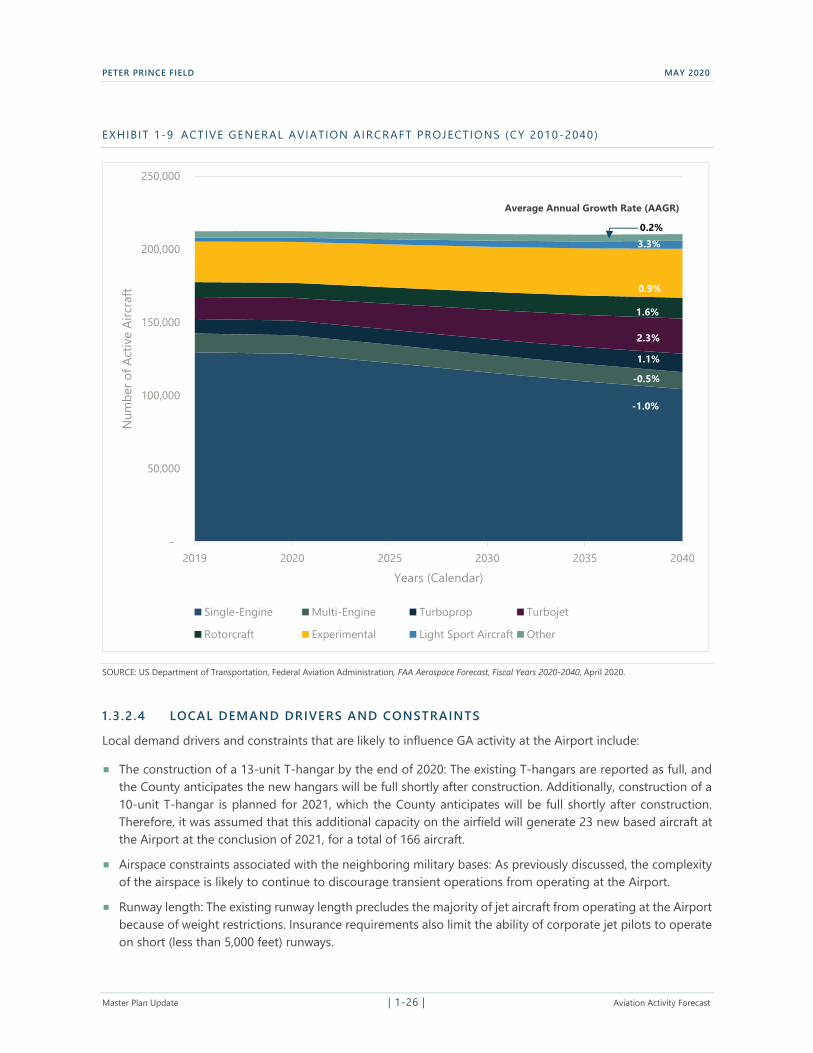
PETER PRINCE FIELD MAY 2020
EXHIBIT 1-9 ACTIVE GENERAL AVIATION AIRCRAFT PROJECTIONS (CY 2010 -2040)
-
50,000
100,000
150,000
200,000
250,000
2019 2020 2025 2030 2035 2040
Num
ber o
f Act
ive
Airc
raft
Years (Calendar)
Single-Engine Multi-Engine Turboprop Turbojet
Rotorcraft Experimental Light Sport Aircraft Other
-1.0%
-0.5%
1.1%
2.3%
1.6%
0.9%
3.3%
0.2%
Average Annual Growth Rate (AAGR)
SOURCE: US Department of Transportation, Federal Aviation Administration, FAA Aerospace Forecast, Fiscal Years 2020-2040, April 2020.
1 .3 .2.4 LOCAL DEMAND DRIVERS AND CONSTRAINTS
Local demand drivers and constraints that are likely to influence GA activity at the Airport include:
The construction of a 13-unit T-hangar by the end of 2020: The existing T-hangars are reported as full, and the County anticipates the new hangars will be full shortly after construction. Additionally, construction of a 10-unit T-hangar is planned for 2021, which the County anticipates will be full shortly after construction. Therefore, it was assumed that this additional capacity on the airfield will generate 23 new based aircraft at the Airport at the conclusion of 2021, for a total of 166 aircraft.
Airspace constraints associated with the neighboring military bases: As previously discussed, the complexity of the airspace is likely to continue to discourage transient operations from operating at the Airport.
Runway length: The existing runway length precludes the majority of jet aircraft from operating at the Airport because of weight restrictions. Insurance requirements also limit the ability of corporate jet pilots to operate on short (less than 5,000 feet) runways.
Master Plan Update | 1-26 | Aviation Activity Forecast
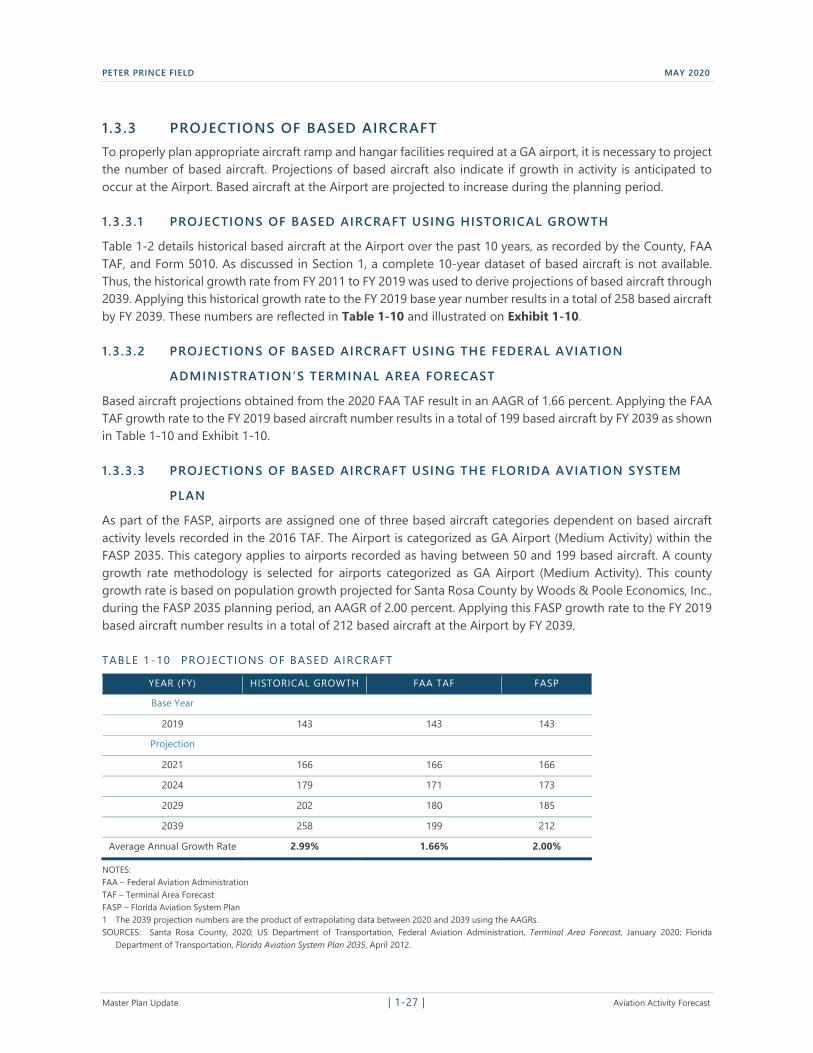
PETER PRINCE FIELD MAY 2020
1.3.3 PROJECTIONS OF BASED AIRCRAFT
To properly plan appropriate aircraft ramp and hangar facilities required at a GA airport, it is necessary to project the number of based aircraft. Projections of based aircraft also indicate if growth in activity is anticipated to occur at the Airport. Based aircraft at the Airport are projected to increase during the planning period.
1 .3 .3.1 PROJECTIONS OF BASED AIRCRAFT USING HISTORICAL GROWTH
Table 1-2 details historical based aircraft at the Airport over the past 10 years, as recorded by the County, FAA
TAF, and Form 5010. As discussed in Section 1, a complete 10-year dataset of based aircraft is not available. Thus, the historical growth rate from FY 2011 to FY 2019 was used to derive projections of based aircraft through 2039. Applying this historical growth rate to the FY 2019 base year number results in a total of 258 based aircraft by FY 2039. These numbers are reflected in Table 1-10 and illustrated on Exhibit 1-10.
1 .3 .3.2 PROJECTIONS OF BASED AIRCRAFT USING THE FEDERAL AVIATION
ADMINISTRATION’S TERMINAL AREA FORECAST
Based aircraft projections obtained from the 2020 FAA TAF result in an AAGR of 1.66 percent. Applying the FAA TAF growth rate to the FY 2019 based aircraft number results in a total of 199 based aircraft by FY 2039 as shown in Table 1-10 and Exhibit 1-10.
1 .3 .3.3 PROJECTIONS OF BASED AIRCRAFT USING THE FLORIDA AVIATION SYSTEM
PLAN
As part of the FASP, airports are assigned one of three based aircraft categories dependent on based aircraft activity levels recorded in the 2016 TAF. The Airport is categorized as GA Airport (Medium Activity) within the FASP 2035. This category applies to airports recorded as having between 50 and 199 based aircraft. A county growth rate methodology is selected for airports categorized as GA Airport (Medium Activity). This county
growth rate is based on population growth projected for Santa Rosa County by Woods & Poole Economics, Inc., during the FASP 2035 planning period, an AAGR of 2.00 percent. Applying this FASP growth rate to the FY 2019
based aircraft number results in a total of 212 based aircraft at the Airport by FY 2039.
TABLE 1-10 PROJECTIONS OF BASED AIRCRAFT
YEAR (FY) HISTORICAL GROWTH FAA TAF FASP
Base Year
2019 143 143 143
Projection
2021 166 166 166
2024 179 171 173
2029 202 180 185
2039 258 199 212
Average Annual Growth Rate 2.99% 1.66% 2.00%
NOTES: FAA – Federal Aviation Administration
TAF – Terminal Area Forecast FASP – Florida Aviation System Plan
1 The 2039 projection numbers are the product of extrapolating data between 2020 and 2039 using the AAGRs. SOURCES: Santa Rosa County, 2020; US Department of Transportation, Federal Aviation Administration, Terminal Area Forecast, January 2020; Florida
Department of Transportation, Florida Aviation System Plan 2035, April 2012.
Master Plan Update | 1-27 | Aviation Activity Forecast
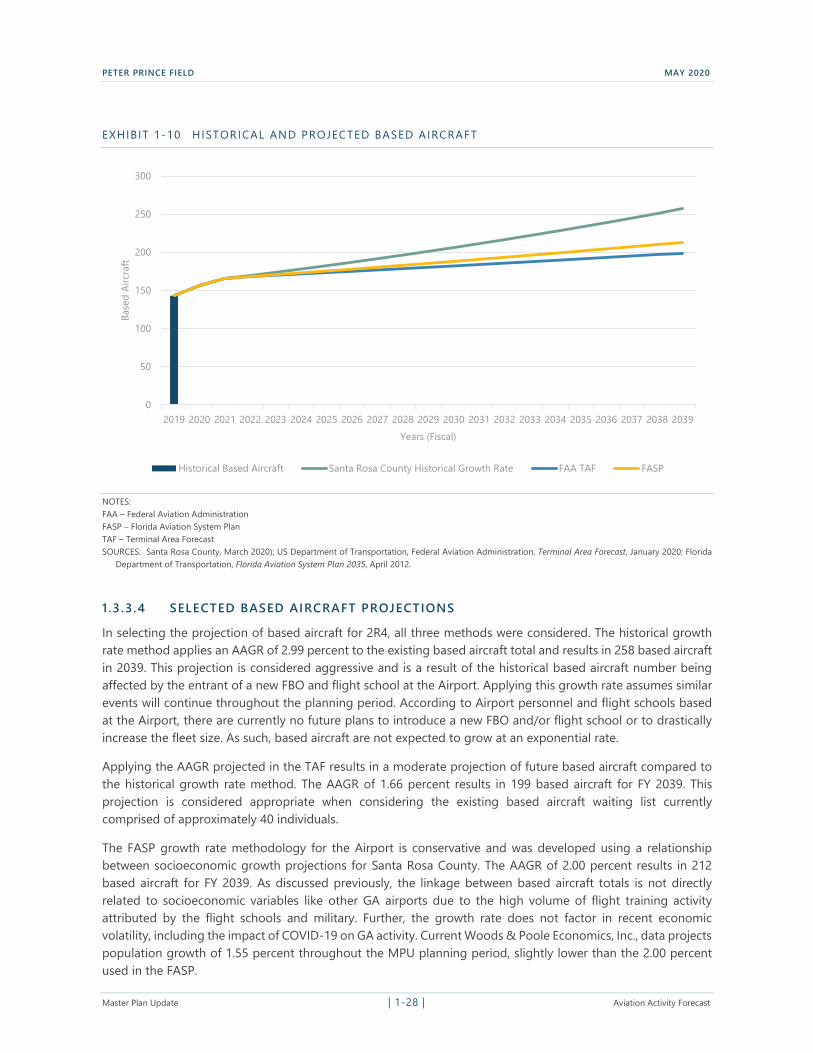
PETER PRINCE FIELD MAY 2020
EXHIBIT 1-10 HISTORICAL AND PROJECTED BASED AIRCRAFT
300
250
200
150
100
50
0
Years (Fiscal)
Historical Based Aircraft Santa Rosa County Historical Growth Rate FAA TAF FASP
Base
d Ai
rcra
ft
2019 2020 2021 2022 2023 2024 2025 2026 2027 2028 2029 2030 2031 2032 2033 2034 2035 2036 2037 2038 2039
NOTES: FAA – Federal Aviation Administration
FASP – Florida Aviation System Plan
TAF – Terminal Area Forecast SOURCES: Santa Rosa County, March 2020); US Department of Transportation, Federal Aviation Administration, Terminal Area Forecast, January 2020; Florida
Department of Transportation, Florida Aviation System Plan 2035, April 2012.
1 .3 .3.4 SELECTED BASED AIRCRAFT PROJECTIONS
In selecting the projection of based aircraft for 2R4, all three methods were considered. The historical growth rate method applies an AAGR of 2.99 percent to the existing based aircraft total and results in 258 based aircraft in 2039. This projection is considered aggressive and is a result of the historical based aircraft number being affected by the entrant of a new FBO and flight school at the Airport. Applying this growth rate assumes similar events will continue throughout the planning period. According to Airport personnel and flight schools based at the Airport, there are currently no future plans to introduce a new FBO and/or flight school or to drastically increase the fleet size. As such, based aircraft are not expected to grow at an exponential rate.
Applying the AAGR projected in the TAF results in a moderate projection of future based aircraft compared to
the historical growth rate method. The AAGR of 1.66 percent results in 199 based aircraft for FY 2039. This projection is considered appropriate when considering the existing based aircraft waiting list currently comprised of approximately 40 individuals.
The FASP growth rate methodology for the Airport is conservative and was developed using a relationship between socioeconomic growth projections for Santa Rosa County. The AAGR of 2.00 percent results in 212 based aircraft for FY 2039. As discussed previously, the linkage between based aircraft totals is not directly related to socioeconomic variables like other GA airports due to the high volume of flight training activity attributed by the flight schools and military. Further, the growth rate does not factor in recent economic volatility, including the impact of COVID-19 on GA activity. Current Woods & Poole Economics, Inc., data projects
population growth of 1.55 percent throughout the MPU planning period, slightly lower than the 2.00 percent used in the FASP.
Master Plan Update | 1-28 | Aviation Activity Forecast
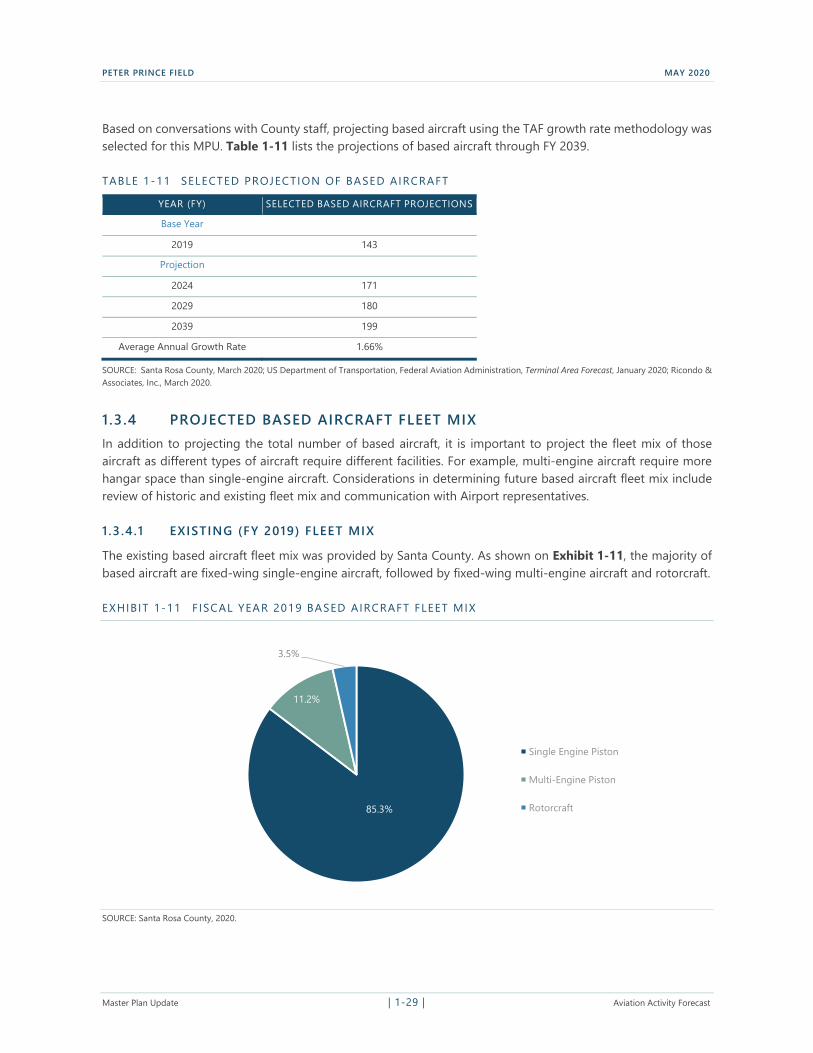
PETER PRINCE FIELD MAY 2020
Based on conversations with County staff, projecting based aircraft using the TAF growth rate methodology was selected for this MPU. Table 1-11 lists the projections of based aircraft through FY 2039.
TABLE 1-11 SELECTED PROJECTION OF BASED AIRCRAFT
YEAR (FY) SELECTED BASED AIRCRAFT PROJECTIONS
Base Year
2019 143
Projection
2024 171
2029 180
2039 199
Average Annual Growth Rate 1.66%
SOURCE: Santa Rosa County, March 2020; US Department of Transportation, Federal Aviation Administration, Terminal Area Forecast, January 2020; Ricondo &
Associates, Inc., March 2020.
1.3.4 PROJECTED BASED AIRCRAFT FLEET MIX In addition to projecting the total number of based aircraft, it is important to project the fleet mix of those aircraft as different types of aircraft require different facilities. For example, multi-engine aircraft require more hangar space than single-engine aircraft. Considerations in determining future based aircraft fleet mix include review of historic and existing fleet mix and communication with Airport representatives.
1 .3 .4.1 EXISTING (FY 2019) FLEET MIX
The existing based aircraft fleet mix was provided by Santa County. As shown on Exhibit 1-11, the majority of based aircraft are fixed-wing single-engine aircraft, followed by fixed-wing multi-engine aircraft and rotorcraft.
EXHIBIT 1-11 FISCAL YEAR 2019 BASED AIRCRAFT FLEET MIX
85.3%
11.2%
3.5%
Single Engine Piston
Multi-Engine Piston
Rotorcraft
SOURCE: Santa Rosa County, 2020.
Master Plan Update | 1-29 | Aviation Activity Forecast
PETER PRINCE FIELD MAY 2020
1 .3 .4.2 PROJECTED FLEET MIX
Exhibit 1-12 presents a comparison of aircraft categories historically based at the Airport. As shown, the majority of aircraft historically based at the Airport are single-engine piston aircraft. However, since 2011, there has been
a slight decrease in single-engine piston aircraft share. In 2011, single-engine piston aircraft represented approximately 90 percent of the based aircraft fleet mix. As illustrated on Exhibit 1-12, the share of single-engine piston aircraft only accounted for approximately 85 percent of the overall fleet in 2018 and 2019, a 5 percent decrease. Based on conversation with the FBOs, the absence of turboprop and jet aircraft at the Airport is mainly attributed to the existing runway length, which is too short to accommodate the weight and runway length requirements associated with most of these aircraft.
EXHIBIT 1-12 AIRCRAFT FLEET MIX COMPARISON
Base
d Ai
rcra
ft
160
3.50% 140
120
100
80
60
40
20
0
90.27% 85.25% 85.31%
7.96% 11.48%
11.19% 1.77% 3.28%
2011 2018 2019
Years (Fiscal)
Single-Engine Piston Aircraft Multi-Engine Piston Aircraft Rotorcraft
NOTE: Totals may be slightly higher or lower than 100 percent due to rounding SOURCES: Santa Rosa County, 2011; Santa Rosa County, 2018; Santa Rosa County, 2020.
The future mix of based aircraft reflected in Table 1-12 is representative of historical fleet mix trends and insights provided by the County and the FBOs located at the Airport. Though the future mix of based aircraft at 2R4 primarily remains single- and multi-engine piston aircraft, consistent with existing conditions, the share of rotorcraft is anticipated to increase from 3.5 percent to 5.5 percent. This increase reflects historical trends in based rotorcraft between 2011 and 2019 and anticipated growth in rotorcraft operations at the Airport (discussed in the subsequent section).
Master Plan Update | 1-30 | Aviation Activity Forecast
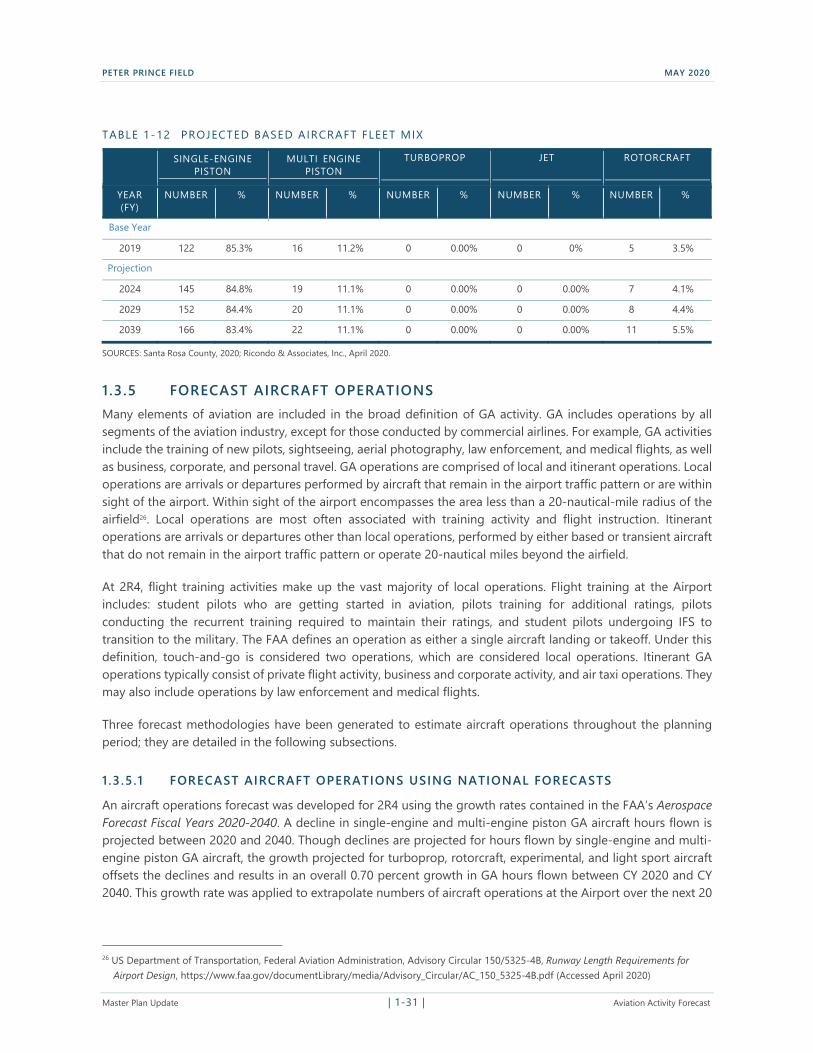
-
PETER PRINCE FIELD MAY 2020
TABLE 1-12 PROJECTED BASED AIRCRAFT FLEET MIX
SINGLE-ENGINE PISTON
MULTI ENGINE PISTON
TURBOPROP JET ROTORCRAFT
YEAR (FY)
NUMBER % NUMBER % NUMBER % NUMBER % NUMBER %
Base Year
2019 122 85.3% 16 11.2% 0 0.00% 0 0% 5 3.5%
Projection
2024 145 84.8% 19 11.1% 0 0.00% 0 0.00% 7 4.1%
2029 152 84.4% 20 11.1% 0 0.00% 0 0.00% 8 4.4%
2039 166 83.4% 22 11.1% 0 0.00% 0 0.00% 11 5.5%
SOURCES: Santa Rosa County, 2020; Ricondo & Associates, Inc., April 2020.
1.3.5 FORECAST AIRCRAFT OPERATIONS
Many elements of aviation are included in the broad definition of GA activity. GA includes operations by all segments of the aviation industry, except for those conducted by commercial airlines. For example, GA activities
include the training of new pilots, sightseeing, aerial photography, law enforcement, and medical flights, as well as business, corporate, and personal travel. GA operations are comprised of local and itinerant operations. Local operations are arrivals or departures performed by aircraft that remain in the airport traffic pattern or are within
sight of the airport. Within sight of the airport encompasses the area less than a 20-nautical-mile radius of the airfield26. Local operations are most often associated with training activity and flight instruction. Itinerant operations are arrivals or departures other than local operations, performed by either based or transient aircraft that do not remain in the airport traffic pattern or operate 20-nautical miles beyond the airfield.
At 2R4, flight training activities make up the vast majority of local operations. Flight training at the Airport includes: student pilots who are getting started in aviation, pilots training for additional ratings, pilots conducting the recurrent training required to maintain their ratings, and student pilots undergoing IFS to
transition to the military. The FAA defines an operation as either a single aircraft landing or takeoff. Under this definition, touch-and-go is considered two operations, which are considered local operations. Itinerant GA operations typically consist of private flight activity, business and corporate activity, and air taxi operations. They may also include operations by law enforcement and medical flights.
Three forecast methodologies have been generated to estimate aircraft operations throughout the planning period; they are detailed in the following subsections.
1 .3 .5.1 FORECAST AIRCRAFT OPERATIONS USING NATIONAL FORECASTS
An aircraft operations forecast was developed for 2R4 using the growth rates contained in the FAA’s Aerospace
Forecast Fiscal Years 2020-2040. A decline in single-engine and multi-engine piston GA aircraft hours flown is projected between 2020 and 2040. Though declines are projected for hours flown by single-engine and multi-engine piston GA aircraft, the growth projected for turboprop, rotorcraft, experimental, and light sport aircraft offsets the declines and results in an overall 0.70 percent growth in GA hours flown between CY 2020 and CY 2040. This growth rate was applied to extrapolate numbers of aircraft operations at the Airport over the next 20
26 US Department of Transportation, Federal Aviation Administration, Advisory Circular 150/5325-4B, Runway Length Requirements for Airport Design, https://www.faa.gov/documentLibrary/media/Advisory_Circular/AC_150_5325-4B.pdf (Accessed April 2020)
Master Plan Update | 1-31 | Aviation Activity Forecast
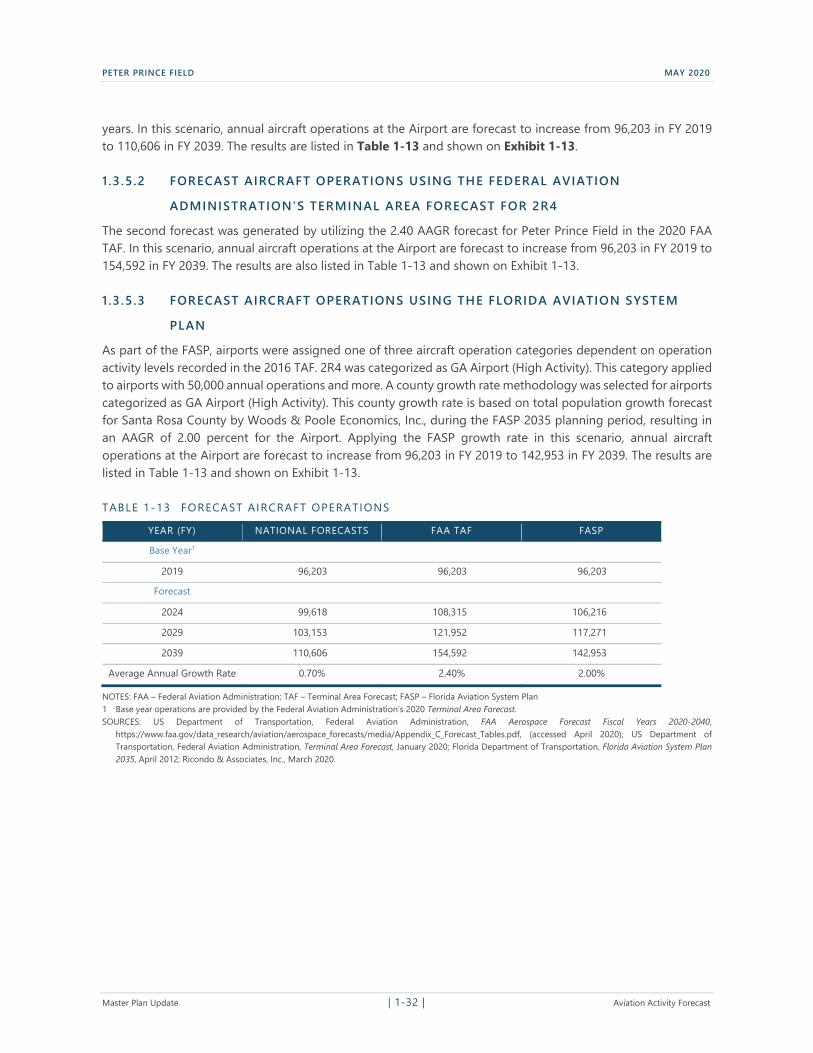
PETER PRINCE FIELD MAY 2020
years. In this scenario, annual aircraft operations at the Airport are forecast to increase from 96,203 in FY 2019 to 110,606 in FY 2039. The results are listed in Table 1-13 and shown on Exhibit 1-13.
1 .3 .5.2 FORECAST AIRCRAFT OPERATIONS USING THE FEDERAL AVIATION
ADMINISTRATION’S TERMINAL AREA FORECAST FOR 2R4
The second forecast was generated by utilizing the 2.40 AAGR forecast for Peter Prince Field in the 2020 FAA TAF. In this scenario, annual aircraft operations at the Airport are forecast to increase from 96,203 in FY 2019 to
154,592 in FY 2039. The results are also listed in Table 1-13 and shown on Exhibit 1-13.
1 .3 .5.3 FORECAST AIRCRAFT OPERATIONS USING THE FLORIDA AVIATION SYSTEM
PLAN
As part of the FASP, airports were assigned one of three aircraft operation categories dependent on operation activity levels recorded in the 2016 TAF. 2R4 was categorized as GA Airport (High Activity). This category applied to airports with 50,000 annual operations and more. A county growth rate methodology was selected for airports categorized as GA Airport (High Activity). This county growth rate is based on total population growth forecast for Santa Rosa County by Woods & Poole Economics, Inc., during the FASP 2035 planning period, resulting in an AAGR of 2.00 percent for the Airport. Applying the FASP growth rate in this scenario, annual aircraft operations at the Airport are forecast to increase from 96,203 in FY 2019 to 142,953 in FY 2039. The results are listed in Table 1-13 and shown on Exhibit 1-13.
TABLE 1-13 FORECAST AIRCRAFT OPERATIONS
YEAR (FY) NATIONAL FORECASTS FAA TAF FASP
Base Year1
2019 96,203 96,203 96,203
Forecast
2024 99,618 108,315 106,216
2029 103,153 121,952 117,271
2039 110,606 154,592 142,953
Average Annual Growth Rate 0.70% 2.40% 2.00%
NOTES: FAA – Federal Aviation Administration; TAF – Terminal Area Forecast; FASP – Florida Aviation System Plan
1 Base year operations are provided by the Federal Aviation Administration’s 2020 Terminal Area Forecast. SOURCES: US Department of Transportation, Federal Aviation Administration, FAA Aerospace Forecast Fiscal Years 2020-2040,
https://www.faa.gov/data_research/aviation/aerospace_forecasts/media/Appendix_C_Forecast_Tables.pdf, (accessed April 2020); US Department of Transportation, Federal Aviation Administration, Terminal Area Forecast, January 2020; Florida Department of Transportation, Florida Aviation System Plan
2035, April 2012; Ricondo & Associates, Inc., March 2020.
Master Plan Update | 1-32 | Aviation Activity Forecast
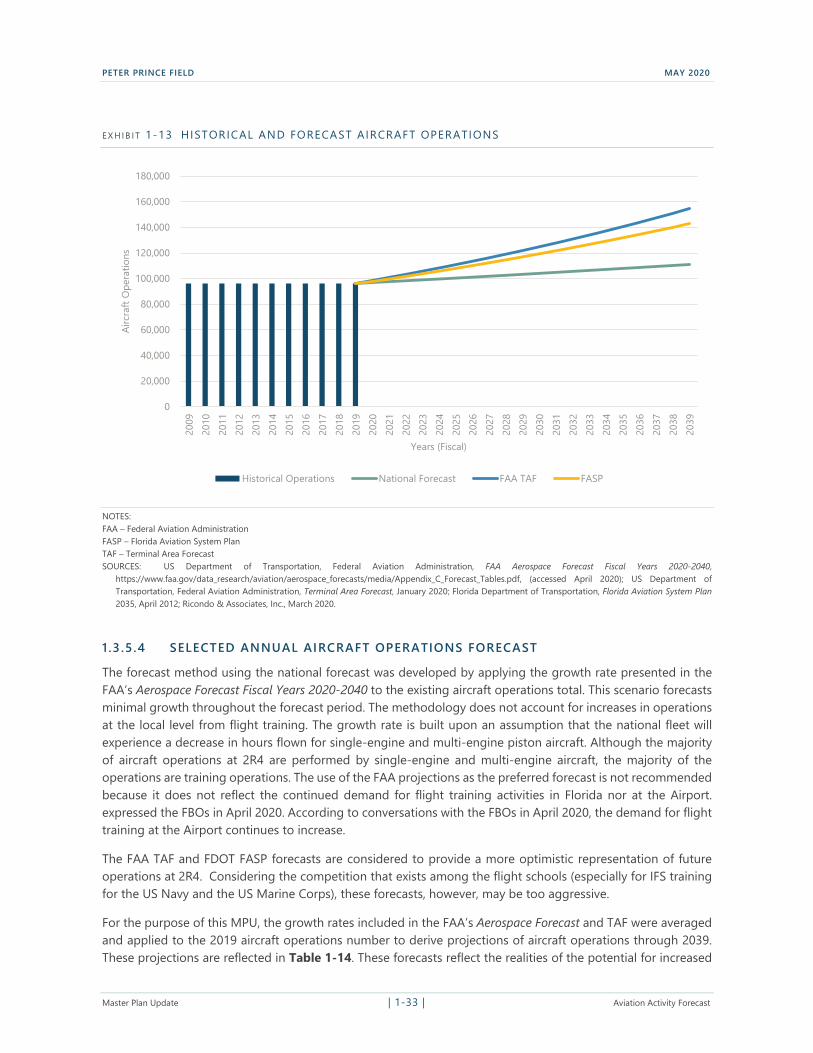
2010
2015
2020
2025
2030
2035
PETER PRINCE FIELD MAY 2020
E X H I B IT 1-13 HISTORICAL AND FORECAST AIRCRAFT OPERATIONS
180,000
160,000
0
20,000
40,000
60,000
80,000
100,000
120,000
140,000
Airc
raft
Ope
ratio
ns
2009
2011
2012
2013
2014
2016
2017
2018
2019
2021
2022
2023
2024
2026
2027
2028
2029
2031
2032
2033
2034
2036
2037
2038
2039
Years (Fiscal)
Historical Operations National Forecast FAA TAF FASP
NOTES: FAA – Federal Aviation Administration
FASP – Florida Aviation System Plan
TAF – Terminal Area Forecast SOURCES: US Department of Transportation, Federal Aviation Administration, FAA Aerospace Forecast Fiscal Years 2020-2040,
https://www.faa.gov/data_research/aviation/aerospace_forecasts/media/Appendix_C_Forecast_Tables.pdf, (accessed April 2020); US Department of Transportation, Federal Aviation Administration, Terminal Area Forecast, January 2020; Florida Department of Transportation, Florida Aviation System Plan
2035, April 2012; Ricondo & Associates, Inc., March 2020.
1 .3 .5.4 SELECTED ANNUAL AIRCRAFT OPERATIONS FORECAST
The forecast method using the national forecast was developed by applying the growth rate presented in the
FAA’s Aerospace Forecast Fiscal Years 2020-2040 to the existing aircraft operations total. This scenario forecasts minimal growth throughout the forecast period. The methodology does not account for increases in operations at the local level from flight training. The growth rate is built upon an assumption that the national fleet will experience a decrease in hours flown for single-engine and multi-engine piston aircraft. Although the majority
of aircraft operations at 2R4 are performed by single-engine and multi-engine aircraft, the majority of the operations are training operations. The use of the FAA projections as the preferred forecast is not recommended
because it does not reflect the continued demand for flight training activities in Florida nor at the Airport. expressed the FBOs in April 2020. According to conversations with the FBOs in April 2020, the demand for flight training at the Airport continues to increase.
The FAA TAF and FDOT FASP forecasts are considered to provide a more optimistic representation of future operations at 2R4. Considering the competition that exists among the flight schools (especially for IFS training for the US Navy and the US Marine Corps), these forecasts, however, may be too aggressive.
For the purpose of this MPU, the growth rates included in the FAA’s Aerospace Forecast and TAF were averaged and applied to the 2019 aircraft operations number to derive projections of aircraft operations through 2039. These projections are reflected in Table 1-14. These forecasts reflect the realities of the potential for increased
Master Plan Update | 1-33 | Aviation Activity Forecast

PETER PRINCE FIELD MAY 2020
operations due to an increase in based aircraft associated with the construction of T-hangars while recognizing that competition among flight schools within the region will continue to impact activity levels at the Airport.
TABLE 1-14 SELECTED FORECAST OF AIRCRAFT OPERATIONS
YEARS (FY) AIRCRAFT OPERATIONS
Base Year1
2019 96,203
Forecast
2024 103,893
2029 112,119
2039 130,854
Average Annual 1.55% Growth Rate
NOTE: 1 Base year operations are provided by the Federal Aviation Administration’s 2020 Terminal Area Forecast. SOURCES: US Department of Transportation, Federal Aviation Administration, Terminal Area Forecast, January 2020; Ricondo & Associates, Inc., April 2020.
1.3.6 TYPES OF AIRCRAFT OPERATIONS
1.3 .6.1 LOCAL VERSUS ITINERANT SPLIT
As previously discussed, local operations are those operations performed by aircraft that:
remain in the local traffic pattern
execute simulated instrument approaches or low passes at an airport
operate to or from an airport and a designated practice area within a 20-mile radius
Itinerant operations are aircraft operations other than local operations (i.e., operations performed by aircraft that land at an airport from outside the airport area or depart the airport and leave the airport area).
Over the last 10 years, the shares of local and itinerant operations at the Airport remained constant according to the FAA TAF. From FY 2009 through FY 2019, 92 percent of the operations at the Airport were local operations
and 8 percent were itinerant operations (see Exhibit 1-14). A noise analysis completed for the Airport in 2018 revealed operations remained consistent at 92 percent local and 8 percent itinerant in FY 2018.
Master Plan Update | 1-34 | Aviation Activity Forecast
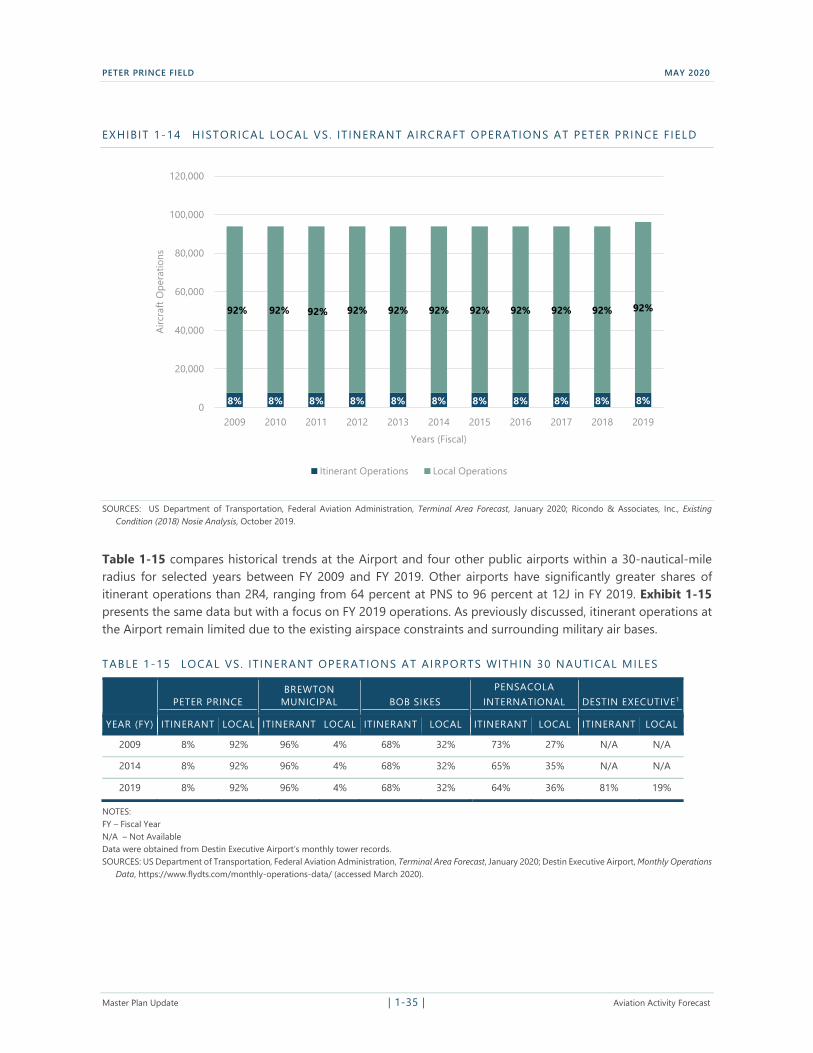
PETER PRINCE FIELD MAY 2020
EXHIBIT 1-14 HISTORICAL LOCAL VS. IT INERANT AIRCRAFT OPERATIONS AT PETER PRINCE FIELD
120,000
100,000
Airc
raft
Ope
ratio
ns 80,000
60,000
40,000
20,000
0
2009 2010 2011 2012 2013 2014 2015 2016 2017 2018 2019
Years (Fiscal)
8% 8% 8% 8% 8% 8% 8% 8% 8% 8% 8%
92% 92% 92% 92% 92% 92% 92% 92% 92% 92% 92%
Itinerant Operations Local Operations
SOURCES: US Department of Transportation, Federal Aviation Administration, Terminal Area Forecast, January 2020; Ricondo & Associates, Inc., Existing
Condition (2018) Nosie Analysis, October 2019.
Table 1-15 compares historical trends at the Airport and four other public airports within a 30-nautical-mile radius for selected years between FY 2009 and FY 2019. Other airports have significantly greater shares of itinerant operations than 2R4, ranging from 64 percent at PNS to 96 percent at 12J in FY 2019. Exhibit 1-15 presents the same data but with a focus on FY 2019 operations. As previously discussed, itinerant operations at the Airport remain limited due to the existing airspace constraints and surrounding military air bases.
TABLE 1-15 LOCAL VS. IT INERANT OPERATIONS AT AIRPORTS WITHIN 30 NAUTICAL MILES
PETER PRINCE BREWTON
MUNICIPAL BOB SIKES
PENSACOLA INTERNATIONAL DESTIN EXECUTIVE1
YEAR (FY) ITINERANT LOCAL ITINERANT LOCAL ITINERANT LOCAL ITINERANT LOCAL ITINERANT LOCAL
2009 8% 92% 96% 4% 68% 32% 73% 27% N/A N/A
2014 8% 92% 96% 4% 68% 32% 65% 35% N/A N/A
2019 8% 92% 96% 4% 68% 32% 64% 36% 81% 19%
NOTES: FY – Fiscal Year N/A – Not Available
Data were obtained from Destin Executive Airport’s monthly tower records. SOURCES: US Department of Transportation, Federal Aviation Administration, Terminal Area Forecast, January 2020; Destin Executive Airport, Monthly Operations
Data, https://www.flydts.com/monthly-operations-data/ (accessed March 2020).
Master Plan Update | 1-35 | Aviation Activity Forecast
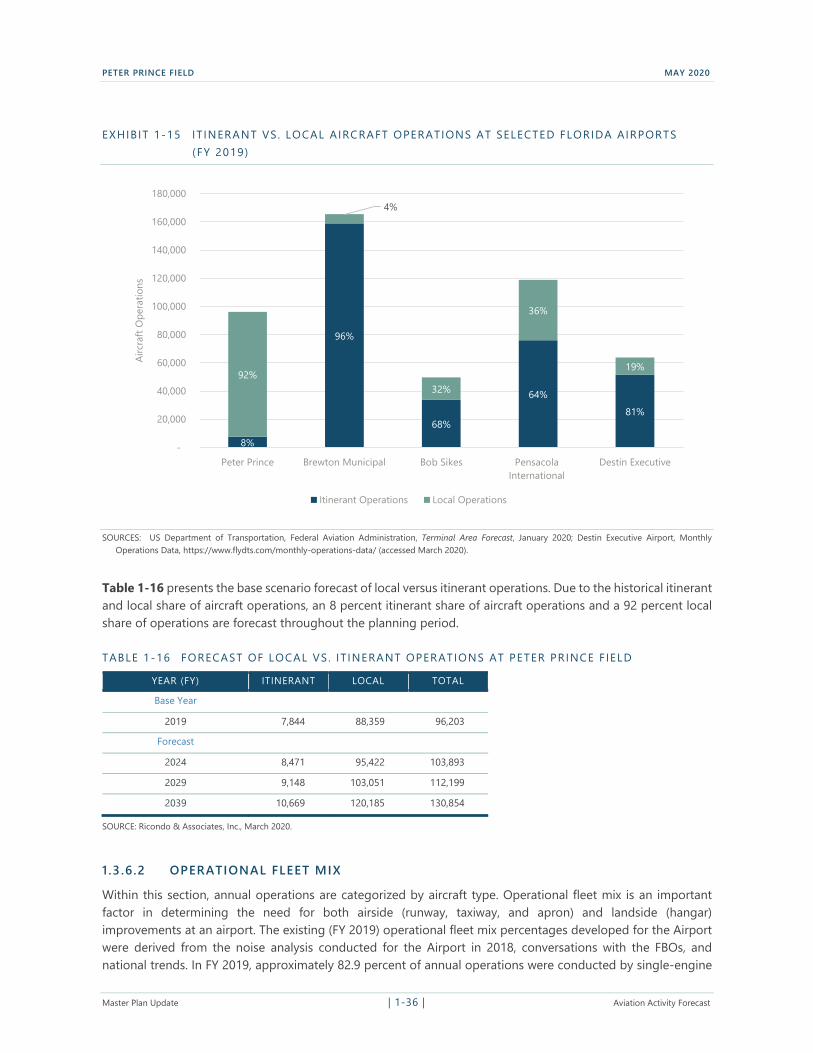
PETER PRINCE FIELD MAY 2020
EXHIBIT 1-15 IT INERANT VS. LOCAL AIRCRAFT OPERATIONS AT SELECTED FLORIDA AIRPORTS
(FY 2019)
8%
96%
68%
64%
81%
92%
4%
32%
36%
19%
-
20,000
40,000
60,000
80,000
100,000
120,000
140,000
160,000
180,000
Airc
raft
Ope
ratio
ns
Peter Prince Brewton Municipal Bob Sikes Pensacola Destin Executive International
Itinerant Operations Local Operations
SOURCES: US Department of Transportation, Federal Aviation Administration, Terminal Area Forecast, January 2020; Destin Executive Airport, Monthly
Operations Data, https://www.flydts.com/monthly-operations-data/ (accessed March 2020).
Table 1-16 presents the base scenario forecast of local versus itinerant operations. Due to the historical itinerant and local share of aircraft operations, an 8 percent itinerant share of aircraft operations and a 92 percent local share of operations are forecast throughout the planning period.
TABLE 1-16 FORECAST OF LOCAL VS. IT INERANT OPERATIONS AT PETER PRINCE F IELD
YEAR (FY)
ITINERANT LOCAL TOTAL
Base Year
2019 7,844 88,359 96,203
Forecast
2024 8,471 95,422 103,893
2029 9,148 103,051 112,199
2039 10,669 120,185 130,854
SOURCE: Ricondo & Associates, Inc., March 2020.
1 .3 .6.2 OPERATIONAL FLEET MIX
Within this section, annual operations are categorized by aircraft type. Operational fleet mix is an important factor in determining the need for both airside (runway, taxiway, and apron) and landside (hangar) improvements at an airport. The existing (FY 2019) operational fleet mix percentages developed for the Airport were derived from the noise analysis conducted for the Airport in 2018, conversations with the FBOs, and
national trends. In FY 2019, approximately 82.9 percent of annual operations were conducted by single-engine
Master Plan Update | 1-36 | Aviation Activity Forecast
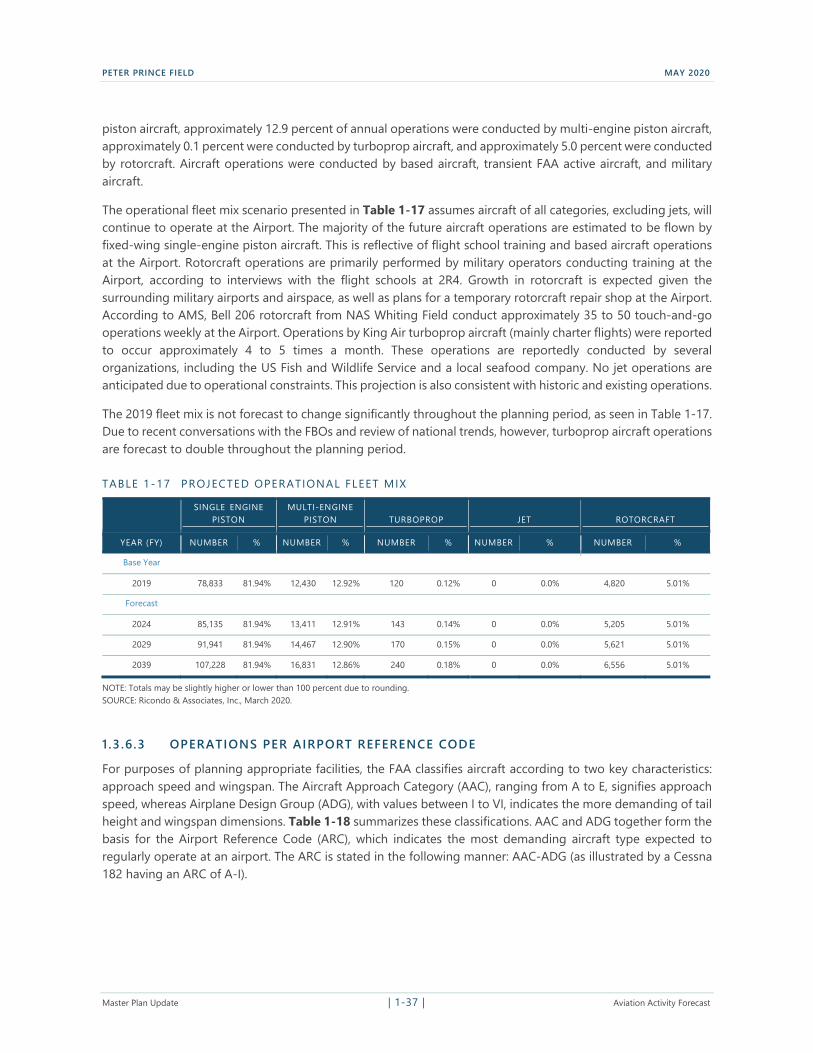
-
PETER PRINCE FIELD MAY 2020
piston aircraft, approximately 12.9 percent of annual operations were conducted by multi-engine piston aircraft, approximately 0.1 percent were conducted by turboprop aircraft, and approximately 5.0 percent were conducted by rotorcraft. Aircraft operations were conducted by based aircraft, transient FAA active aircraft, and military
aircraft.
The operational fleet mix scenario presented in Table 1-17 assumes aircraft of all categories, excluding jets, will continue to operate at the Airport. The majority of the future aircraft operations are estimated to be flown by
fixed-wing single-engine piston aircraft. This is reflective of flight school training and based aircraft operations
at the Airport. Rotorcraft operations are primarily performed by military operators conducting training at the Airport, according to interviews with the flight schools at 2R4. Growth in rotorcraft is expected given the surrounding military airports and airspace, as well as plans for a temporary rotorcraft repair shop at the Airport. According to AMS, Bell 206 rotorcraft from NAS Whiting Field conduct approximately 35 to 50 touch-and-go operations weekly at the Airport. Operations by King Air turboprop aircraft (mainly charter flights) were reported to occur approximately 4 to 5 times a month. These operations are reportedly conducted by several organizations, including the US Fish and Wildlife Service and a local seafood company. No jet operations are anticipated due to operational constraints. This projection is also consistent with historic and existing operations.
The 2019 fleet mix is not forecast to change significantly throughout the planning period, as seen in Table 1-17. Due to recent conversations with the FBOs and review of national trends, however, turboprop aircraft operations
are forecast to double throughout the planning period.
TABLE 1-17 PROJECTED OPERATIONAL FLEET MIX
SINGLE ENGINE
PISTON MULTI-ENGINE
PISTON TURBOPROP JET ROTORCRAFT
YEAR (FY) NUMBER % NUMBER % NUMBER % NUMBER % NUMBER %
Base Year
2019 78,833 81.94% 12,430 12.92% 120 0.12% 0 0.0% 4,820 5.01%
Forecast
2024 85,135 81.94% 13,411 12.91% 143 0.14% 0 0.0% 5,205 5.01%
2029 91,941 81.94% 14,467 12.90% 170 0.15% 0 0.0% 5,621 5.01%
2039 107,228 81.94% 16,831 12.86% 240 0.18% 0 0.0% 6,556 5.01%
NOTE: Totals may be slightly higher or lower than 100 percent due to rounding. SOURCE: Ricondo & Associates, Inc., March 2020.
1 .3 .6.3 OPERATIONS PER AIRPORT REFERENCE CODE
For purposes of planning appropriate facilities, the FAA classifies aircraft according to two key characteristics: approach speed and wingspan. The Aircraft Approach Category (AAC), ranging from A to E, signifies approach
speed, whereas Airplane Design Group (ADG), with values between I to VI, indicates the more demanding of tail height and wingspan dimensions. Table 1-18 summarizes these classifications. AAC and ADG together form the basis for the Airport Reference Code (ARC), which indicates the most demanding aircraft type expected to regularly operate at an airport. The ARC is stated in the following manner: AAC-ADG (as illustrated by a Cessna
182 having an ARC of A-I).
Master Plan Update | 1-37 | Aviation Activity Forecast
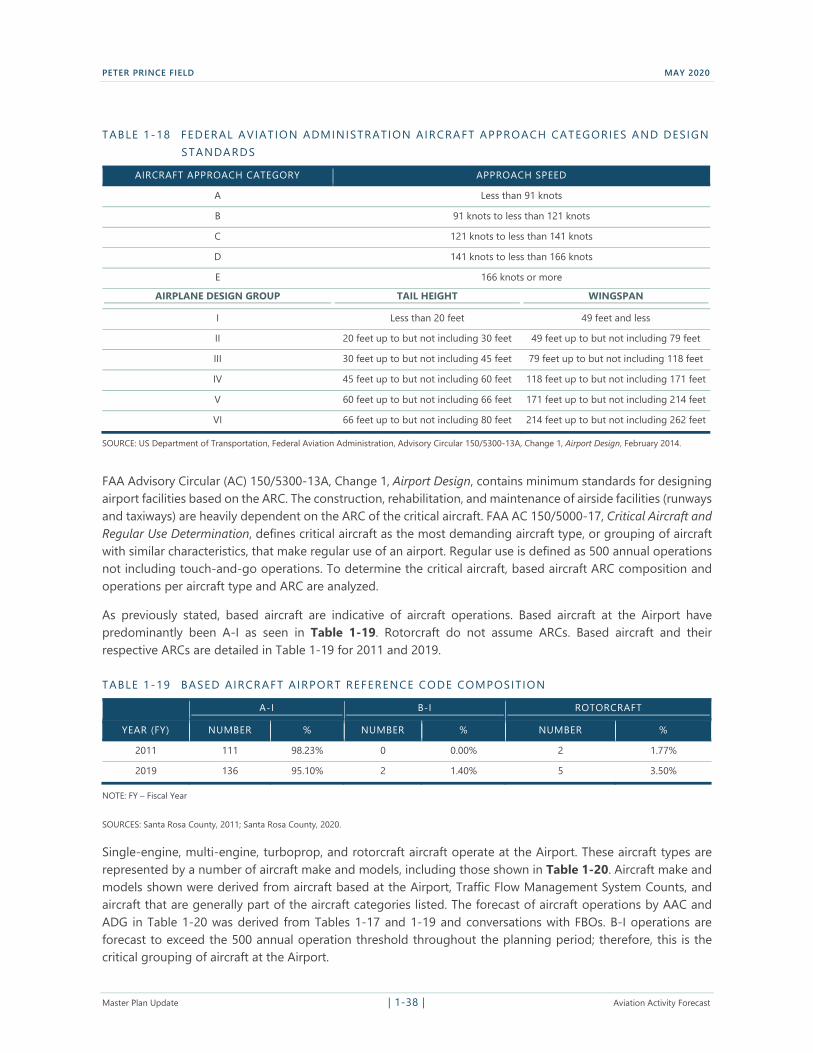
PETER PRINCE FIELD MAY 2020
TABLE 1-18 FEDERAL AVIAT ION ADMINISTRATION AIRCRAFT APPROACH CATEGORIES AND DESIGN STANDARDS
AIRCRAFT APPROACH CATEGORY APPROACH SPEED
A Less than 91 knots
B 91 knots to less than 121 knots
C 121 knots to less than 141 knots
D 141 knots to less than 166 knots
E 166 knots or more
AIRPLANE DESIGN GROUP TAIL HEIGHT WINGSPAN
I Less than 20 feet 49 feet and less
II 20 feet up to but not including 30 feet 49 feet up to but not including 79 feet
III 30 feet up to but not including 45 feet 79 feet up to but not including 118 feet
IV 45 feet up to but not including 60 feet 118 feet up to but not including 171 feet
V 60 feet up to but not including 66 feet 171 feet up to but not including 214 feet
VI 66 feet up to but not including 80 feet 214 feet up to but not including 262 feet
SOURCE: US Department of Transportation, Federal Aviation Administration, Advisory Circular 150/5300-13A, Change 1, Airport Design, February 2014.
FAA Advisory Circular (AC) 150/5300-13A, Change 1, Airport Design, contains minimum standards for designing airport facilities based on the ARC. The construction, rehabilitation, and maintenance of airside facilities (runways and taxiways) are heavily dependent on the ARC of the critical aircraft. FAA AC 150/5000-17, Critical Aircraft and Regular Use Determination, defines critical aircraft as the most demanding aircraft type, or grouping of aircraft with similar characteristics, that make regular use of an airport. Regular use is defined as 500 annual operations not including touch-and-go operations. To determine the critical aircraft, based aircraft ARC composition and
operations per aircraft type and ARC are analyzed.
As previously stated, based aircraft are indicative of aircraft operations. Based aircraft at the Airport have predominantly been A-I as seen in Table 1-19. Rotorcraft do not assume ARCs. Based aircraft and their respective ARCs are detailed in Table 1-19 for 2011 and 2019.
TABLE 1-19 BASED AIRCRAFT AIRPORT REFERENCE CODE COMPOSITION
A-I B-I ROTORCRAFT
YEAR (FY) NUMBER % NUMBER % NUMBER %
2011 111 98.23% 0 0.00% 2 1.77%
2019 136 95.10% 2 1.40% 5 3.50%
NOTE: FY – Fiscal Year
SOURCES: Santa Rosa County, 2011; Santa Rosa County, 2020.
Single-engine, multi-engine, turboprop, and rotorcraft aircraft operate at the Airport. These aircraft types are
represented by a number of aircraft make and models, including those shown in Table 1-20. Aircraft make and models shown were derived from aircraft based at the Airport, Traffic Flow Management System Counts, and
aircraft that are generally part of the aircraft categories listed. The forecast of aircraft operations by AAC and ADG in Table 1-20 was derived from Tables 1-17 and 1-19 and conversations with FBOs. B-I operations are forecast to exceed the 500 annual operation threshold throughout the planning period; therefore, this is the critical grouping of aircraft at the Airport.
Master Plan Update | 1-38 | Aviation Activity Forecast
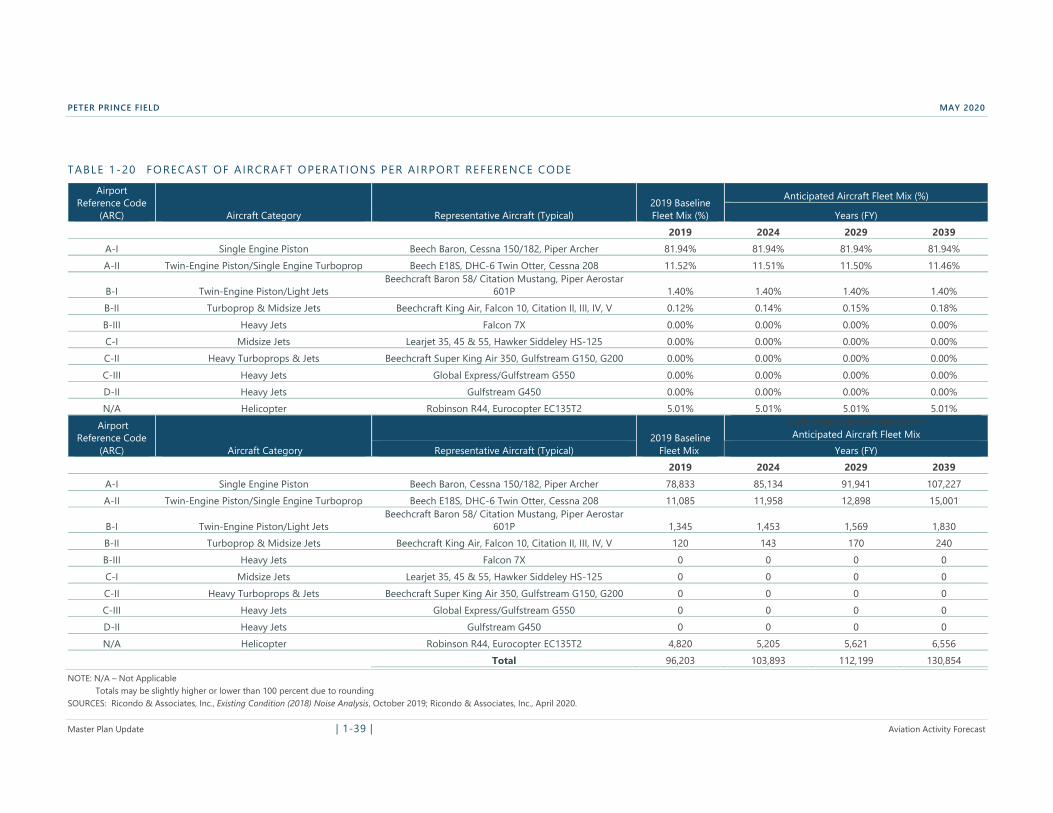
PETER PRINCE FIELD MAY 2020
TABLE 1-20 FORECAST OF AIRCRAFT OPERATIONS PER AIRPORT REFERENCE CODE
Airport Reference Code
(ARC) Aircraft Category Representative Aircraft (Typical) 2019 Baseline Fleet Mix (%)
Anticipated Aircraft Fleet Mix (%)
Years (FY) 2019 2024 2029 2039
A-I Single Engine Piston Beech Baron, Cessna 150/182, Piper Archer 81.94% 81.94% 81.94% 81.94% A-II Twin-Engine Piston/Single Engine Turboprop Beech E18S, DHC-6 Twin Otter, Cessna 208 11.52% 11.51% 11.50% 11.46%
Beechcraft Baron 58/ Citation Mustang, Piper Aerostar B-I Twin-Engine Piston/Light Jets 601P 1.40% 1.40% 1.40% 1.40% B-II Turboprop & Midsize Jets Beechcraft King Air, Falcon 10, Citation II, III, IV, V 0.12% 0.14% 0.15% 0.18% B-III Heavy Jets Falcon 7X 0.00% 0.00% 0.00% 0.00% C-I Midsize Jets Learjet 35, 45 & 55, Hawker Siddeley HS-125 0.00% 0.00% 0.00% 0.00% C-II Heavy Turboprops & Jets Beechcraft Super King Air 350, Gulfstream G150, G200 0.00% 0.00% 0.00% 0.00% C-III Heavy Jets Global Express/Gulfstream G550 0.00% 0.00% 0.00% 0.00% D-II Heavy Jets Gulfstream G450 0.00% 0.00% 0.00% 0.00% N/A Helicopter Robinson R44, Eurocopter EC135T2 5.01% 5.01% 5.01% 5.01%
Airport Reference Code
(ARC) Aircraft Category 2019 Baseline
Fleet Mix Representative Aircraft (Typical)
Anticipated Aircraft Operations Anticipated Aircraft Fleet Mix
Years (FY) 2019 2024 2029 2039
A-I Single Engine Piston Beech Baron, Cessna 150/182, Piper Archer 78,833 85,134 91,941 107,227
A-II Twin-Engine Piston/Single Engine Turboprop Beech E18S, DHC-6 Twin Otter, Cessna 208 11,085 11,958 12,898 15,001 Beechcraft Baron 58/ Citation Mustang, Piper Aerostar
B-I Twin-Engine Piston/Light Jets 601P 1,345 1,453 1,569 1,830
B-II Turboprop & Midsize Jets Beechcraft King Air, Falcon 10, Citation II, III, IV, V 120 143 170 240 B-III Heavy Jets Falcon 7X 0 0 0 0
C-I Midsize Jets Learjet 35, 45 & 55, Hawker Siddeley HS-125 0 0 0 0
C-II Heavy Turboprops & Jets Beechcraft Super King Air 350, Gulfstream G150, G200 0 0 0 0
C-III Heavy Jets Global Express/Gulfstream G550 0 0 0 0
D-II Heavy Jets Gulfstream G450 0 0 0 0
N/A Helicopter Robinson R44, Eurocopter EC135T2 4,820 5,205 5,621 6,556
Total 96,203 103,893 112,199 130,854
NOTE: N/A – Not Applicable
Totals may be slightly higher or lower than 100 percent due to rounding SOURCES: Ricondo & Associates, Inc., Existing Condition (2018) Noise Analysis, October 2019; Ricondo & Associates, Inc., April 2020.
Master Plan Update | 1-39 | Aviation Activity Forecast
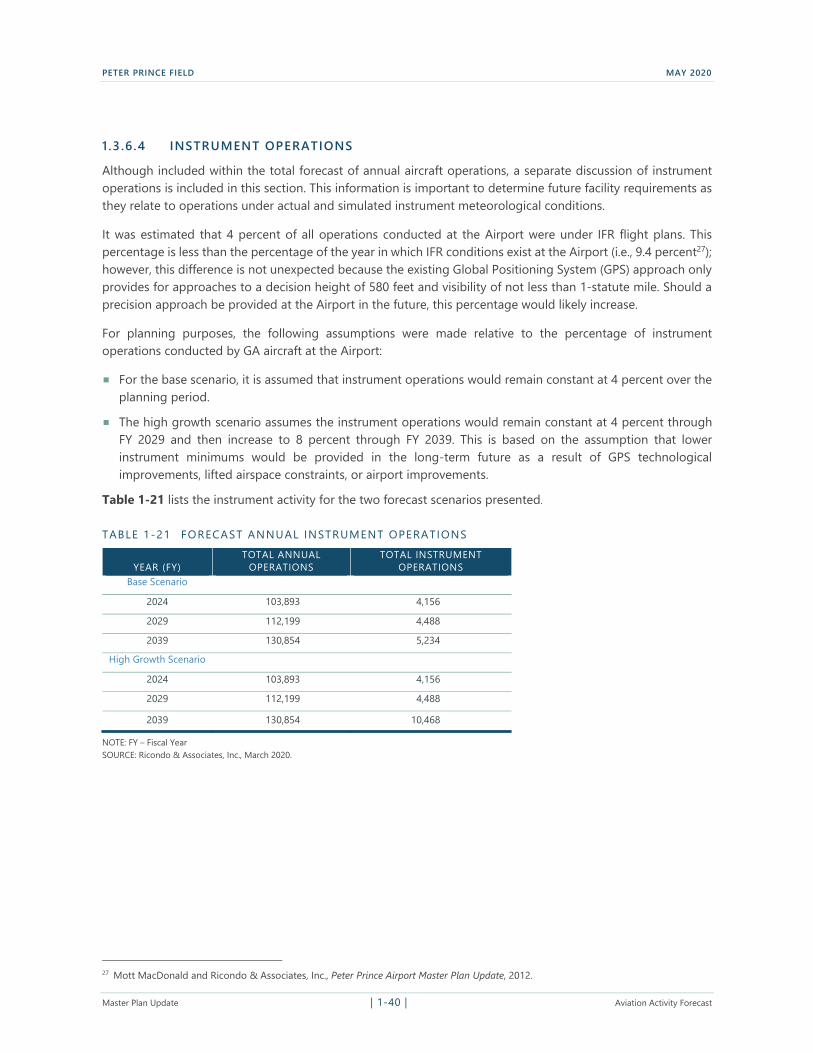
PETER PRINCE FIELD MAY 2020
1 .3 .6.4 INSTRUMENT OPERATIONS
Although included within the total forecast of annual aircraft operations, a separate discussion of instrument operations is included in this section. This information is important to determine future facility requirements as
they relate to operations under actual and simulated instrument meteorological conditions.
It was estimated that 4 percent of all operations conducted at the Airport were under IFR flight plans. This percentage is less than the percentage of the year in which IFR conditions exist at the Airport (i.e., 9.4 percent27); however, this difference is not unexpected because the existing Global Positioning System (GPS) approach only provides for approaches to a decision height of 580 feet and visibility of not less than 1-statute mile. Should a
precision approach be provided at the Airport in the future, this percentage would likely increase.
For planning purposes, the following assumptions were made relative to the percentage of instrument operations conducted by GA aircraft at the Airport:
For the base scenario, it is assumed that instrument operations would remain constant at 4 percent over the planning period.
The high growth scenario assumes the instrument operations would remain constant at 4 percent through FY 2029 and then increase to 8 percent through FY 2039. This is based on the assumption that lower instrument minimums would be provided in the long-term future as a result of GPS technological improvements, lifted airspace constraints, or airport improvements.
Table 1-21 lists the instrument activity for the two forecast scenarios presented.
TABLE 1-21 FORECAST ANNUAL INSTRUMENT OPERATIONS
YEAR (FY) TOTAL ANNUAL
OPERATIONS TOTAL INSTRUMENT
OPERATIONS
Base Scenario
2024 103,893 4,156
2029 112,199 4,488
2039 130,854 5,234
High Growth Scenario
2024 103,893 4,156
2029 112,199 4,488
2039 130,854 10,468
NOTE: FY – Fiscal Year SOURCE: Ricondo & Associates, Inc., March 2020.
27 Mott MacDonald and Ricondo & Associates, Inc., Peter Prince Airport Master Plan Update, 2012.
Master Plan Update | 1-40 | Aviation Activity Forecast
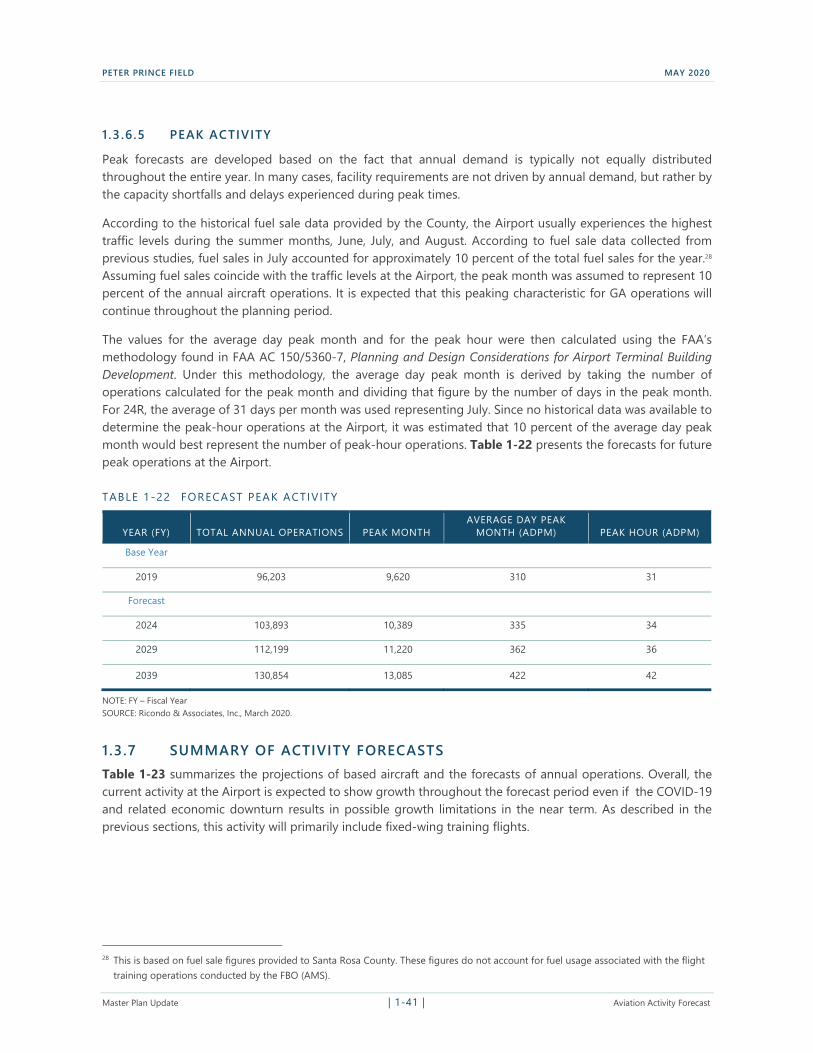
PETER PRINCE FIELD MAY 2020
1 .3 .6.5 PEAK ACTIVITY
Peak forecasts are developed based on the fact that annual demand is typically not equally distributed throughout the entire year. In many cases, facility requirements are not driven by annual demand, but rather by
the capacity shortfalls and delays experienced during peak times.
According to the historical fuel sale data provided by the County, the Airport usually experiences the highest traffic levels during the summer months, June, July, and August. According to fuel sale data collected from previous studies, fuel sales in July accounted for approximately 10 percent of the total fuel sales for the year.28
Assuming fuel sales coincide with the traffic levels at the Airport, the peak month was assumed to represent 10 percent of the annual aircraft operations. It is expected that this peaking characteristic for GA operations will continue throughout the planning period.
The values for the average day peak month and for the peak hour were then calculated using the FAA’s methodology found in FAA AC 150/5360-7, Planning and Design Considerations for Airport Terminal Building Development. Under this methodology, the average day peak month is derived by taking the number of operations calculated for the peak month and dividing that figure by the number of days in the peak month. For 24R, the average of 31 days per month was used representing July. Since no historical data was available to
determine the peak-hour operations at the Airport, it was estimated that 10 percent of the average day peak month would best represent the number of peak-hour operations. Table 1-22 presents the forecasts for future peak operations at the Airport.
TABLE 1-22 FORECAST PEAK ACTIVITY
YEAR (FY) TOTAL ANNUAL OPERATIONS PEAK MONTH AVERAGE DAY PEAK
MONTH (ADPM) PEAK HOUR (ADPM)
Base Year
2019 96,203 9,620 310 31
Forecast
2024 103,893 10,389 335 34
2029 112,199 11,220 362 36
2039 130,854 13,085 422 42
NOTE: FY – Fiscal Year SOURCE: Ricondo & Associates, Inc., March 2020.
1.3.7 SUMMARY OF ACTIVITY FORECASTS Table 1-23 summarizes the projections of based aircraft and the forecasts of annual operations. Overall, the
current activity at the Airport is expected to show growth throughout the forecast period even if the COVID-19
and related economic downturn results in possible growth limitations in the near term. As described in the previous sections, this activity will primarily include fixed-wing training flights.
28 This is based on fuel sale figures provided to Santa Rosa County. These figures do not account for fuel usage associated with the flight training operations conducted by the FBO (AMS).
Master Plan Update | 1-41 | Aviation Activity Forecast
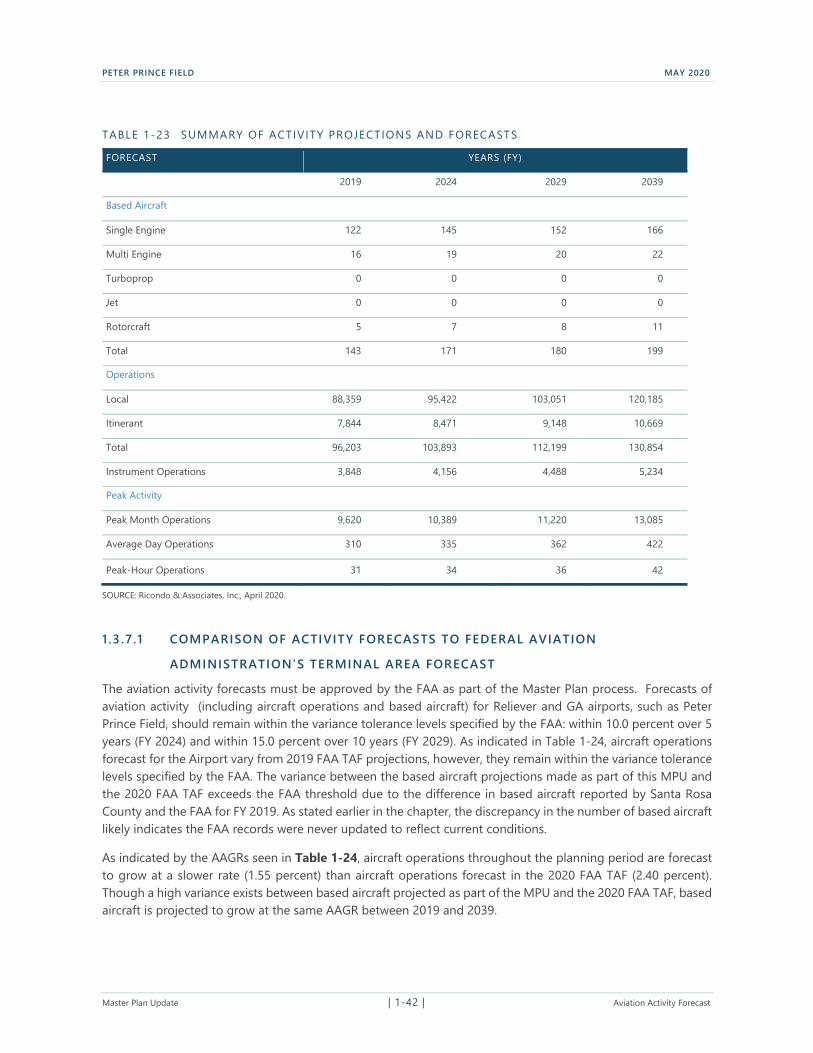
PETER PRINCE FIELD MAY 2020
TABLE 1-23 SUMMARY OF ACTIVITY PROJECTIONS AND FORECASTS
FORECAST YEARS (FY)
2019 2024 2029 2039
Based Aircraft
Single Engine 122 145 152 166
Multi Engine 16 19 20 22
Turboprop 0 0 0 0
Jet 0 0 0 0
Rotorcraft 5 7 8 11
Total 143 171 180 199
Operations
Local 88,359 95,422 103,051 120,185
Itinerant 7,844 8,471 9,148 10,669
Total 96,203 103,893 112,199 130,854
Instrument Operations 3,848 4,156 4,488 5,234
Peak Activity
Peak Month Operations 9,620 10,389 11,220 13,085
Average Day Operations 310 335 362 422
Peak-Hour Operations 31 34 36 42
SOURCE: Ricondo & Associates, Inc., April 2020.
1 .3 .7.1 COMPARISON OF ACTIVITY FORECASTS TO FEDERAL AVIATION
ADMINISTRATION’S TERMINAL AREA FORECAST
The aviation activity forecasts must be approved by the FAA as part of the Master Plan process. Forecasts of aviation activity (including aircraft operations and based aircraft) for Reliever and GA airports, such as Peter Prince Field, should remain within the variance tolerance levels specified by the FAA: within 10.0 percent over 5 years (FY 2024) and within 15.0 percent over 10 years (FY 2029). As indicated in Table 1-24, aircraft operations forecast for the Airport vary from 2019 FAA TAF projections, however, they remain within the variance tolerance levels specified by the FAA. The variance between the based aircraft projections made as part of this MPU and the 2020 FAA TAF exceeds the FAA threshold due to the difference in based aircraft reported by Santa Rosa County and the FAA for FY 2019. As stated earlier in the chapter, the discrepancy in the number of based aircraft likely indicates the FAA records were never updated to reflect current conditions.
As indicated by the AAGRs seen in Table 1-24, aircraft operations throughout the planning period are forecast to grow at a slower rate (1.55 percent) than aircraft operations forecast in the 2020 FAA TAF (2.40 percent). Though a high variance exists between based aircraft projected as part of the MPU and the 2020 FAA TAF, based aircraft is projected to grow at the same AAGR between 2019 and 2039.
Master Plan Update | 1-42 | Aviation Activity Forecast
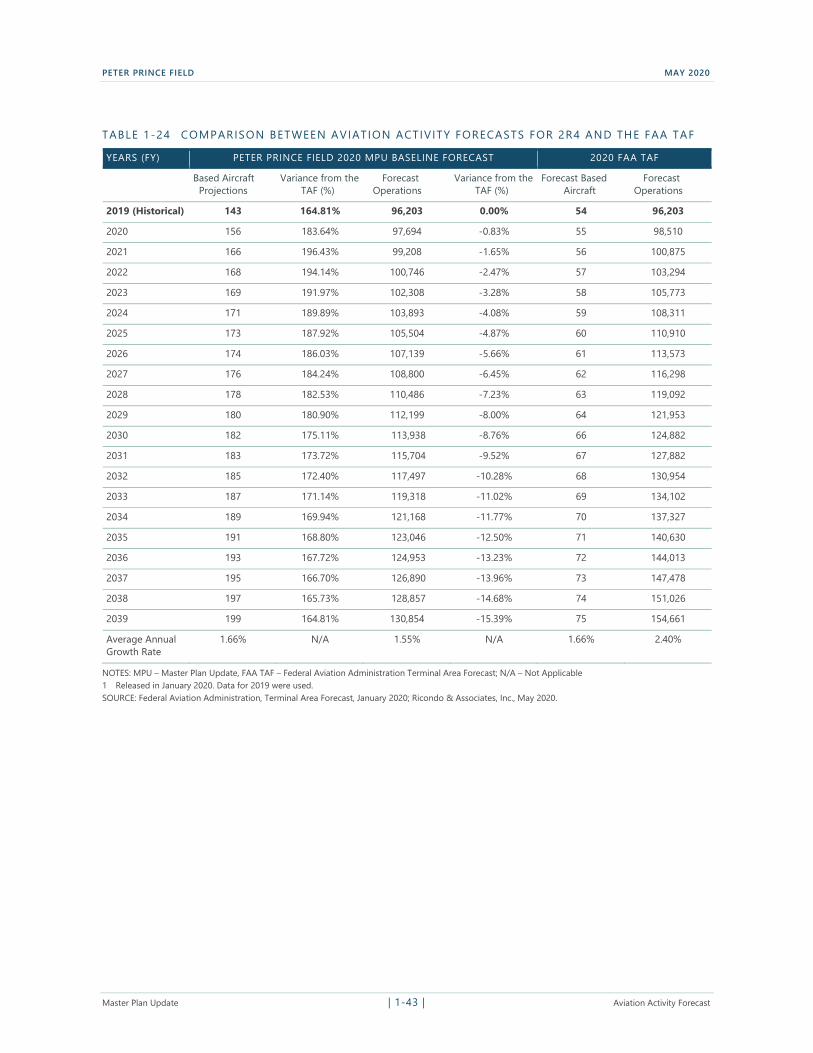
PETER PRINCE FIELD MAY 2020
TABLE 1-24 COMPARISON BETWEEN AVIATION ACTIVITY FORECASTS FOR 2R4 AND THE FAA TAF
YEARS (FY) PETER PRINCE FIELD 2020 MPU BASELINE FORECAST 2020 FAA TAF
Based Aircraft Variance from the Forecast Variance from the Forecast Based Forecast Projections TAF (%) Operations TAF (%) Aircraft Operations
2019 (Historical) 143 164.81% 96,203 0.00% 54 96,203
2020 156 183.64% 97,694 -0.83% 55 98,510
2021 166 196.43% 99,208 -1.65% 56 100,875
2022 168 194.14% 100,746 -2.47% 57 103,294
2023 169 191.97% 102,308 -3.28% 58 105,773
2024 171 189.89% 103,893 -4.08% 59 108,311
2025 173 187.92% 105,504 -4.87% 60 110,910
2026 174 186.03% 107,139 -5.66% 61 113,573
2027 176 184.24% 108,800 -6.45% 62 116,298
2028 178 182.53% 110,486 -7.23% 63 119,092
2029 180 180.90% 112,199 -8.00% 64 121,953
2030 182 175.11% 113,938 -8.76% 66 124,882
2031 183 173.72% 115,704 -9.52% 67 127,882
2032 185 172.40% 117,497 -10.28% 68 130,954
2033 187 171.14% 119,318 -11.02% 69 134,102
2034 189 169.94% 121,168 -11.77% 70 137,327
2035 191 168.80% 123,046 -12.50% 71 140,630
2036 193 167.72% 124,953 -13.23% 72 144,013
2037 195 166.70% 126,890 -13.96% 73 147,478
2038 197 165.73% 128,857 -14.68% 74 151,026
2039 199 164.81% 130,854 -15.39% 75 154,661
Average Annual 1.66% N/A 1.55% N/A 1.66% 2.40% Growth Rate
NOTES: MPU – Master Plan Update, FAA TAF – Federal Aviation Administration Terminal Area Forecast; N/A – Not Applicable
1 Released in January 2020. Data for 2019 were used. SOURCE: Federal Aviation Administration, Terminal Area Forecast, January 2020; Ricondo & Associates, Inc., May 2020.
Master Plan Update | 1-43 | Aviation Activity Forecast

81 | Mott MacDonald | Peter Prince Field 2020 Airport Master Plan Update | Santa Rosa County
Appendix B - Existing Conditions (2018) Noise Analysis
January 2020
Peter Prince Field
Existing Condition (2018) Noise Analysis
Prepared for :
Santa Rosa County
Prepared by : In associat ion with :
RICONDO Barry Technologies Inc.
Ricondo & Associates, Inc. (Ricondo) prepared this document for the stated purposes as expressly set forth herein and for the sole use of Santa Rosa County and its intended recipients. The techniques and methodologies used in preparing this document are consistent with industry practices at the time of preparation and this Report should be read in its entirety for an understanding of the analysis, assumptions, and opinions presented. Ricondo & Associates, Inc. is not registered as a municipal advisor under Section 15B of the Securities Exchange Act of 1934 and does not provide financial advisory services within the meaning of such act.

PETER PRINCE FIELD JANUARY 2020
TABLE OF CONTENTS 1. Introduction...................................................................................................................................... 1
2. Airfield Facilities and Environment ................................................................................................ 1
3. Airport Environs ............................................................................................................................... 3
4. Noise Context and Analysis Methodology .................................................................................... 3
4.1 Description of Noise................................................................................................................................................................... 3
4.2 Analysis Methodology ............................................................................................................................................................... 6
5. Noise Monitoring Results................................................................................................................ 6
5.1 Noise Measurement Sites Overview..................................................................................................................................... 8
5.2 Measured Average Sound Levels .......................................................................................................................................... 9
5.3 Measured Noise Events............................................................................................................................................................. 9
6. Aircraft Operations ........................................................................................................................ 12
6.1 Annual Aircraft Operations .................................................................................................................................................... 15
6.2 Average Annual Daily Aircraft Operations.......................................................................................................................16
6.3 Runway Geometry and Use ................................................................................................................................................... 18
6.4 Flight Track Locations .............................................................................................................................................................. 18
6.5 Aircraft Weight and Trip Length .......................................................................................................................................... 22
6.6 2018 Noise Exposure Patterns.............................................................................................................................................. 22
LIST OF APPENDICES Appendix A Peter Prince Field Noise Monitoring Results Summary
LIST OF TABLES Table 5-1: Noise Monitoring Results ............................................................................................................................................................ 9
Table 6-1: Annual Operations by User Category ................................................................................................................................... 16
Table 6-2: Average Annual Daily Aircraft Itinerant and Local Operations (2018) .....................................................................17
Table 6-3: Area within Aircraft Day-Night Average Sound Level Contours (2018) ..................................................................22
Table 6-4: Estimated Population and Residencies within Aircraft Day-Night Average Sound Level Contours (2018) ......................................................................................................................................................................................... 24
Existing Condition (2018) Noise Analysis | i |
PETER PRINCE FIELD JANUARY 2020
LIST OF EXHIBITS Exhibit 2-1: Peter Prince Field Airfield Facilities ........................................................................................................................................ 2
Exhibit 3-1: Airport Environs............................................................................................................................................................................. 4
Exhibit 4-1: Comparison of Noise Levels..................................................................................................................................................... 5
Exhibit 5-1: Noise Monitoring Locations ..................................................................................................................................................... 7
Exhibit 5-2: Hourly Average Sound Levels at Site 1 .............................................................................................................................. 10
Exhibit 5-3: Hourly Average Sound Levels at Site 2 .............................................................................................................................. 10
Exhibit 5-4: One-MInute Average Sound Levels at Site 3................................................................................................................... 11
Exhibit 5-5: Hourly Number of Noise Events at Site 1 ......................................................................................................................... 13
Exhibit 5-6: Hourly Number of Noise Events at Site 2 ......................................................................................................................... 13
Exhibit 5-7: Number of Noise Events at Site 3 ........................................................................................................................................ 14
Exhibit 6-1: Runway 18 (South Flow) Generalized Arrival and Departure Flight Tracks ......................................................... 19
Exhibit 6-2: Runway 36 (North Flow) Generalized Arrival and Departure Flight Tracks ......................................................... 20
Exhibit 6-3: Generalized Touch-and-Go Flight Tracks.......................................................................................................................... 21
Exhibit 6-4: Existing Noise Contours ........................................................................................................................................................... 23
Existing Condition (2018) Noise Analysis | ii |
PETER PRINCE FIELD JANUARY 2020
1. INTRODUCTION
This aircraft noise analysis for Peter Prince Field (the Airport) was undertaken at the request of Santa Rosa County, Florida, to determine existing aircraft noise conditions at the Airport and to update noise exposure contours previously developed as part of the 2014 Airport Master Plan Update.1 This report is intended for informational use only by Santa Rosa County; it is not intended to serve as a 14 Code of Federal Regulations (CFR) Federal Aviation Regulations Part 150 Noise Exposure Map document or to be used in developing a Noise Compatibility Program.
This document presents the input data, methodology, and assumptions used in assessing aircraft noise conditions at the Airport. Input data for the aircraft noise analysis and the resulting noise exposure contours are described in the following sections. Section 2 describes the existing (2018) Airport facilities, and Section 3 provides an overview of the surrounding communities. Section 4 presents a noise overview, as well as the methodology and assumptions used in conducting the aircraft noise analysis. Section 5 summarizes the noise monitoring conducted in communities around the Airport. Section 6 describes the 2018 aircraft operation assumptions at the Airport, the generalized flight tracks modeled, the resulting 2018 noise exposure contours, and the number of people and houses in the communities surrounding the Airport within those contours.
2. AIRFIELD FACILITIES AND ENVIRONMENT
The Airport is located on approximately 218 acres in central Santa Rosa County in the northwest region of Florida, between Pensacola and Fort Walton Beach. Airfield facilities (i.e., runways and taxiways) were considered in developing the noise exposure contour maps. Exhibit 2-1 depicts the existing Airport property boundary, airfield pavement, and buildings.
The existing airfield includes a single runway and multiple aircraft parking areas. Runway 18-36 has a useable length of 3,701 feet and is 75 feet wide with a north–south orientation. The runway can accommodate most small general aviation (GA) aircraft weighing less than 12,500 pounds, with wingspans less than 79 feet. Aircraft operations are in a North Flow configuration with arrivals and departures on Runway 36 approximately 68 percent of the time over the average year.2
The Airport has two full-length taxiways, one on each side of Runway 18-36. The taxiway system provides aircraft access between the runway and the general and corporate aviation areas, including the two fixed-base operators (FBOs), maintenance facilities, aircraft hangars, and other aircraft parking areas on both the east and west sides of the airfield. One helipad exists east of the runway adjacent to the east apron.
1 Santa Rosa County, Peter Prince Field Airport Master Plan Update, 2014. 2 Santa Rosa County, Peter Prince Field Airport Master Plan Update, Section 7.1.2, Runway Utilization, 2014.
Existing Condition (2018) Noise Analysis | 1 | Aircraft Noise Exposure
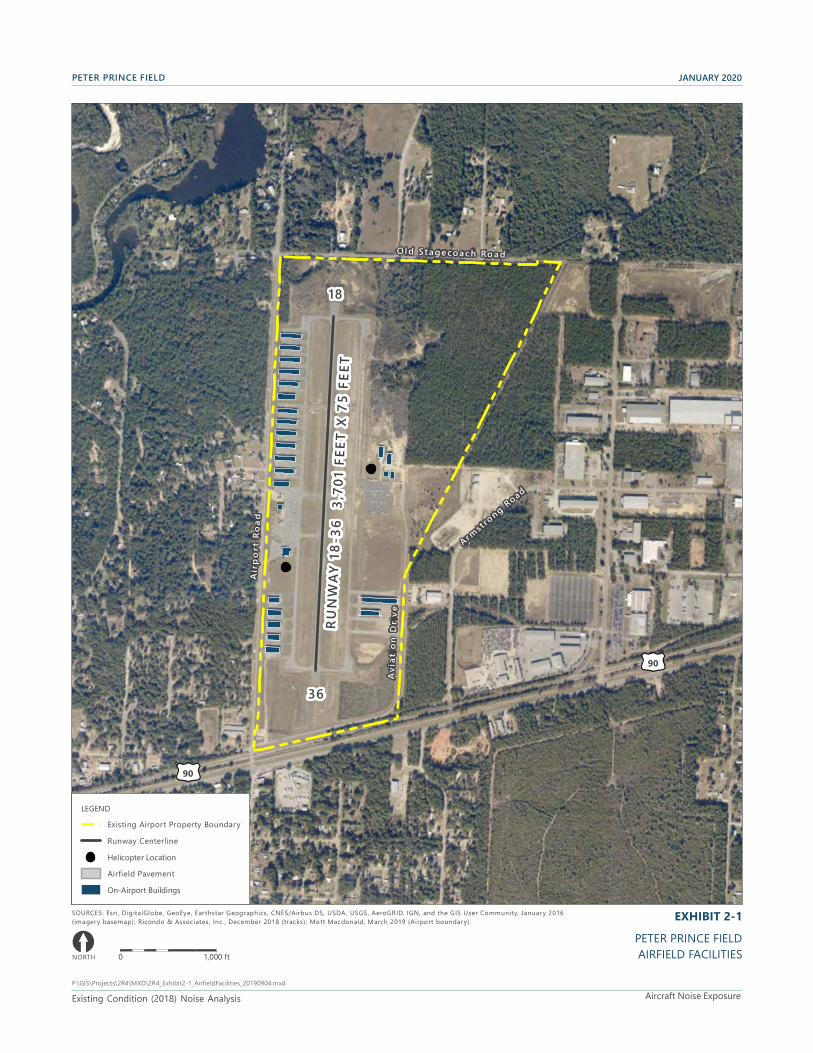
18
36 £¤90
£¤90
Airp
o rt R
oad
O ld Stage coac h Ro ad
Armstro
ng Road
RUNW
AY 1
8-36
3,7
01 F
EET
X 75
FEE
T
Avia
t ion
Driv
e
PETER PRINCE FIELD JANUARY 2020
LEGEND
Existing Airport Property Boundary
Runway Centerline
Helicopter Location
Airfield Pavement
On-Airport Buildings
SOURCES: Esri, D igitalGlobe, GeoEye, Earthstar Geographics, CNES/Airbus DS, USDA, USGS, AeroGRID, IGN, and the GIS User Community, January 2016 EXHIBIT 2-1 (imagery basemap); Ricondo & Associates, Inc. , December 2018 (tracks); Mott Macdonald, March 2019 (Airport boundary).
[ PETER PRINCE FIELD NORTH 0 1,000 ft AIRFIELD FACILITIES
P:\GIS\Projects\2R4\MXD\2R4_Exhibit2-1_AirfieldFacilities_20190904.mxd
Existing Condition (2018) Noise Analysis Aircraft Noise Exposure
4.1
PETER PRINCE FIELD JANUARY 2020
3. AIRPORT ENVIRONS
As shown on Exhibit 3-1, the Airport is located in the Florida panhandle approximately 3 miles northeast of the city of Milton. Downtown Pensacola is approximately 20 miles southwest of the Airport, and Fort Walton Beach is approximately 25 miles southeast. The Airport lies in a complex airspace environment. Pensacola is home to Pensacola International Airport, a civilian air carrier airport, Naval Air Station (NAS) Pensacola, NAS Whiting Field, and numerous outlying training fields. The Eglin Air Force Base complex, comprising multiple airfields, and Destin– Fort Walton Beach Airport are to the east. Numerous military airspace operating areas for both fixed-wing aircraft and helicopters are proximate to the Airport. The air traffic patterns for Peter Prince Field are limited by and reflective of the complex airspace operating environment.
4. NOISE CONTEXT AND ANALYSIS METHODOLOGY
DESCRIPTION OF NOISE Noise is defined as unwanted sound that interferes with normal activities or otherwise diminishes the quality of the environment. Noise may be intermittent or continuous, steady or impulsive, stationary or transient. People have a wide diversity in responses to noise that vary not only according to the type of noise and the characteristics of the sound source but also according to the sensitivity and expectations of an individual, the time of day, and the distance between the noise source (e.g., aircraft) and the type of activity a person is performing (e.g., sleep, conversation, work, or learning).
Noise levels are measured in decibels (dB), which are represented on a logarithmic scale of about 10 dB to over 140 dB. On this scale, everyday noises range from 30 dB for a quiet room to 100 dB for a loud power lawn mower at close range. At a constant level of 70 dB, noise can be irritating and disruptive to speech; at louder levels, hearing loss can occur. The risk of hearing loss starts at 85 dB occurring over a continuous 8-hour period, which represents the Occupational Safety and Health Administration standard for daily exposure.
A difference of 3 dB represents a doubling of sound levels in terms of energy; however, because of how humans detect sound, it is necessary to have a 10-dB increase to be perceived as a doubling in sound. Aircraft noise measurements are usually on an “A-weighted3” scale that filters out very low and high frequencies to replicate the sensitivity of the human ear. It is common to add the “A” to identify the measurement has been made with this filtering process that results in what is referred to as A-weighted decibels (dBA). Exhibit 4-1 compares the noise levels of common noise sources in dBA.
A-weighted decibels (dBA) are a measurement of sound energy designed to represent the response of the human ear to sound. Frequencies more readily detected by the human ear are more heavily weighted in the measurement, while frequencies less well detected are assigned lower weights. The dBA measurement is commonly used in studies where the human response to sound is the object of the analysis.
Existing Condition (2018) Noise Analysis | 3 | Aircraft Noise Exposure
3
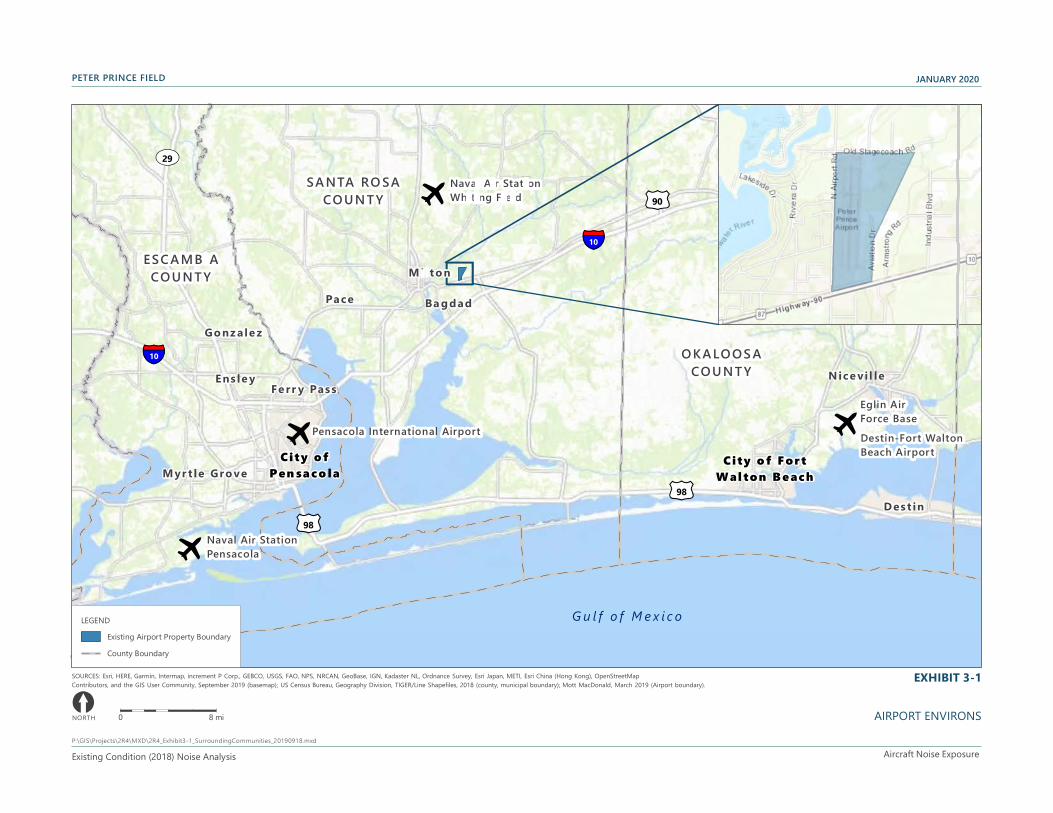
EXHIBIT 3-1
PETER PRINCE FIELD JANUARY 2020
e
e
e
e
O K A LO O S ACO U N T Y
SA NTA RO SACO U N T Y
Naval Air Station Pensacola
Pensacola International Airport
Eglin AirForce BaseDestin-Fort Walton Beach AirportC i t y o f
P e n sa c o l a C i t y o f F o r t
W al t o n B e a c h
§̈¦10
£¤90
£¤98
£¤98
§̈¦10
UV29
M yr t le Gro ve
E ns le y
Go nz a le z
Pace Ba g d ad
N ice v i l le
Des t in
Fe rr y Pas s
G u l f o f M e x i c o
E SC A M B IACO U N T Y M i l t o n
Naval Air Station Whiting Field
Service Layer Credits: Sources: Esri, HERE,DeLorme, increment P Corp., NPS, NRCan,Ordnance Survey, © OpenStreetMapcontributors, USGS, NGA, NASA, CGIAR, N
LEGEND
Existing Airport Property Boundary
County Boundary
SOURCES: Esri, HERE, Garmin, Intermap, increment P Corp., GEBCO, USGS, FAO, NPS, NRCAN, GeoBase, IGN, Kadaster NL, Ordnance Survey, Esri Japan, METI, Esri China (Hong Kong), OpenStreetMap
Contributors, and the GIS User Community, September 2019 (basemap); US Census Bureau, Geography Division, TIGER/Line Shapefiles, 2018 (county, municipal boundary); Mott MacDonald, March 2019 (Airport boundary).
[ 0 8 mi AIRPORT ENVIRONS
P:\GIS\Projects\2R4\MXD\2R4_Exhibit3-1_SurroundingCommunities_20190918.mxd
NORTH
Existing Condition (2018) Noise Analysis Aircraft Noise Exposure

PETER PRINCE FIELD
NOTE: dBA – A-weighted decibelsSOURCES: US Department of Transportation, Federal Highway Administration, 2017; State of California, Department of Transportation, 2017. EXHIBIT 4-1
COMPARISON OF NOISE LEVELS
corporate:Creative Serv ces:01 Projects:01 C ient Projects:2019:2R4:Peter Pr nce Field-No se Level Graphic:Peter Prince Field No se Graph c_8.5x11 Portrait. ndd
Existing Condition (2018) Noise Analysis Aircraft Noise Exposure
JANUARY 2020
Noise Levels dBA
Outdoor Noise
120
130
Threshold of Pain Indoor Noise
Rock Band Jet Takeo’ at 1,000
Inside Subway Train
Gas Mower at 3 Food Blender at 3 Diesel Truck at 50
Garbage Disposal at 3 Noisy Urban Area Shouting at 3
Vacuum Cleaner at 10
Busy Commercial Area Normal Speech at 3
Heavy Tra c at 300
Dishwasher Quiet Urban Nigh–ime Large Business O ce
Quiet Suburban Nigh–ime
Quiet Rural Nigh–ime
Library Bedroom at Night
Recording Studio
Rustle of Leaves Threshold of Hearing
0
110
100
90
80
70
60
50
40
30
20
10
i l i i i i i
PETER PRINCE FIELD JANUARY 2020
4.2 ANALYSIS METHODOLOGY The Federal Aviation Administration (FAA) Aviation Environmental Design Tool (AEDT), Version 2d, was used to produce aircraft noise exposure contours for representative operating conditions at the Airport in 2018. The AEDT requires considerable user-supplied input data, as explained in greater detail in Section 6, which include runway coordinates, flight tracks, aircraft operations by aircraft type, runway and flight track use, and departure trip length data. Further, operations are broken out by time of day; those operations during nighttime hours (10:00 p.m. to 7:00 a.m.) are assessed a 10-dBA penalty to compensate for individuals’ heightened sensitivity during this period. The results of the noise modeling are output as an aircraft noise contour map.
Noise exposure contours for day-night average sound level (DNL)4 60, 65, 70, and 75 (expressed in dBA) were produced. Although this analysis and document were developed for informational purposes only, the DNL data shown as part of this analysis were calculated in a manner consistent with that recommended by the FAA.
The final results of the aircraft noise modeling, represented by a DNL contour map, represent the cumulative, time-weighted noise exposure for an average day during the study year, or the average annual day (AAD). Noise exposure on any given day will differ from the AAD DNL contours to the extent that conditions on a specific day differ from AAD conditions.
The sensitivity of individuals to noise is known to vary widely, but average responses among large groups of people tend to be similar from place to place. Annoyance is considered when evaluating aircraft noise compatibility. FAA guidelines for determining the compatibility of different land uses with aircraft noise levels were applied to this analysis. FAA guidance identifies the compatibility of generalized land uses with various ranges of DNL exposure.5
The guidelines were developed based on the average responses of people to noise. The FAA considers aircraft noise of DNL 65 dBA and higher to be incompatible with noise-sensitive land uses (e.g., residential, schools, libraries). The DNL 60 dBA noise contour was included as it is known that noise at this level can be disturbing to at least some people in residential areas, particularly where outdoor living and relaxation are important.
When care is taken in the development of input data for the AEDT, the noise modeling results are a reasonably accurate representation of aircraft noise conditions. An important benefit of noise modeling is that it provides an effective way of estimating existing noise levels and predicting future noise levels, accounting for changes in airport activity and operating conditions.
5. NOISE MONITORING RESULTS
In December 2018, Barry Technologies Inc., conducted noise monitoring at two primary sites and one supplemental site near the Airport. The purpose of noise monitoring was to capture background sound levels and aircraft and community noise events for use in determining the existing noise environment. Noise data were collected at residential areas experiencing aircraft overflights (landing, takeoff, and/or touch-and-go operations) during normal operating conditions at the Airport. Exhibit 5-1 shows the noise monitoring locations.
4 DNL is a noise metric used to describe the cumulative A-weighted sound level over a 24-hour period, typically an average day over the course of a year. In computing DNL, an extra weight of 10 decibels is assigned to noise occurring between the hours of 10:00 p.m. and 7:00 a.m. to account for increased annoyance when background sound levels are lower and people are trying to sleep. DNL may be determined for individual locations or it may be expressed in noise contours.
5 14 CFR Part 150, Airport Noise Compatibility Planning, Appendix A, Table 1.
Existing Condition (2018) Noise Analysis | 6 | Aircraft Noise Exposure
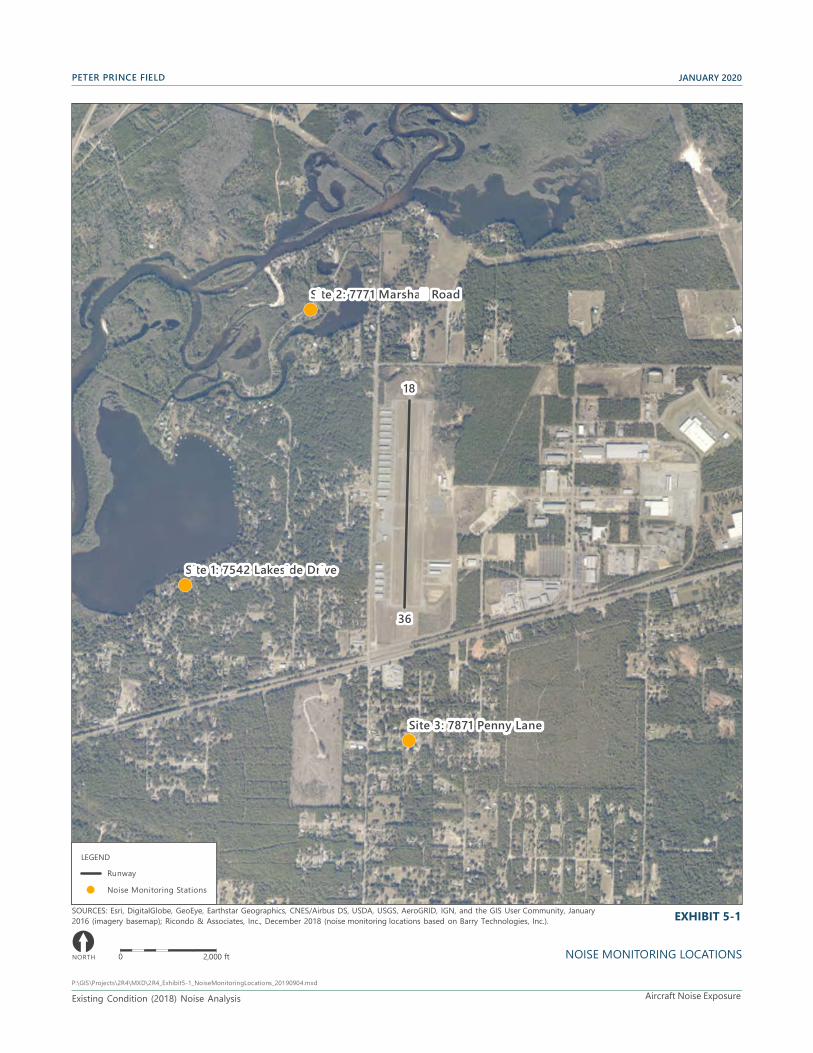
PETER PRINCE FIELD JANUARY 2020
!(
!(
!(
18
36
Site 3: 7871 Penny Lane
Site 1: 7542 Lakeside Drive
Site 2: 7771 Marshall Road
LEGEND
Runway
! Noise Monitoring Stations (
SOURCES: Esri, DigitalGlobe, GeoEye, Earthstar Geographics, CNES/Airbus DS, USDA, USGS, AeroGRID, IGN, and the GIS User Community, January EXHIBIT 5-12016 (imagery basemap); Ricondo & Associates, Inc., December 2018 (noise monitoring locations based on Barry Technologies, Inc.).
[NORTH 0 2,000 ft NOISE MONITORING LOCATIONS
P:\GIS\Projects\2R4\MXD\2R4_Exhibit5-1_NoiseMonitoringLocations_20190904.mxd
Existing Condition (2018) Noise Analysis Aircraft Noise Exposure
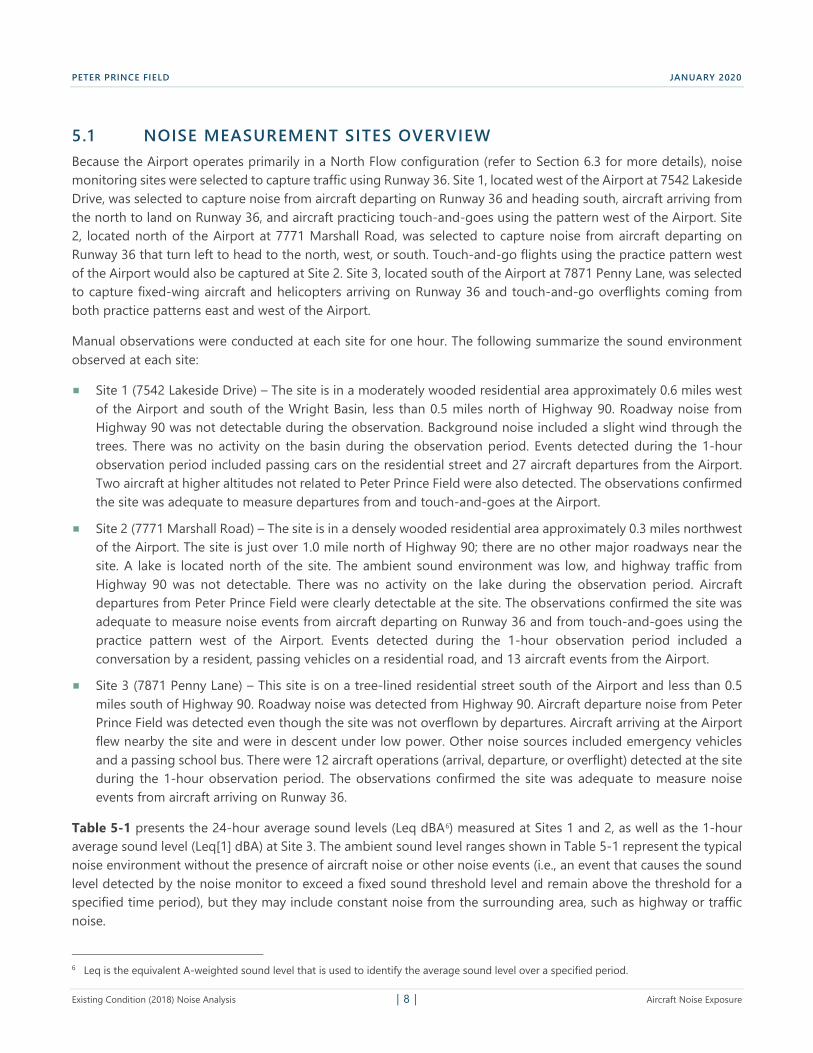
PETER PRINCE FIELD JANUARY 2020
5.1 NOISE MEASUREMENT SITES OVERVIEW Because the Airport operates primarily in a North Flow configuration (refer to Section 6.3 for more details), noise monitoring sites were selected to capture traffic using Runway 36. Site 1, located west of the Airport at 7542 Lakeside Drive, was selected to capture noise from aircraft departing on Runway 36 and heading south, aircraft arriving from the north to land on Runway 36, and aircraft practicing touch-and-goes using the pattern west of the Airport. Site 2, located north of the Airport at 7771 Marshall Road, was selected to capture noise from aircraft departing on Runway 36 that turn left to head to the north, west, or south. Touch-and-go flights using the practice pattern west of the Airport would also be captured at Site 2. Site 3, located south of the Airport at 7871 Penny Lane, was selected to capture fixed-wing aircraft and helicopters arriving on Runway 36 and touch-and-go overflights coming from both practice patterns east and west of the Airport.
Manual observations were conducted at each site for one hour. The following summarize the sound environment observed at each site:
Site 1 (7542 Lakeside Drive) – The site is in a moderately wooded residential area approximately 0.6 miles west of the Airport and south of the Wright Basin, less than 0.5 miles north of Highway 90. Roadway noise from Highway 90 was not detectable during the observation. Background noise included a slight wind through the trees. There was no activity on the basin during the observation period. Events detected during the 1-hour observation period included passing cars on the residential street and 27 aircraft departures from the Airport. Two aircraft at higher altitudes not related to Peter Prince Field were also detected. The observations confirmed the site was adequate to measure departures from and touch-and-goes at the Airport.
Site 2 (7771 Marshall Road) – The site is in a densely wooded residential area approximately 0.3 miles northwest of the Airport. The site is just over 1.0 mile north of Highway 90; there are no other major roadways near the site. A lake is located north of the site. The ambient sound environment was low, and highway traffic from Highway 90 was not detectable. There was no activity on the lake during the observation period. Aircraft departures from Peter Prince Field were clearly detectable at the site. The observations confirmed the site was adequate to measure noise events from aircraft departing on Runway 36 and from touch-and-goes using the practice pattern west of the Airport. Events detected during the 1-hour observation period included a conversation by a resident, passing vehicles on a residential road, and 13 aircraft events from the Airport.
Site 3 (7871 Penny Lane) – This site is on a tree-lined residential street south of the Airport and less than 0.5 miles south of Highway 90. Roadway noise was detected from Highway 90. Aircraft departure noise from Peter Prince Field was detected even though the site was not overflown by departures. Aircraft arriving at the Airport flew nearby the site and were in descent under low power. Other noise sources included emergency vehicles and a passing school bus. There were 12 aircraft operations (arrival, departure, or overflight) detected at the site during the 1-hour observation period. The observations confirmed the site was adequate to measure noise events from aircraft arriving on Runway 36.
Table 5-1 presents the 24-hour average sound levels (Leq dBA6) measured at Sites 1 and 2, as well as the 1-hour average sound level (Leq[1] dBA) at Site 3. The ambient sound level ranges shown in Table 5-1 represent the typical noise environment without the presence of aircraft noise or other noise events (i.e., an event that causes the sound level detected by the noise monitor to exceed a fixed sound threshold level and remain above the threshold for a specified time period), but they may include constant noise from the surrounding area, such as highway or traffic noise.
6 Leq is the equivalent A-weighted sound level that is used to identify the average sound level over a specified period.
Existing Condition (2018) Noise Analysis | 8 | Aircraft Noise Exposure

PETER PRINCE FIELD JANUARY 2020
TABLE 5-1 : NOISE MONITORING RESULTS
SITE NUMBER (ADDRESS) MEASUREMENT TIME/DATES AMBIENT LEVEL (DBA) LEQ(DBA)
1 (7542 Lakeside Drive) 12/4/18 (11:00 a.m.) – 12/5/18 (12:00 p.m.) 42–48 52.01
2 (7771 Marshall Road) 12/4/18 (12:00 p.m.) – 12/5/18 (12:48 p.m.) 39–43 55.91
3 (7871 Penny Lane) 12/5/18 (1:00 p.m. – 2:00 p.m.) 45–48 52.32
NOTES: 1 Average sound level (Leq dBA) is based on the 24-hour logarithmic average of monitored sound levels. 2 Average sound level (Leq dBA) is based on the 1-hour logarithmic average of monitored sound levels. SOURCE: Barry Technologies Inc., December 2018.
5.2 MEASURED AVERAGE SOUND LEVELS Average hourly sound levels were calculated using the 24-hour sound levels recorded at Sites 1 and 2. As depicted on Exhibit 5-2 and Exhibit 5-3, average sound levels varied on an hourly basis, especially between daytime and nighttime hours. Sound levels are lower during nighttime hours due to reduced activity in the vicinity of each site (e.g., surrounding roadway noise, aircraft overflights). Average sound levels were above 50 Leq(1) dBA between 8:00 a.m. and 6:00 p.m. at Site 1 and between 8:00 a.m. and 7:00 p.m. at Site 2. Average hourly sound levels decreased below 50 Leq(1) dBA between 7:00 p.m. and 7:00 a.m. at Site 1 and between 8:00 p.m. and 7:00 a.m. at Site 2. At both sites, average hourly sound levels were near or below 40 Leq(1) dBA between 10:00 p.m. and 5:00 a.m. The measured sound patterns over the 24-hour periods at both sites are indicative of typical GA activity that takes place primarily between sunrise and sunset. The average hourly sound levels measured during the daytime hours are also associated with other non-aircraft activity, which diminishes during nighttime hours (e.g., nearby roadway noise). The 24-hour average sound level measured at both sites exceeded 50 Leq dBA. This was an anticipated result, as 13 of the 24 hours were measured with levels above 50 Leq dBA.
DNL weights the sound energy between 10:00 p.m. and 6:59 a.m. by 10 dBA to account for sensitivity to noise during the nighttime hours. Exhibits 5-2 and 5-3 depict the DNL values measured at Sites 1 and 2, respectively. DNL was calculated using the measured Leq values for each hour and applying the 10-dBA weighting to the nighttime hours (shown in grey on the exhibits). The calculated values are DNL 52.6 dBA at Site 1 and DNL 56.2 dBA at Site 2. The DNL values at both sites are slightly higher than the Leq levels due to the nighttime weighting, but they remained close to the Leq levels because most of the sound energy occurred during the daytime hours.
Sound levels were measured for a 1-hour period at Site 3; therefore, the calculation of an average sound level for 24 hours was not possible. Exhibit 5-4 shows the average sound levels for each minute (1-minute Leq dBA) based on the 1-hour sound energy measured at Site 3. Sound levels were equal to or higher than 50 Leq dBA for 23 of the 60 minutes measured, or 38 percent of the time. The average sound levels for each minute ranged between 43 and 62 Leq dBA. The variance in the range is due to fluctuations in sound levels caused by noise events, such as aircraft arriving on Runway 36 and passing vehicles.
5.3 MEASURED NOISE EVENTS The monitors distinguish noise events based on a set threshold above the ambient sound level and a set length of time that the sound level exceeds the threshold (duration). For Sites 1 and 2, the threshold was 49 dBA and the duration was set at 9 seconds. The threshold for Site 3 was set at 50 dBA and the duration was set at 9 seconds. Noise events ranged from 7.3 to 16.9 dBA higher than the threshold, with the greatest difference attributed to aircraft noise occurring at Site 2.
Existing Condition (2018) Noise Analysis | 9 | Aircraft Noise Exposure
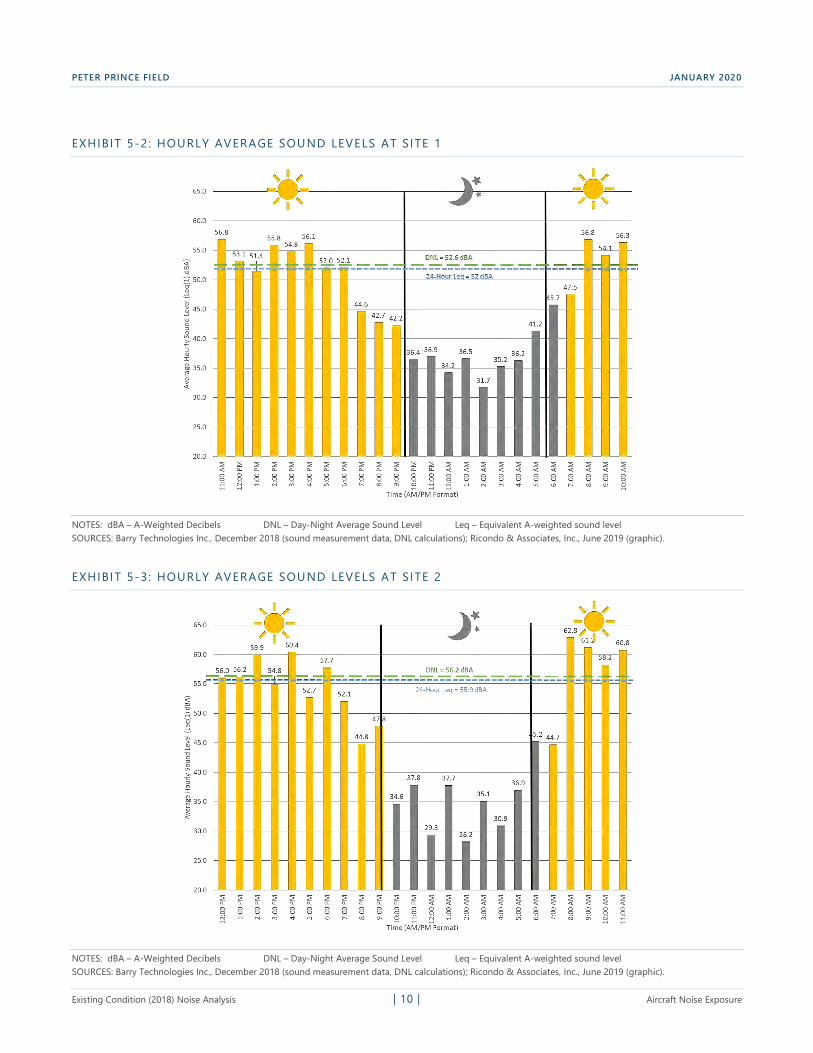
PETER PRINCE FIELD JANUARY 2020
EXHIBIT 5-2: HOURLY AVERAGE SOUND LEVELS AT SITE 1
NOTES: dBA – A-Weighted Decibels DNL – Day-Night Average Sound Level Leq – Equivalent A-weighted sound level SOURCES: Barry Technologies Inc., December 2018 (sound measurement data, DNL calculations); Ricondo & Associates, Inc., June 2019 (graphic).
EXHIBIT 5-3: HOURLY AVERAGE SOUND LEVELS AT SITE 2
NOTES: dBA – A-Weighted Decibels DNL – Day-Night Average Sound Level Leq – Equivalent A-weighted sound level SOURCES: Barry Technologies Inc., December 2018 (sound measurement data, DNL calculations); Ricondo & Associates, Inc., June 2019 (graphic).
Existing Condition (2018) Noise Analysis | 10 | Aircraft Noise Exposure
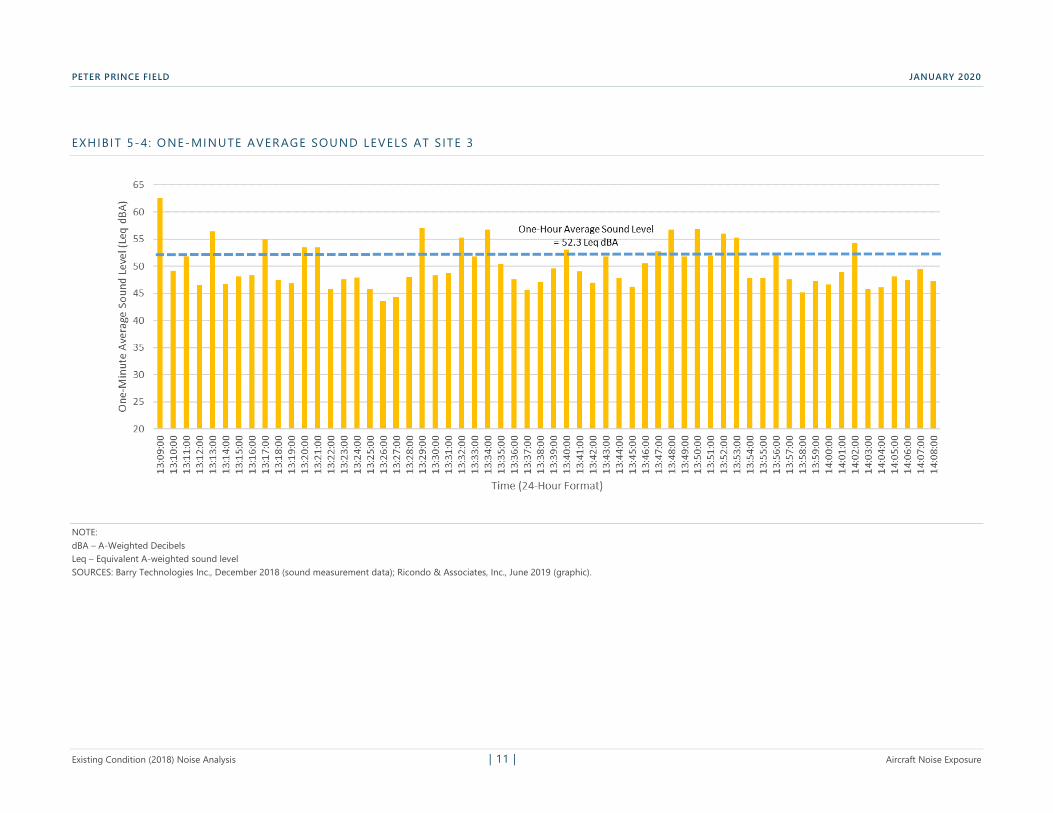
PETER PRINCE FIELD JANUARY 2020
EXHIBIT 5-4: ONE-MINUTE AVERAGE SOUND LEVELS AT S ITE 3
NOTE: dBA – A-Weighted Decibels Leq – Equivalent A-weighted sound level SOURCES: Barry Technologies Inc., December 2018 (sound measurement data); Ricondo & Associates, Inc., June 2019 (graphic).
Existing Condition (2018) Noise Analysis | 11 | Aircraft Noise Exposure

PETER PRINCE FIELD JANUARY 2020
Exhibit 5-5 shows the number of noise events that exceeded the 49-dBA event threshold for each hour of the monitoring period at Site 1. During the 1-hour observation period between 11:00 a.m. and 12:00 p.m., 27 of the 36 registered noise events were observed, including 24 aircraft events and 3 passing vehicle events. The hours during which the number of noise events above the threshold was at or below 15 were between 7:00 p.m. and 6:00 a.m. Compared to the average hourly sound level patterns at Site 1 (see Exhibit 5-2), those hours generally corresponded with the hours during which the average sound level was equal to or lower than 50 Leq dBA with the exception of the 7:00 a.m. hour when 16 noise events were recorded and the hourly average Leq dBA level was lower than 50 Leq dBA
Exhibit 5-6 shows the number of noise events that exceeded the 49-dBA event threshold for each hour of the monitoring period at Site 2. The types of events occurring at the site varied. During the observation period between 12:00 p.m. and 12:47 p.m., all the registered noise events were observed, including 13 aircraft events, 3 passing vehicle events, and 1 conversation event by a resident. The hours during which the number of noise events above the threshold was at or below 15 were between 7:00 p.m. and 7:00 a.m. Compared to the average hourly sound level patterns at Site 2 (see Exhibit 5-3), those hours generally corresponded with the hours during which the average sound level was equal to or lower than 50 Leq dBA with the exception of the 7:00 p.m. hour when 12 events were recorded and the hourly average Leq dBA level was above 50 Leq dBA.
At Site 3, sound levels were at or above 47.8 dBA 50 percent of the time during the 1-hour monitoring period. The average sound level for each noise event ranged between 7.8 and 18.0 dBA above 47.8 dBA. Exhibit 5-7 shows 15 noise events that exceeded the 50-dBA noise event threshold for the 1-hour period. During the 1-hour period of manual observations at the site, noise events observed included 12 aircraft events, 2 passing vehicle events, and 1 combined aircraft and passing vehicle event
Detailed results from the noise monitoring study are provided in Appendix A.
6. AIRCRAFT OPERATIONS Several types of information are required to produce DNL contours for aircraft operations at an airport. These include estimates of the numbers of operations by specific aircraft types during the daytime (7:00 a.m. to 10:00 p.m.) and nighttime (10:00 p.m. to 7:00 a.m.) periods, flight track locations, flight track and runway use, and aircraft operating characteristics. The Airport serves mainly GA and military operations. The numbers and characteristics of aircraft operating at the Airport for 2018 conditions are described in this section, including:
annual aircraft operations
average annual daily aircraft operations
fleet mix
runway use
flight track locations and use
Existing Condition (2018) Noise Analysis | 12 | Aircraft Noise Exposure
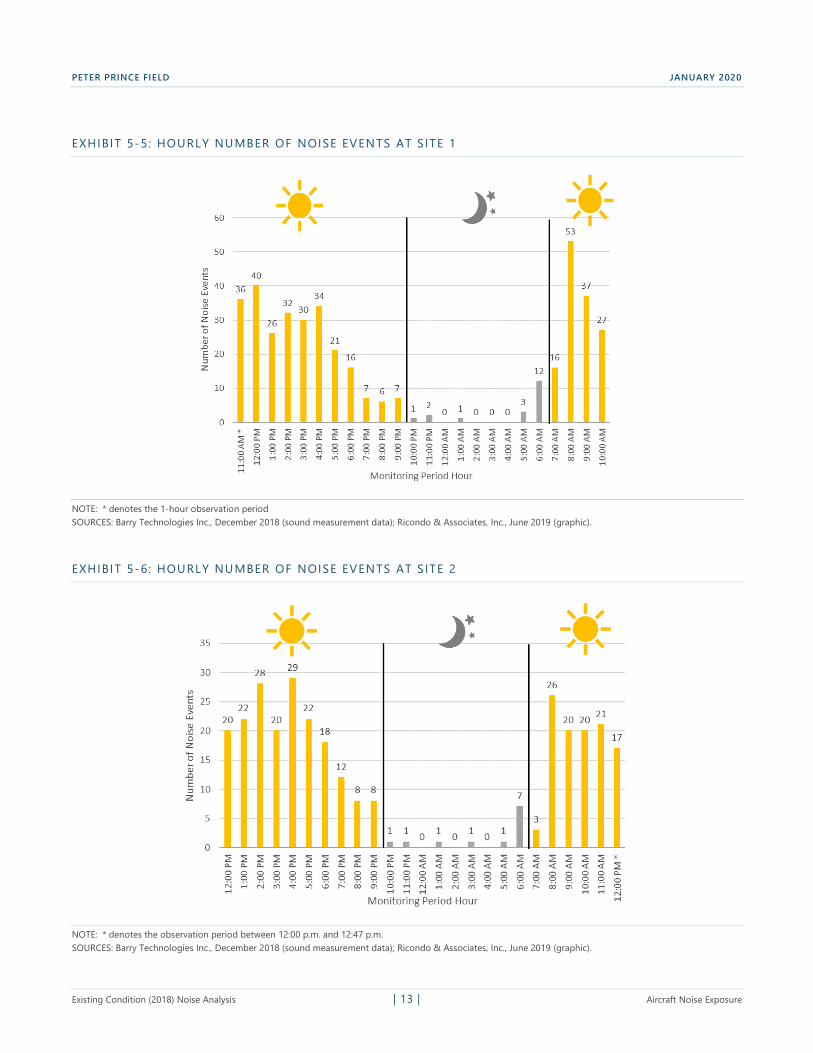
PETER PRINCE FIELD JANUARY 2020
EXHIBIT 5-5: HOURLY NUMBER OF NOISE EVENTS AT S ITE 1
NOTE: * denotes the 1-hour observation period SOURCES: Barry Technologies Inc., December 2018 (sound measurement data); Ricondo & Associates, Inc., June 2019 (graphic).
EXHIBIT 5-6: HOURLY NUMBER OF NOISE EVENTS AT S ITE 2
NOTE: * denotes the observation period between 12:00 p.m. and 12:47 p.m. SOURCES: Barry Technologies Inc., December 2018 (sound measurement data); Ricondo & Associates, Inc., June 2019 (graphic).
Existing Condition (2018) Noise Analysis | 13 | Aircraft Noise Exposure
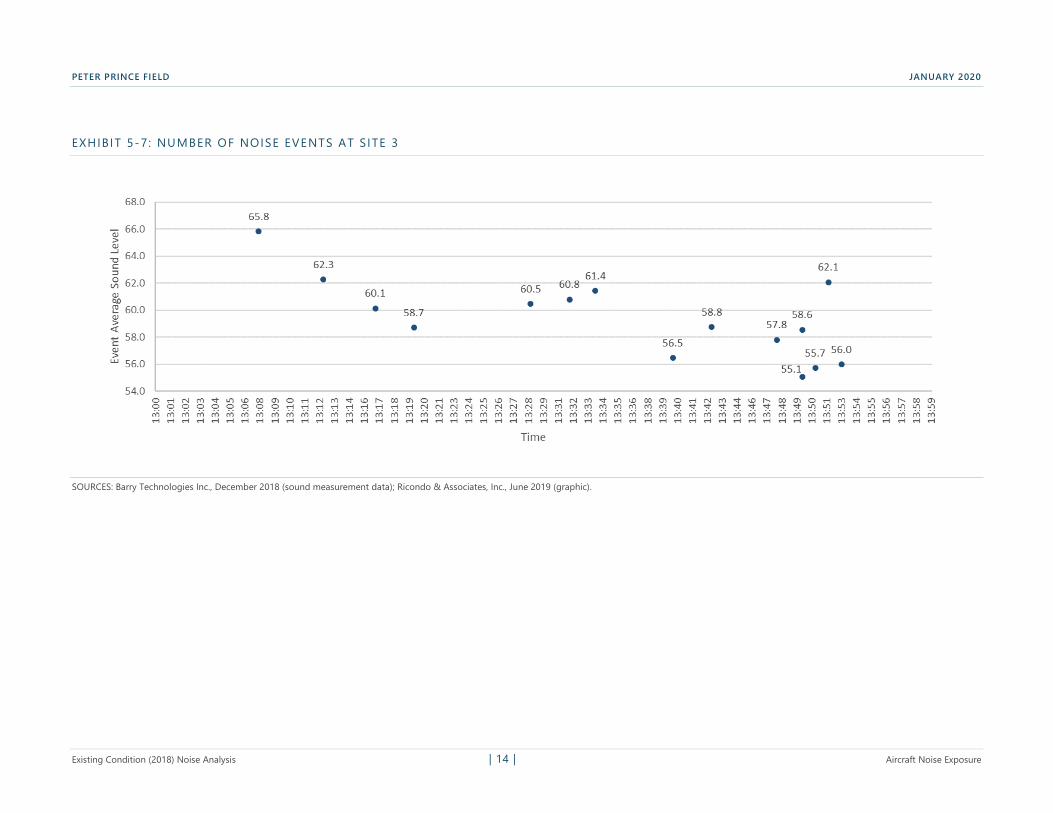
PETER PRINCE FIELD JANUARY 2020
EXHIBIT 5-7: NUMBER OF NOISE EVENTS AT SITE 3
SOURCES: Barry Technologies Inc., December 2018 (sound measurement data); Ricondo & Associates, Inc., June 2019 (graphic).
Existing Condition (2018) Noise Analysis | 14 | Aircraft Noise Exposure
PETER PRINCE FIELD JANUARY 2020
These data were input into the AEDT model to produce the 2018 noise exposure contours.
The data used for much of this analysis were obtained from the 2018 FAA Terminal Area Forecast (TAF),7 discussions with Santa Rosa County representatives, FBO input, and flight school staff, as well as from data provided as part of the 2014 Airport Master Plan Update and the 2001 Airport DNL contours. The most recent comprehensive list of based aircraft at the Airport was provided by Santa Rosa County staff.
6.1 ANNUAL AIRCRAFT OPERATIONS Aircraft operations include all takeoffs, landings, and touch-and-goes at an airport. They may be categorized as either itinerant or local. Local operations are those conducted by aircraft that generally remain in the local traffic pattern, such as touch-and-go operations. Itinerant operations are those that land at an airport, arriving from outside the airport area, or take off from an airport and leave the airport area.
The FAA also records operations in four user categories: air carrier, air taxi, GA, and military.8
Due to the lack of an airport traffic control tower (ATCT) at the Airport, actual operation counts were not available. The most reliable and available source for operation counts at the Airport is the TAF.9 The most recent version of the TAF at the time this study was conducted was the 2018 TAF. The last year reported with actual counts was fiscal year (FY) 2016.10 Because the last actual counts were two years old and the analysis was intended to reflect 2018 conditions, Santa Rosa County staff decided to use the FY 2018 forecast annual operation counts from the 2018 TAF to represent existing conditions.
The 2018 FAA TAF included 98,510 annual operations, corresponding to approximately 269.89 average daily operations for FY 2018. The 2018 TAF includes 8.2 percent of the total operations being itinerant and 91.8 percent local. The majority, or 96 percent of total operations at the Airport, were forecast to be GA. The TAF indicated itinerant military operations made up less than 1.0 percent of total itinerant operations and zero local operations. Based on discussions with Santa Rosa County staff, military helicopter training takes place at the Airport, and should be accounted for as local operations conducting touch-and-goes in the noise model.
At the request of Santa Rosa County staff, the 2018 TAF user category distribution was refined to account for the local military training operations. The total annual aircraft operations for FY 2018 remained the same, but some of the local civil GA counts were allocated to local military based on Santa Rosa County staff input. Santa Rosa County
7 The Terminal Area Forecast (TAF) is the official FAA forecast of aviation activity for US airports. Forecasts are prepared for major users of the National Airspace System, including air carrier, air taxi/commuter, general aviation, and military. The forecasts are prepared to meet the budget and planning needs of the FAA and to provide information for use by state and local authorities, the aviation industry, and the public. The forecasts are reported in fiscal years, ending on September 30.
8 Air Carrier – commercial aircraft with seating capacities of more than 60 passengers, or a maximum payload capacity of more than 18,000 pounds carrying passengers or cargo
Air Taxi – commercial and for-hire aircraft with maximum seating capacities of 60 passengers, or a maximum payload capacity of 18,000 pounds of cargo for hire or compensation
General Aviation – noncommercial, civil aircraft operations
Military – aircraft operated by any branch of the US armed services 9 US Department of Transportation, Federal Aviation Administration, Terminal Area Forecast 2018, https://taf.faa.gov/Home/RunReport
(accessed January 7, 2019). 10 The FAA fiscal year is the period beginning October 1 and ending September 30 of the following year.
Existing Condition (2018) Noise Analysis | 15 | Aircraft Noise Exposure
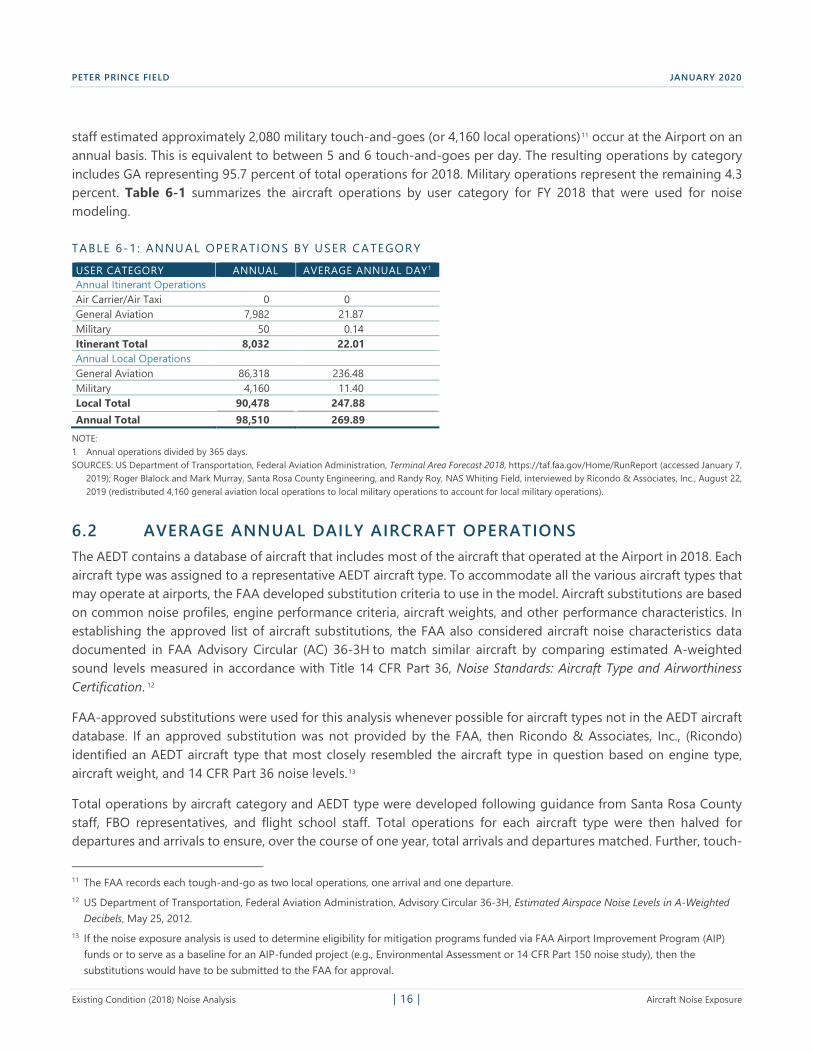
PETER PRINCE FIELD JANUARY 2020
staff estimated approximately 2,080 military touch-and-goes (or 4,160 local operations)11 occur at the Airport on an annual basis. This is equivalent to between 5 and 6 touch-and-goes per day. The resulting operations by category includes GA representing 95.7 percent of total operations for 2018. Military operations represent the remaining 4.3 percent. Table 6-1 summarizes the aircraft operations by user category for FY 2018 that were used for noise modeling.
TABLE 6-1 : ANNUAL OPERATIONS BY USER CATEGORY
USER CATEGORY ANNUAL AVERAGE ANNUAL DAY1
Annual Itinerant Operations Air Carrier/Air Taxi 0 0 General Aviation 7,982 21.87 Military 50 0.14 Itinerant Total 8,032 22.01 Annual Local Operations General Aviation 86,318 236.48 Military 4,160 11.40 Local Total 90,478 247.88 Annual Total 98,510 269.89
NOTE: 1 Annual operations divided by 365 days. SOURCES: US Department of Transportation, Federal Aviation Administration, Terminal Area Forecast 2018, https://taf.faa.gov/Home/RunReport (accessed January 7,
2019); Roger Blalock and Mark Murray, Santa Rosa County Engineering, and Randy Roy, NAS Whiting Field, interviewed by Ricondo & Associates, Inc., August 22, 2019 (redistributed 4,160 general aviation local operations to local military operations to account for local military operations).
6.2 AVERAGE ANNUAL DAILY AIRCRAFT OPERATIONS The AEDT contains a database of aircraft that includes most of the aircraft that operated at the Airport in 2018. Each aircraft type was assigned to a representative AEDT aircraft type. To accommodate all the various aircraft types that may operate at airports, the FAA developed substitution criteria to use in the model. Aircraft substitutions are based on common noise profiles, engine performance criteria, aircraft weights, and other performance characteristics. In establishing the approved list of aircraft substitutions, the FAA also considered aircraft noise characteristics data documented in FAA Advisory Circular (AC) 36-3H to match similar aircraft by comparing estimated A-weighted sound levels measured in accordance with Title 14 CFR Part 36, Noise Standards: Aircraft Type and Airworthiness Certification. 12
FAA-approved substitutions were used for this analysis whenever possible for aircraft types not in the AEDT aircraft database. If an approved substitution was not provided by the FAA, then Ricondo & Associates, Inc., (Ricondo) identified an AEDT aircraft type that most closely resembled the aircraft type in question based on engine type, aircraft weight, and 14 CFR Part 36 noise levels.13
Total operations by aircraft category and AEDT type were developed following guidance from Santa Rosa County staff, FBO representatives, and flight school staff. Total operations for each aircraft type were then halved for departures and arrivals to ensure, over the course of one year, total arrivals and departures matched. Further, touch-
11 The FAA records each tough-and-go as two local operations, one arrival and one departure. 12 US Department of Transportation, Federal Aviation Administration, Advisory Circular 36-3H, Estimated Airspace Noise Levels in A-Weighted
Decibels, May 25, 2012. 13 If the noise exposure analysis is used to determine eligibility for mitigation programs funded via FAA Airport Improvement Program (AIP)
funds or to serve as a baseline for an AIP-funded project (e.g., Environmental Assessment or 14 CFR Part 150 noise study), then the substitutions would have to be submitted to the FAA for approval.
Existing Condition (2018) Noise Analysis | 16 | Aircraft Noise Exposure
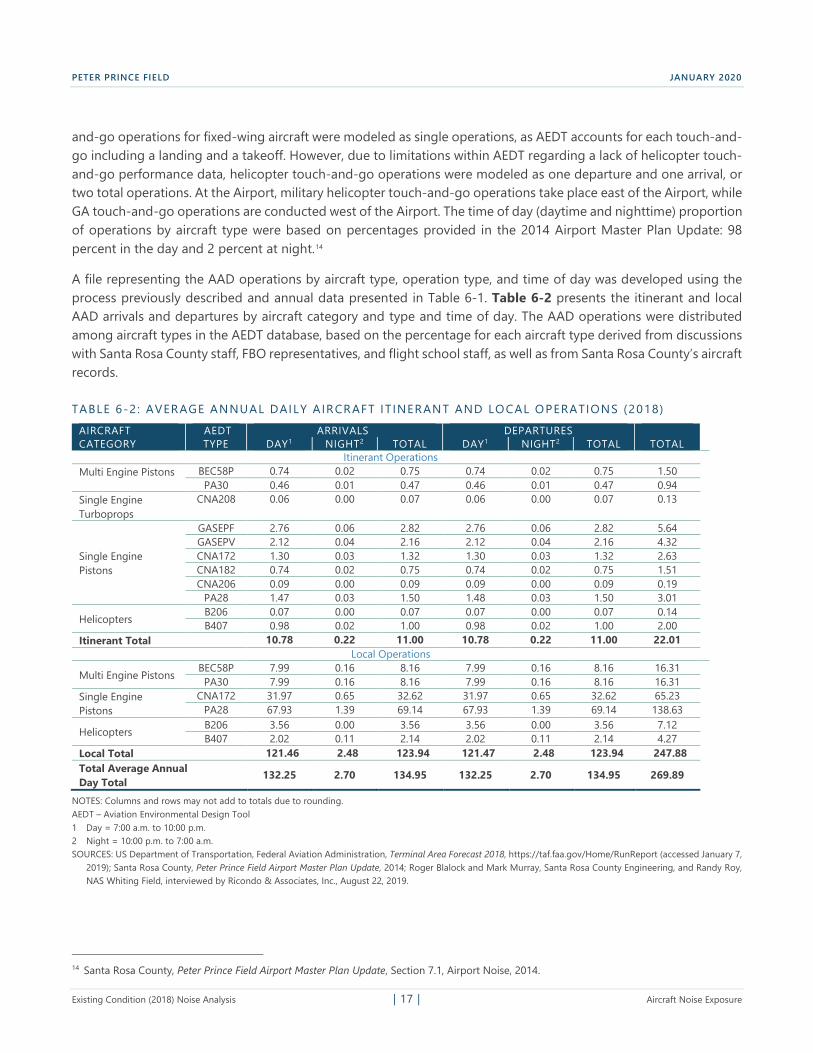
PETER PRINCE FIELD JANUARY 2020
and-go operations for fixed-wing aircraft were modeled as single operations, as AEDT accounts for each touch-and-go including a landing and a takeoff. However, due to limitations within AEDT regarding a lack of helicopter touch-and-go performance data, helicopter touch-and-go operations were modeled as one departure and one arrival, or two total operations. At the Airport, military helicopter touch-and-go operations take place east of the Airport, while GA touch-and-go operations are conducted west of the Airport. The time of day (daytime and nighttime) proportion of operations by aircraft type were based on percentages provided in the 2014 Airport Master Plan Update: 98 percent in the day and 2 percent at night.14
A file representing the AAD operations by aircraft type, operation type, and time of day was developed using the process previously described and annual data presented in Table 6-1. Table 6-2 presents the itinerant and local AAD arrivals and departures by aircraft category and type and time of day. The AAD operations were distributed among aircraft types in the AEDT database, based on the percentage for each aircraft type derived from discussions with Santa Rosa County staff, FBO representatives, and flight school staff, as well as from Santa Rosa County’s aircraft records.
TABLE 6-2 : AVERAGE ANNUAL DAILY AIRCRAFT IT INERANT AND LOCAL OPERATIONS (2018)
AIRCRAFT CATEGORY
AEDT TYPE
ARRIVALS DEPARTURES DAY1 NIGHT2 TOTAL DAY1 NIGHT2 TOTAL TOTAL
Itinerant Operations Multi Engine Pistons BEC58P 0.74 0.02 0.75 0.74 0.02 0.75 1.50
PA30 0.46 0.01 0.47 0.46 0.01 0.47 0.94 Single Engine CNA208 0.06 0.00 0.07 0.06 0.00 0.07 0.13 Turboprops
GASEPF 2.76 0.06 2.82 2.76 0.06 2.82 5.64 GASEPV 2.12 0.04 2.16 2.12 0.04 2.16 4.32
Single Engine CNA172 1.30 0.03 1.32 1.30 0.03 1.32 2.63 Pistons CNA182 0.74 0.02 0.75 0.74 0.02 0.75 1.51
CNA206 0.09 0.00 0.09 0.09 0.00 0.09 0.19 PA28 1.47 0.03 1.50 1.48 0.03 1.50 3.01
Helicopters B206 B407
0.07 0.98
0.00 0.02
0.07 1.00
0.07 0.98
0.00 0.02
0.07 1.00
0.14 2.00
Itinerant Total 10.78 0.22 11.00 10.78 0.22 11.00 22.01 Local Operations
Multi Engine Pistons BEC58P PA30
7.99 7.99
0.16 0.16
8.16 8.16
7.99 7.99
0.16 0.16
8.16 8.16
16.31 16.31
Single Engine CNA172 31.97 0.65 32.62 31.97 0.65 32.62 65.23 Pistons PA28 67.93 1.39 69.14 67.93 1.39 69.14 138.63
Helicopters B206 B407
3.56 2.02
0.00 0.11
3.56 2.14
3.56 2.02
0.00 0.11
3.56 2.14
7.12 4.27
Local Total 121.46 2.48 123.94 121.47 2.48 123.94 247.88 Total Average Annual Day Total
132.25 2.70 134.95 132.25 2.70 134.95 269.89
NOTES: Columns and rows may not add to totals due to rounding. AEDT – Aviation Environmental Design Tool 1 Day = 7:00 a.m. to 10:00 p.m. 2 Night = 10:00 p.m. to 7:00 a.m. SOURCES: US Department of Transportation, Federal Aviation Administration, Terminal Area Forecast 2018, https://taf.faa.gov/Home/RunReport (accessed January 7,
2019); Santa Rosa County, Peter Prince Field Airport Master Plan Update, 2014; Roger Blalock and Mark Murray, Santa Rosa County Engineering, and Randy Roy, NAS Whiting Field, interviewed by Ricondo & Associates, Inc., August 22, 2019.
14 Santa Rosa County, Peter Prince Field Airport Master Plan Update, Section 7.1, Airport Noise, 2014.
Existing Condition (2018) Noise Analysis | 17 | Aircraft Noise Exposure
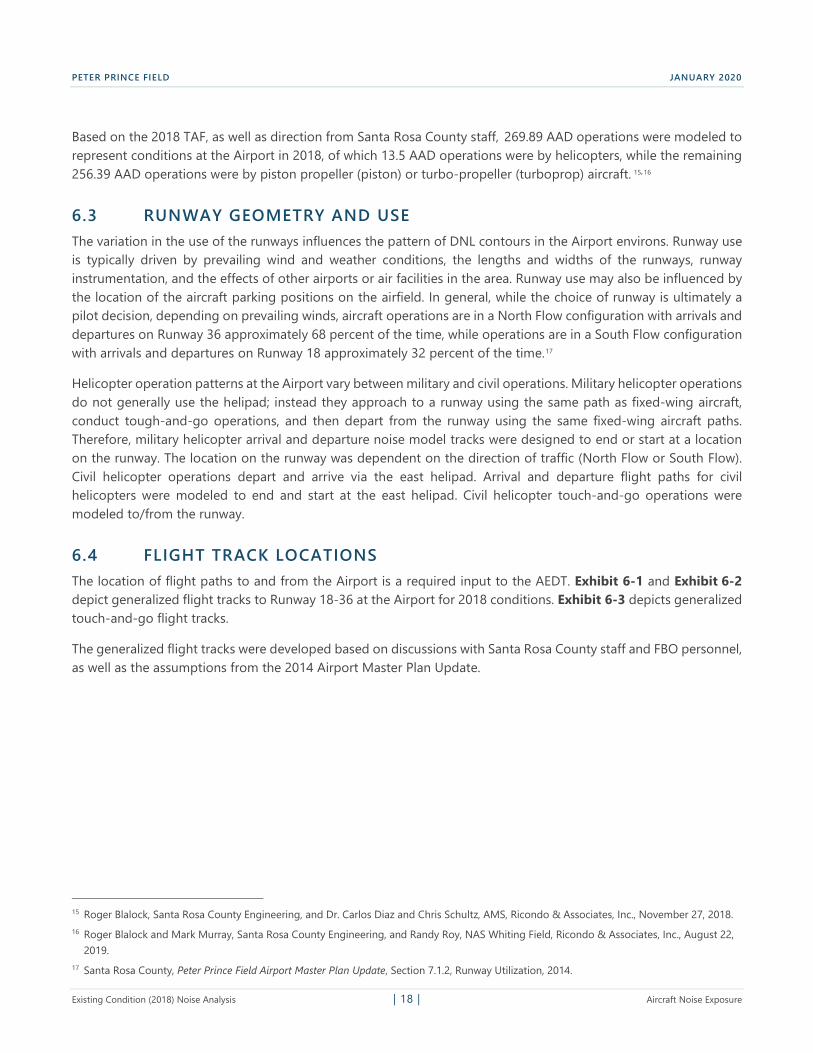
PETER PRINCE FIELD JANUARY 2020
Based on the 2018 TAF, as well as direction from Santa Rosa County staff, 269.89 AAD operations were modeled to represent conditions at the Airport in 2018, of which 13.5 AAD operations were by helicopters, while the remaining 256.39 AAD operations were by piston propeller (piston) or turbo-propeller (turboprop) aircraft. 15,16
6.3 RUNWAY GEOMETRY AND USE The variation in the use of the runways influences the pattern of DNL contours in the Airport environs. Runway use is typically driven by prevailing wind and weather conditions, the lengths and widths of the runways, runway instrumentation, and the effects of other airports or air facilities in the area. Runway use may also be influenced by the location of the aircraft parking positions on the airfield. In general, while the choice of runway is ultimately a pilot decision, depending on prevailing winds, aircraft operations are in a North Flow configuration with arrivals and departures on Runway 36 approximately 68 percent of the time, while operations are in a South Flow configuration with arrivals and departures on Runway 18 approximately 32 percent of the time.17
Helicopter operation patterns at the Airport vary between military and civil operations. Military helicopter operations do not generally use the helipad; instead they approach to a runway using the same path as fixed-wing aircraft, conduct tough-and-go operations, and then depart from the runway using the same fixed-wing aircraft paths. Therefore, military helicopter arrival and departure noise model tracks were designed to end or start at a location on the runway. The location on the runway was dependent on the direction of traffic (North Flow or South Flow). Civil helicopter operations depart and arrive via the east helipad. Arrival and departure flight paths for civil helicopters were modeled to end and start at the east helipad. Civil helicopter touch-and-go operations were modeled to/from the runway.
6.4 FLIGHT TRACK LOCATIONS The location of flight paths to and from the Airport is a required input to the AEDT. Exhibit 6-1 and Exhibit 6-2 depict generalized flight tracks to Runway 18-36 at the Airport for 2018 conditions. Exhibit 6-3 depicts generalized touch-and-go flight tracks.
The generalized flight tracks were developed based on discussions with Santa Rosa County staff and FBO personnel, as well as the assumptions from the 2014 Airport Master Plan Update.
15 Roger Blalock, Santa Rosa County Engineering, and Dr. Carlos Diaz and Chris Schultz, AMS, Ricondo & Associates, Inc., November 27, 2018. 16 Roger Blalock and Mark Murray, Santa Rosa County Engineering, and Randy Roy, NAS Whiting Field, Ricondo & Associates, Inc., August 22,
2019. 17 Santa Rosa County, Peter Prince Field Airport Master Plan Update, Section 7.1.2, Runway Utilization, 2014.
Existing Condition (2018) Noise Analysis | 18 | Aircraft Noise Exposure
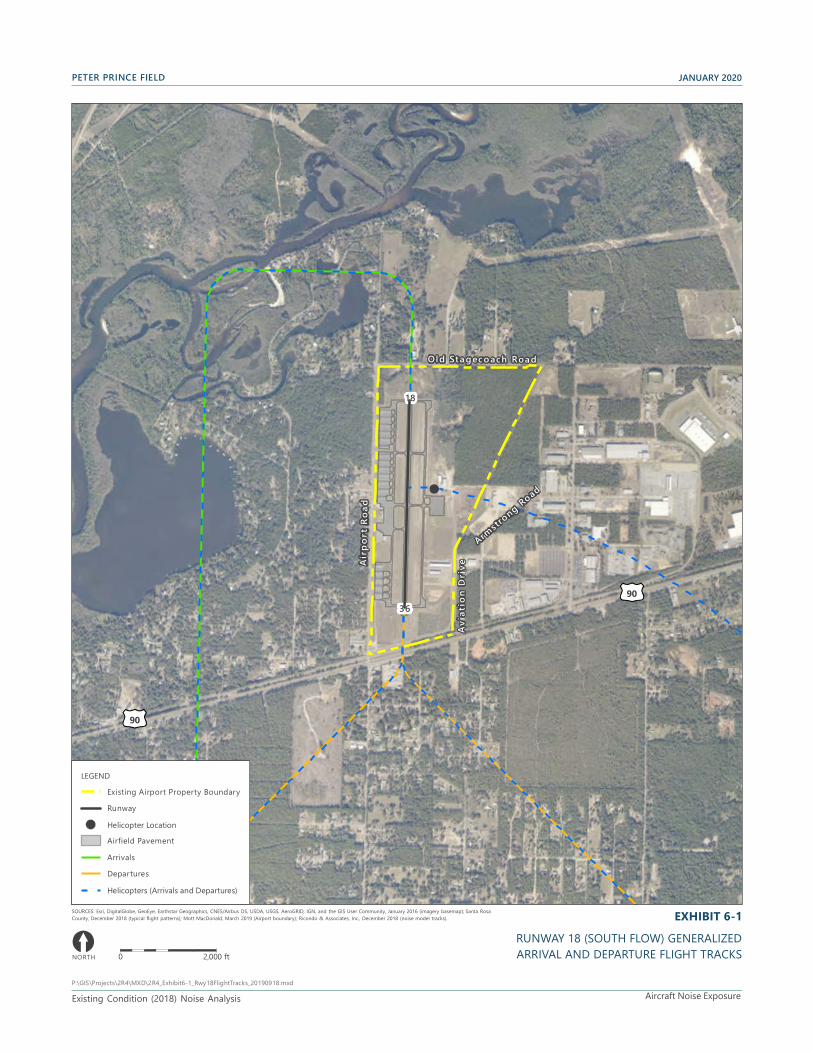
PETER PRINCE FIELD JANUARY 2020
!(
18
36£¤90
£¤90
Airp
ort R
oad
O ld Sta gecoach Roa d
Armstro
ng Road
Avia
tion
Driv
e
LEGEND
Existing Airport Property Boundary
Runway
!( Helicopter Location
Airfield Pavement
Arrivals
Departures
Helicopters (Arrivals and Departures)
SOURCES: Esri, DigitalGlobe, GeoEye, Earthstar Geographics, CNES/Airbus DS, USDA, USGS, AeroGRID, IGN, and the GIS User Community, January 2016 (imagery basemap); Santa Rosa County, December 2018 (typical flight patterns); Mott MacDonald, March 2019 (Airport boundary); Ricondo & Associates, Inc., December 2018 (noise model tracks). EXHIBIT 6-1
[ NORTH 0 2,000 ft
RUNWAY 18 (SOUTH FLOW) GENERALIZED ARRIVAL AND DEPARTURE FLIGHT TRACKS
P:\GIS\Projects\2R4\MXD\2R4_Exhibit6-1_Rwy18FlightTracks_20190918.mxd
Existing Condition (2018) Noise Analysis Aircraft Noise Exposure
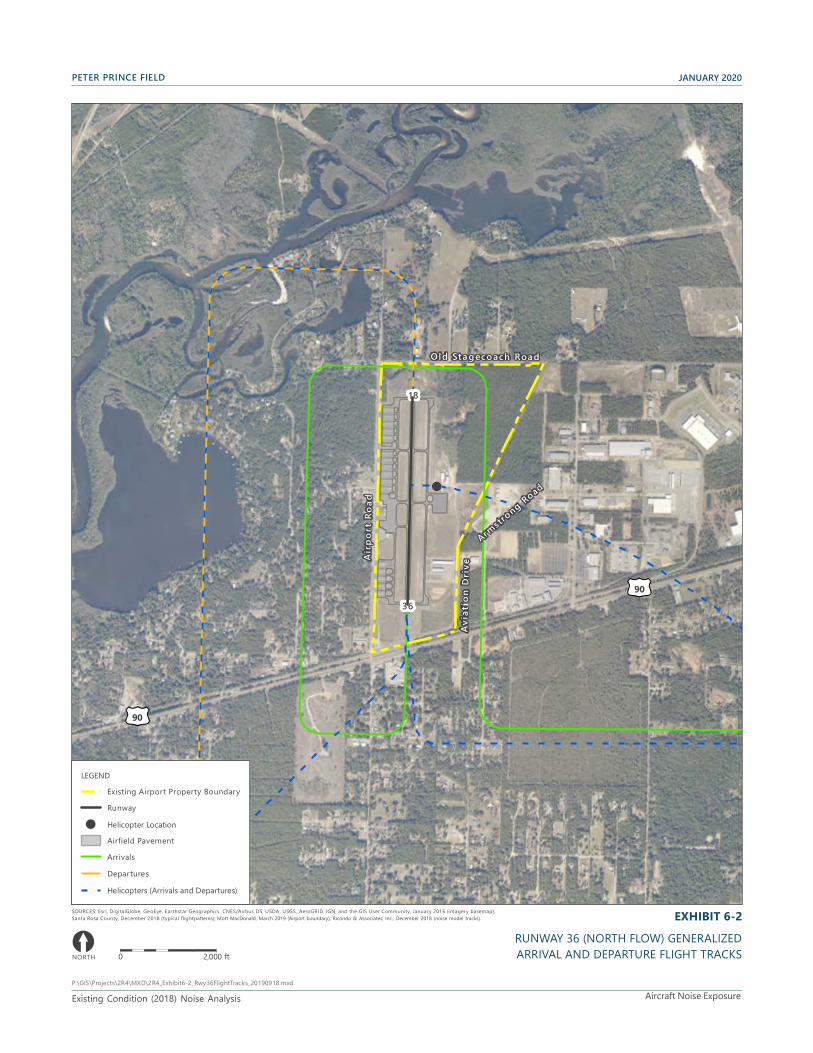
PETER PRINCE FIELD JANUARY 2020
!(
18
36£¤90
£¤90
Airp
ort R
oad
O ld Sta gecoach Roa d
Armstro
ng Road Av
iatio
n Dr
ive
LEGEND
Existing Airport Property Boundary
Runway
!( Helicopter Location
Airfield Pavement
Arrivals
Departures
Helicopters (Arrivals and Departures)
SOURCES: Esri, DigitalGlobe, GeoEye, Earthstar Geographics, CNES/Airbus DS, USDA, USGS, AeroGRID, IGN, and the GIS User Community, January 2016 (imagery basemap); Santa Rosa County, December 2018 (typical flightpatterns); Mott MacDonald, March 2019 (Airport boundary); Ricondo & Associates, Inc., December 2018 (noise model tracks). EXHIBIT 6-2
[ NORTH 0 2,000 ft
RUNWAY 36 (NORTH FLOW) GENERALIZED ARRIVAL AND DEPARTURE FLIGHT TRACKS
P:\GIS\Projects\2R4\MXD\2R4_Exhibit6-2_Rwy36FlightTracks_20190918.mxd
Existing Condition (2018) Noise Analysis Aircraft Noise Exposure
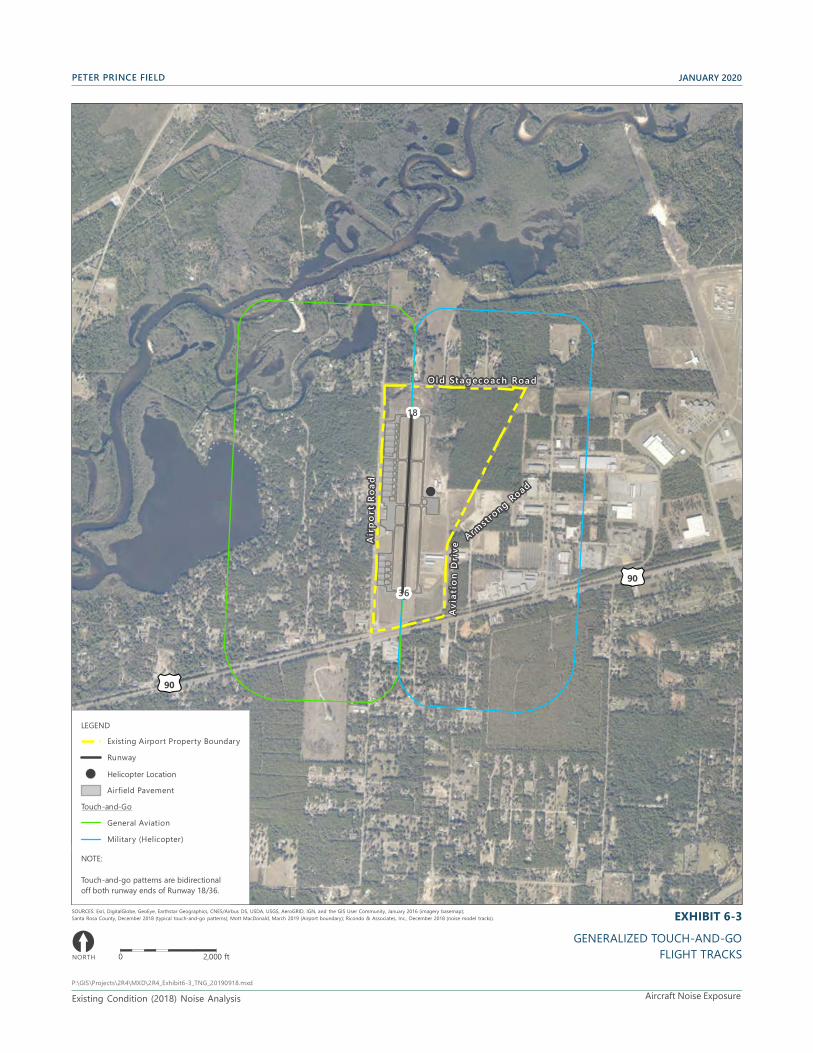
PETER PRINCE FIELD JANUARY 2020
!(
18
36£¤90
£¤90
Airp
ort R
oad
O ld Sta gecoach Roa d
Armstro
ng Road
Avia
tion
Driv
e
LEGEND
Existing Airport Property Boundary
Runway
!( Helicopter Location
Airfield Pavement
Touch-and-Go
General Aviation
Military (Helicopter)
NOTE:
Touch-and-go patterns are bidirectional off both runway ends of Runway 18/36.
SOURCES: Esri, DigitalGlobe, GeoEye, Earthstar Geographics, CNES/Airbus DS, USDA, USGS, AeroGRID, IGN, and the GIS User Community, January 2016 (imagery basemap); Santa Rosa County, December 2018 (typical touch-and-go patterns); Mott MacDonald, March 2019 (Airport boundary); Ricondo & Associates, Inc., December 2018 (noise model tracks). EXHIBIT 6-3
[ GENERALIZED TOUCH-AND-GO NORTH 0 2,000 ft FLIGHT TRACKS
P:\GIS\Projects\2R4\MXD\2R4_Exhibit6-3_TNG_20190918.mxd
Existing Condition (2018) Noise Analysis Aircraft Noise Exposure

PETER PRINCE FIELD JANUARY 2020
6.5 AIRCRAFT WEIGHT AND TRIP LENGTH Aircraft departure weight is a factor in the dispersion of noise in airport environs because it affects the rate at which an aircraft is able to climb. For a given aircraft, the heavier the aircraft the slower the climb rate, and the dispersion of noise along its route of flight is wider due to additional engine thrust and lower altitude. Because actual aircraft weights for each operation vary substantially, the AEDT uses the distance flown to the first stop as a surrogate for aircraft weight by assuming the weight has a direct relationship to the fuel load necessary to reach the first destination. The AEDT groups trip lengths into several stage length categories based on aircraft weights and departure profiles. All aircraft operating at the Airport are small GA aircraft for which only one stage length departure profile is provided in AEDT. All departing fixed-wing aircraft were modeled using the standard Stage Length 1 departure profile (a departure distance of up to 500 nautical miles). All helicopters were modeled using the single standard departure profile for the two helicopter types modeled.
6.6 2018 NOISE EXPOSURE PATTERNS The compiled operations and flight track data were used as input to AEDT Version 2d to calculate the noise exposure contours for DNL 60, 65, 70, and 75 dBA. The FAA considers noise-sensitive land uses, such as residences, places of worship, and schools, to be incompatible DNL 65 dBA and higher.18 The DNL 60 dBA contour was mapped at the request of Airport management, because noise between DNL 60 and 65 dBA is known to be disturbing to some people in residential areas, particularly where outdoor living and relaxation are important.19
Exhibit 6-4 depicts the DNL contours in the Airport environs for operating conditions in 2018. Table 6-3 lists the area within each DNL range in 5-dBA increments. The DNL contours do not represent the noise levels present on any specific day, but, rather, they represent the average annual condition of all 365 days of operation in 2018.
TABLE 6-3 : AREA WITHIN AIRCRAFT DAY-NIGHT AVERAGE SOUND LEVEL CONTOURS (2018)
NOISE EXPOSURE RANGE (DBA) AREA WITHIN AIRPORT
PROPERTY (SQUARE MILES) AREA OUTSIDE AIRPORT
PROPERTY (SQUARE MILES) TOTAL AREA (SQUARE
MILES) DNL 60 – 65 0.11 0.52 0.63 DNL 65 – 70 0.17 0.12 0.29 DNL 70 – 75 0.11 0.00 0.11 DNL 75+ 0.07 0.00 0.07 Total DNL 60+ 0.46 0.64 1.1
NOTES: Calculated using the Aviation Environmental Design Tool (AEDT) using the assumptions described herein. dBA – A-Weighted Decibels DNL – Day-Night Average Sound Level SOURCES: Mott MacDonald, March 2019 (Airport boundary); Ricondo & Associates, Inc., September 2019.
The shape of the DNL contours is a function of the combination of input data consisting of flight tracks, aircraft types, time of operations (day/night), and runway use at the Airport. The DNL contours extend from each runway end reflective of the use of each runway end and the aircraft flight tracks. The relative distance of the contours from the Airport along each route is a function of the frequency of the use of each runway for arrivals and departures, as well as runway use at night, and the type of aircraft assigned to the route. In general, the DNL contours reflect the predominant North Flow configuration and the use of Runway 36 for the majority of departures and arrivals.
18 14 CFR Part 150, Airport Noise Compatibility Planning, Appendix A, Table 1. 19 US Environmental Protection Agency, Report 550/9-74-004, Information on Levels of Environmental Noise Requisite to Protect Public Health
and Welfare with an Adequate Margin of Safety, March 1974.
Existing Condition (2018) Noise Analysis | 22 | Aircraft Noise Exposure
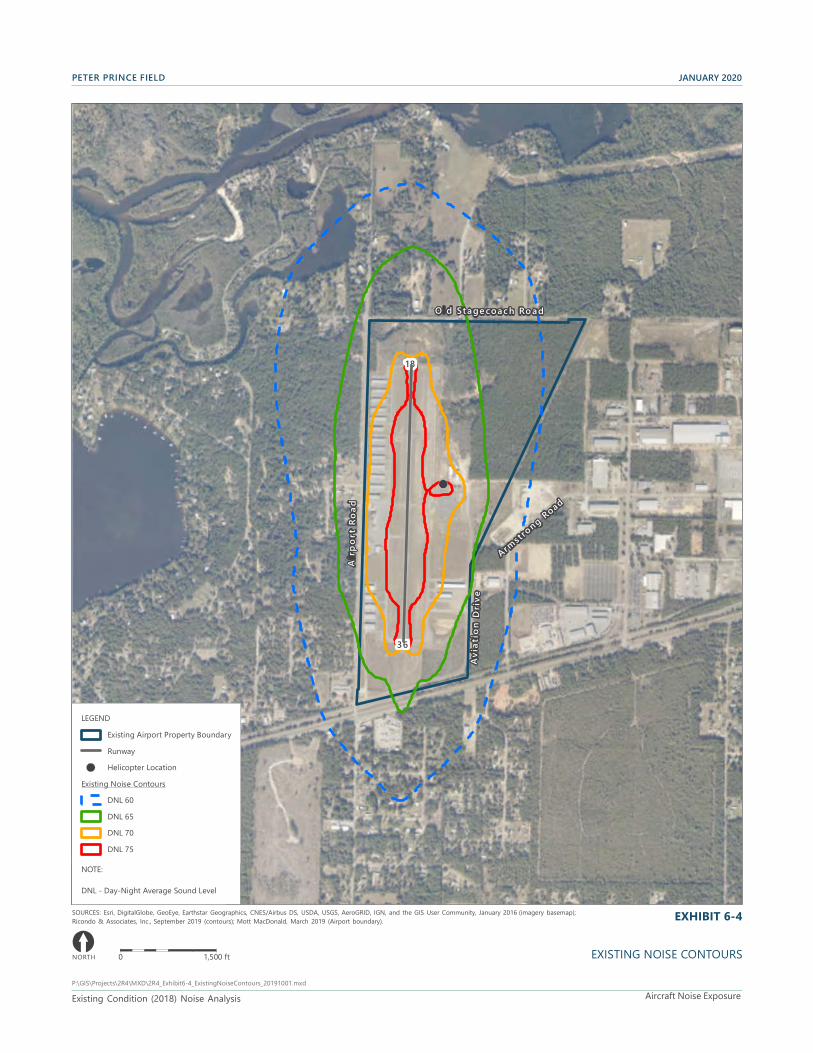
PETER PRINCE FIELD JANUARY 2020
!(
18
36
Armstro
ng Road
Avia
tion
Driv
e
Airp
o rt R
oad
O l d Stage coac h Ro ad
LEGEND
Existing Airport Property Boundary
Runway
!( Helicopter Location
Existing Noise Contours
DNL 60
DNL 65
DNL 70
DNL 75
NOTE:
DNL - Day-Night Average Sound Level
SOURCES: Esri, DigitalGlobe, GeoEye, Earthstar Geographics, CNES/Airbus DS, USDA, USGS, AeroGRID, IGN, and the GIS User Community, January 2016 (imagery basemap); EXHIBIT 6-4 Ricondo & Associates, Inc., September 2019 (contours); Mott MacDonald, March 2019 (Airport boundary).
[ NORTH 0 1,500 ft EXISTING NOISE CONTOURS
P:\GIS\Projects\2R4\MXD\2R4_Exhibit6-4_ExistingNoiseContours_20191001.mxd
Existing Condition (2018) Noise Analysis Aircraft Noise Exposure
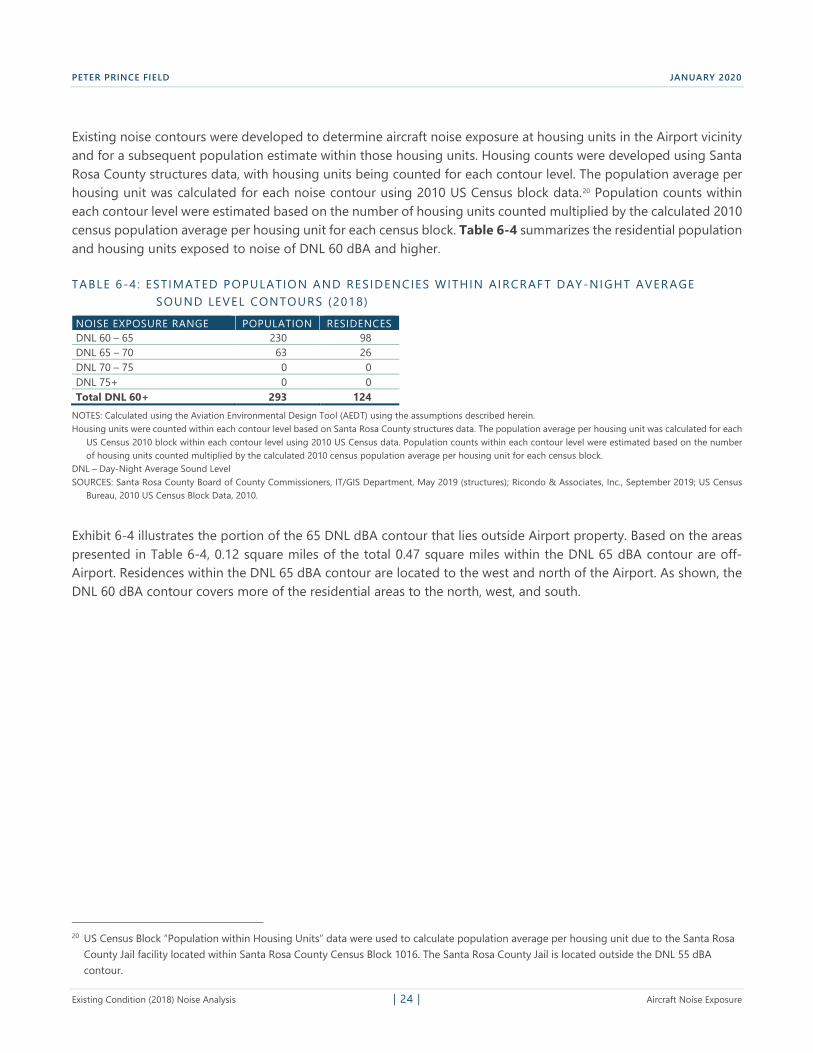
PETER PRINCE FIELD JANUARY 2020
Existing noise contours were developed to determine aircraft noise exposure at housing units in the Airport vicinity and for a subsequent population estimate within those housing units. Housing counts were developed using Santa Rosa County structures data, with housing units being counted for each contour level. The population average per housing unit was calculated for each noise contour using 2010 US Census block data.20 Population counts within each contour level were estimated based on the number of housing units counted multiplied by the calculated 2010 census population average per housing unit for each census block. Table 6-4 summarizes the residential population and housing units exposed to noise of DNL 60 dBA and higher.
TABLE 6-4 : ESTIMATED POPULATION AND RESIDENCIES WITHIN AIRCRAFT DAY -NIGHT AVERAGE SOUND LEVEL CONTOURS (2018)
NOISE EXPOSURE RANGE POPULATION RESIDENCES DNL 60 – 65 230 98 DNL 65 – 70 63 26 DNL 70 – 75 0 0 DNL 75+ 0 0 Total DNL 60+ 293 124
NOTES: Calculated using the Aviation Environmental Design Tool (AEDT) using the assumptions described herein. Housing units were counted within each contour level based on Santa Rosa County structures data. The population average per housing unit was calculated for each
US Census 2010 block within each contour level using 2010 US Census data. Population counts within each contour level were estimated based on the number of housing units counted multiplied by the calculated 2010 census population average per housing unit for each census block.
DNL – Day-Night Average Sound Level SOURCES: Santa Rosa County Board of County Commissioners, IT/GIS Department, May 2019 (structures); Ricondo & Associates, Inc., September 2019; US Census
Bureau, 2010 US Census Block Data, 2010.
Exhibit 6-4 illustrates the portion of the 65 DNL dBA contour that lies outside Airport property. Based on the areas presented in Table 6-4, 0.12 square miles of the total 0.47 square miles within the DNL 65 dBA contour are off-Airport. Residences within the DNL 65 dBA contour are located to the west and north of the Airport. As shown, the DNL 60 dBA contour covers more of the residential areas to the north, west, and south.
20 US Census Block “Population within Housing Units” data were used to calculate population average per housing unit due to the Santa Rosa County Jail facility located within Santa Rosa County Census Block 1016. The Santa Rosa County Jail is located outside the DNL 55 dBA contour.
Existing Condition (2018) Noise Analysis | 24 | Aircraft Noise Exposure

APPENDIX A
Peter Prince Field Noise Monitoring Results Summary byBarry Technologies Inc.
Peter Prince Field Noise Monitoring Results Summary The results report summarizes the sound measurement data collected by Barry Technologies Inc. in the vicinity of Peter Prince Field (Peter Prince). The purpose of conducting sound measurements was to capture typical background sound levels and noise events1 caused by aircraft or other non-aircraft sources (community noise events) to better understand the current overall noise environment. Sound level data was collected at measurement locations distributed under departure and approach paths of Peter Prince during normal operating conditions of the Airport, capturing both arrival and departure operations.
Noise Measurement Site Overview
Two sites, Site 1 and Site 2,were tested for 24 hours beginning December 4, 2018 and concluding on December 5, 2018. One additional supplemental site, Site 3, was tested for one hour to capture noise events within a community that experience touch-and-go overflights. Sites were chosen based on residential areas that are frequently overflown by aircraft traffic from Peter Prince Field. Barry Technologies staff requested the use of homeowner’s property at the approach and departure ends of Runway 18-36. Exhibit 1 shows the locations of each test site surrounding Peter Prince.
The following summarize characteristics for each site:
Site 1: 7542 Lakeside Dr. – Moderately wooded, residential area west of Peter Prince Field and south of local lake area. Location was chosen to capture noise from aircraft using the “Left Hand” / “Downwind Leg” traffic pattern for Runway 36. Temperature at the start was 52 degrees Fahrenheit (°F). Wind speed was light.
Site 2: 7771 Marshall Rd. – Densely wooded, residential area north west of Peter Prince Field. Location was chosen to capture noise from aircraft using “Left Hand” / “Crosswind Leg” traffic pattern for Runway 36. Temperature at start 52 °F . Wind speed was light.
Site 3: 7871 Penny Ln. – Tree lined residential street, south of Peter Prince Field and south of Highway 90. Location was chosen to capture noise from aircraft using “Left Hand” / “Final Leg” traffic pattern for Runway 36. Site was only tested for one hour due to time and equipment constraints. Temperature at the start was 56 °F . Wind speed was light.
1 Noise is unwanted sound judged to be unpleasant, loud or disruptive. A noise event is typically quantified based on a sound level that exceeds a designated threshold above ambient levels for a set duration above the designated threshold.
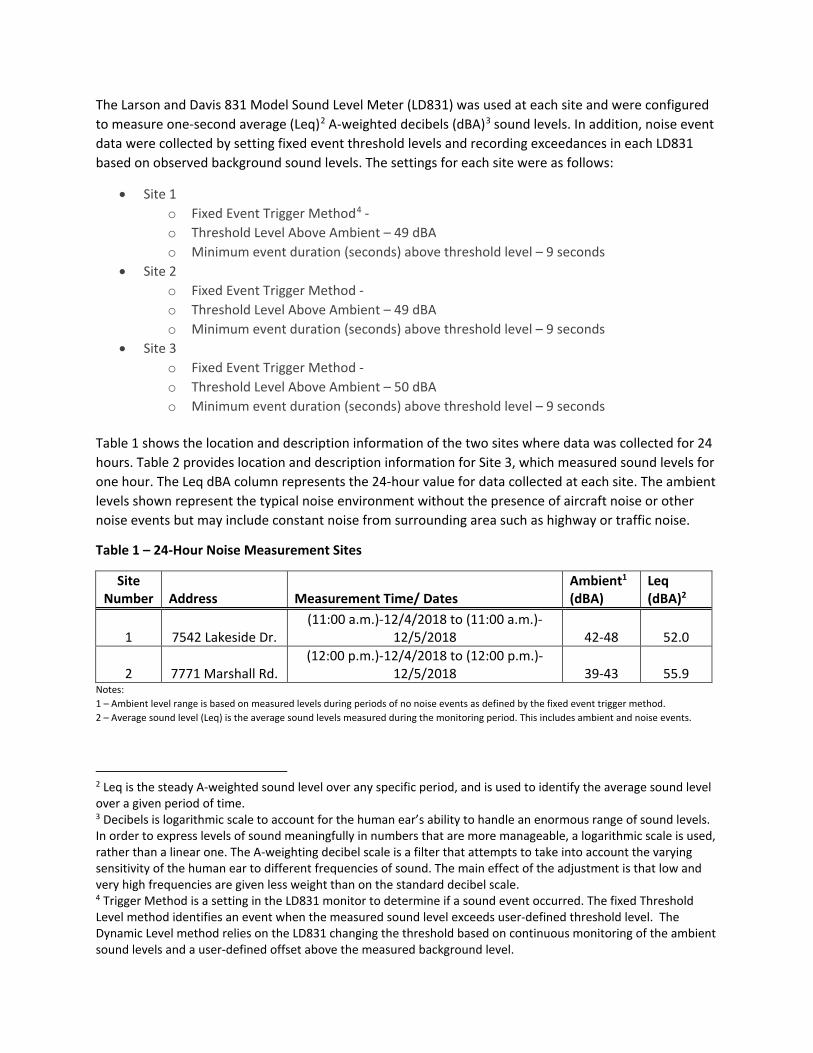
The Larson and Davis 831 Model Sound Level Meter (LD831) was used at each site and were configured to measure one-second average (Leq)2 A-weighted decibels (dBA)3 sound levels. In addition, noise event data were collected by setting fixed event threshold levels and recording exceedances in each LD831 based on observed background sound levels. The settings for each site were as follows:
• Site 1 o Fixed Event Trigger Method4 -o Threshold Level Above Ambient – 49 dBA o Minimum event duration (seconds) above threshold level – 9 seconds
• Site 2 o Fixed Event Trigger Method -o Threshold Level Above Ambient – 49 dBA o Minimum event duration (seconds) above threshold level – 9 seconds
• Site 3 o Fixed Event Trigger Method -o Threshold Level Above Ambient – 50 dBA o Minimum event duration (seconds) above threshold level – 9 seconds
Table 1 shows the location and description information of the two sites where data was collected for 24 hours. Table 2 provides location and description information for Site 3, which measured sound levels for one hour. The Leq dBA column represents the 24-hour value for data collected at each site. The ambient levels shown represent the typical noise environment without the presence of aircraft noise or other noise events but may include constant noise from surrounding area such as highway or traffic noise.
Table 1 – 24-Hour Noise Measurement Sites
Site Number Address Measurement Time/ Dates
Ambient1
(dBA) Leq (dBA)2
1 7542 Lakeside Dr. (11:00 a.m.)-12/4/2018 to (11:00 a.m.)-
12/5/2018 42-48 52.0
2 7771 Marshall Rd. (12:00 p.m.)-12/4/2018 to (12:00 p.m.)-
12/5/2018 39-43 55.9 Notes: 1 – Ambient level range is based on measured levels during periods of no noise events as defined by the fixed event trigger method. 2 – Average sound level (Leq) is the average sound levels measured during the monitoring period. This includes ambient and noise events.
2 Leq is the steady A-weighted sound level over any specific period, and is used to identify the average sound level over a given period of time. 3 Decibels is logarithmic scale to account for the human ear’s ability to handle an enormous range of sound levels. In order to express levels of sound meaningfully in numbers that are more manageable, a logarithmic scale is used, rather than a linear one. The A-weighting decibel scale is a filter that attempts to take into account the varying sensitivity of the human ear to different frequencies of sound. The main effect of the adjustment is that low and very high frequencies are given less weight than on the standard decibel scale. 4 Trigger Method is a setting in the LD831 monitor to determine if a sound event occurred. The fixed Threshold Level method identifies an event when the measured sound level exceeds user-defined threshold level. The Dynamic Level method relies on the LD831 changing the threshold based on continuous monitoring of the ambient sound levels and a user-defined offset above the measured background level.
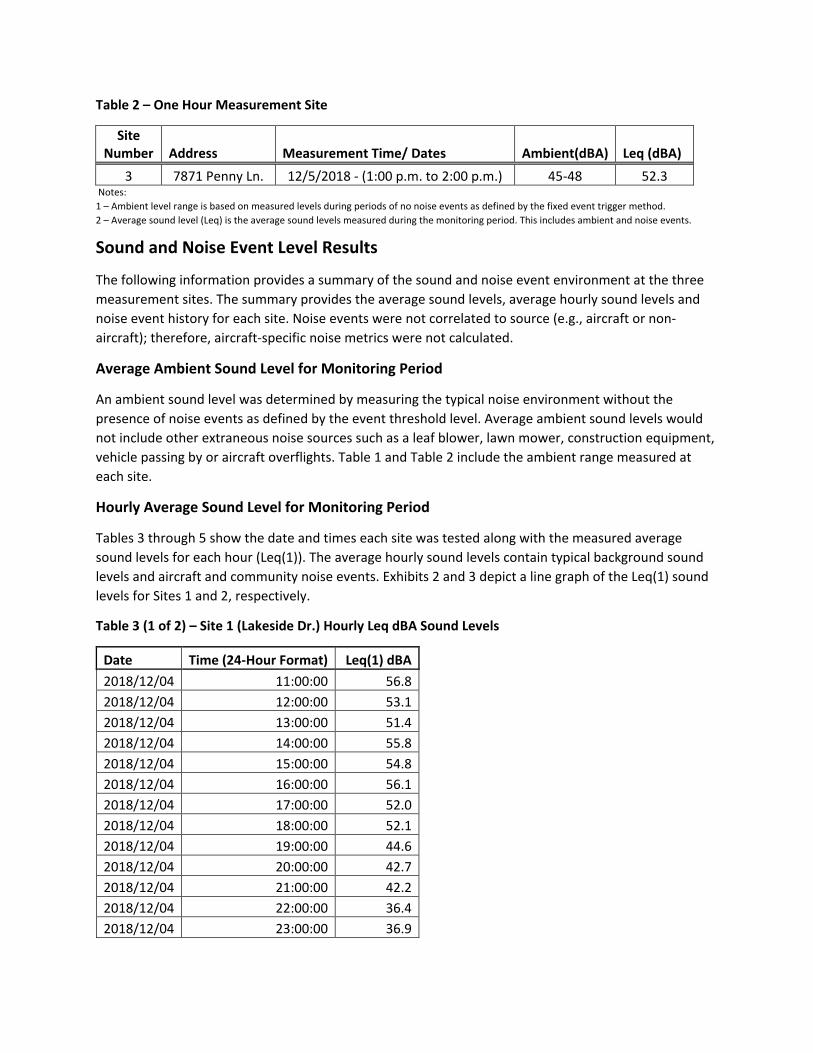
Table 2 – One Hour Measurement Site
Site Number Address Measurement Time/ Dates Ambient(dBA) Leq (dBA)
3 7871 Penny Ln. 12/5/2018 - (1:00 p.m. to 2:00 p.m.) 45-48 52.3 Notes:
1 – Ambient level range is based on measured levels during periods of no noise events as defined by the fixed event trigger method. 2 – Average sound level (Leq) is the average sound levels measured during the monitoring period. This includes ambient and noise events.
Sound and Noise Event Level Results
The following information provides a summary of the sound and noise event environment at the three measurement sites. The summary provides the average sound levels, average hourly sound levels and noise event history for each site. Noise events were not correlated to source (e.g., aircraft or non-aircraft); therefore, aircraft-specific noise metrics were not calculated.
Average Ambient Sound Level for Monitoring Period
An ambient sound level was determined by measuring the typical noise environment without the presence of noise events as defined by the event threshold level. Average ambient sound levels would not include other extraneous noise sources such as a leaf blower, lawn mower, construction equipment, vehicle passing by or aircraft overflights. Table 1 and Table 2 include the ambient range measured at each site.
Hourly Average Sound Level for Monitoring Period
Tables 3 through 5 show the date and times each site was tested along with the measured average sound levels for each hour (Leq(1)). The average hourly sound levels contain typical background sound levels and aircraft and community noise events. Exhibits 2 and 3 depict a line graph of the Leq(1) sound levels for Sites 1 and 2, respectively.
Table 3 (1 of 2) – Site 1 (Lakeside Dr.) Hourly Leq dBA Sound Levels
Date Time (24-Hour Format) Leq(1) dBA 2018/12/04 11:00:00 56.8 2018/12/04 12:00:00 53.1 2018/12/04 13:00:00 51.4 2018/12/04 14:00:00 55.8 2018/12/04 15:00:00 54.8 2018/12/04 16:00:00 56.1 2018/12/04 17:00:00 52.0 2018/12/04 18:00:00 52.1 2018/12/04 19:00:00 44.6 2018/12/04 20:00:00 42.7 2018/12/04 21:00:00 42.2 2018/12/04 22:00:00 36.4 2018/12/04 23:00:00 36.9
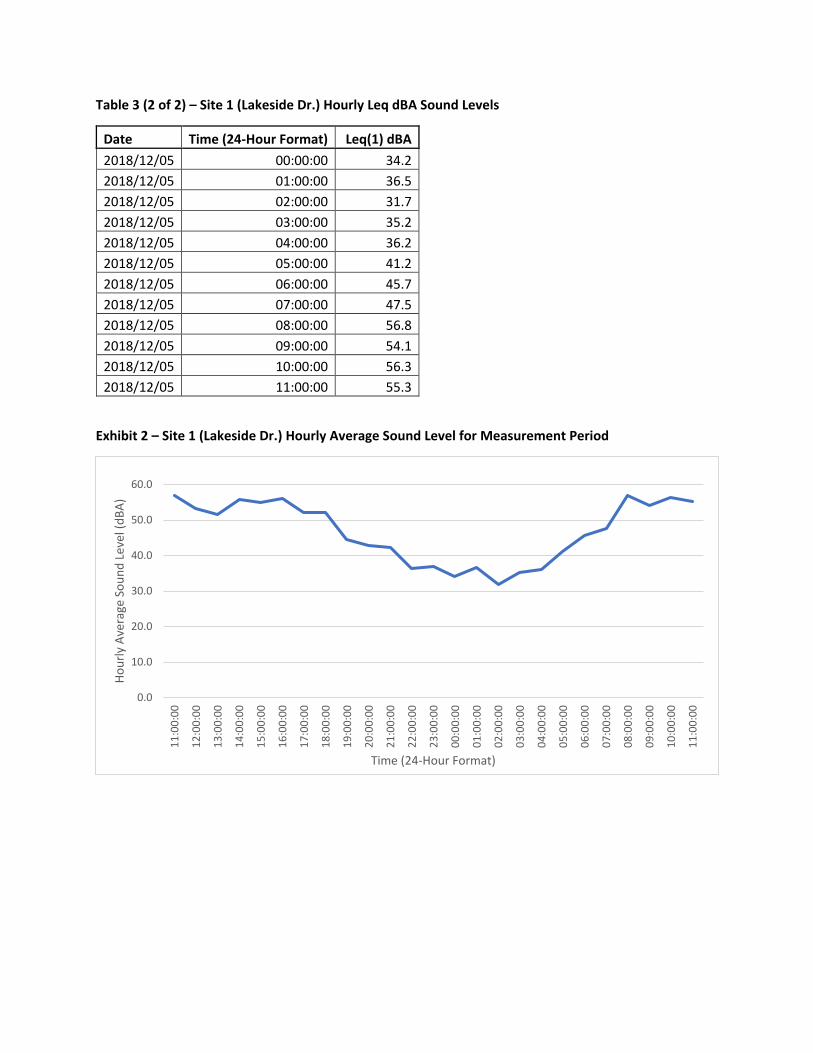
Hour
ly A
vera
ge S
ound
Lev
el (d
BA)
50.0
40.0
30.0
20.0
10.0
0.0
Table 3 (2 of 2) – Site 1 (Lakeside Dr.) Hourly Leq dBA Sound Levels
Date Time (24-Hour Format) Leq(1) dBA 2018/12/05 00:00:00 34.2 2018/12/05 01:00:00 36.5 2018/12/05 02:00:00 31.7 2018/12/05 03:00:00 35.2 2018/12/05 04:00:00 36.2 2018/12/05 05:00:00 41.2 2018/12/05 06:00:00 45.7 2018/12/05 07:00:00 47.5 2018/12/05 08:00:00 56.8 2018/12/05 09:00:00 54.1 2018/12/05 10:00:00 56.3 2018/12/05 11:00:00 55.3
Exhibit 2 – Site 1 (Lakeside Dr.) Hourly Average Sound Level for Measurement Period
60.0
11:0
0:00
12:0
0:00
13:0
0:00
14:0
0:00
15:0
0:00
16:0
0:00
17:0
0:00
18:0
0:00
19:0
0:00
20:0
0:00
21:0
0:00
22:0
0:00
23:0
0:00
00:0
0:00
01:0
0:00
02:0
0:00
03:0
0:00
04:0
0:00
05:0
0:00
06:0
0:00
07:0
0:00
08:0
0:00
09:0
0:00
10:0
0:00
11:0
0:00
Time (24-Hour Format)
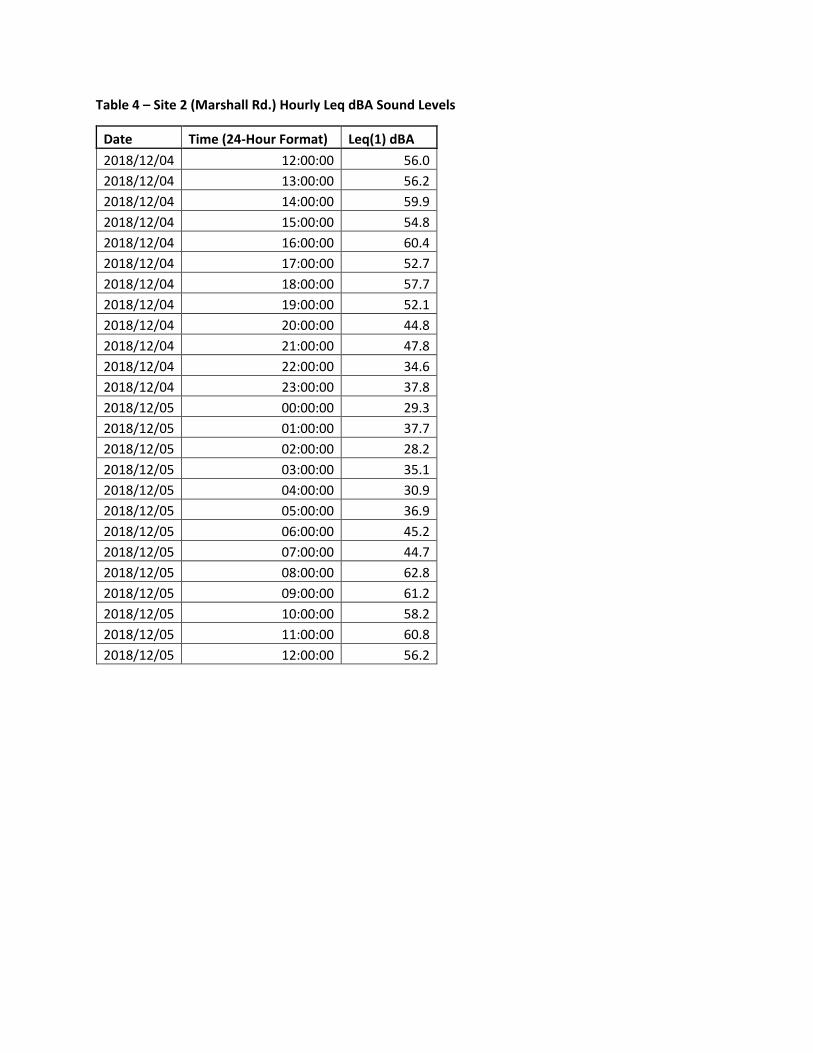
Table 4 – Site 2 (Marshall Rd.) Hourly Leq dBA Sound Levels
Date Time (24-Hour Format) Leq(1) dBA 2018/12/04 12:00:00 56.0 2018/12/04 13:00:00 56.2 2018/12/04 14:00:00 59.9 2018/12/04 15:00:00 54.8 2018/12/04 16:00:00 60.4 2018/12/04 17:00:00 52.7 2018/12/04 18:00:00 57.7 2018/12/04 19:00:00 52.1 2018/12/04 20:00:00 44.8 2018/12/04 21:00:00 47.8 2018/12/04 22:00:00 34.6 2018/12/04 23:00:00 37.8 2018/12/05 00:00:00 29.3 2018/12/05 01:00:00 37.7 2018/12/05 02:00:00 28.2 2018/12/05 03:00:00 35.1 2018/12/05 04:00:00 30.9 2018/12/05 05:00:00 36.9 2018/12/05 06:00:00 45.2 2018/12/05 07:00:00 44.7 2018/12/05 08:00:00 62.8 2018/12/05 09:00:00 61.2 2018/12/05 10:00:00 58.2 2018/12/05 11:00:00 60.8 2018/12/05 12:00:00 56.2
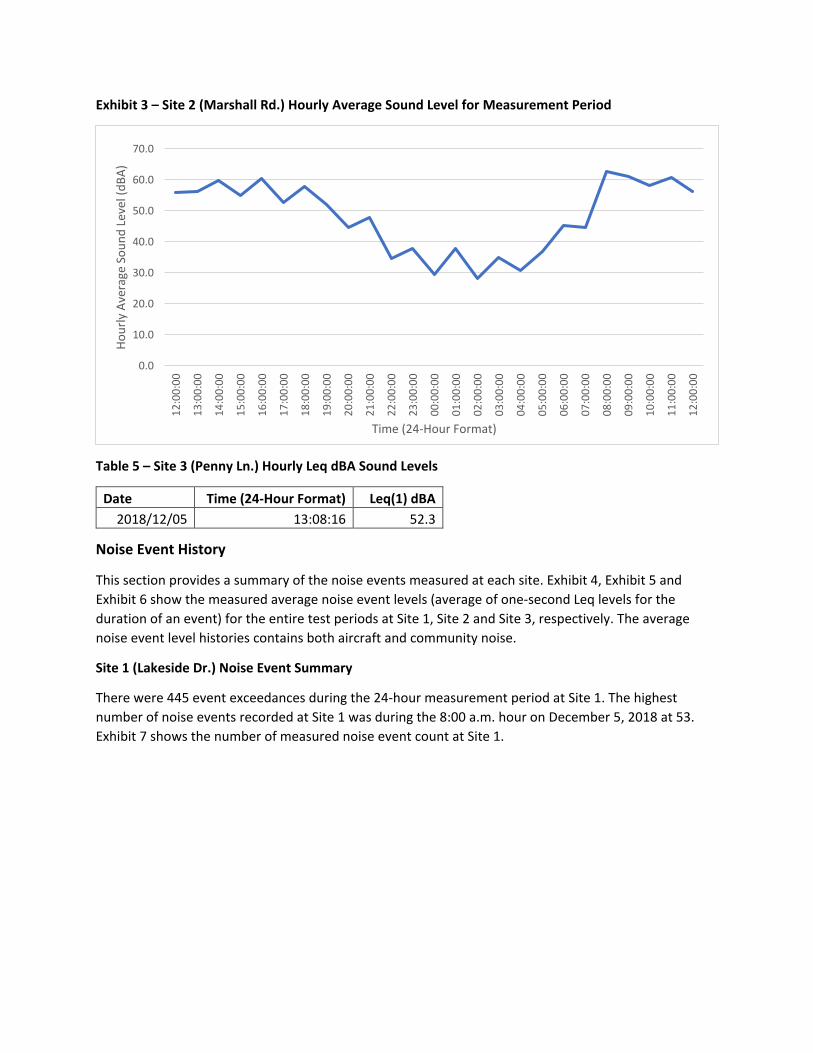
Hour
ly A
vera
ge S
ound
Lev
el (d
BA)
60.0
50.0
40.0
30.0
20.0
10.0
0.0
Exhibit 3 – Site 2 (Marshall Rd.) Hourly Average Sound Level for Measurement Period
70.0
12:0
0:00
13:0
0:00
14:0
0:00
15:0
0:00
16:0
0:00
17:0
0:00
18:0
0:00
19:0
0:00
20:0
0:00
21:0
0:00
22:0
0:00
23:0
0:00
00:0
0:00
01:0
0:00
02:0
0:00
03:0
0:00
04:0
0:00
05:0
0:00
06:0
0:00
07:0
0:00
08:0
0:00
09:0
0:00
10:0
0:00
11:0
0:00
12:0
0:00
Time (24-Hour Format)
Table 5 – Site 3 (Penny Ln.) Hourly Leq dBA Sound Levels
Date Time (24-Hour Format) Leq(1) dBA 2018/12/05 13:08:16 52.3
Noise Event History
This section provides a summary of the noise events measured at each site. Exhibit 4, Exhibit 5 and Exhibit 6 show the measured average noise event levels (average of one-second Leq levels for the duration of an event) for the entire test periods at Site 1, Site 2 and Site 3, respectively. The average noise event level histories contains both aircraft and community noise.
Site 1 (Lakeside Dr.) Noise Event Summary
There were 445 event exceedances during the 24-hour measurement period at Site 1. The highest number of noise events recorded at Site 1 was during the 8:00 a.m. hour on December 5, 2018 at 53. Exhibit 7 shows the number of measured noise event count at Site 1.
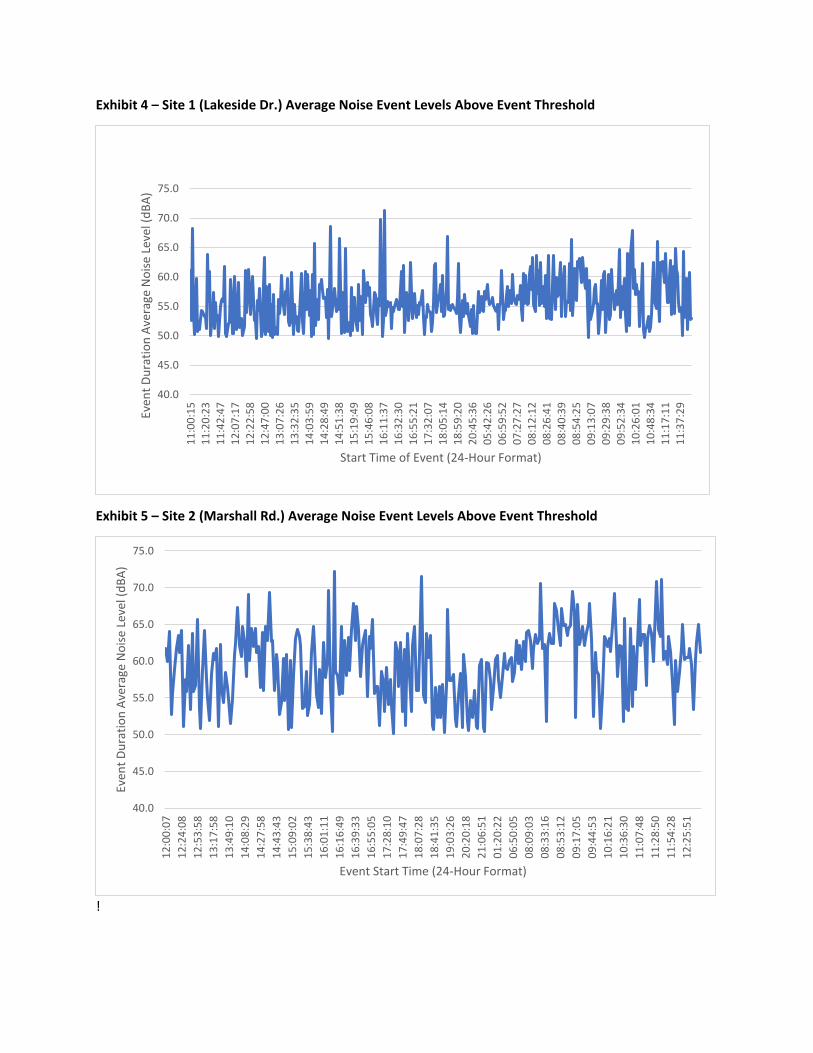
Even
t Dur
atio
n Av
erag
e N
oise
Lev
el (d
BA)
70.0
65.0
60.0
55.0
50.0
45.0
40.0
Even
t Dur
atio
n Av
erag
e N
oise
Lev
el (d
BA)
12:0
0:07
12
:24:
08
12:5
3:58
70.0
65.0
60.0
55.0
50.0
45.0
40.0
11:0
0:15
13:1
7:58
13
:49:
10
14:0
8:29
14
:27:
58
11:2
0:23
11
:42:
47
Exhibit 4 – Site 1 (Lakeside Dr.) Average Noise Event Levels Above Event Threshold
75.0
Start Time of Event (24-Hour Format)
Exhibit 5 – Site 2 (Marshall Rd.) Average Noise Event Levels Above Event Threshold
75.0
Event Start Time (24-Hour Format)
!
12:0
7:17
12
:22:
58
12:4
7:00
14
:43:
43
13:0
7:26
15
:09:
02
13:3
2:35
15
:38:
43
14:0
3:59
16
:01:
11
16:1
6:49
16
:39:
33
14:2
8:49
14
:51:
38
15:1
9:49
16
:55:
05
15:4
6:08
17
:28:
10
16:1
1:37
17:4
9:47
16
:32:
30
18:0
7:28
16
:55:
21
18:4
1:35
17
:32:
07
19:0
3:26
18
:05:
14
20:2
0:18
18
:59:
20
20:4
5:36
21
:06:
51
05:4
2:26
01
:20:
22
06:5
9:52
06
:50:
05
07:2
7:27
08
:09:
03
08:1
2:12
08
:33:
16
08:2
6:41
08
:53:
12
08:4
0:39
09
:17:
05
08:5
4:25
09
:44:
53
09:1
3:07
10
:16:
21
10:3
6:30
11
:07:
48
11:2
8:50
11
:54:
28
12:2
5:51
09:2
9:38
09
:52:
34
10:2
6:01
10
:48:
34
11:1
7:11
11
:37:
29
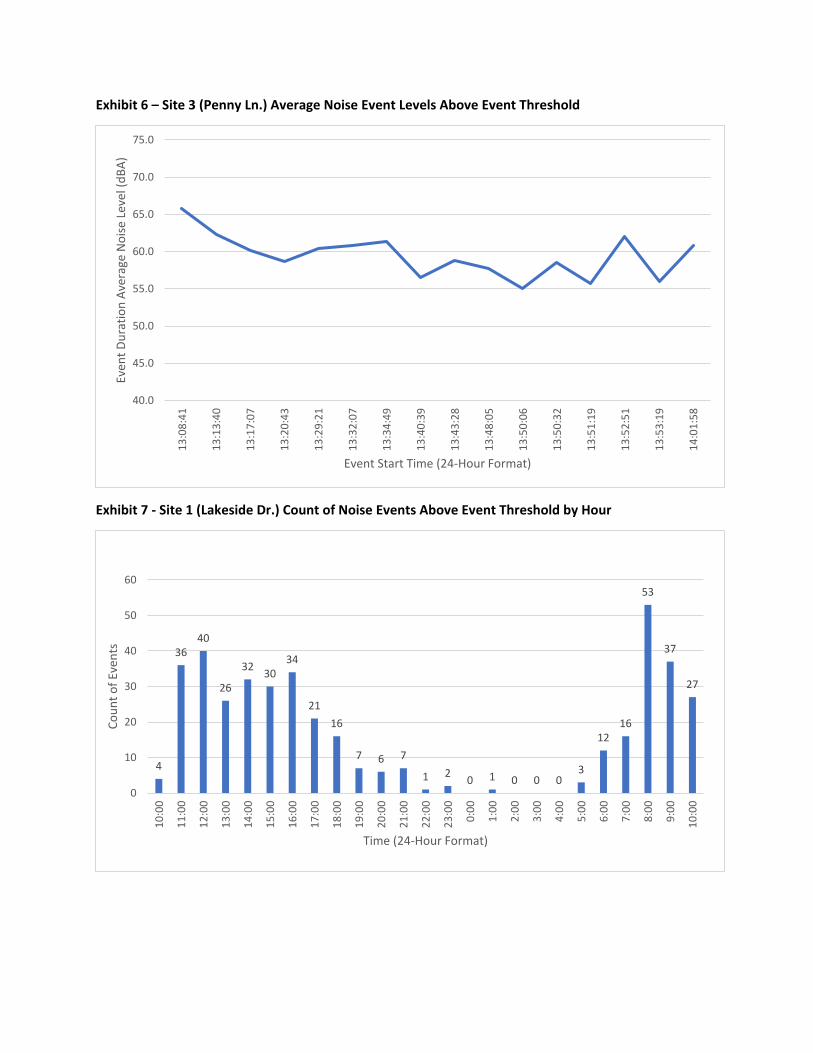
60
Exhibit 6 – Site 3 (Penny Ln.) Average Noise Event Levels Above Event Threshold
75.0
70.0
50.0
45.0
40.0
Event Start Time (24-Hour Format)
Exhibit 7 - Site 1 (Lakeside Dr.) Count of Noise Events Above Event Threshold by Hour
53
Time (24-Hour Format)
10:0
0
11:0
0
12:0
0
13:0
0
14:0
0
15:0
0
16:0
0
17:0
0
18:0
0
19:0
0
20:0
0
21:0
0
22:0
0
23:0
0
0:00
1:00
2:00
3:00
4:00
5:00
6:00
7:00
8:00
9:00
10:0
0
4
36 40
26
32 30 34
21 16
7 6 7
1 2 0 1 0 0 0 3
12 16
37
27
0
10
20
30
40
50
Coun
t of E
vent
s
13:0
8:41
13:1
3:40
13:1
7:07
13:2
0:43
13:2
9:21
13:3
2:07
13:3
4:49
13:4
0:39
13:4
3:28
13:4
8:05
13:5
0:06
13:5
0:32
13:5
1:19
13:5
2:51
13:5
3:19
14:0
1:58
55.0
60.0
65.0
Even
t Dur
atio
n Av
erag
e N
oise
Lev
el (d
BA)

Site 2 (Marshall Rd.) Noise Event Summary
There were 314 event exceedances during the 24-hour measurement period. The highest number of events occurred within the 4:00 p.m. hour on December 4, 2019 recording 29 noise events. Exhibit 8 shows the measured noise event count at Site 2.
Exhibit 8 - Site 2 (Marshall Rd.) Count of Noise Events Above Event Threshold by Hour
60
50
40
2928
20 22 20 22 18
12 8 8
1 1 0 1 0 1 0 1
7 3
26
20 20 21 17
0
10
20
30
Coun
t of E
vent
s
12:0
0
13:0
0
14:0
0
15:0
0
16:0
0
17:0
0
18:0
0
19:0
0
20:0
0
21:0
0
22:0
0
23:0
0
0:00
1:00
2:00
3:00
4:00
5:00
6:00
7:00
8:00
9:00
10:0
0
11:0
0
12:0
0
Time (24-Hour Format)
Site 3 (Penny Ln.) Noise Event Summary
There were a total of 16 noise events recorded during the one-hour measurement at Site 3.

82 | Mott MacDonald | Peter Prince Field 2020 Airport Master Plan Update
| Santa Rosa County