Embed Size (px)
Citation preview

01-Introduction
1
Airport Competition:Myth or Reality?
IATA ECONOMICS BRIEFING

Contents00 Executive Summary 05
01 Introduction 06
02 Airport Market Power: Why is it a problem? 08
03 Passenger behavior – Competition between neighboring airports 10
04 Footloose airlines: Understanding airline behaviour 14
05 Evidence of Route Switching 18
06 Policy Implications 22
IATA Economics Briefing: Aiport Competition: Myth or Reality?
James Wiltshire
IATA, November 2017

4

5
It is important to distinguish between smaller airports where in many cases there is an excess supply of airport capacity, both at the airport itself and within its peer group, and the major airports, in particular those serving large cities and metropolitan areas, where airports continue to benefit from significant market power.
For this reason, IATA advocates a 3-tier approach to ensure effective but proportionate airport regulation based on the strength of airport market power:
• with those airports that have significant market power being subject to formal economic regulation;
• airports with some degree of market power subject to a formal and consistent set of processes, such as a strengthened Airport Charges Directive in the case of Europe;
• and the remaining airports not subject to ex ante regulation but still subject to ICAO principles on setting airport charges.
Regulators and policy makers need to be careful not to rely on airline competition masking the lack of effective competition between airports and the absence of strong commercial imperatives on airport operators to deliver a good outcome for consumers and other airport users in terms of price and service quality.
The arguments and principles set out in this paper have global applicability. As the issue of airport market power is most active in Europe where there is also a broad evidence base to draw on, the majority of examples are drawn from Europe and are relevant to the ongoing debate around the need to strengthen the Airport Charges Directive. Nonetheless, as airports in other parts of the world are corporatized and privatized there will be a growing need to ensure that appropriate regulatory structures are put in place to keep airport market power in check.
Air transport is an important enabler of economic activity and a driver of competitiveness. Air connectivity connects businesses and markets, facilitating trade, encouraging Foreign Direct Investment (FDI) and enabling tourism. It promotes the exchange of knowledge and ideas as well as connecting friends and families. In short, aviation is the business of freedom. In Europe, air transport supports 11.9 million jobs and over €700 billion in GDP.
As the gateways to aviation, airports are a key link in the air transport journey chain, and therefore play an important role in facilitating tourism, business travel, and global supply chains. For incoming travelers, the airport contributes to their first impression of a city or country. And for outbound travel, particularly on short-haul journeys, passengers may spend as much, or even more, time at the airport as they do in the air.
Competition in the airline sector has been a driver of innovation and cost reduction and has delivered major benefits for consumers in terms of increased choice and value. Airline competition has driven major efficiency gains across all operators, with increasing blending and hybridization of business models.
In contrast, in this briefing note we show that effective competition between airports remains the exception rather than the rule, and in particular that major airports continue to enjoy a strong position. There is limited evidence of airports being subject to strong incentives to drive the type of efficiency gains that are standard in the airline sector. For example, in Europe, between 2006 and 2016, airport passenger charges more than doubled as a share of the average passenger air fare, while airline revenue per passenger fell by 11% over the same period.
Airlines need to serve markets where they can generate sustainable levels of traffic and yield. As a result, airlines face significant costs and revenue effects in switching between airports. Where airlines are able to achieve satisfactory results on a particular route it makes sense to continue operating it. Where airlines do switch capacity between routes and airports, this should be seen as part of a normal process of network optimization. Suggestions that airlines are ‘footloose’ and will readily switch away from major airports and key markets therefore ignore the scale of the profitability challenge that airlines face.
00 Executive Summary
6
Aiport Competition: Myth or Reality?
01 IntroductionAirline networks provide vital connectivity to passengers and shippers and perform a crit-ical role for economic development on local, regional and national levels. Airports offer access to essential infrastructure and ser-vices that facilitate air transport. Ensuring that airports operate efficiently and in a cost -effective way is therefore important for the sustainable development of air transport in particular and the economy as a whole.

7
01-Introduction
Airports offer access to essential infrastructure and services that facilitate air transport. In addition, airports can play a critical role for economic development on local, national and regional levels. The effective and efficient development and functioning of airports is therefore important for the sustainable development of air transport in particular and the economy as a whole.
As we demonstrate in Chapter 3, there is considerable evidence that passengers have a strong preference for using their local airport. This means that most airports have a degree of market power, at least at a local level. For this reason, economic regulation is required to protect passengers and shippers. The most commonly used approaches are cost-based or price-cap regulation, which both attempt to replicate the outcomes that would be expected in a competitive market.
However, the aviation market in many world regions is undergoing, or has undergone, a period of significant structural change, with the intention of making it more dynamic and responsive to market needs and passenger preferences.
In this briefing note, we consider the extent to which these changes have modified the nature of the relationship between airlines and airports, and had an impact on outcomes for consumers. In particular, we examine whether the competitive dynamics within the airport sector have evolved.
In order to examine the extent to which airports are subject to competitive forces, it is important to understand the nature of the relationship between airports and both passengers and airlines. In Chapter 3, we consider the competitive dynamics in terms of overlapping geographies or catchment area, for example between different airports serving the same city or metropolitan area.
In Chapters 4 and 5 we examine whether airports across different geographies exert competitive pressures on each other. In particular, we set out to understand whether ‘footloose’ airlines, or even ‘footloose’ passengers, drive a much broader form of competition between airports and serve to constrain airport market power and pricing behavior.
We find that, in most cases, market changes have been driven by and result from the intensity of competition in the airline sector both at individual route and airline company level rather than from competition between airports themselves.
It is also clear that the competitive environment is not the same in all markets and for all airports. This has important implications for policy-makers and regulators. On routes serving smaller airports and markets, and where both consumers and airlines enjoy a wide range of choices, effective airline competition will be sufficient to ensure the best outcomes for consumers and the benefits of economic regulation are unlikely to outweigh the costs.
However, this is not the case for larger airports, and for airports serving major population centers or serving a specific niche. Given airlines’ challenge in achieving sustainable profitability, airlines face strong incentives not to switch away from airports where they are able to generate satisfactory levels of load and yield. Moreover, we show that airlines face significant switching costs in reallocating capacity between airports. The result is airport competition remains limited at best and most airports retain a degree of market power, at least at the local level.
As demand for air transport continues to grow and expansion of major airports becomes more difficult, the market power of major airports is expected to get stronger not weaker. In Europe alone, nearly 20 airports are forecast to be operating at full capacity throughout the day by 2030 compared to just five in 20071. Effective airport competition will be even less likely where capacity constraints at alternative airports reduce the options available to consumers and airlines alike.
This report therefore calls for policy-makers and regulators to adopt a 3-tiered approach to ensure effective but proportionate economic regulation of airports based on the more sophisticated analytical tools set out in this paper. Competitive forces in the airport sector are insufficient and cannot alone be relied upon to ensure a good outcome for consumers and other airport users:
i) Airports with significant market power should be subject to formal, ex ante economic regulation by an independent regulator;
ii) For Airports with some degree of market power, a consistent framework of regulatory processes, such as a strengthened Airport Charges Directive in Europe, should be appropriate;
iii) For the remainder of, mostly, tertiary and smaller airports, adherence to ICAO guidelines relating to transparency, consultation, cost relatedness and non-discrimination should be sufficient.
1 European Commission, 2011, Airport policy in the European Union - addressing capacity and quality to promote growth, connectivity and sustainable mobility.
8
Aiport Competition: Myth or Reality?
02 Airport Market Power: Why is it a problem?
In this Chapter we show that airports are not subject to the same levels of competitive pressure to reduce costs as the airline industry and that this has an impact on consumer fares.
9
02-Airport market power
Airport Regulation in Europe has not responded adequately to the changing landscape in the airport sector.
The share of fully privately owned airports in Europe increased from 9% to 16% between 2010 and 2016 while the share of mixed ownership models increased from 13% to 25% over the same period. While publicly-owned airports may be considered as benign monopolists, often pursuing economic and social goals in support of their local region, this is not the case with privately-owned airports which are driven by investor returns. Increasing private ownership of airports in Europe has not been combined with the appropriate regulatory oversight that drives airports to increase cost efficiency and ensure that airports are responsive to consumer demands.
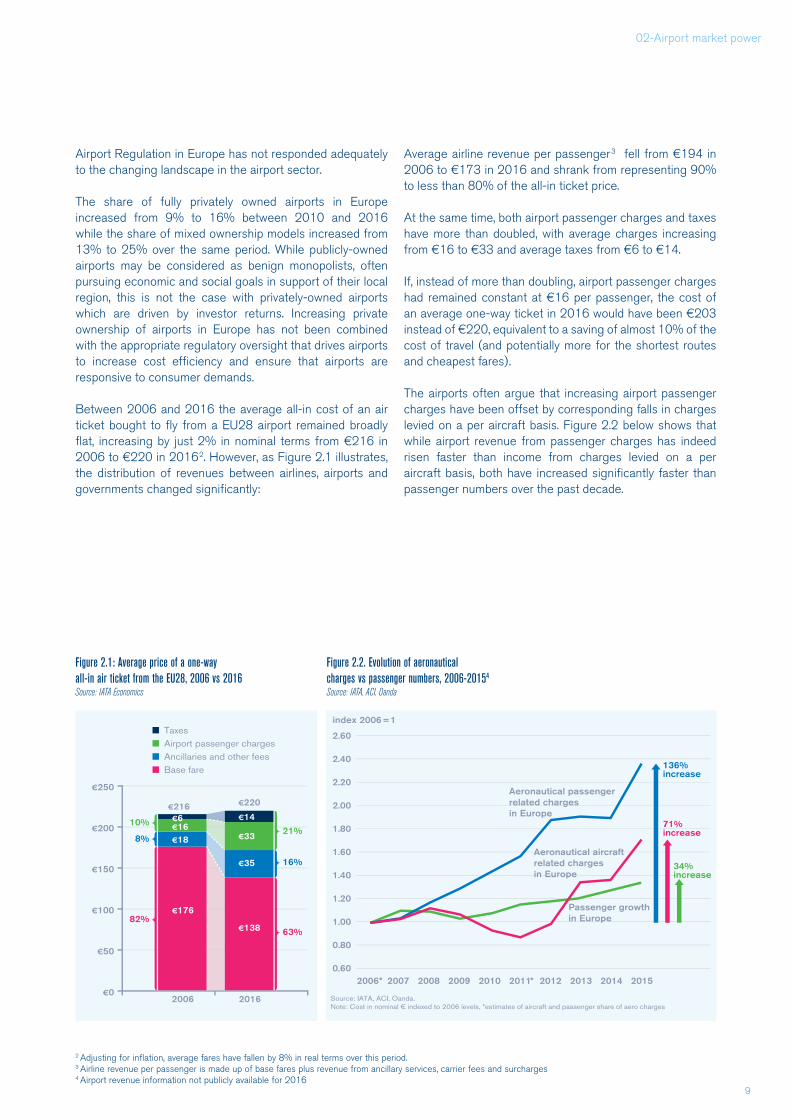
Between 2006 and 2016 the average all-in cost of an air ticket bought to fly from a EU28 airport remained broadly flat, increasing by just 2% in nominal terms from €216 in 2006 to €220 in 20162. However, as Figure 2.1 illustrates, the distribution of revenues between airlines, airports and governments changed significantly:
Average airline revenue per passenger3 fell from €194 in 2006 to €173 in 2016 and shrank from representing 90% to less than 80% of the all-in ticket price.
At the same time, both airport passenger charges and taxes have more than doubled, with average charges increasing from €16 to €33 and average taxes from €6 to €14.
If, instead of more than doubling, airport passenger charges had remained constant at €16 per passenger, the cost of an average one-way ticket in 2016 would have been €203 instead of €220, equivalent to a saving of almost 10% of the cost of travel (and potentially more for the shortest routes and cheapest fares).
The airports often argue that increasing airport passenger charges have been offset by corresponding falls in charges levied on a per aircraft basis. Figure 2.2 below shows that while airport revenue from passenger charges has indeed risen faster than income from charges levied on a per aircraft basis, both have increased significantly faster than passenger numbers over the past decade.
2 Adjusting for inflation, average fares have fallen by 8% in real terms over this period.3 Airline revenue per passenger is made up of base fares plus revenue from ancillary services, carrier fees and surcharges4 Airport revenue information not publicly available for 2016
Figure 2.1: Average price of a one-way all-in air ticket from the EU28, 2006 vs 2016Source: IATA Economics
Figure 2.2. Evolution of aeronautical charges vs passenger numbers, 2006-20154
Source: IATA, ACI, Oanda
10
Aiport Competition: Myth or Reality?
03 Passenger behavior – Competition between neighboring airports
This Chapter examines passenger behavior with regard to airport choice, and considers whether there is indeed evidence of increased choice which might be indicative of airports being subject to competitive pressure by neighboring airports. We discuss a range of approaches and find that there is clear evidence that passengers prefer to use their local airport.
11
03-Passenger behavior
A common method for mapping geographical overlaps between airport catchment areas is to generate isochrones maps. Isochrones map the area that is within a fixed distance or travel time from an airport. Based on this approach, it has been claimed that over 60% of the European population can access at least two airports within two hours’ drive time.
Figure 3.1 below gives an example of 120-minute isochrones for a number of airports in the United Kingdom. The clear implication would be that the overlapping isochrones are evidence of effective competition between airports.
While isochrones are a simple and powerful visual tool, they are of limited use in understanding the choices that passengers actually make.
Isochrones simply draw a ‘frontier’, with all points within that frontier treated equally, implying that a passenger who lives 2 hours from an airport is assumed to be as likely to use that airport as another passenger who lives just 15 minutes from the airport perimeter. Or conversely, that a passenger who lives 15 minutes from the airport is as likely to switch to another airport as one who lives 2 hours travel time away. Passenger behavior is clearly more complex than this.
Moreover, the proximity of an alternative airport can only represent a relevant choice if the airlines which compete with each other offer a substitutable service, for instance a comparable itinerary. Isochrone maps do not reflect the availability of services at comparator airports and are therefore likely to overstate the extent of effective airport competition.
In order to address some of these issues, the economic
consultancy Frontier Economics carried out an empirical assessment to investigate:
• how likely passengers are to choose A over B; and
• the role that relative prices play in influencing that decision.
Frontier built a sophisticated empirical model, using real booking data including passengers’ post codes. They found that passengers’ preference for travelling from their local airport is very strong. They found that for every 1% increase in distance the likelihood of them flying from that airport declines on average by 4%. In terms of price the research found that, on average, for every 1% increase in distance, a 1% change in relative prices would be needed to persuade passengers to travel to the more distant airport.
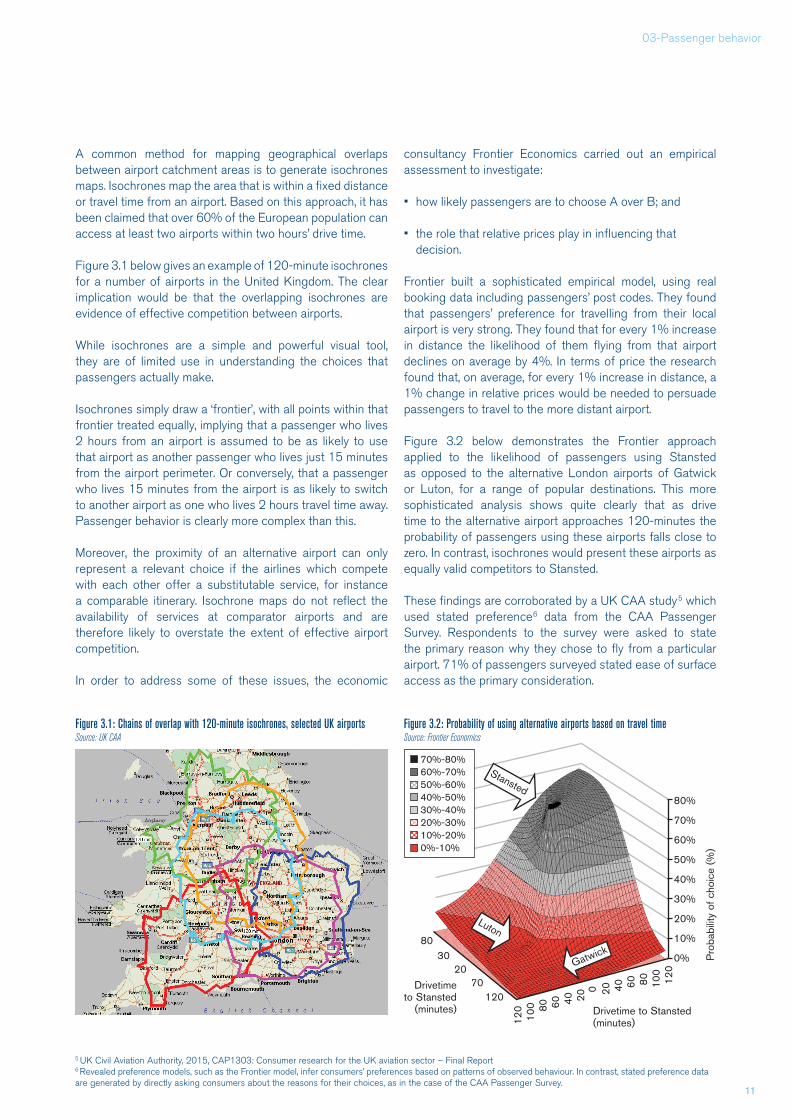
Figure 3.2 below demonstrates the Frontier approach applied to the likelihood of passengers using Stansted as opposed to the alternative London airports of Gatwick or Luton, for a range of popular destinations. This more sophisticated analysis shows quite clearly that as drive time to the alternative airport approaches 120-minutes the probability of passengers using these airports falls close to zero. In contrast, isochrones would present these airports as equally valid competitors to Stansted.
These findings are corroborated by a UK CAA study5 which used stated preference6 data from the CAA Passenger Survey. Respondents to the survey were asked to state the primary reason why they chose to fly from a particular airport. 71% of passengers surveyed stated ease of surface access as the primary consideration.
Figure 3.1: Chains of overlap with 120-minute isochrones, selected UK airports Source: UK CAA
Figure 3.2: Probability of using alternative airports based on travel time Source: Frontier Economics
5 UK Civil Aviation Authority, 2015, CAP1303: Consumer research for the UK aviation sector – Final Report6 Revealed preference models, such as the Frontier model, infer consumers’ preferences based on patterns of observed behaviour. In contrast, stated preference data are generated by directly asking consumers about the reasons for their choices, as in the case of the CAA Passenger Survey.
80%
70%
60%
50%
40%
30%
20%
10%
0%
8030
2070
120
120
120
100
100
60
60
40
40
20
20
0
80
80
Drivetime to Stansted (minutes)
Pro
babi
lity
of c
hoic
e (%
)
Drivetime to Stansted
(minutes)
Luton
Gatwick
Stansted
70%-80%60%-70%50%-60%40%-50%30%-40%20%-30%10%-20%0%-10%

12
These findings show that passengers have a strong preference for using their local airport, even in cases where there may be neighboring airports offering similar services.
Isochrones are a simple and arbitrary metric and do not adequately capture passenger preferences or behavior. Catchment areas vary depending on the specific circumstances of different areas and may be influenced by a range of factors. Indeed, catchment areas may even vary for different types of route offered from a given airport, for example for short- or long-haul routes, or for different types of passengers, such as business or leisure. Therefore, a much more sophisticated toolkit is required in order to understand airports’ actual catchment area and the impact that this has on the extent of effective competition with neighboring airports.
While airports across Europe may have become more commercially focused entities, including recognizing the potential to earn non-aeronautical revenues, this has not changed the need for providing economic regulation.
On the contrary, the move towards greater commercial focus may increase the need for economic regulation because commercial and private entities have more incentives to exploit market power and increase profits by increasing the prices they charge to their customers, rather than pursuing wider economic or social objectives such as regional development. Indeed, recent research7 into car rental concessions at airports has shown evidence of airport market power relating to non-aeronautical revenue.
We conclude that airports’ incentive to drive throughput given the growing importance of non-aeronautical revenue is not sufficient to act as an effective constraint on exercising market power through the setting of aeronautical charges.
Footloose passengers: Understanding passenger behavior
Passengers are now more empowered and better informed than ever as the internet has made searching for travel and accommodation and comparing between options easier than ever. As a result, many travelers are willing and able to arrange their travel independently rather than relying on the services and support of a travel agent.
However, this does not take away the fact that holidaymakers in the days before the internet also had a range of destinations to choose from when planning their holidays. Destination choice is not new. Since the dawn of the jet age and the emergence of a mass package holiday market, holiday makers have enjoyed convenient and cost-effective flights to a wide variety of holiday resorts.
In contrast to holiday-makers, the destination choices of business travelers and people travelling to visit friends and relatives (VFR) are largely fixed. For business travelers the destination is determined by the location of clients or the venue of a conference. Not only does this limit the ability of business passengers to choose between both origin and destination airports, but as we will see in the next section, it also constrains the ability of airlines to switch between airports.
Unlike holidaymakers, destination choice for air passengers who are travelling to visit friends and relatives is largely pre-determined. Trips to visit friends or relatives (VFR) make up an important share of journeys. Recent data published by the UN World Tourism Organization show that VFR trips account for up to 27% of all inbound travel8.
Among the many social and cultural benefits of VFR travel, the ability to easily and affordably visit friends and loved ones also facilitates labor mobility, as job opportunities overseas can be much more attractive if people know that they will be able to continue to see their families and friends on a regular basis.
The evidence suggests that far from being footloose, a majority of passengers have very clear preferences at both ends of the route, in terms of flying from their local airport to a pre-determined destination location. This is particularly the case for time-sensitive business travelers and those visiting friends and relatives.
7 Czerny, A, 2013, Public vs Private airport behaviour when concession revenues exist, Economics of Transportation, 2:38-468 UN World Tourism Highlights, 2017. The VFR category also includes religious pilgrimages and trips for health treatments. However, as with VFR travel the destination for these categories is also largely fixed.

13

14
Aiport Competition: Myth or Reality?
04 Footloose airlines: Understanding airline behavior
This Chapter addresses the question of wheth-er airlines have become more ‘footloose’ and willing to switch away from airports. Under the ‘footloose’ airlines argument, any airport that tried to raise airport charges above the market level would lose business as airlines, and by implication their passengers, switched to other routes and airports. If, in theory, air-lines were able to easily switch capacity be-tween airports this could represent an effec-tive constraint on airports’ ability to exercise market power through the setting of charges.

15
04-Footloose airlines
However, such switching is not costless, especially for network carriers but also for pan-regional point-to-point airlines. We also show that, in most markets, the extent of route switching is limited to that which would be expected as part of a normal process of network optimization in a highly competitive industry.
Airline switching is a term used to describe a variety of airline capacity deployment decisions:
• On routes where the origin or destination (or both ends of the route) are served by more than one airport, an airline may reduce the frequency of flights at one airport and increase it at another, or it may switch the route entirely from one airport to another – this is perhaps closest to the case envisaged by the discussion of catchment areas. It is worth noting, that this scenario is almost by definition limited to multi-airport systems;
• Airlines may switch between airports in different cities or regions, for example taking capacity out of Spain and moving it, for example, to Belgium or the Netherlands. It is this type of decision that is generally associated with the footloose airlines argument;
• Airlines can vary the size of aircraft on a route and/or amend future growth plans. This form of switching may be less drastic and is certainly less obvious, but it is argued that it may have an impact on airport behavior.
It is important to highlight that network changes do not necessarily imply route switching. For example, route closures may not mean that an airline is switching a route to another airport. Similarly, where an airline opens a different route at another airport, this should be viewed as an independent commercial decision from any capacity changes that may have taken place elsewhere in the network.
Airline network planning decisions are based on the airline’s ability to drive and maintain the economic viability of the routes in its network. As in any other commercial business, where a route does not meet its expected performance targets and particularly if it cannot maintain commercial viability, the rational decision is to close the route. Network planning decisions are complex, involving multiple factors. Airport charges are just one element of this decision-making process.
The Airline Commercial Challenge – Sustainable Profitability
The airline sector is a highly competitive industry, with airlines subject to multiple sources of competitive pressure such as competition between airlines, the threat of entry and bargaining power of key suppliers, including airports. Liberalization, deregulation and technological improvements have driven down unit costs, and effective competition has ensured that these gains have been passed on to consumers in the form of lower fares. In many ways, the airline industry could be seen as a ‘poster-child’ for the consumer benefits of competition.
With such strong competitive forces, profitability is a huge challenge in the airline sector and research commissioned for IATA has demonstrated that airlines generate the lowest return to investors in the aviation value chain9.
As with airports, airlines are highly capital-intensive businesses and aircraft are very expensive assets. Airlines need to deploy their fleets on routes that maximize revenue earning potential. Airlines therefore face very strong incentives to optimize their route networks in terms of ability to generate yield. This may translate into variations of how capacity is deployed, for example in response to demand changes or economic conditions. However, it also means that in markets where airlines are able to generate significant business, they are likely to stay.
In the following section we discuss the various types of switching cost that an airline would face if it decided to switch capacity away from an airport. But perhaps the biggest cost, is the opportunity cost in terms of revenue. An airline will only switch capacity if it believes that it is profitable to do so. In other words, an airline will only switch capacity to an alternative airport if it believes that the increased revenues from moving will outweigh the costs involved in doing so.
Switching Costs
Switching costs are any costs involved in switching all or part of a customers demand from one supplier to another that would not be incurred by remaining with the current supplier. For airlines, these would include both the costs involved in the physical switch of airport, such as relocating equipment and staff, as well as termination and negotiation of supplier agreements, in addition to the costs involved in marketing a new route or an increase in capacity on an existing route.
9 IATA Economics Briefing No 10, Profitability and the air transport value chain, IATA, June 2013

16
Airlines may experience switching costs due to:
• relocation of assets at a new airport, including sunk investments such as airline specific terminal facilities (check-in desks, airport lounges etc.) and maintenance facilities;
• staff costs including relocation, recruitment or redundancy;
• breaking long-term commitments;
• loss of economies of scale, if splitting operations across more than one airport, for example.
Airlines starting a new route will also need to incur significant marketing costs in promoting the routes to potential passengers in that catchment area and to generate awareness. Airports often offer marketing support for new routes and so these costs may be at least partially covered by the new airport.
Revenue effects related to airport switching
In most sectors, switching costs entail a firm moving some or all of its business between competing suppliers of a substitutable product, where all suppliers produce a similar, or even identical, product. However, in an airports context, switching may involve moving routes between airports that are poor substitutes in terms of the local market or catchment area that they serve.
For an airline to switch airports, it must be commercially viable to do so. The ability to generate profitable levels of revenue at alternative airports may represent the most significant barrier to switching.
Airlines may also expect to obtain lower yields when routes are launched as passenger familiarization develops. While these effects are transitory, the start-up period may last for a considerable period of time, often as long as 2 or 3 years.
Moreover, there may also be a more permanent loss of yield due to switching to a less attractive location. For airlines operating at hub airports, network effects may also arise. Any airline switching away from the hub will lose access to the pool of potential transfer passengers.
For airlines with a hub or base at a given airport, the revenue hurdle to switching will be even higher. Airlines need to maximize the number of daily flights they operate in order to deploy their fleets efficiently. This involves operating sufficient viable routes from a new base in order to break-even. While airlines can choose to operate some routes that do not have the base as their origin or destination10 this involves additional cost and complexity to the operation, as well as impairing airlines’ ability to respond to disruption or technical issues.
Both switching costs and revenue effects are likely to limit the extent to which airlines can be considered to be ‘footloose’. Moreover, these costs affect all airlines to a greater or lesser extent, regardless of business model. While there are instances of airlines redeploying capacity very rapidly in order to take advantage of specific market opportunities, airline network planning more normally takes place over a much longer time horizon, which can be up to 2 years in the case of new long-haul routes.
10 An example would be an aircraft based in Geneva (GVA) being used to operate a route between Nice (NCE) and Barcelona (BCN). In the case the daily pattern would be: Flight 1 GVA – NCE; Flight 2 NCE – BCN; Flight 3 BCN – NCE; Flight 4 NCE – GVA.

01-Introduction
17

18
Aiport Competition: Myth or Reality?
05 Evidence of Route Switching
In this Chapter we examine data on route ‘churn’ or ‘switching’ and consider the drivers of the observed trends, in particular whether they are driven primarily by changes in the airline or airport sectors.

19
05-Evidence of Route Switching
Route switching is attributable to a wide range of factors including underlying economic conditions, route profitability and broader network, or even alliance, strategy. As such it is part of a normal process of network optimization as airlines struggle to generate profitable traffic in an increasingly competitive environment.
The presence of route churn is not in itself an indication of the level of competition between airports or the extent to which their market power is curtailed. Indeed, we show that in almost all instances route switching reflects the high level of competition within the liberalised airline sector.
The data we examine show that there is no increasing trend in recent years and that it is not a major consideration for Europe’s top airports. While the schedule data support the assertion of an absolute increase in the openings and closures of routes, this is in the context of a market that was growing overall. In their 2017 study, OXERA reports that route openings averaged 3,000 per year between 2012 and 2016 with closures averaging 2,500 over the same period.
Figure 4.1, taken from recent analysis by OXERA for Airports Council International (ACI) Europe, shows that when route openings and closures are compared in relative terms, as a share of total routes operated, no increasing trend can be observed.
The OXERA analysis also found that ‘churn’ rates at European airports with more than 40 million passengers a year are significantly lower than average in terms of both openings and closures.
In addition, OXERA corroborates a finding from an earlier IATA11 study that the majority of route switching is by “point-to-point” carriers, comprising low-cost carriers and full-service carriers that do not conduct significant connecting operations.
This European evidence supports the idea that there is significant switching on start-up routes and at smaller airports, whereas switching is much less widespread at larger airports and on established routes. While this suggests that these smaller airports may have limited ability to exercise power it is also the case that these airports are much less likely to be subject to effective economic regulation.
Airline entry and exit
Where an airline exits a market entirely or ceases operations, this represents a special case of route switching. Such market adjustment is likely to have a significant negative and short-term impact on both network scope and throughput at affected airports. However, this may not be the case over the medium- and long-term.
As we set out in Chapter 3, airlines face strong incentives to allocate capacity in such a way as to maximize revenue and profits. Airlines are much less likely to withdraw capacity in geographic markets where they are able to operate profitably.
Similarly, where market exit is driven by a lack of competitiveness of the exiting airline, it is likely that other airlines will enter the market in a rapid timeframe and that throughput will recover to, or even exceed, the pre-adjustment levels. On 65% of routes operated by more than one carrier, within 3 years of the exit of one airline from the route, capacity was at or greater than 80% of the pre-closure level and in 40% of cases capacity was greater than it was before the airline exit12.
In contrast, where airline exit from an airport market is driven by a fundamental lack of sustainable demand at a given airport, then the drop in throughput will be more durable.
Note: The figures show the total number and share of intra-European scheduled routes that were opened and closed in 2002-2012. The trends are the linear trends across the period. Source: Prepared for ACI by Copenhagen Economics and SEO Economic Research based on OAG data
Figure 4: Number and share of intra-European routes opened and closed, 2002-2012
12 Op. cit., p48
Route openings (% of stock)Route closures (% of stock)
0%
5%
10%
15%
20%
25%
30%
35%
2003 2005 2007 2009 2011 2013 2015

20
Airport entry
The entry, or even the threat of entry, of new airports into a market might be expected to have some effect in constraining the pricing behavior of incumbent airports. We therefore consider trends in airport entry to test to what extent this might be borne out in practice.
A study of airport entry and exit in Europe13 found that during the period 1995-2005 22 airports entered the market, with many of these examples involving the repurposing of military facilities for, at least partial, civilian use. The study concluded that entry and exit in the airport industry is not so much driven by the profit motive but rather by the desire of public airports to increase economic activity for their region, with most of the new entries serving only one airline, generally a low-cost carrier.
13 Mueller-Rostin, C. et al, 2010, ‘Airport Entry and Exist: A European Analysis’, in Airport Competition: The European Experience edited by P. Forsyth et al., Ashgate
It was also found that entry seems to be especially difficult in regions with excess demand and that entry at such locations, which could have the potential to exert some competitive pressure on the major existing airports, has not occurred. This provides further evidence that entry and exit forces are not sufficient in curbing market power of major European airports.

21

22
Aiport Competition: Myth or Reality?
06 Policy implicationsIn this briefing note we have shown that airport regulation in Europe has not responded adequately to the changing landscape in the aviation sector. Not all airports are equal, and we therefore recommend a 3-tier approach to airport regulation based on evidence of market power.

23
06-Policy implications
In this briefing note, we have shown that competitive pressures do not apply equally across all airports. Apparent signs of competition, based on analysis of isochrone maps or patterns of route switching, are often not borne out by reality. Both catchment area analysis and examination of route openings and closures should be based on detailed assessment, using sophisticated approaches where available, rather than on simple one-size-fits-all techniques.
In this paper we have shown that, particularly for larger airports serving major cities or conurbations, competitive forces are not strong enough to act as an effective constraint on airport pricing. Many airports continue to enjoy significant market power and, as we have seen, exercise this market power by increasing their prices, even during the most challenging economic conditions.
Between 2006 and 2016, airport passenger charges more than doubled as a share of the average passenger air fare, while airline revenue per passenger fell by 11% over the same period. While there was some rebalancing between charges levied on an aircraft basis and those levied on a per passenger basis, both sets of charges increased over the past decade, highlighting the contrast in the strength of competitive forces facing airlines and airports.
Increased airport charges ultimately mean higher air fares for consumers, raising the cost of family holidays, business meetings for firms to meet new clients and the retail price of goods that are shipped by air. Policy makers and regulators should therefore exercise care and rigour in assessing the level of effective competition within the airport sector.
Distinguish between airport and airline competition
Air fares have more than halved in real terms since 1970. Increased airline competition, driven by liberalization and deregulation, has been a key driver of this trend which has delivered many benefits for consumers, making air travel more affordable and accessible.
Advocates for deregulation argue that the real cost of air travel has continued to fall even as governments in many countries move to corporatize or even privatize airports. However, policy makers and regulators should be careful not to interpret this as evidence of effective competition between airports or of airlines imposing constraints on airports’ ability to exercise market power.
We have shown that such arguments do not stand up to close scrutiny. In the majority of cases, market changes have been driven by and result from the intensity of competition in the
airline sector both at individual route and firm level rather than from competition between airports themselves.
Given airlines’ challenge in achieving sustainable profitability, airlines face strong incentives not to switch away from airports where they are able to generate satisfactory levels of load and yield.
Moreover, airlines face significant switching costs in reallocating capacity between airports. The result is that in most markets airport competition remains limited at best and most airports retain a degree of market power, at least at the local level.
Where airports continue to enjoy significant market power and generate monopoly profits by imposing excessive airport charges on airlines, consumers will suffer. Even though the airlines operating at that airport may be highly competitive and compete effectively between them, air fares will still be higher than they need be. For this reason, it is important to distinguish between the extent of airline and airport competition.
Adopt a 3-tier approach to airport regulation
It is also clear from the evidence presented in this paper that the competitive environment is not the same for all airports. While some smaller, tertiary airports may be subject to a level of competition from neighboring airports, there is no evidence that this competition is sufficient to prevent many, especially large hub airports, from abusing market power through excessive airport charges or poor service.
Regulators need to be careful not to rely on airport competition delivering a good outcome for passengers and other airport users in terms of price and service quality. Only effective and proportionate economic regulation will ensure a fair deal for consumers.
IATA advocates adopting a 3-tier approach to regulating European airports:
1) Full economic regulation for airports with significant market power;
2) Enhanced Airport Charges Directive – for airports with some degree of market power;
3) Compliance with ICAO guidelines – for remaining airports, mainly tertiary and smaller airports.

24
Airports with significant market power need to be subject to economic regulation covering airport charges, service levels and investment programs, determined by an independent regulator. Such regulation should create powerful incentives to drive operational efficiencies.
An enhanced version of the Airport Charges Directive with genuine impact on airport decision making is required for airports with some degree of market power. In particular, significantly stronger provisions relating to consultation and transparency and a clear appeal mechanism to an independent regulator are needed as a matter of urgency.
However, we recognize that detailed economic regulation is not relevant for all airports. For many of Europe’s smaller airports, compliance with ICAO guidelines may be sufficient.
There are a number of indicators that can be used to signal the existence of significant market power and which can serve as proxy indicators to determine the appropriate level of regulatory oversight. Such indicators include the level of congestion, whether the airport uses a dual-till charging mechanism and whether the airport is part of a network.
Market Power Assessments can help to verify the allocation of airports to the appropriate level of oversight based on the indicators, in case there is evidence of a different type of regulatory oversight needed based on less/more market power.
Subject to economic regulation - ISA to determine• Prices• Operational efficiencies• Investments• Service levels
Subject to strengthened application of the ACD• Stronger provisions on Consultation & Transparency• Non-discrimination• Appeal mechanism to ISA• Cost relatedness
Excluded from ACD(subject to ICAO principles)
Deg
ree o
f m
arke
t p
ow
er

01-Introduction
25

28
www.iata.org