Embed Size (px)
Citation preview
AIRPORT AUTHORITY OF THE CITY OF OMAHA
Basic Financial Statements and Supplementary Information and A-133 Reports
December 31, 2014 and 2013
(With Independent Auditors’ Reports Thereon)
AIRPORT AUTHORITY OF THE CITY OF OMAHA
Table of Contents
Page
Management’s Discussion and Analysis (MD&A) 1
Independent Auditors’ Report 11
Basic Financial Statements:
Statements of Net Position 13
Statements of Revenues, Expenses, and Changes in Net Position 14
Statements of Cash Flows 15
Notes to Financial Statements 16
Required Supplementary Information
Schedules of Funding Progress 31
Supplementary Information
Schedule 1 – Schedule of Revenues 32
Schedule 2 – Schedule of Expenses 34
Other Reports
Independent Auditors’ Report on Supplementary Schedule of Expenditures of Federal Awards Required by OMB Circular A-133 38
Supplementary Schedule of Expenditures of Federal Awards 39
Notes to Supplementary Schedule of Expenditures of Federal Awards 40
Independent Auditors’ Report on Internal Control over Financial Reporting and on Compliance and Other Matters Based on an Audit of Financial Statements Performed in Accordance with Government Auditing Standards 41
Independent Auditors’ Report on Compliance for Each Major Program and Report on Internal Control over Compliance Required by OMB Circular A-133, Audits of States, Local Governments, and Non-Profit Organizations 43
Schedule of Findings and Questioned Costs 45
AIRPORT AUTHORITY OF THE CITY OF OMAHA
Management’s Discussion and Analysis
(Unaudited)
December 31, 2014 and 2013
Introduction
The following management’s discussion and analysis (MD&A) of the Airport Authority of the City of Omaha (the Authority) provides an introduction to the basic financial statements of the Authority for the years ended December 31, 2014 and 2013. The Authority’s responsibilities include Eppley Airfield and Millard Airport. The information contained in this MD&A has been prepared by management and should be considered in conjunction with the basic financial statements and the notes thereto, which follow this section.
The notes are essential to a full understanding of the data contained in the basic financial statements. This report also presents certain supplementary information regarding revenues and expenses by cost center and required supplementary information regarding the funding progress of the defined-benefit pension plan and the other postemployment benefit obligation.
The basic financial statements consist of two parts: the financial statements and the notes to financial statements. The three financial statements are the statements of net position; the statements of revenues, expenses, and changes in net position; and the statements of cash flows.
The Authority’s financial statements are prepared on the accrual basis of accounting in accordance with U.S. generally accepted accounting principles promulgated by the Governmental Accounting Standards Board (GASB). The Authority is a special-purpose government engaged only in business-type activities. Users of the Authority’s facilities provide the revenues to operate, maintain, and acquire necessary services and facilities. The Authority has no taxing authority.
The Authority was created pursuant to Nebraska state statutes. The affairs of the Authority are conducted by a five-member board whose members are appointed by the mayor of the City of Omaha, Nebraska (the City), with the approval of the City Council. The Authority is not included in the City’s financial statements because the City is not financially accountable for the Authority.
Airport Activities Highlights
The following is a summary of Eppley Airfield’s traffic statistics:
Percentage Percentage Percentage2014 change 2013 change 2012 change
Passengers 4,119,730 1.9% 4,042,333 (2.1)% 4,127,344 (2.0)%Aircraft operations 97,378 (1.1) 98,425 (5.0) 103,651 (4.8)Cargo and mail weight - tons 113,213,531 (5.8) 120,206,399 5.5 113,918,182 (4.8)Scheduled landed weight - tons 2,692,857,723 0.6 2,676,905,276 (2.1) 2,733,945,099 (4.5)
These Eppley Airfield statistics have been negatively impacted by the state of the nation’s economy since 2008. The entire aviation industry was impacted significantly by the economy. High fuel prices hampered airline success, although 2014 saw lowering prices. Airlines have been strategically managing domestic capacity by withdrawing seats from several markets and retiring old, less fuel efficient aircraft. According to a study by MIT, for the five year period between 2007–2012, medium hub airports saw a 26.2% reduction in aircraft departures and a 21.4% reduction in available seats. Eppley Airfield fared well in comparison with an 18.6% and 14.1% reduction, respectively. Airlines have also been going through a several year period of consolidations.
1 (Continued)
AIRPORT AUTHORITY OF THE CITY OF OMAHA
Management’s Discussion and Analysis
(Unaudited)
December 31, 2014 and 2013
Eppley Airfield is currently being served by 17 regularly scheduled jet air carriers (comprised of seven airline groups). These airlines provide nonstop service to 16 cities with over 70 daily departures. In 2009, Delta and Northwest merged their operations and terminal space but did continue all their flights into Omaha. In 2010, Midwest and Frontier merged their terminal space under a new common airline ownership of Republic. Frontier has since ceased its service to Milwaukee and its seasonal flights to Orlando. In early 2012, AirTran merged operations and terminal space into Southwest. In 2012, Continental merged its operations and terminal space into United. In 2014 and 2013, a few of the supplemental, code-sharing regional carriers either commenced or discontinued service. The merger of American and U.S. Airways was announced in 2014, but as of this report date, no action has taken place at Eppley Airfield. U.S. Airways commenced nonstop (twice daily) service to Charlotte, NC in March 2012. Alaska Airlines, through its code-share partner SkyWest, commenced nonstop (once daily) service to Seattle, WA in November 2013. In early 2015, Allegiant Air commenced service to Eppley Airfield with twice weekly flights to the Tampa Bay/St. Petersburg, Florida area and twice weekly flights to the Oakland, CA area. Southwest also announced it will commence non-stop service to Dallas, TX. Four national cargo companies and three regional cargo companies served Eppley Airfield at December 31, 2014.
Airline Rates and Charges
The scheduled air carriers operate on year-to-year operating and lease agreements (in a few cases, on a month-to-month basis). The rates and charges are established annually by the Authority’s board resolution. The rates and charges were as follows:
2014 2013 2012
Landing fee per 1,000 pounds $ 2.736 2.534 2.384 Apron fee per landing 2.50 2.50 2.50 Terminal finished area per square foot per year 73.72 72.46 72.01 Terminal unfinished area per square foot per year 59.03 58.02 57.66 Loading bridge (wide) unmodified per year 37,700 37,700 37,700 Loading bridge (narrow) unmodified per year 33,700 33,700 33,700 Unleased gate usage charge four hours and less 180 175 170 Unleased gate usage charge over four hours 255 245 235
2 (Continued)
AIRPORT AUTHORITY OF THE CITY OF OMAHA
Management’s Discussion and Analysis
(Unaudited)
December 31, 2014 and 2013
Financial Position Summary
The statements of net position present the financial position of the Authority at the end of the year. They include all assets and liabilities of the Authority. Net position, the difference between total assets and liabilities, is an indication of the current fiscal health of the Authority. A summary of comparison of the Authority’s assets, liabilities, and net position at December 31 is as follows:
2014 2013 2012
Assets:Current and other assets $ 99,707,042 90,048,848 84,271,161 Property, plant, and equipment, net 262,043,642 250,887,008 245,586,281
Total assets $ 361,750,684 340,935,856 329,857,442
Liabilities:Current liabilities $ 6,813,124 6,559,020 6,194,344 Other postemployment benefit payable 18,196,209 14,134,879 10,237,106 Long-term debt, excluding current installments 9,649,776 10,483,236 13,722,517
Total liabilities 34,659,109 31,177,135 30,153,967
Net position:Net investment in capital assets 248,872,456 236,965,160 229,654,821 Restricted for debt service, net of related
accrued interest payable 805,000 3,210,000 2,370,000 Unrestricted 77,414,119 69,583,561 67,678,654
Total net position 327,091,575 309,758,721 299,703,475 Total liabilities and net position $ 361,750,684 340,935,856 329,857,442
The Authority’s assets exceeded liabilities by $327,091,575 and $309,758,721 at December 31, 2014 and 2013, respectively. For both years, the largest portion of the Authority’s net position represents its net investment in capital assets. The Authority uses these capital assets to provide services to its passengers, visitors, and tenants of Eppley Airfield and Millard Airport; consequently, these assets are not available for future spending. Although the Authority’s investment in its capital assets is reported net of related debt, it is noted that the resources required to repay this debt must be provided annually from operations, since the capital assets themselves cannot be used to liquidate liabilities.
Restricted net position reflects cash and investments set aside with the revenue bond trustee for the ensuing January 1st principal and interest payment to bondholders (including the payoff of remaining outstanding Series 2004 and 2008 Airport Revenue Refunding Bonds on January 1, 2012 and the payoff of remaining outstanding Series 2010-1 Airport Revenue Refunding Bonds on January 1, 2014) and to fund the bond covenant required debt service reserve accounts. The remaining unrestricted net position may be used to meet any of the Authority’s ongoing obligations.
3 (Continued)
AIRPORT AUTHORITY OF THE CITY OF OMAHA
Management’s Discussion and Analysis
(Unaudited)
December 31, 2014 and 2013
Summary of Changes in Net Position
The change in net position is an indicator of whether the overall fiscal condition of the Authority has improved or deteriorated during the year. Following is a summary of revenues, expenses, and changes in net position:
Percentage Percentage Percentageof operating of operating increase
2014 revenue 2013 revenue (decrease)
Operating revenues:Landing area $ 8,061,910 19.9% $ 7,449,327 19.5% 8.2%General aviation area 1,262,260 3.1 1,251,724 3.3 0.8Terminal building area 14,536,350 35.8 13,846,816 36.3 5.0Parking and other facilities 16,383,882 40.4 15,244,930 39.9 7.5Millard Airport 338,062 0.8 380,489 1.0 (11.2)
Operating revenues 40,582,464 100.0 38,173,286 100.0 6.3
Operating expenses:Operations and maintenance (16,264,205) (40.1) (15,548,650) (40.7) 4.6General and administrative write-off (4,250,816) (10.5) (4,517,936) (11.9) (5.9)
Operating expenses (20,515,021) (50.6) (20,066,586) (52.6) 2.2
Operating income beforedepreciation, otherpostemploymentbenefit expense, andnet flood expenses 20,067,443 49.4 18,106,700 47.4 10.8
Other postemployment benefit expense (4,061,330) (10.0) (3,897,773) (10.2) 4.2Depreciation expense (15,866,510) (39.1) (15,681,905) (41.1) 1.2Flood (expenses), net of insurance proceeds — — (270,454) (0.7) (100.0)
Operating income (loss) 139,603 0.3 (1,743,432) (4.6) (108.0)
Net nonoperating expenses (14,079) — (135,468) (0.4) (89.6)
Income (loss) before grantrevenue 125,524 0.3 (1,878,900) (4.9) (106.7)
Federal and state grant revenue 17,207,330 42.4 11,934,146 31.3 44.2
Increase in net position 17,332,854 42.7 10,055,246 26.4 72.4
Net position – beginning of year 309,758,721 — 299,703,475 — 3.4
Net position – end of year $ 327,091,575 —% $ 309,758,721 —% 5.6%
4 (Continued)
AIRPORT AUTHORITY OF THE CITY OF OMAHA
Management’s Discussion and Analysis
(Unaudited)
December 31, 2014 and 2013
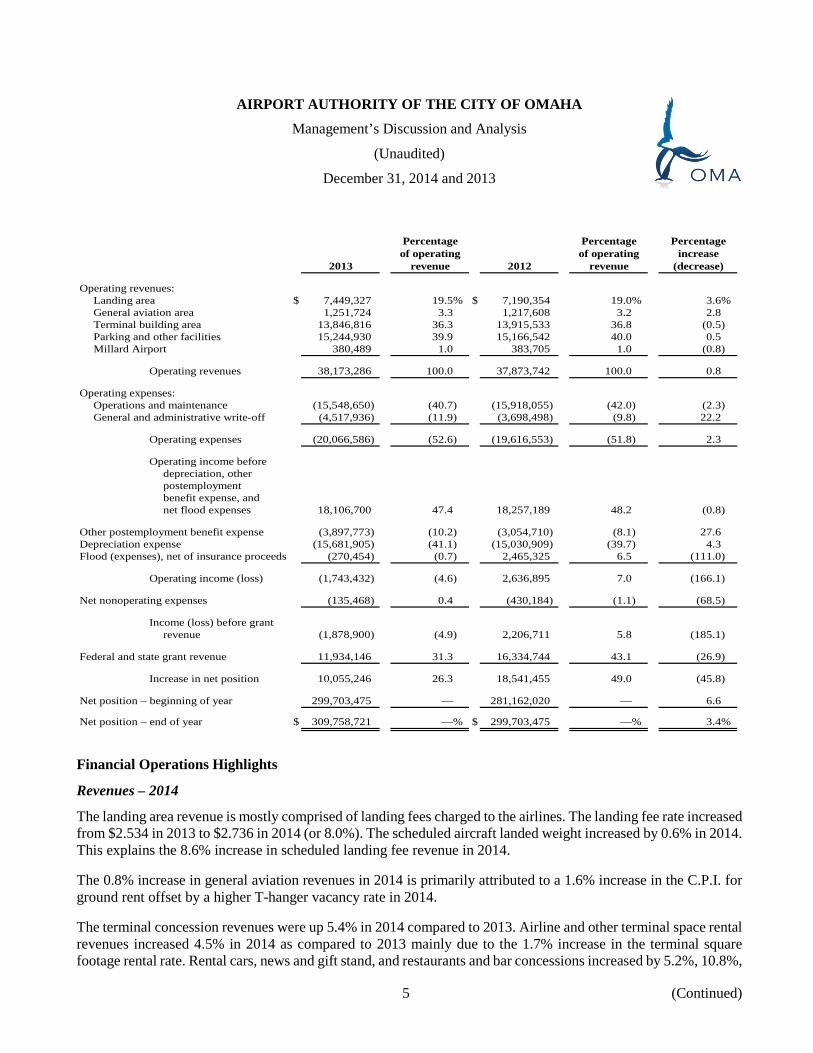
Percentage Percentage Percentageof operating of operating increase
2013 revenue 2012 revenue (decrease)
Operating revenues:Landing area $ 7,449,327 19.5% $ 7,190,354 19.0% 3.6%General aviation area 1,251,724 3.3 1,217,608 3.2 2.8Terminal building area 13,846,816 36.3 13,915,533 36.8 (0.5)Parking and other facilities 15,244,930 39.9 15,166,542 40.0 0.5Millard Airport 380,489 1.0 383,705 1.0 (0.8)
Operating revenues 38,173,286 100.0 37,873,742 100.0 0.8
Operating expenses:Operations and maintenance (15,548,650) (40.7) (15,918,055) (42.0) (2.3)General and administrative write-off (4,517,936) (11.9) (3,698,498) (9.8) 22.2
Operating expenses (20,066,586) (52.6) (19,616,553) (51.8) 2.3
Operating income beforedepreciation, otherpostemploymentbenefit expense, andnet flood expenses 18,106,700 47.4 18,257,189 48.2 (0.8)
Other postemployment benefit expense (3,897,773) (10.2) (3,054,710) (8.1) 27.6Depreciation expense (15,681,905) (41.1) (15,030,909) (39.7) 4.3Flood (expenses), net of insurance proceeds (270,454) (0.7) 2,465,325 6.5 (111.0)
Operating income (loss) (1,743,432) (4.6) 2,636,895 7.0 (166.1)
Net nonoperating expenses (135,468) 0.4 (430,184) (1.1) (68.5)
Income (loss) before grantrevenue (1,878,900) (4.9) 2,206,711 5.8 (185.1)
Federal and state grant revenue 11,934,146 31.3 16,334,744 43.1 (26.9)
Increase in net position 10,055,246 26.3 18,541,455 49.0 (45.8)
Net position – beginning of year 299,703,475 — 281,162,020 — 6.6
Net position – end of year $ 309,758,721 —% $ 299,703,475 —% 3.4%
Financial Operations Highlights
Revenues – 2014
The landing area revenue is mostly comprised of landing fees charged to the airlines. The landing fee rate increased from $2.534 in 2013 to $2.736 in 2014 (or 8.0%). The scheduled aircraft landed weight increased by 0.6% in 2014. This explains the 8.6% increase in scheduled landing fee revenue in 2014.
The 0.8% increase in general aviation revenues in 2014 is primarily attributed to a 1.6% increase in the C.P.I. for ground rent offset by a higher T-hanger vacancy rate in 2014.
The terminal concession revenues were up 5.4% in 2014 compared to 2013. Airline and other terminal space rental revenues increased 4.5% in 2014 as compared to 2013 mainly due to the 1.7% increase in the terminal square footage rental rate. Rental cars, news and gift stand, and restaurants and bar concessions increased by 5.2%, 10.8%,
5 (Continued)
AIRPORT AUTHORITY OF THE CITY OF OMAHA
Management’s Discussion and Analysis
(Unaudited)
December 31, 2014 and 2013
and 5.7%, respectively. The primary factor contributing to the concession revenue is a 1.9% increase in passenger traffic in 2014 compared to 2013.
The majority of other facilities revenue is for parking operations. The total parking revenue increased by 9.0% in 2014 as a result of an increase in passenger traffic, parking volume, and a $0.50 daily maximum rate increase in the parking garage.
Revenues – 2013
The landing area revenue is mostly comprised of landing fees charged to the airlines. The landing fee rate increased from $2.384 in 2012 to $2.534 in 2013 (or 6.3%); however, the scheduled aircraft landed weight decreased by 2.1% in 2013. This explains the 4.1% increase in scheduled landing fee revenue in 2013.
The 2.8% increase in general aviation revenues in 2013 is primarily attributed to a higher T-hangar vacancy rate in 2013 offset by the 3.3% increase in the C.P.I. for ground rent and the additional ground rent commenced for an FBO hangar project.
The terminal concession revenues were flat in 2013 compared to 2012. Airline and other terminal space rental revenues decreased 0.5% in 2013 as compared to 2012 mainly due to the 0.6% increase in the terminal square footage rental rate offset by the vacating of certain airline rented space by Frontier Airlines.
The majority of other facilities revenue is for parking operations. The total parking revenue increased by 1.4% in 2013 as a result of an increase in parking volume.
Expenses – 2014
Operations and maintenance expenses increased 4.6% in 2014. Cost-of-living increases in 2014, the staffing of a couple of key operation positions that were vacant for much of 2013, as well as timing of reimbursements from the TSA for LEO security checkpoint coverage, resulted in an increase of 4.2% in wages expense. Employee benefits increased due primarily to a 7.9% increase in medical premiums offset somewhat by staff reduction through attrition.
General and administrative expenses decreased 5.9% in 2014. Wages increased 10.4% due to the addition of personnel in the planning and engineering department, cost-of-living wage increases, and favorable yields in compensation investment accounts. Employee benefits increased 11.7% in 2014 due to the aforementioned medical premium increase and personnel additions. These general and administrative expenses were offset by a decrease in professional and other services as well as a decrease in other expenses due to a project being written off in 2013.
Depreciation expense increased in 2014, reflecting depreciation of major additions to the airfield during 2014 and 2013.
Other postemployment benefit expense accrual (OPEB) increased by 4.2% due to the actuary’s use of revised estimates for interest rates, claims history, and actuarial assumptions.
Net nonoperating expenses are comprised of interest expense and interest income. Interest expense decreased 14.5% in 2014 due to scheduled paydown of principal balances on January 1, 2014. Interest revenues increased by 21.9% due to a slight increase in average investment interest rates and more funds on deposit.
6 (Continued)
AIRPORT AUTHORITY OF THE CITY OF OMAHA
Management’s Discussion and Analysis
(Unaudited)
December 31, 2014 and 2013
Expenses – 2013
Operations and maintenance expenses decreased 2.3% in 2013. Cost-of-living increases in 2013, and the addition of a new IT department person were more than offset by management’s efforts to cross utilize personnel, not fill all vacant positions, and cut overtime, as well as reimbursements from the TSA for LEO security checkpoint coverage, all resulting in a decrease of 5.6% in wages expense. Employee benefits increased due primarily to a 6.8% increase in medical premiums and an 8.5% increase in dental premiums offset somewhat by staff reduction through attrition.
General and administrative expenses increased 22.2% in 2013. Wages increased 5.9% due to the allocation of certain of the new IT personnel from operations and maintenance, cost-of-living wage increases, and favorable yields in compensation investment accounts. Employee benefits increased 9.5% in 2013 due to the aforementioned medical and dental premium increase. The increase in property and casualty insurance of 39.0% resulted from increased workers’ compensation premiums in the past two policy periods plus the effect of the reversal of the expensed 2011 hail storm deductible of $100,000 to building impairments during 2012. Finally, a potential consolidated outgoing baggage project was designed at a total cost of $444,397, of which 90% was funded by a federal grant included in 2013 revenues. The project was abandoned, and thus, the entire cost was written off to expenses in 2013. The effect to the Authority was a net loss of approximately $45,000.
Depreciation expense increased in 2013, reflecting depreciation of major additions to the airfield during 2013 and 2012.
Other postemployment benefit expense accrual (OPEB) increased by 27.6% due to the actuary’s new three-year valuation and use of revised estimates for interest rates, claims history, and actuarial assumptions.
Net nonoperating expenses are comprised of interest expense and interest income. Interest expense decreased 32.2% in 2013 due to scheduled paydown of principal balances on January 1, 2013. Interest revenues increased by 53.7% due to a slight increase in average investment interest rates and more funds on deposit.
2013 flood expenses represent expenditures for small residual flood-fighting projects completed that were outside of the scope of insurance coverages.
Property, Plant, and Equipment Development and Expansion
The Authority’s mission is to provide excellence in customer service, airport facilities, air service, and security. All future facilities planning moves forward with this mission as its focus. Future facilities related to security issues mandated by the federal government are evolving as the federal government defines and redefines the issues. The Authority is committed to compliance with all federal security regulations, now and in the future.
The Authority’s property, plant, and equipment as of December 31, 2014 and 2013 amounted to $538,310,256 and $511,614,696, respectively, before accumulated depreciation. This investment in long-term assets includes land, land improvements, airfield improvements, parking facilities, buildings, equipment, Millard Airport (a reliever to Eppley Airfield), and construction in progress. The net increase in the Authority’s property, buildings, and equipment, before accumulated depreciation, for 2014 was $26,695,560, or 5.2%, and for 2013 was $20,553,763, or 4.2%, largely due to airfield runway, taxiway reconstruction, and building roof replacements. The increases
7 (Continued)
AIRPORT AUTHORITY OF THE CITY OF OMAHA
Management’s Discussion and Analysis
(Unaudited)
December 31, 2014 and 2013
were net of the $221,369 (2014) and $183,000 (2013) impairment of assets from the August 18, 2011 hail and wind storms.
Property, plant, and equipment acquisitions are capitalized at cost and are depreciated (except land and construction in progress) over their useful lives on the straight-line method. Authority acquisitions are funded using a variety of financing techniques, including cash flows from Authority operations, federal entitlement and discretionary grants (75% of total costs of typical authorized projects (90% for Millard Airport projects) or 100% of American Recovery and Reinvestment Act of 2009–2010 authorized projects), state grants, and airport revenue bond issuance. The Authority is not allowed to levy taxes. The Authority has not chosen to collect a Passenger Facility Charge (PFC), although such an option may be considered in major future acquisitions/projects.
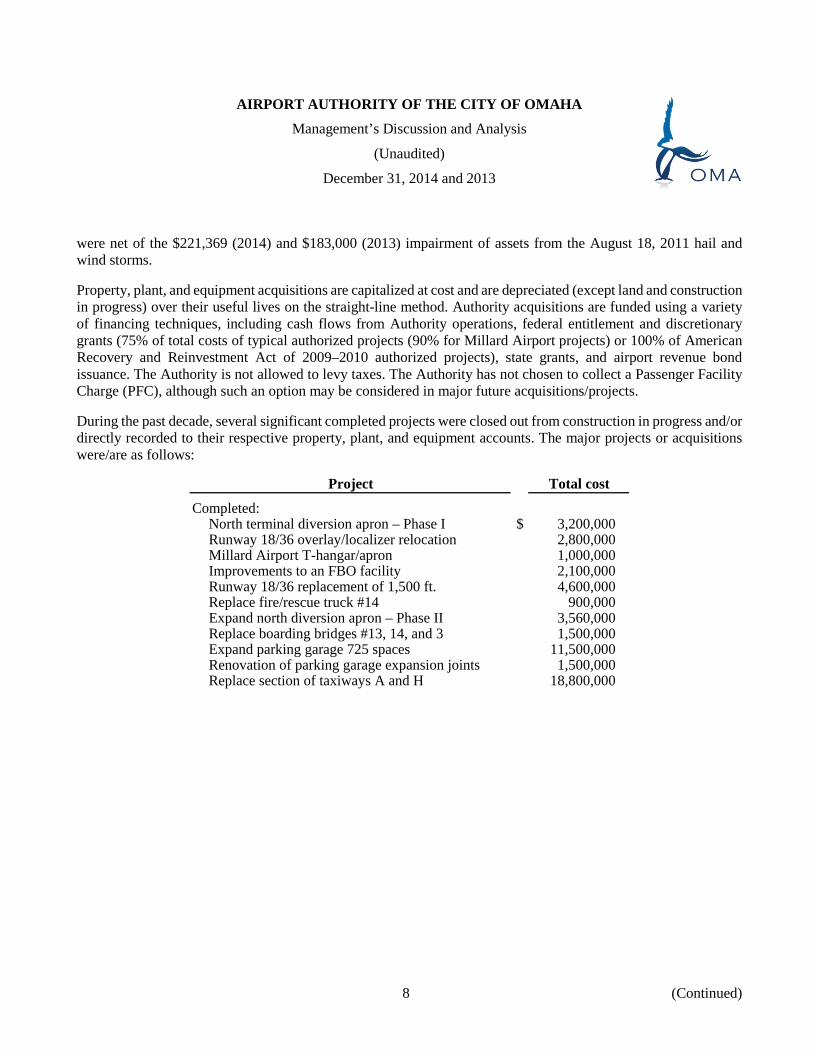
During the past decade, several significant completed projects were closed out from construction in progress and/or directly recorded to their respective property, plant, and equipment accounts. The major projects or acquisitions were/are as follows:
Project Total cost
Completed:North terminal diversion apron – Phase I $ 3,200,000 Runway 18/36 overlay/localizer relocation 2,800,000 Millard Airport T-hangar/apron 1,000,000 Improvements to an FBO facility 2,100,000 Runway 18/36 replacement of 1,500 ft. 4,600,000 Replace fire/rescue truck #14 900,000 Expand north diversion apron – Phase II 3,560,000 Replace boarding bridges #13, 14, and 3 1,500,000 Expand parking garage 725 spaces 11,500,000 Renovation of parking garage expansion joints 1,500,000 Replace section of taxiways A and H 18,800,000
8 (Continued)
AIRPORT AUTHORITY OF THE CITY OF OMAHA
Management’s Discussion and Analysis
(Unaudited)
December 31, 2014 and 2013
Project Total cost
Replace runway 14R/32L – South $ 12,700,000 Replace runway intersection 13,100,000 Replace runway 14R/32L – North 11,500,000 Extend taxiway S – North/Center 8,300,000 Replace fire/rescue truck #12 700,000 Replace East 300 ft. of Millard runway 400,000 Extend taxiway S – South 3,681,000 Replace taxiway L 8,441,000 Replace taxiway E 7,299,000 Replace boarding bridge #17 575,000 Replace runway snow blower 548,000 Replace runway rubber/paint removal truck 600,000 Purchase multi-task snow removal machine 600,000 Master plan review 3,800,000 Replace taxiway C, J, D, E access to ramp 17,915,000 Replace taxiway G 17,685,000 Replace southern end of runway 18/36 16,200,000 Replace east stormwater pumping station 2,900,000 Millard Airport runway overlay 1,380,000 Replace boarding bridge #16 654,000
In process/upcoming:Reconstruct terminal ramp – phase I 22,670,000 Construct US Customs General Aviation 1,000,000
FacilityNew parking garage – design only phase I and II 6,000,000
Long-Term Debt Administration
The Authority issued airport revenue bonds of $61,000,000 in 1984 when the terminal building was expanded and renovated, additional parking garages were built, various airfield storm water drainage was constructed, and certain taxiways/runways/aprons were improved. Since that time, the Authority has issued several tax-exempt airport revenue refunding bonds that substantially reduced interest expense. The 1984 bonds had interest rates as high as 10.75%. The coupon rates on the various remaining bonds outstanding as of December 31, 2014 (Series 2010) currently range from 2.50% to 4.25%. The principal balance of the bonds as of December 31, 2014, before the effects of bond premiums and deferred valuation adjustments for prior refunds, is $10,360,000, $805,000 of which was paid on January 1, 2015.
As the Authority is not allowed to levy taxes, it cannot issue any general obligation (GO) bonds. As the Authority has chosen not to collect PFCs to date, it does not have any PFC revenue bonds outstanding. Finally, the Authority has not issued any special-purpose facility bonds.
The Authority has one 0% hangar loan outstanding aggregating $40,120 at December 31, 2014.
9 (Continued)
AIRPORT AUTHORITY OF THE CITY OF OMAHA
Management’s Discussion and Analysis
(Unaudited)
December 31, 2014 and 2013
The Authority has the following revenue bond “stable” credit ratings: Standard & Poor’s AA- and Moody’s Aa3. The Authority’s currently outstanding airport revenue refunding bonds were issued with a fully funded debt service reserve fund.
On January 1, 2014, the Authority paid off the then remaining outstanding Series 2010-1 Airport Revenue Refunding Bonds at par due then totaling $3,210,000. This leaves only the Series 2010 bonds outstanding at December 31, 2014.
Contact Information
Questions concerning any of the information provided in this financial report or requests for additional information should be addressed to: Omaha Airport Authority, Attention: Stan Kathol, Director of Finance and Administration, 4501 Abbott Drive, Suite 2300, Eppley Airfield, Omaha, NE 68110.
10
Independent Auditors’ Report
The Board of Directors Airport Authority of the City of Omaha:
Report on Financial Statements
We have audited the accompanying financial statements of the Airport Authority of the City of Omaha (the Authority), which comprise the statements of net position as of December 31, 2014 and 2013, and the related statements of revenues, expenses, and changes in net position and cash flows for the years then ended, and the related notes to the financial statements.
Management’s Responsibility for the Financial Statements
Management is responsible for the preparation and fair presentation of these financial statements in accordance with U.S. generally accepted accounting principles; this includes the design, implementation, and maintenance of internal control relevant to the preparation and fair presentation of financial statements that are free from material misstatement, whether due to fraud or error.
Auditors’ Responsibility
Our responsibility is to express an opinion on these financial statements based on our audits. We conducted our audits in accordance with auditing standards generally accepted in the United States of America and the standards applicable to financial audits contained in Government Auditing Standards, issued by the Comptroller General of the United States. Those standards require that we plan and perform the audit to obtain reasonable assurance about whether the financial statements are free from material misstatement.
An audit involves performing procedures to obtain audit evidence about the amounts and disclosures in the financial statements. The procedures selected depend on the auditors’ judgment, including the assessment of the risks of material misstatement of the financial statements, whether due to fraud or error. In making those risk assessments, the auditor considers internal control relevant to the entity’s preparation and fair presentation of the financial statements in order to design audit procedures that are appropriate in the circumstances, but not for the purpose of expressing an opinion on the effectiveness of the entity’s internal control. Accordingly, we express no such opinion. An audit also includes evaluating the appropriateness of accounting policies used and the reasonableness of significant accounting estimates made by management, as well as evaluating the overall presentation of the financial statements.
We believe that the audit evidence we have obtained is sufficient and appropriate to provide a basis for our audit opinion.
Opinion
In our opinion, the financial statements referred to above present fairly, in all material respects, the financial position of the Airport Authority of the City of Omaha as of December 31, 2014 and 2013, and the changes in financial position and cash flows for the years then ended, in accordance with U.S. generally accepted accounting principles.
KPMG LLP Suite 300 1212 N. 96th Street Omaha, NE 68114-2274 Suite 1600 233 South 13th Street Lincoln, NE 68508-2041
KPMG LLP is a Delaware limited liability partnership, the U.S. member firm of KPMG International Cooperative (“KPMG International”), a Swiss entity.
Other Matters
Required Supplementary Information
U.S. generally accepted accounting principles require that the management’s discussion and analysis on pages 1 through 10 and the schedules of funding progress on page 31 be presented to supplement the basic financial statements. Such information, although not a part of the basic financial statements, is required by the Governmental Accounting Standards Board, which considers it to be an essential part of financial reporting for placing the basic financial statements in an appropriate operational, economic, or historical context. We have applied certain limited procedures to the required supplementary information in accordance with auditing standards generally accepted in the United States of America, which consisted of inquiries of management about the methods of preparing the information and comparing the information for consistency with management’s responses to our inquiries, the basic financial statements, and other knowledge we obtained during our audit of the basic financial statements. We do not express an opinion or provide any assurance on the information because the limited procedures do not provide us with sufficient evidence to express an opinion or provide any assurance.
Supplementary Information
Our audit was conducted for the purpose of forming an opinion on the financial statements that collectively comprise the Authority’s basic financial statements. The Schedules of Revenues and Expenses are presented for purposes of additional analysis and are not a required part of the basic financial statements.
The Schedules of Revenues and Expenses are the responsibility of management and were derived from and relate directly to the underlying accounting and other records used to prepare the basic financial statements. Such information has been subjected to the auditing procedures applied in the audit of the basic financial statements and certain additional procedures, including comparing and reconciling such information directly to the underlying accounting and other records used to prepare the basic financial statements or to the basic financial statements themselves, and other additional procedures in accordance with auditing standards generally accepted in the United States of America. In our opinion, the Schedules of Revenues and Expenses are fairly stated in all material respects in relation to the basic financial statements as a whole.
Other Reporting Required by Government Auditing Standards
In accordance with Government Auditing Standards, we have also issued our report dated April 3, 2015, on our consideration of the Authority’s internal control over financial reporting and on our tests of its compliance with certain provisions of laws, regulations, contracts, and grant agreements and other matters. The purpose of that report is to describe the scope of our testing of internal control over financial reporting and compliance and the results of that testing, and not to provide an opinion on internal control over financial reporting or on compliance. That report is an integral part of an audit performed in accordance with Government Auditing Standards in considering the Authority’s internal control over financial reporting and compliance.
/s/KPMG LLP
Omaha, Nebraska April 3, 2015
12
13
AIRPORT AUTHORITY OF THE CITY OF OMAHA
Statements of Net Position
December 31, 2014 and 2013
Assets 2014 2013
Current assets:Cash and cash equivalents, unrestricted $ 11,497,911 6,799,595 Cash and cash equivalents, restricted 990,107 3,427,207 Investments 77,994,355 72,995,334 Receivables, less allowance for doubtful accounts of $188,972
and $227,041 in 2014 and 2013, respectively 1,449,688 1,488,617 Other receivables – insurance proceeds 221,369 — Due from governmental agencies 4,843,232 2,987,193 Accrued interest receivable 529,380 305,199 Prepaid expenses 1,154,314 1,019,017
Total current assets 98,680,356 89,022,162
Noncurrent assets:Restricted assets:
Bond reserve funds:Cash and cash equivalents 1,026,686 1,026,686
Property, plant, and equipment, net 262,043,642 250,887,008
Total noncurrent assets 263,070,328 251,913,694 Total assets $ 361,750,684 340,935,856
Liabilities and Net Position
Current liabilities:Current installments of long-term debt $ 833,459 3,239,281 Accounts payable and accrued expenses 2,079,921 1,876,515 Due to contractors, including retainage of $452,307 in 2014
and $219,305 in 2013 3,714,637 1,226,017 Accrued interest payable 185,107 217,207
Total current liabilities 6,813,124 6,559,020
Noncurrent liabilities:Other postemployment benefit payable 18,196,209 14,134,879 Long-term debt, excluding current installments 9,649,776 10,483,236
Total liabilities 34,659,109 31,177,135
Net position:Net investment in capital assets 248,872,456 236,965,160 Restricted for debt service, net of related accrued interest payable 805,000 3,210,000 Unrestricted 77,414,119 69,583,561
Total net position 327,091,575 309,758,721 Total liabilities and net position $ 361,750,684 340,935,856
See accompanying notes to financial statements.
14
AIRPORT AUTHORITY OF THE CITY OF OMAHA
Statements of Revenues, Expenses, and Changes in Net Position
Years ended December 31, 2014 and 2013
2014 2013
Operating revenues:Landing area $ 8,061,910 7,449,327 General aviation area 1,262,260 1,251,724 Terminal building area 14,536,350 13,846,816 Other facility area 16,383,882 15,244,930 Millard Airport 338,062 380,489
Total operating revenues 40,582,464 38,173,286
Operating expenses:Operations and maintenance:
Wages 7,933,701 7,614,550 Payroll taxes 575,094 556,148 Employee benefits 3,582,108 3,489,056 Supplies and materials 1,176,313 1,127,072 Contractual services 1,160,802 1,035,695 Electricity 1,112,795 1,041,197 Fuel – heating 184,047 133,450 Water and sewer fee 203,295 188,387 Trash disposal 39,904 39,300 Communications 83,453 90,218 Gasoline and oil 175,649 196,963 Other 37,044 36,614
Total operations and maintenance 16,264,205 15,548,650
General and administrative:Salaries 1,722,072 1,559,662 Payroll taxes 97,778 85,921 Employee benefits 653,151 584,995 Supplies, materials, and postage 86,453 96,377 Professional services 878,499 947,876 Promotion and public relations 35,912 20,953 Travel and transportation 23,290 20,684 Communications 17,901 14,627 Dues and subscriptions 53,174 56,387 Insurance 666,683 678,386 Other, including write-offs 15,903 452,068
Total general and administrative 4,250,816 4,517,936
Total operating expenses, before depreciation expense, other postemploymentbenefit expense, and net flood expense 20,515,021 20,066,586
Operating income before depreciation expense, other postemploymentbenefit expense, and net flood expense 20,067,443 18,106,700
Other postemployment benefit expense 4,061,330 3,897,773 Depreciation expense 15,866,510 15,681,905
Operating income (loss) before net flood expenses 139,603 (1,472,978)
Flood (expenses), net of insurance proceeds — (270,454)
Operating income (loss) 139,603 (1,743,432)
Nonoperating revenues and expenses:Interest revenue 341,013 279,722 Interest expense (355,092) (415,190)
Nonoperating expenses, net (14,079) (135,468)
Income (loss) before grant revenue 125,524 (1,878,900)
Federal grant revenue 17,207,330 11,934,146
Increase in net position 17,332,854 10,055,246
Total net position, beginning of year 309,758,721 299,703,475 Total net position, end of year $ 327,091,575 309,758,721
See accompanying notes to financial statements.
15
AIRPORT AUTHORITY OF THE CITY OF OMAHA
Statements of Cash Flows
Years ended December 31, 2014 and 2013
2014 2013
Cash flows from operating activities:Cash received from tenants/customers $ 40,400,024 37,693,625 Cash paid to suppliers for goods and services (6,081,432) (6,251,111) Cash paid to employees for salaries, wages, and benefits (14,365,480) (13,739,292) Cash paid for flood expenses, net of insurance — (270,454)
Net cash provided by operating activities 19,953,112 17,432,768
Cash flows from capital and related financing activities:Acquisition and construction of property, plant, and equipment (24,534,524) (21,531,234) Proceeds received from insurance on building impairment, net — 249,984 Principal paid on long-term debt (3,224,160) (2,384,758) Interest paid on long-term debt (402,314) (458,114) Capital grants received 15,351,291 10,258,012
Net cash used in capital and relatedfinancing activities (12,809,707) (13,866,110)
Cash flows from investing activities:Net purchase of investments (4,999,021) (9,998,798) Interest received on investments 116,832 142,249
Net cash used in investing activities (4,882,189) (9,856,549)
Net increase (decrease) in cash and cash equivalents 2,261,216 (6,289,891)
Cash and cash equivalents, beginning of year 11,253,488 17,543,379 Cash and cash equivalents, end of year $ 13,514,704 11,253,488
Reconciliation of operating income to net cash provided byoperating activities:
Operating income (loss) $ 139,603 (1,743,432) Adjustments to reconcile operating income (loss) to net cash
provided by operating activities:Depreciation expense 15,866,510 15,681,905 Change in assets and liabilities resulting from operations:
Receivables (182,440) (479,661) Prepaid expenses (135,297) (25,496) Accounts payable and accrued expenses 203,406 101,679 Increase in other postemployment benefit payable 4,061,330 3,897,773
Net cash provided by operating activities $ 19,953,112 17,432,768
See accompanying notes to financial statements.
AIRPORT AUTHORITY OF THE CITY OF OMAHA
Notes to Financial Statements
December 31, 2014 and 2013
(1) Summary of Significant Accounting Policies
(a) Authority Operations
The Airport Authority of the City of Omaha (the Authority) was created pursuant to Nebraska state law. The affairs of the Authority are conducted by a board whose members are appointed by the mayor of the City of Omaha, Nebraska (the City), with the approval of the City Council. The Authority is a special-purpose government engaged only in business-type activities. The majority of the Authority’s income is generated from airport user fees, including airline landing fees and terminal rentals, concession fees, and other building rentals. The Authority does not levy or collect property taxes. The Authority is not included in the City’s financial statements because the City is not financially accountable for the Authority. The accompanying financial statements are presented on the accrual basis of accounting and the economic resources measurement focus and reflect the assets and liabilities owned by the Authority and the results of the Authority’s operations.
Operating revenues, such as rental income, result from exchange transactions associated with the principal activity of the Authority. Exchange transactions are those in which each party receives and gives up essentially equal values. Nonoperating revenues, such as interest, result from nonexchange transactions.
When both restricted and unrestricted resources are available for use, it is the Authority’s policy to use restricted resources first and then unrestricted resources as they are needed.
(b) Grants
The Authority has entered into grant agreements with government agencies on certain construction projects. The Authority recognizes grant revenue as construction progresses on each project and when eligibility requirements are met. The Authority has in process various grants from the U.S. Department of Transportation/Federal Aviation Administration for the funding of Airport Improvement Program.
(c) Depreciation
Property, plant, and equipment are stated at historical cost. Depreciation of property, plant, and equipment is provided on all depreciable assets (except land and construction in progress), including those acquired with grants, over the estimated useful lives of the respective assets on the straight-line method.
Land Improvements 20–25 yearsAirfield Improvements 15–30 yearsAuto Parking Areas 10–30 yearsBuilding 10–30 yearsBuilding Furnishings 5–7 yearsEquipment 5–15 yearsMillard Airport 5–30 years
16 (Continued)
AIRPORT AUTHORITY OF THE CITY OF OMAHA
Notes to Financial Statements
December 31, 2014 and 2013
(d) Investments
Investments, primarily U.S. Treasury strips, are carried at amortized cost which approximates market. All investments of the Authority are carried to maturity.
(e) Cash Equivalents
The Authority considers all highly liquid investments with an original average maturity of three months or less from the date of purchase to be cash equivalents.
(f) Tax-Exempt Status
The Authority, a corporate municipality authorized by state statute and activated as a result of passage of a City resolution, is not subject to federal, state, or local income, sales, or property taxes.
(g) Use of Estimates
The preparation of the financial statements in conformity with U.S. generally accepted accounting principles requires management to make estimates and assumptions that affect the reported amount of assets and liabilities and disclosure of contingent assets and liabilities at the date of the financial statements, and the reported amounts of revenues and expenses during the reporting period. Actual results may differ from the estimates and assumptions used in preparing the financial statements.
(2) Cash and Investments
Restricted bond reserve and debt service funds held by the Authority at December 31, 2014 and 2013 include cash and money market account balances (cash and cash equivalents) totaling $2,016,793 and $4,453,893, respectively. All other unrestricted cash and investments (exclusive of U.S. government securities) held at December 31, 2014 and 2013 include similar items, as well as cash totaling $10,999,911 and $6,378,595, respectively, and deferred compensation mutual and stock funds totaling $498,000 and $421,000, respectively, which are considered cash equivalents.
Statutes and resolutions adopted by the board of directors authorize the Authority to invest in obligations of the U.S. Treasury, agencies and instrumentalities, and repurchase agreements, and mutual and stock funds within the deferred compensation accounts. The Authority’s investments consist of U.S. government securities backed by the full faith and credit of the U.S. government, except for the deferred compensation mutual and stock funds. These securities are held by the Authority’s trustee in accordance with the terms of the trust agreement and in the Authority’s name. At December 31, 2014 and 2013, management believes the Authority is in compliance with the applicable statutes and resolutions. At December 31, 2014 and 2013, all bank balances were covered by federal depository insurance or pledged collateral.
17 (Continued)
AIRPORT AUTHORITY OF THE CITY OF OMAHA
Notes to Financial Statements
December 31, 2014 and 2013
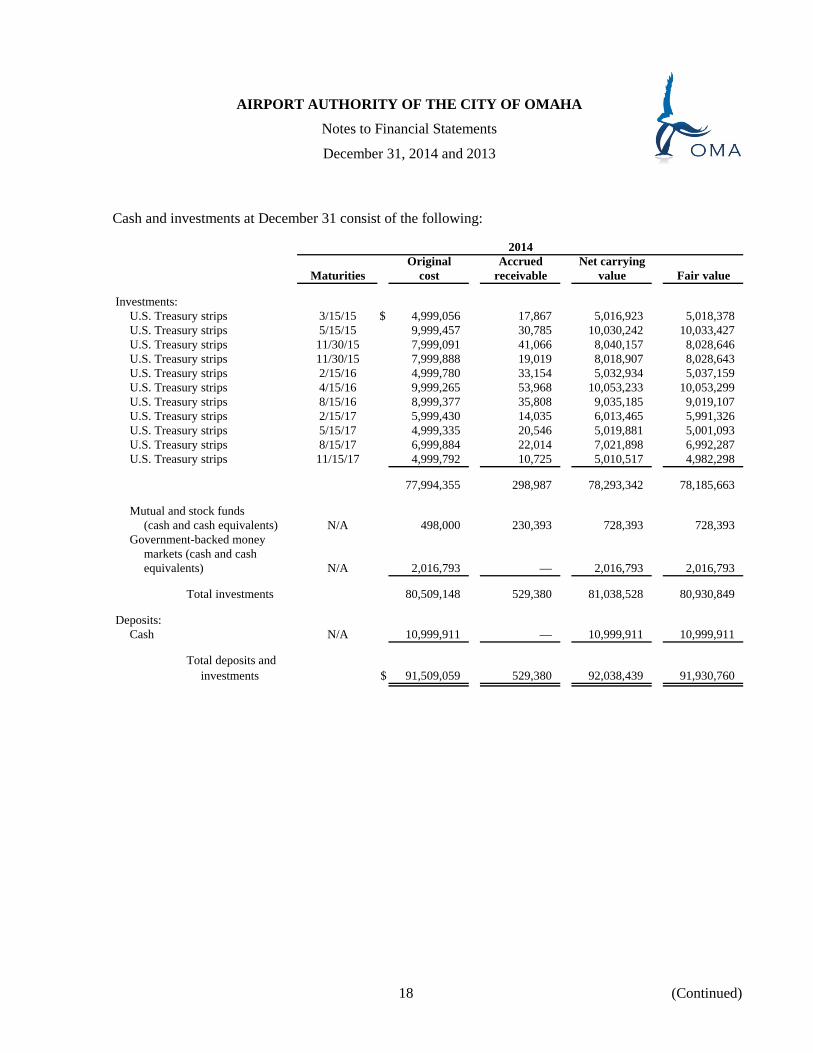
Cash and investments at December 31 consist of the following:
2014Original Accrued Net carrying
Maturities cost receivable value Fair value
Investments:U.S. Treasury strips 3/15/15 $ 4,999,056 17,867 5,016,923 5,018,378 U.S. Treasury strips 5/15/15 9,999,457 30,785 10,030,242 10,033,427 U.S. Treasury strips 11/30/15 7,999,091 41,066 8,040,157 8,028,646 U.S. Treasury strips 11/30/15 7,999,888 19,019 8,018,907 8,028,643 U.S. Treasury strips 2/15/16 4,999,780 33,154 5,032,934 5,037,159 U.S. Treasury strips 4/15/16 9,999,265 53,968 10,053,233 10,053,299 U.S. Treasury strips 8/15/16 8,999,377 35,808 9,035,185 9,019,107 U.S. Treasury strips 2/15/17 5,999,430 14,035 6,013,465 5,991,326 U.S. Treasury strips 5/15/17 4,999,335 20,546 5,019,881 5,001,093 U.S. Treasury strips 8/15/17 6,999,884 22,014 7,021,898 6,992,287 U.S. Treasury strips 11/15/17 4,999,792 10,725 5,010,517 4,982,298
77,994,355 298,987 78,293,342 78,185,663
Mutual and stock funds(cash and cash equivalents) N/A 498,000 230,393 728,393 728,393
Government-backed moneymarkets (cash and cashequivalents) N/A 2,016,793 — 2,016,793 2,016,793
Total investments 80,509,148 529,380 81,038,528 80,930,849
Deposits:Cash N/A 10,999,911 — 10,999,911 10,999,911
Total deposits andinvestments $ 91,509,059 529,380 92,038,439 91,930,760
18 (Continued)
AIRPORT AUTHORITY OF THE CITY OF OMAHA
Notes to Financial Statements
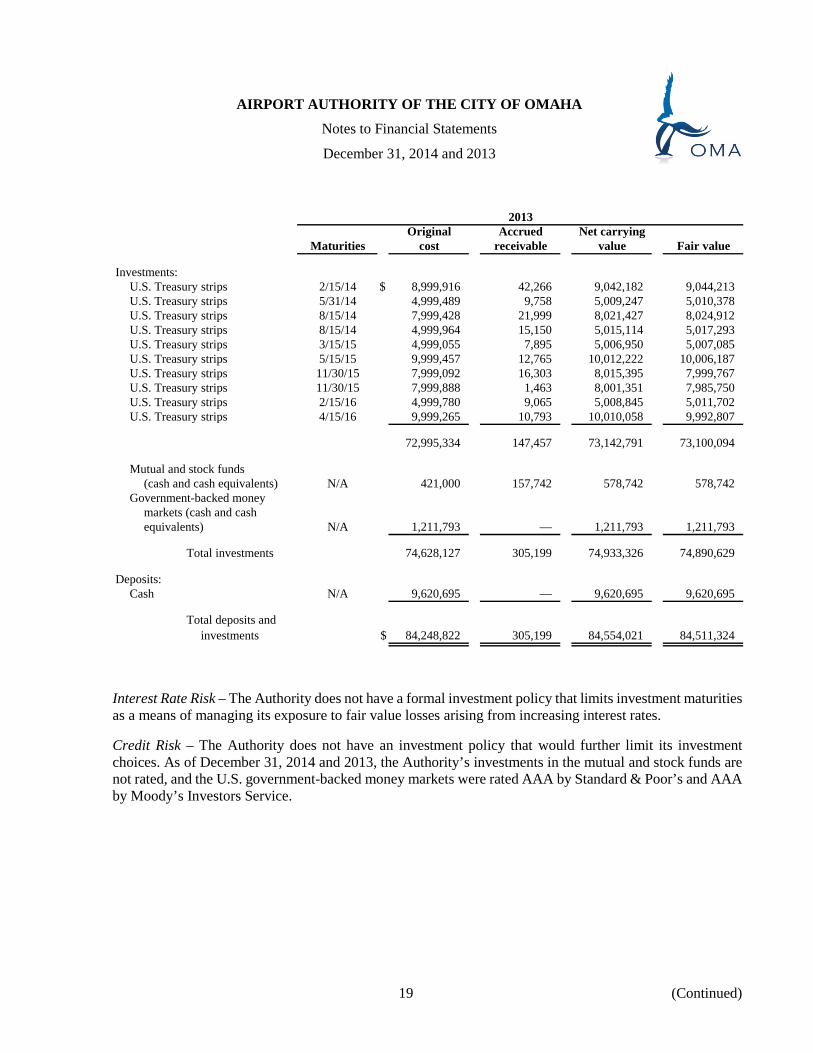
December 31, 2014 and 2013
2013Original Accrued Net carrying
Maturities cost receivable value Fair value
Investments:U.S. Treasury strips 2/15/14 $ 8,999,916 42,266 9,042,182 9,044,213 U.S. Treasury strips 5/31/14 4,999,489 9,758 5,009,247 5,010,378 U.S. Treasury strips 8/15/14 7,999,428 21,999 8,021,427 8,024,912 U.S. Treasury strips 8/15/14 4,999,964 15,150 5,015,114 5,017,293 U.S. Treasury strips 3/15/15 4,999,055 7,895 5,006,950 5,007,085 U.S. Treasury strips 5/15/15 9,999,457 12,765 10,012,222 10,006,187 U.S. Treasury strips 11/30/15 7,999,092 16,303 8,015,395 7,999,767 U.S. Treasury strips 11/30/15 7,999,888 1,463 8,001,351 7,985,750 U.S. Treasury strips 2/15/16 4,999,780 9,065 5,008,845 5,011,702 U.S. Treasury strips 4/15/16 9,999,265 10,793 10,010,058 9,992,807
72,995,334 147,457 73,142,791 73,100,094
Mutual and stock funds(cash and cash equivalents) N/A 421,000 157,742 578,742 578,742
Government-backed moneymarkets (cash and cashequivalents) N/A 1,211,793 — 1,211,793 1,211,793
Total investments 74,628,127 305,199 74,933,326 74,890,629
Deposits:Cash N/A 9,620,695 — 9,620,695 9,620,695
Total deposits andinvestments $ 84,248,822 305,199 84,554,021 84,511,324
Interest Rate Risk – The Authority does not have a formal investment policy that limits investment maturities as a means of managing its exposure to fair value losses arising from increasing interest rates.
Credit Risk – The Authority does not have an investment policy that would further limit its investment choices. As of December 31, 2014 and 2013, the Authority’s investments in the mutual and stock funds are not rated, and the U.S. government-backed money markets were rated AAA by Standard & Poor’s and AAA by Moody’s Investors Service.
19 (Continued)
AIRPORT AUTHORITY OF THE CITY OF OMAHA
Notes to Financial Statements
December 31, 2014 and 2013
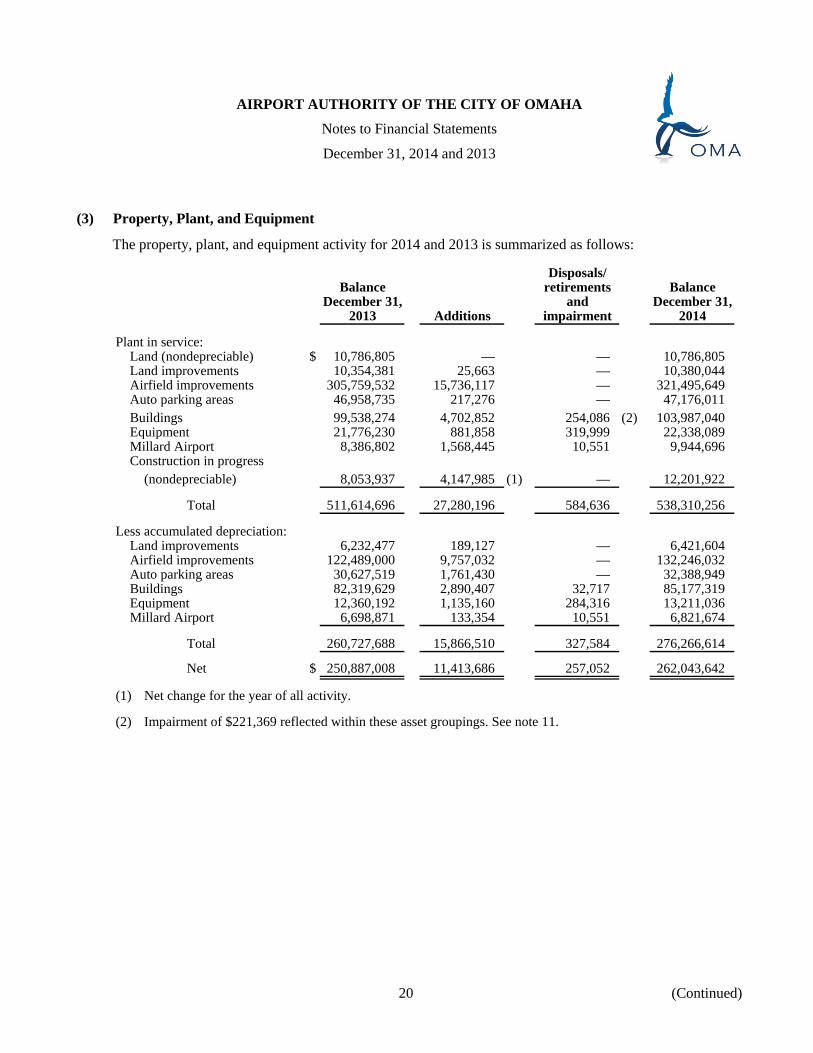
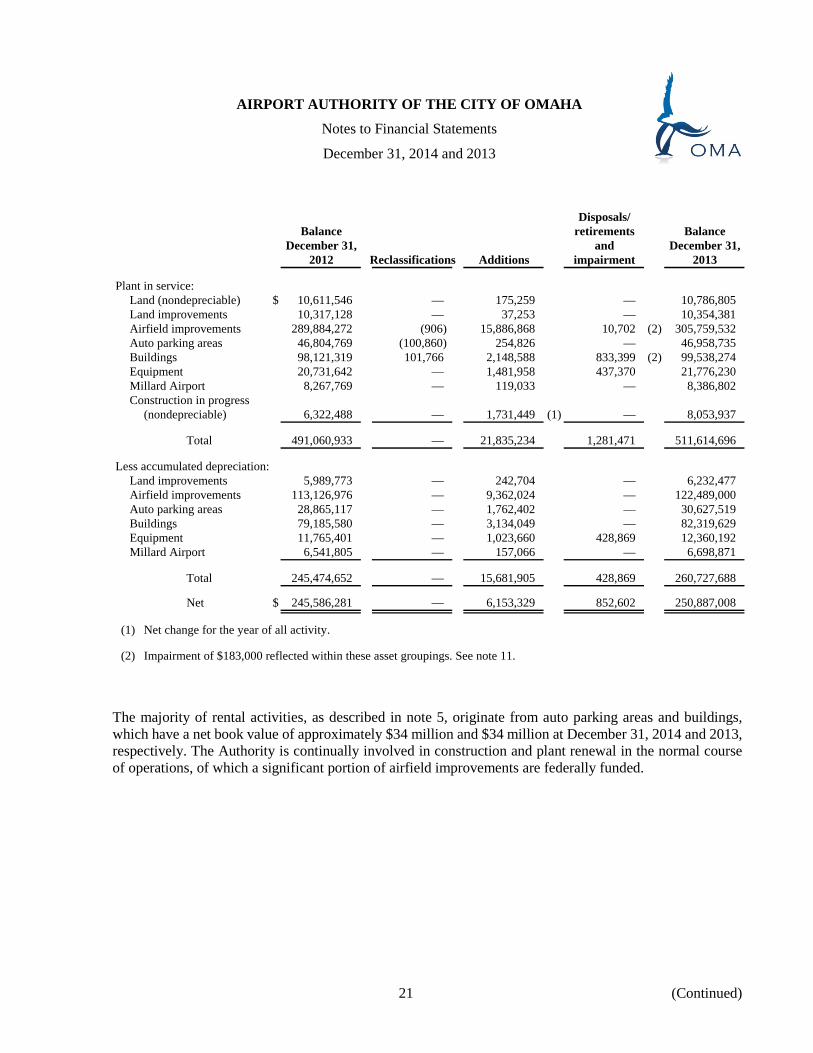
(3) Property, Plant, and Equipment
The property, plant, and equipment activity for 2014 and 2013 is summarized as follows:
Disposals/Balance retirements Balance
December 31, and December 31,2013 Additions impairment 2014
Plant in service:Land (nondepreciable) $ 10,786,805 — — 10,786,805 Land improvements 10,354,381 25,663 — 10,380,044 Airfield improvements 305,759,532 15,736,117 — 321,495,649 Auto parking areas 46,958,735 217,276 — 47,176,011 Buildings 99,538,274 4,702,852 254,086 (2) 103,987,040 Equipment 21,776,230 881,858 319,999 22,338,089 Millard Airport 8,386,802 1,568,445 10,551 9,944,696 Construction in progress
(nondepreciable) 8,053,937 4,147,985 (1) — 12,201,922
Total 511,614,696 27,280,196 584,636 538,310,256
Less accumulated depreciation:Land improvements 6,232,477 189,127 — 6,421,604 Airfield improvements 122,489,000 9,757,032 — 132,246,032 Auto parking areas 30,627,519 1,761,430 — 32,388,949 Buildings 82,319,629 2,890,407 32,717 85,177,319 Equipment 12,360,192 1,135,160 284,316 13,211,036 Millard Airport 6,698,871 133,354 10,551 6,821,674
Total 260,727,688 15,866,510 327,584 276,266,614
Net $ 250,887,008 11,413,686 257,052 262,043,642
(1) Net change for the year of all activity.
(2) Impairment of $221,369 reflected within these asset groupings. See note 11.
20 (Continued)
AIRPORT AUTHORITY OF THE CITY OF OMAHA
Notes to Financial Statements
December 31, 2014 and 2013
Disposals/Balance retirements Balance
December 31, and December 31,2012 Reclassifications Additions impairment 2013
Plant in service:Land (nondepreciable) $ 10,611,546 — 175,259 — 10,786,805 Land improvements 10,317,128 — 37,253 — 10,354,381 Airfield improvements 289,884,272 (906) 15,886,868 10,702 (2) 305,759,532 Auto parking areas 46,804,769 (100,860) 254,826 — 46,958,735 Buildings 98,121,319 101,766 2,148,588 833,399 (2) 99,538,274 Equipment 20,731,642 — 1,481,958 437,370 21,776,230 Millard Airport 8,267,769 — 119,033 — 8,386,802 Construction in progress
(nondepreciable) 6,322,488 — 1,731,449 (1) — 8,053,937
Total 491,060,933 — 21,835,234 1,281,471 511,614,696
Less accumulated depreciation:Land improvements 5,989,773 — 242,704 — 6,232,477 Airfield improvements 113,126,976 — 9,362,024 — 122,489,000 Auto parking areas 28,865,117 — 1,762,402 — 30,627,519 Buildings 79,185,580 — 3,134,049 — 82,319,629 Equipment 11,765,401 — 1,023,660 428,869 12,360,192 Millard Airport 6,541,805 — 157,066 — 6,698,871
Total 245,474,652 — 15,681,905 428,869 260,727,688
Net $ 245,586,281 — 6,153,329 852,602 250,887,008
(1) Net change for the year of all activity.
(2) Impairment of $183,000 reflected within these asset groupings. See note 11.
The majority of rental activities, as described in note 5, originate from auto parking areas and buildings, which have a net book value of approximately $34 million and $34 million at December 31, 2014 and 2013, respectively. The Authority is continually involved in construction and plant renewal in the normal course of operations, of which a significant portion of airfield improvements are federally funded.
21 (Continued)
AIRPORT AUTHORITY OF THE CITY OF OMAHA
Notes to Financial Statements
December 31, 2014 and 2013
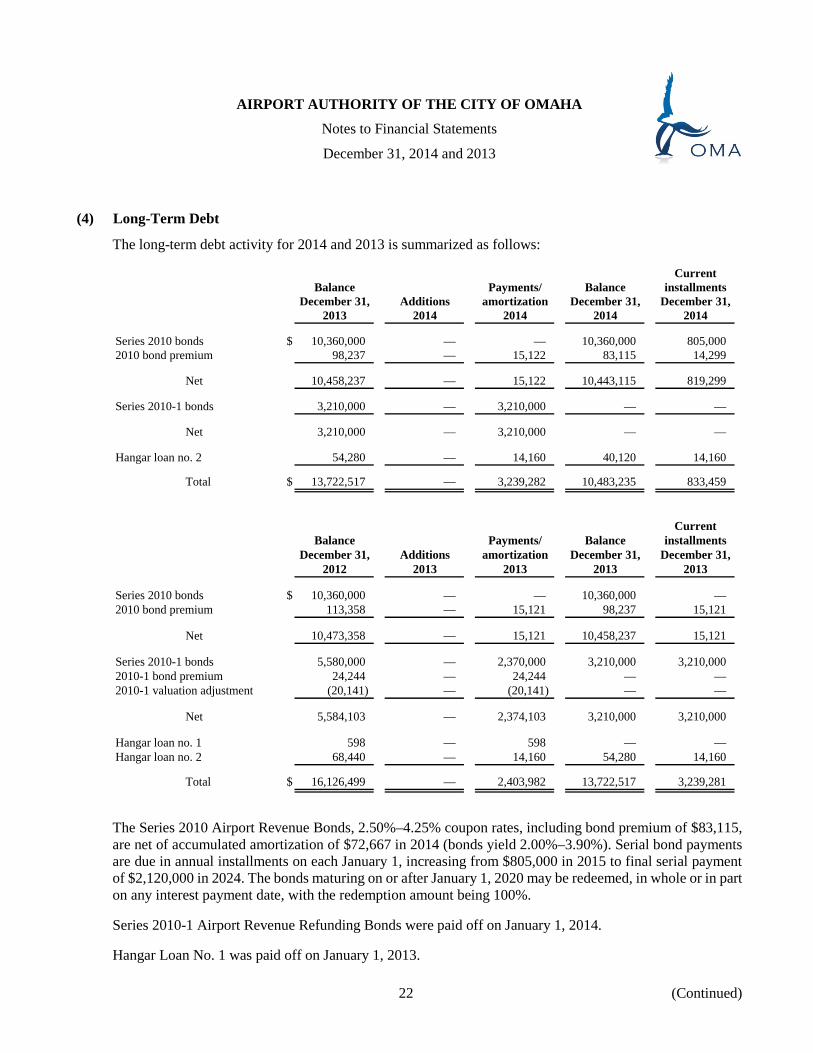
(4) Long-Term Debt
The long-term debt activity for 2014 and 2013 is summarized as follows:
CurrentBalance Payments/ Balance installments
December 31, Additions amortization December 31, December 31,2013 2014 2014 2014 2014
Series 2010 bonds $ 10,360,000 — — 10,360,000 805,000 2010 bond premium 98,237 — 15,122 83,115 14,299
Net 10,458,237 — 15,122 10,443,115 819,299
Series 2010-1 bonds 3,210,000 — 3,210,000 — —
Net 3,210,000 — 3,210,000 — —
Hangar loan no. 2 54,280 — 14,160 40,120 14,160
Total $ 13,722,517 — 3,239,282 10,483,235 833,459
CurrentBalance Payments/ Balance installments
December 31, Additions amortization December 31, December 31,2012 2013 2013 2013 2013
Series 2010 bonds $ 10,360,000 — — 10,360,000 — 2010 bond premium 113,358 — 15,121 98,237 15,121
Net 10,473,358 — 15,121 10,458,237 15,121
Series 2010-1 bonds 5,580,000 — 2,370,000 3,210,000 3,210,000 2010-1 bond premium 24,244 — 24,244 — — 2010-1 valuation adjustment (20,141) — (20,141) — —
Net 5,584,103 — 2,374,103 3,210,000 3,210,000
Hangar loan no. 1 598 — 598 — — Hangar loan no. 2 68,440 — 14,160 54,280 14,160
Total $ 16,126,499 — 2,403,982 13,722,517 3,239,281
The Series 2010 Airport Revenue Bonds, 2.50%–4.25% coupon rates, including bond premium of $83,115, are net of accumulated amortization of $72,667 in 2014 (bonds yield 2.00%–3.90%). Serial bond payments are due in annual installments on each January 1, increasing from $805,000 in 2015 to final serial payment of $2,120,000 in 2024. The bonds maturing on or after January 1, 2020 may be redeemed, in whole or in part on any interest payment date, with the redemption amount being 100%.
Series 2010-1 Airport Revenue Refunding Bonds were paid off on January 1, 2014.
Hangar Loan No. 1 was paid off on January 1, 2013.
22 (Continued)
AIRPORT AUTHORITY OF THE CITY OF OMAHA
Notes to Financial Statements
December 31, 2014 and 2013
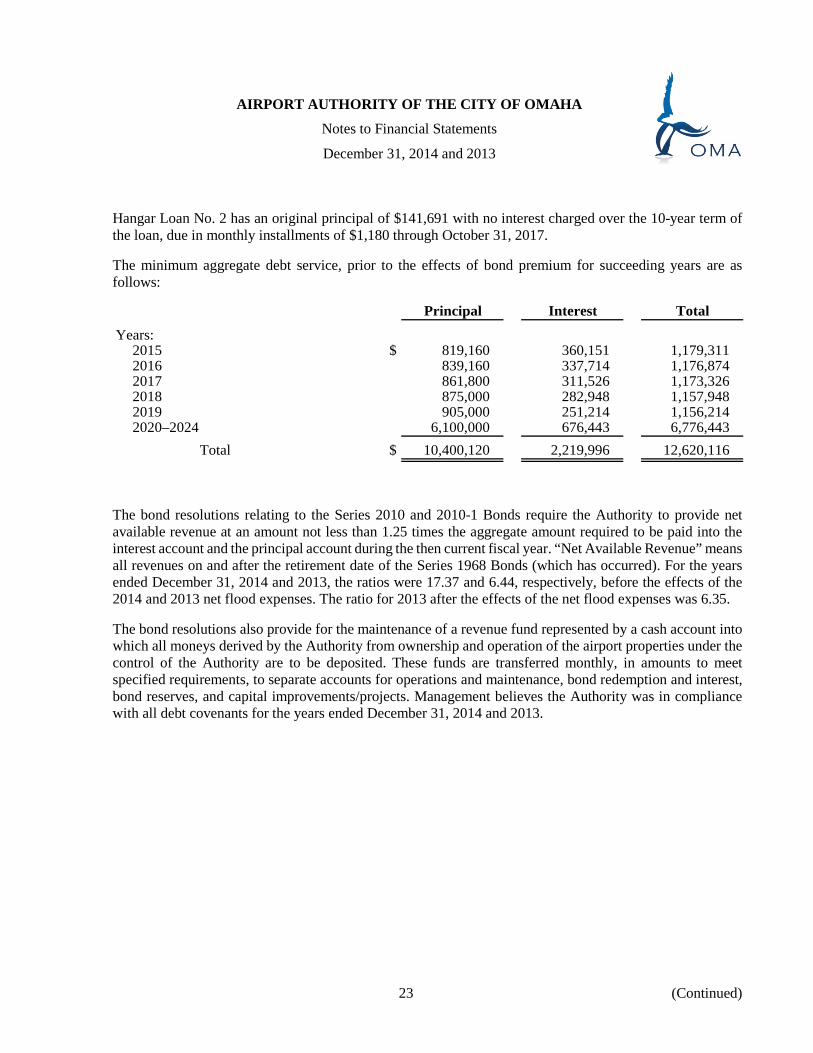
Hangar Loan No. 2 has an original principal of $141,691 with no interest charged over the 10-year term of the loan, due in monthly installments of $1,180 through October 31, 2017.
The minimum aggregate debt service, prior to the effects of bond premium for succeeding years are as follows:
Principal Interest Total
Years:2015 $ 819,160 360,151 1,179,311 2016 839,160 337,714 1,176,874 2017 861,800 311,526 1,173,326 2018 875,000 282,948 1,157,948 2019 905,000 251,214 1,156,214 2020–2024 6,100,000 676,443 6,776,443
Total $ 10,400,120 2,219,996 12,620,116
The bond resolutions relating to the Series 2010 and 2010-1 Bonds require the Authority to provide net available revenue at an amount not less than 1.25 times the aggregate amount required to be paid into the interest account and the principal account during the then current fiscal year. “Net Available Revenue” means all revenues on and after the retirement date of the Series 1968 Bonds (which has occurred). For the years ended December 31, 2014 and 2013, the ratios were 17.37 and 6.44, respectively, before the effects of the 2014 and 2013 net flood expenses. The ratio for 2013 after the effects of the net flood expenses was 6.35.
The bond resolutions also provide for the maintenance of a revenue fund represented by a cash account into which all moneys derived by the Authority from ownership and operation of the airport properties under the control of the Authority are to be deposited. These funds are transferred monthly, in amounts to meet specified requirements, to separate accounts for operations and maintenance, bond redemption and interest, bond reserves, and capital improvements/projects. Management believes the Authority was in compliance with all debt covenants for the years ended December 31, 2014 and 2013.
23 (Continued)
AIRPORT AUTHORITY OF THE CITY OF OMAHA
Notes to Financial Statements
December 31, 2014 and 2013
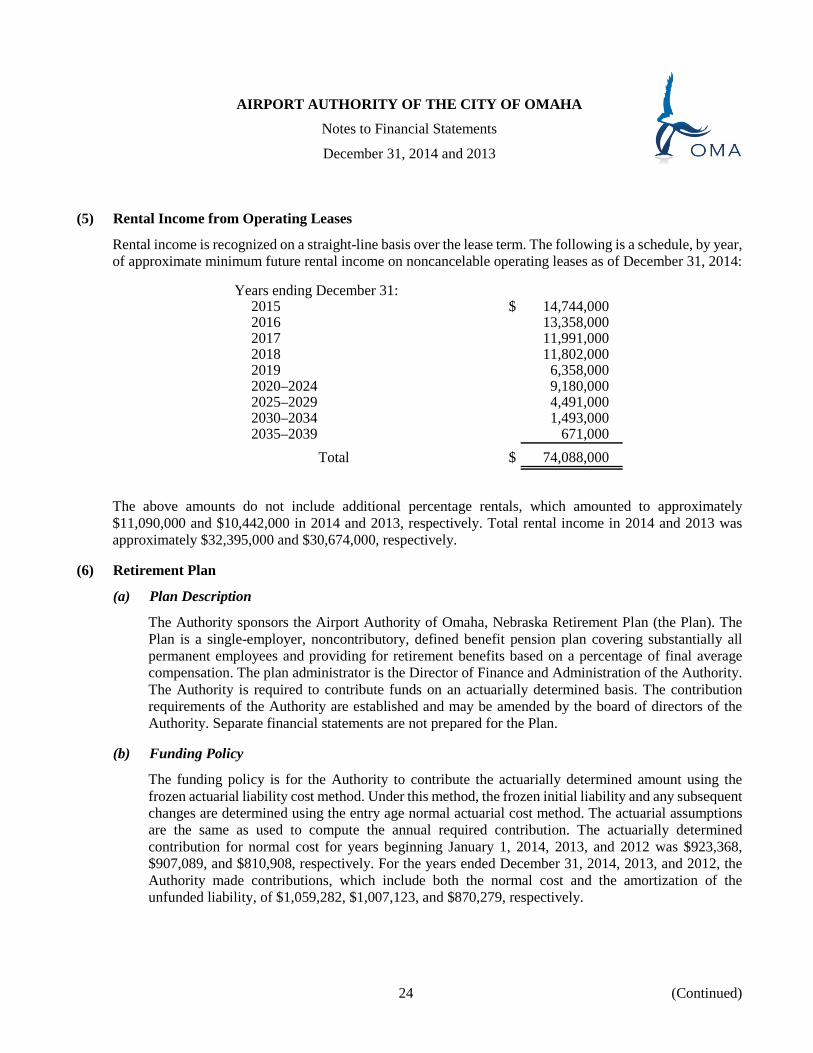
(5) Rental Income from Operating Leases
Rental income is recognized on a straight-line basis over the lease term. The following is a schedule, by year, of approximate minimum future rental income on noncancelable operating leases as of December 31, 2014:
Years ending December 31:2015 $ 14,744,000 2016 13,358,000 2017 11,991,000 2018 11,802,000 2019 6,358,000 2020–2024 9,180,000 2025–2029 4,491,000 2030–2034 1,493,000 2035–2039 671,000
Total $ 74,088,000
The above amounts do not include additional percentage rentals, which amounted to approximately $11,090,000 and $10,442,000 in 2014 and 2013, respectively. Total rental income in 2014 and 2013 was approximately $32,395,000 and $30,674,000, respectively.
(6) Retirement Plan
(a) Plan Description
The Authority sponsors the Airport Authority of Omaha, Nebraska Retirement Plan (the Plan). The Plan is a single-employer, noncontributory, defined benefit pension plan covering substantially all permanent employees and providing for retirement benefits based on a percentage of final average compensation. The plan administrator is the Director of Finance and Administration of the Authority. The Authority is required to contribute funds on an actuarially determined basis. The contribution requirements of the Authority are established and may be amended by the board of directors of the Authority. Separate financial statements are not prepared for the Plan.
(b) Funding Policy
The funding policy is for the Authority to contribute the actuarially determined amount using the frozen actuarial liability cost method. Under this method, the frozen initial liability and any subsequent changes are determined using the entry age normal actuarial cost method. The actuarial assumptions are the same as used to compute the annual required contribution. The actuarially determined contribution for normal cost for years beginning January 1, 2014, 2013, and 2012 was $923,368, $907,089, and $810,908, respectively. For the years ended December 31, 2014, 2013, and 2012, the Authority made contributions, which include both the normal cost and the amortization of the unfunded liability, of $1,059,282, $1,007,123, and $870,279, respectively.
24 (Continued)
AIRPORT AUTHORITY OF THE CITY OF OMAHA
Notes to Financial Statements
December 31, 2014 and 2013
(c) Administrative Expenses
Actuarial, investment management, and bank trustee fees and expenses are charged to the Plan as incurred.
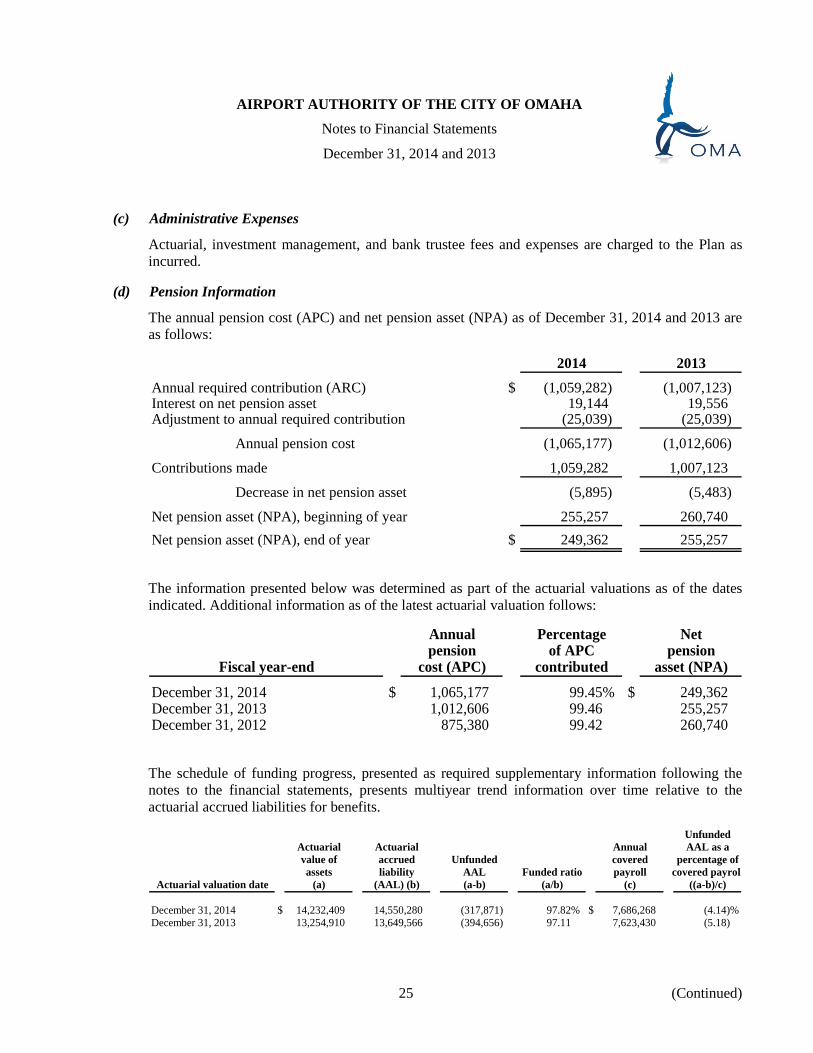
(d) Pension Information
The annual pension cost (APC) and net pension asset (NPA) as of December 31, 2014 and 2013 are as follows:
2014 2013
Annual required contribution (ARC) $ (1,059,282) (1,007,123) Interest on net pension asset 19,144 19,556 Adjustment to annual required contribution (25,039) (25,039)
Annual pension cost (1,065,177) (1,012,606)
Contributions made 1,059,282 1,007,123
Decrease in net pension asset (5,895) (5,483)
Net pension asset (NPA), beginning of year 255,257 260,740 Net pension asset (NPA), end of year $ 249,362 255,257
The information presented below was determined as part of the actuarial valuations as of the dates indicated. Additional information as of the latest actuarial valuation follows:
Annual Percentage Netpension of APC pension
Fiscal year-end cost (APC) contributed asset (NPA)
December 31, 2014 $ 1,065,177 99.45% $ 249,362 December 31, 2013 1,012,606 99.46 255,257 December 31, 2012 875,380 99.42 260,740
The schedule of funding progress, presented as required supplementary information following the notes to the financial statements, presents multiyear trend information over time relative to the actuarial accrued liabilities for benefits.
UnfundedActuarial Actuarial Annual AAL as avalue of accrued Unfunded covered percentage ofassets liability AAL Funded ratio payroll covered payroll
Actuarial valuation date (a) (AAL) (b) (a-b) (a/b) (c) ((a-b)/c)
December 31, 2014 $ 14,232,409 14,550,280 (317,871) 97.82% $ 7,686,268 (4.14)%December 31, 2013 13,254,910 13,649,566 (394,656) 97.11 7,623,430 (5.18)
25 (Continued)
AIRPORT AUTHORITY OF THE CITY OF OMAHA
Notes to Financial Statements
December 31, 2014 and 2013
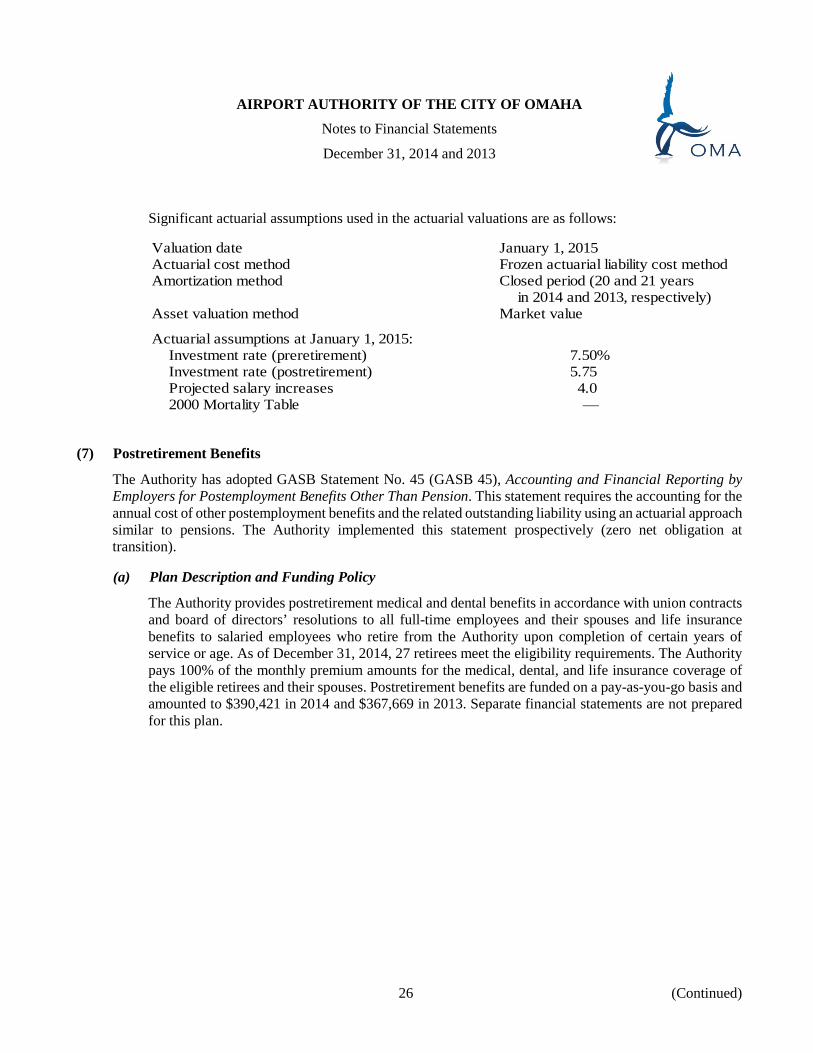
Significant actuarial assumptions used in the actuarial valuations are as follows:
Valuation date January 1, 2015Actuarial cost method Frozen actuarial liability cost methodAmortization method Closed period (20 and 21 years
in 2014 and 2013, respectively)Asset valuation method Market value
Actuarial assumptions at January 1, 2015:Investment rate (preretirement) 7.50%Investment rate (postretirement) 5.75Projected salary increases 4.02000 Mortality Table —
(7) Postretirement Benefits
The Authority has adopted GASB Statement No. 45 (GASB 45), Accounting and Financial Reporting by Employers for Postemployment Benefits Other Than Pension. This statement requires the accounting for the annual cost of other postemployment benefits and the related outstanding liability using an actuarial approach similar to pensions. The Authority implemented this statement prospectively (zero net obligation at transition).
(a) Plan Description and Funding Policy
The Authority provides postretirement medical and dental benefits in accordance with union contracts and board of directors’ resolutions to all full-time employees and their spouses and life insurance benefits to salaried employees who retire from the Authority upon completion of certain years of service or age. As of December 31, 2014, 27 retirees meet the eligibility requirements. The Authority pays 100% of the monthly premium amounts for the medical, dental, and life insurance coverage of the eligible retirees and their spouses. Postretirement benefits are funded on a pay-as-you-go basis and amounted to $390,421 in 2014 and $367,669 in 2013. Separate financial statements are not prepared for this plan.
26 (Continued)
AIRPORT AUTHORITY OF THE CITY OF OMAHA
Notes to Financial Statements
December 31, 2014 and 2013
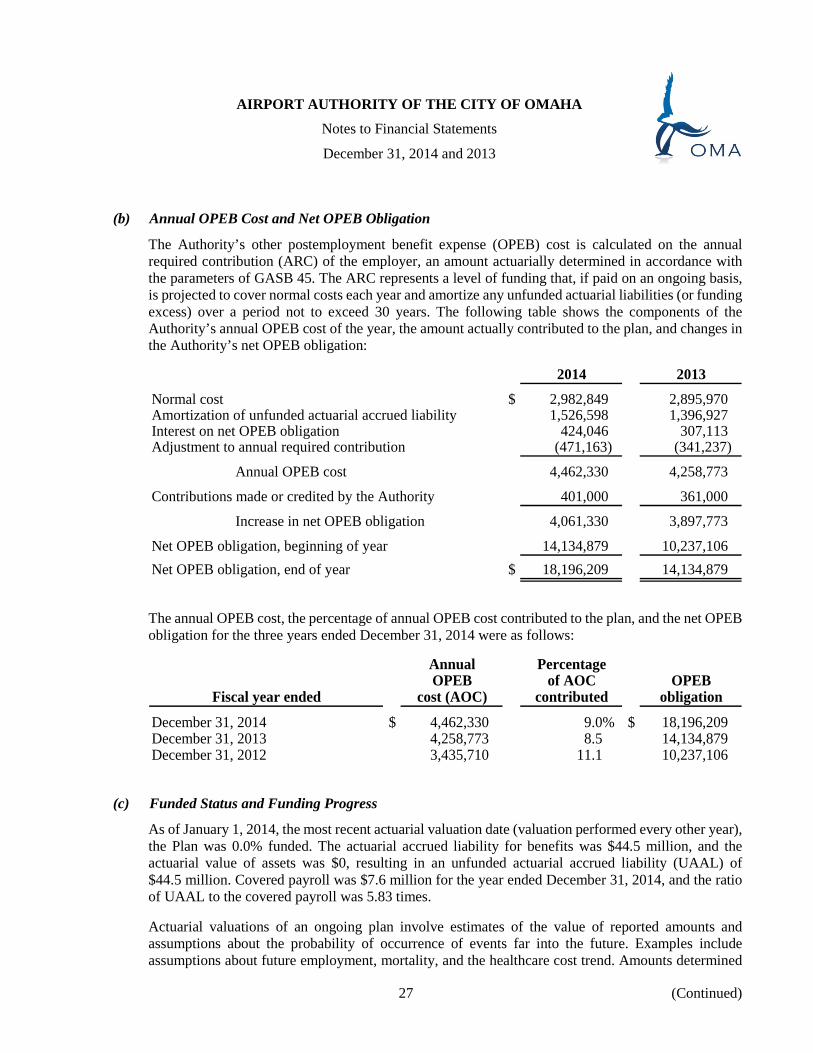
(b) Annual OPEB Cost and Net OPEB Obligation
The Authority’s other postemployment benefit expense (OPEB) cost is calculated on the annual required contribution (ARC) of the employer, an amount actuarially determined in accordance with the parameters of GASB 45. The ARC represents a level of funding that, if paid on an ongoing basis, is projected to cover normal costs each year and amortize any unfunded actuarial liabilities (or funding excess) over a period not to exceed 30 years. The following table shows the components of the Authority’s annual OPEB cost of the year, the amount actually contributed to the plan, and changes in the Authority’s net OPEB obligation:
2014 2013
Normal cost $ 2,982,849 2,895,970 Amortization of unfunded actuarial accrued liability 1,526,598 1,396,927 Interest on net OPEB obligation 424,046 307,113 Adjustment to annual required contribution (471,163) (341,237)
Annual OPEB cost 4,462,330 4,258,773
Contributions made or credited by the Authority 401,000 361,000
Increase in net OPEB obligation 4,061,330 3,897,773
Net OPEB obligation, beginning of year 14,134,879 10,237,106 Net OPEB obligation, end of year $ 18,196,209 14,134,879
The annual OPEB cost, the percentage of annual OPEB cost contributed to the plan, and the net OPEB obligation for the three years ended December 31, 2014 were as follows:
Annual PercentageOPEB of AOC OPEB
Fiscal year ended cost (AOC) contributed obligation
December 31, 2014 $ 4,462,330 9.0% $ 18,196,209 December 31, 2013 4,258,773 8.5 14,134,879 December 31, 2012 3,435,710 11.1 10,237,106
(c) Funded Status and Funding Progress
As of January 1, 2014, the most recent actuarial valuation date (valuation performed every other year), the Plan was 0.0% funded. The actuarial accrued liability for benefits was $44.5 million, and the actuarial value of assets was $0, resulting in an unfunded actuarial accrued liability (UAAL) of $44.5 million. Covered payroll was $7.6 million for the year ended December 31, 2014, and the ratio of UAAL to the covered payroll was 5.83 times.
Actuarial valuations of an ongoing plan involve estimates of the value of reported amounts and assumptions about the probability of occurrence of events far into the future. Examples include assumptions about future employment, mortality, and the healthcare cost trend. Amounts determined
27 (Continued)
AIRPORT AUTHORITY OF THE CITY OF OMAHA
Notes to Financial Statements
December 31, 2014 and 2013
regarding the funded status of the plan and the ARC of the employer are subject to continual revision as actual results are compared with past expectations and new estimates are made about the future. The schedule of funding progress, presented as required supplementary information following the notes to the financial statements, presents multiyear trend information over time relative to the actuarial accrued liabilities for benefits.
(d) Actuarial Methods and Assumptions
Projections of benefits for financial reporting are based on the substantive plan (the plan as understood by the employer and the plan members) and include the types of benefits provided at the time of each valuation and the historical pattern of sharing of benefit costs between the employer and plan members to that point. The actuarial calculation reflects a long-term perspective. The actuarial methods and assumptions used include techniques that are designed to reduce the effects of short-term volatility in actuarial accrued liabilities and the actuarial value of assets, consistent with the long-term perspective of the calculations.
In the January 1, 2014 actuarial valuation, the unit credit cost method was used. The actuarial assumptions included a 3% investment rate of return (net of administrative expenses), which is a blended rate of the expected long-term investment returns on plan assets (of which there are none) and on the employer’s own investments calculated based on the funded level of the plan at the valuation date, and an annual healthcare cost trend rate of 6.9% (post 65) initially, reduced by decrements to an ultimate rate of 4.5%. The assumptions also include a dental trend rate of 5.0% initially, reduced by decrements to an ultimate rate of 4.3%. The UAAL is being amortized as a level percentage of projected payroll on an open basis. The remaining amortization period at January 1, 2014 was 30 years. Payroll growth assumption is 3% per year. Inflation rate assumption is 3.5% per year.
(8) Risk Management
The Authority is subject to various risks of loss related to unemployment compensation, general liability, and property insurance. The Authority has purchased commercially available indemnity insurance to cover these risks. The deductible amounts for this insurance would be immaterial to the Authority. Settled claims have not exceeded coverage in the last three years. The Authority is self-insured for “acts of terrorism.” The Authority’s cost/risk assessment conclusion led to waiving the terrorism coverage (also see notes 10 and 11).
(9) Contingencies and Commitments
The Authority participates in federal grant programs that are subject to review and audit by the grantor agencies. Entitlement to these resources is generally conditional upon compliance with the terms and conditions of grant agreements and applicable federal regulations, including the expenditure of resources for allowable purposes. Any disallowance resulting from a federal audit may become a liability of the Authority.
The Authority is named as a party in legal proceedings that occur in the normal course of operations. It is not possible at the present time to estimate the ultimate outcome or liability. However, it is the Authority’s position that any ultimate liability is not expected to have a material adverse effect on the Authority’s financial position.
28 (Continued)
AIRPORT AUTHORITY OF THE CITY OF OMAHA
Notes to Financial Statements
December 31, 2014 and 2013
(10) 2011 Missouri River Valley Flooding
For approximately a three-month period (June 2011 through August 2011), the U.S. Army Corp of Engineers released record amounts of water through its Missouri River Valley dam system due to significant snow melting and rain upstream. An earthen levee surrounds much of Eppley Airfield and the levee successfully held back the record high river levels to approximately six feet from the top of the levee.
Due to the significant pressure brought on by the high water level, the ground water table on the interior of the levee (airfield) rose to the surface. The Authority formed a flood fighting team comprised of seven primary contractors who successfully accomplished the following tasks: sandbagged all critical Authority buildings and infrastructure, expanded seepage blanket material adjacent to sections of the levee, repaired sink holes, placed weighted filtered blankets over sand boils, pumped surface water away from low lying areas, monitored the levee for any changes to its condition, redirected the Authority’s east pump station water discharge from through the levee to up and over the levee, and, most significantly, placed a perimeter well field of seventy wells, each ninety feet deep, which lowered the ground water elevation significantly to protect the Authority assets and insure continued air operations. The flood fighting effort continued for approximately an additional month as the river water levels receded back to within its banks. Other than some minor storm sewer damage, all Authority assets remained protected and in use throughout the flood fighting, and air operations were unaffected.
As of December 31, 2012, the total of the flood fighting effort has cost approximately $21 million. Another approximately $270,454 of demobilization expenditures occurred in 2013. The Authority had in place, at the time, property insurance including $50 million of flood coverage. The policy included a provision for coverage for “preventative measures,” which were the actions taken by the Authority. The policy included a $1 million flood expenditure deductible. On September 24, 2012, the insurance company had settled with the Authority for $19.8 million (93% recovery). In the meantime, this flooding event was declared a disaster by the Federal Government #4103. The Federal Emergency Management Association (FEMA) representative has worked with the Authority to successfully complete 14 FEMA project worksheets, which have been submitted totaling an estimated $23 million of eligible expenditures. FEMA’s program will reimburse 75% of eligible expenditures to the Authority, net of any insurance proceeds received. In addition, the Nebraska Emergency Management Association (NEMA) is programmed to pay up to 12.5% of eligible expenditures, net of any insurance proceeds received, pending available funds and final reconciliation of all costs, insurance, and project worksheets anticipated to occur in 2015. The Authority believes that with the insurance and FEMA/NEMA programs in place, the Authority has not suffered any material adverse financial effects from the 2011 flood.
29 (Continued)
AIRPORT AUTHORITY OF THE CITY OF OMAHA
Notes to Financial Statements
December 31, 2014 and 2013
(11) 2011 Hail/Wind Storm
On August 18, 2011, the Airport was hit with two rounds of very large hail, rain, and strong wind storms. All building roofs on the Airport suffered minor to significant damage. In addition, a moderate amount of glass breakage occurred and other roof metal and exposed mechanical equipment was damaged. In totality, the Airport sustained building impairments of $3,375,179 estimated at that time. Certain emergency repairs were made immediately. As of December 31, 2014, all of the damaged roofs’ glass breakage and equipment damage has been repaired or replaced, with the exception of one general aviation area building roof, which will be completed in the spring of 2015. This hail/wind storm damage is covered by the Authority’s property insurance policy. On January 4, 2012, the insurance company advanced $3,275,179 (impairment less $100,000 policy deductible) to the Authority for “undisputed actual cost value loss.” This amount was reflected as other receivables – insurance proceeds on the statement of net position as of December 31, 2011 as the amount was determinable and realizable via a written commitment by the insurance company prior to December 31, 2011. In 2012, another insurance advance of $171,671 was received and an additional $249,984 of insurance proceeds were accrued as a receivable at December 31, 2012, which was received in February 2013. In 2013, another insurance advance of $183,000 was received. The buildings’ value was further impaired. Finally, in 2014, a $221,369 impairment was recorded due to another insurance company commitment of insurance proceeds. The other receivable recorded at year-end was received in March 2015. As the final repair/replacement work is completed in 2015, the Authority will continue to work with the insurance company until an ultimate settlement is concluded for all claims. The Authority believes that with the insurance in place, the Authority has not suffered any material adverse financial effects from the August 18, 2011 hail/wind storm.
(12) GASB Statements Implementation
The Authority implemented GASB Statement No. 65, Items Previously Reported as Assets and Liabilities, in 2013 and accordingly restated all presented financial statements to reflect the elimination of unamortized bond issue costs. As a result, opening net position as of January 1, 2012 was decreased by $153,472.
The GASB issued Statement No. 68, Accounting and Financial Reporting for Pensions, requiring various footnote disclosures and accruals. The statement is effective for the Authority’s 2015 calendar year. The Authority has not adopted this statement early.
(13) Subsequent Event
On January 19, 2015, the Authority committed to the design work for another six-story public parking garage/car rental ready/return area with up to approximately 3,000 spaces to replace a current smaller facility of approximately 1,000 spaces. The design and construction administration costs are estimated to be $6 million. It is further anticipated that by January 1, 2016, the design work will be completed and the project will be competitively bid. If a decision is made to move forward with the construction of the project at that time, financing will likely come from three sources: a Customer Facility Charge (CFC) for the car rental portion of the facilities, Authority cash investment, and airport revenue bonds. The earliest this project would be ready for occupancy would be in the fall of 2017.
30
31
AIRPORT AUTHORITY OF THE CITY OF OMAHA
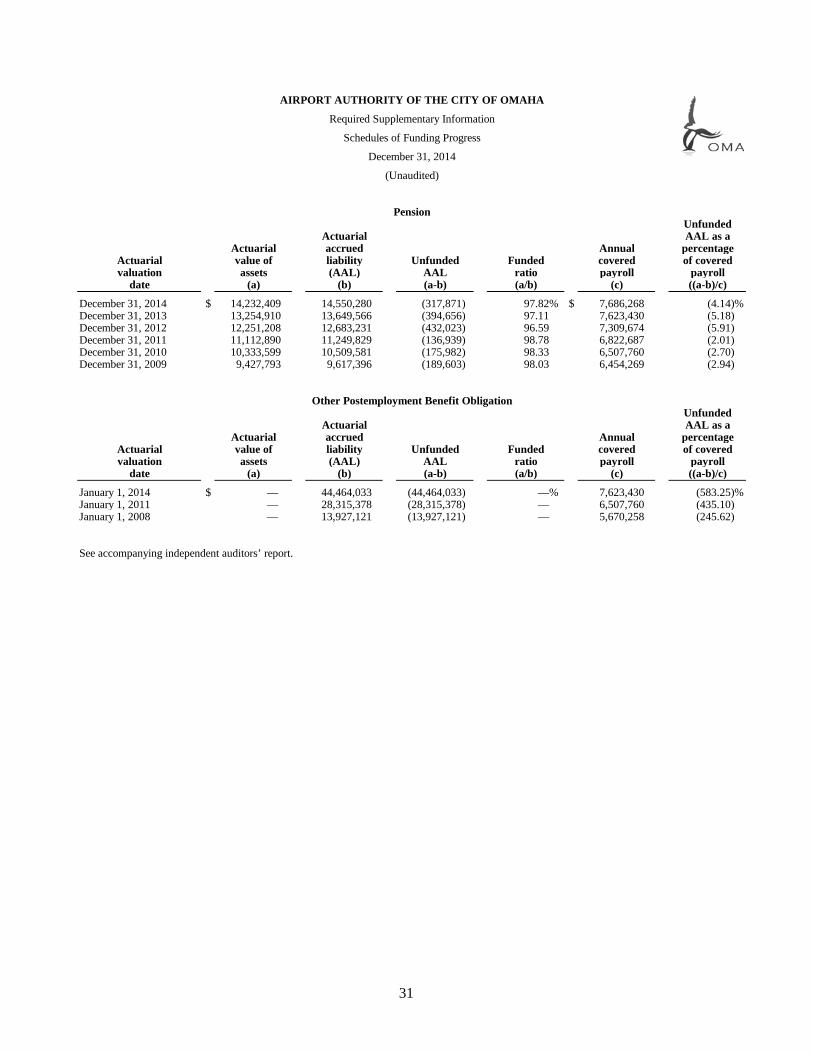
Required Supplementary Information
Schedules of Funding Progress
December 31, 2014
(Unaudited)
PensionUnfunded
Actuarial AAL as aActuarial accrued Annual percentage
Actuarial value of liability Unfunded Funded covered of coveredvaluation assets (AAL) AAL ratio payroll payroll
date (a) (b) (a-b) (a/b) (c) ((a-b)/c)
December 31, 2014 $ 14,232,409 14,550,280 (317,871) 97.82% $ 7,686,268 (4.14)%December 31, 2013 13,254,910 13,649,566 (394,656) 97.11 7,623,430 (5.18)December 31, 2012 12,251,208 12,683,231 (432,023) 96.59 7,309,674 (5.91)December 31, 2011 11,112,890 11,249,829 (136,939) 98.78 6,822,687 (2.01)December 31, 2010 10,333,599 10,509,581 (175,982) 98.33 6,507,760 (2.70)December 31, 2009 9,427,793 9,617,396 (189,603) 98.03 6,454,269 (2.94)
Other Postemployment Benefit ObligationUnfunded
Actuarial AAL as aActuarial accrued Annual percentage
Actuarial value of liability Unfunded Funded covered of coveredvaluation assets (AAL) AAL ratio payroll payroll
date (a) (b) (a-b) (a/b) (c) ((a-b)/c)
January 1, 2014 $ — 44,464,033 (44,464,033) —% 7,623,430 (583.25)%January 1, 2011 — 28,315,378 (28,315,378) — 6,507,760 (435.10)January 1, 2008 — 13,927,121 (13,927,121) — 5,670,258 (245.62)
See accompanying independent auditors’ report.
(Continued)32
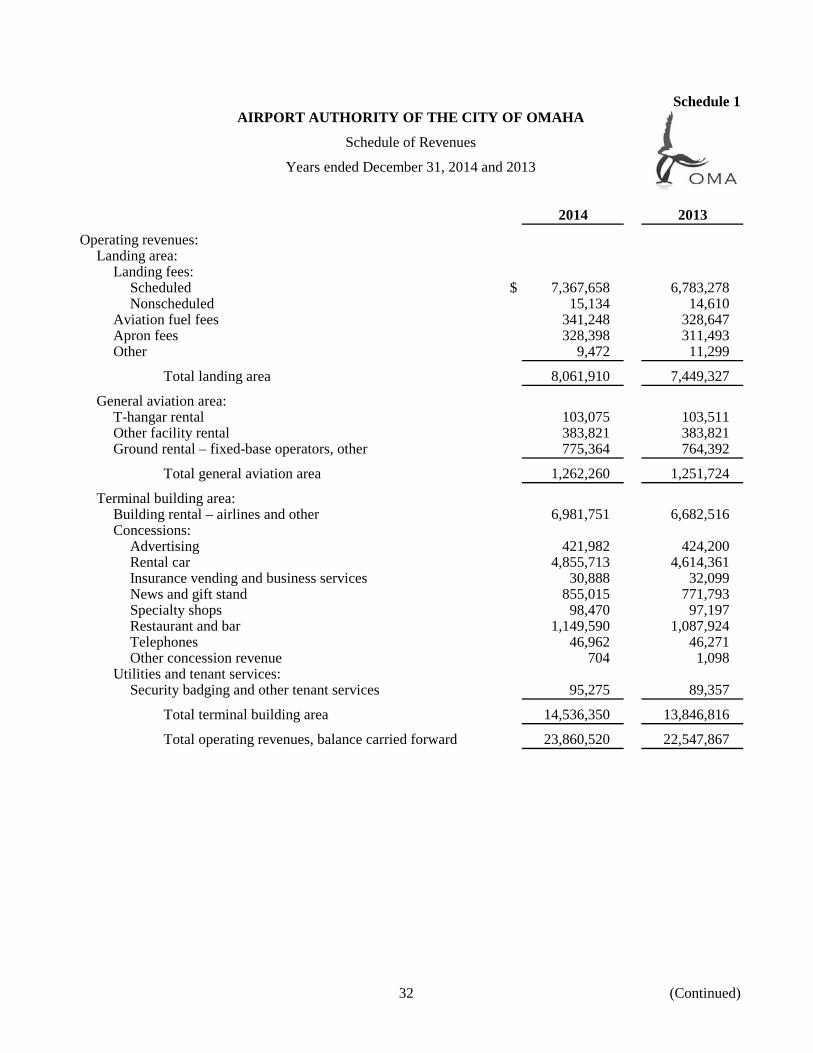
Schedule 1AIRPORT AUTHORITY OF THE CITY OF OMAHA
Schedule of Revenues
Years ended December 31, 2014 and 2013
2014 2013
Operating revenues:Landing area:
Landing fees:Scheduled $ 7,367,658 6,783,278 Nonscheduled 15,134 14,610
Aviation fuel fees 341,248 328,647 Apron fees 328,398 311,493 Other 9,472 11,299
Total landing area 8,061,910 7,449,327
General aviation area:T-hangar rental 103,075 103,511 Other facility rental 383,821 383,821 Ground rental – fixed-base operators, other 775,364 764,392
Total general aviation area 1,262,260 1,251,724
Terminal building area:Building rental – airlines and other 6,981,751 6,682,516 Concessions:
Advertising 421,982 424,200 Rental car 4,855,713 4,614,361 Insurance vending and business services 30,888 32,099 News and gift stand 855,015 771,793 Specialty shops 98,470 97,197 Restaurant and bar 1,149,590 1,087,924 Telephones 46,962 46,271 Other concession revenue 704 1,098
Utilities and tenant services:Security badging and other tenant services 95,275 89,357
Total terminal building area 14,536,350 13,846,816
Total operating revenues, balance carried forward 23,860,520 22,547,867
33
Schedule 1AIRPORT AUTHORITY OF THE CITY OF OMAHA
Schedule of Revenues
Years ended December 31, 2014 and 2013
2014 2013
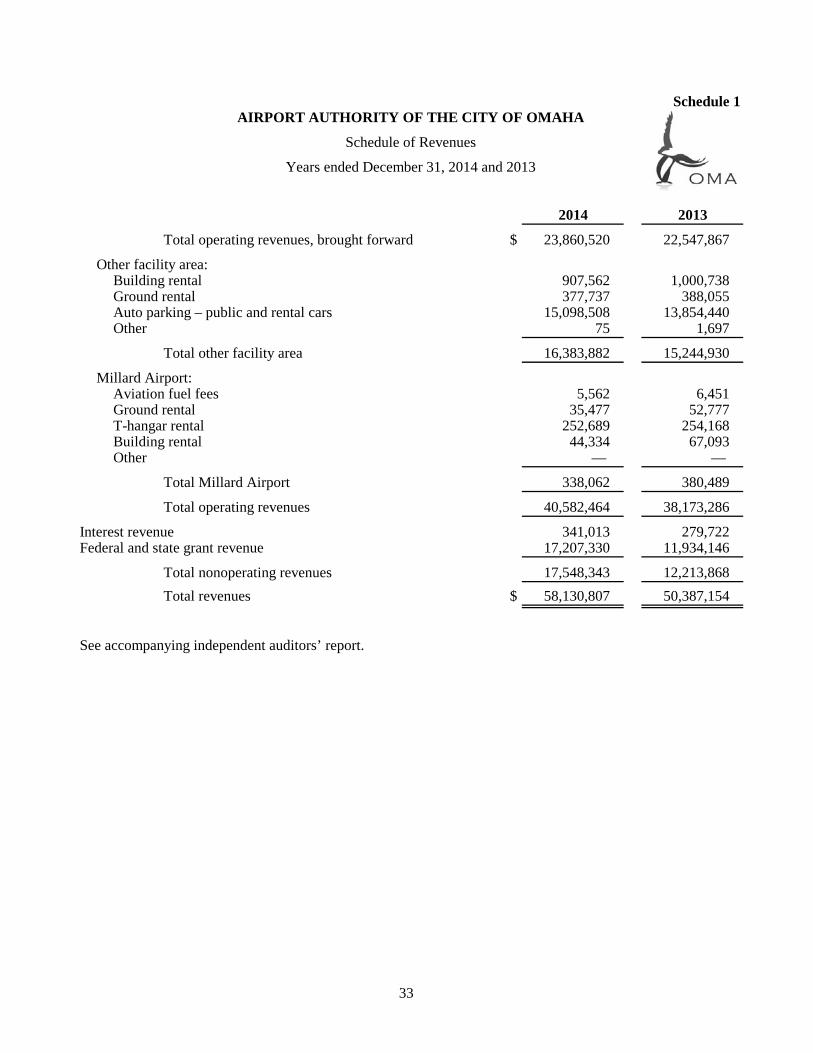
Total operating revenues, brought forward $ 23,860,520 22,547,867
Other facility area:Building rental 907,562 1,000,738 Ground rental 377,737 388,055 Auto parking – public and rental cars 15,098,508 13,854,440 Other 75 1,697
Total other facility area 16,383,882 15,244,930
Millard Airport:Aviation fuel fees 5,562 6,451 Ground rental 35,477 52,777 T-hangar rental 252,689 254,168 Building rental 44,334 67,093 Other — —
Total Millard Airport 338,062 380,489
Total operating revenues 40,582,464 38,173,286
Interest revenue 341,013 279,722 Federal and state grant revenue 17,207,330 11,934,146
Total nonoperating revenues 17,548,343 12,213,868 Total revenues $ 58,130,807 50,387,154
See accompanying independent auditors’ report.
(Continued)34
Schedule 2AIRPORT AUTHORITY OF THE CITY OF OMAHA
Schedule of Expenses
Years ended December 31, 2014 and 2013
2014 2013
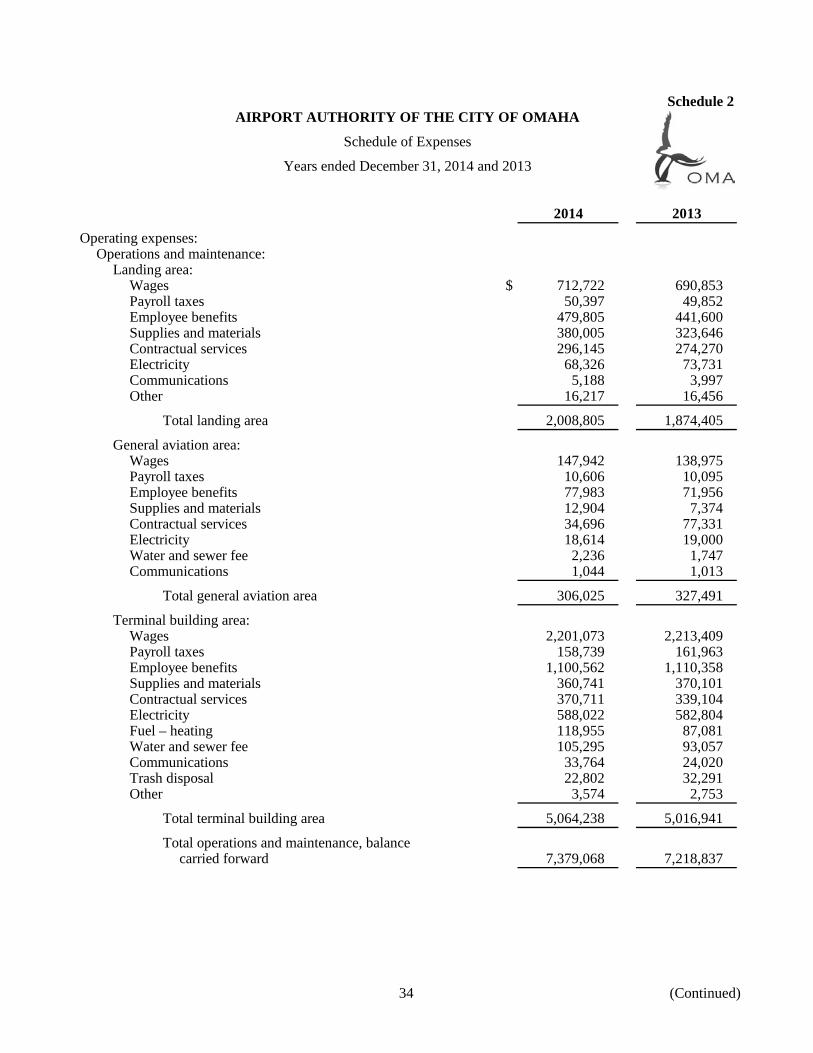
Operating expenses:Operations and maintenance:
Landing area:Wages $ 712,722 690,853 Payroll taxes 50,397 49,852 Employee benefits 479,805 441,600 Supplies and materials 380,005 323,646 Contractual services 296,145 274,270 Electricity 68,326 73,731 Communications 5,188 3,997 Other 16,217 16,456
Total landing area 2,008,805 1,874,405
General aviation area:Wages 147,942 138,975 Payroll taxes 10,606 10,095 Employee benefits 77,983 71,956 Supplies and materials 12,904 7,374 Contractual services 34,696 77,331 Electricity 18,614 19,000 Water and sewer fee 2,236 1,747 Communications 1,044 1,013
Total general aviation area 306,025 327,491
Terminal building area:Wages 2,201,073 2,213,409 Payroll taxes 158,739 161,963 Employee benefits 1,100,562 1,110,358 Supplies and materials 360,741 370,101 Contractual services 370,711 339,104 Electricity 588,022 582,804 Fuel – heating 118,955 87,081 Water and sewer fee 105,295 93,057 Communications 33,764 24,020 Trash disposal 22,802 32,291 Other 3,574 2,753
Total terminal building area 5,064,238 5,016,941
Total operations and maintenance, balancecarried forward 7,379,068 7,218,837
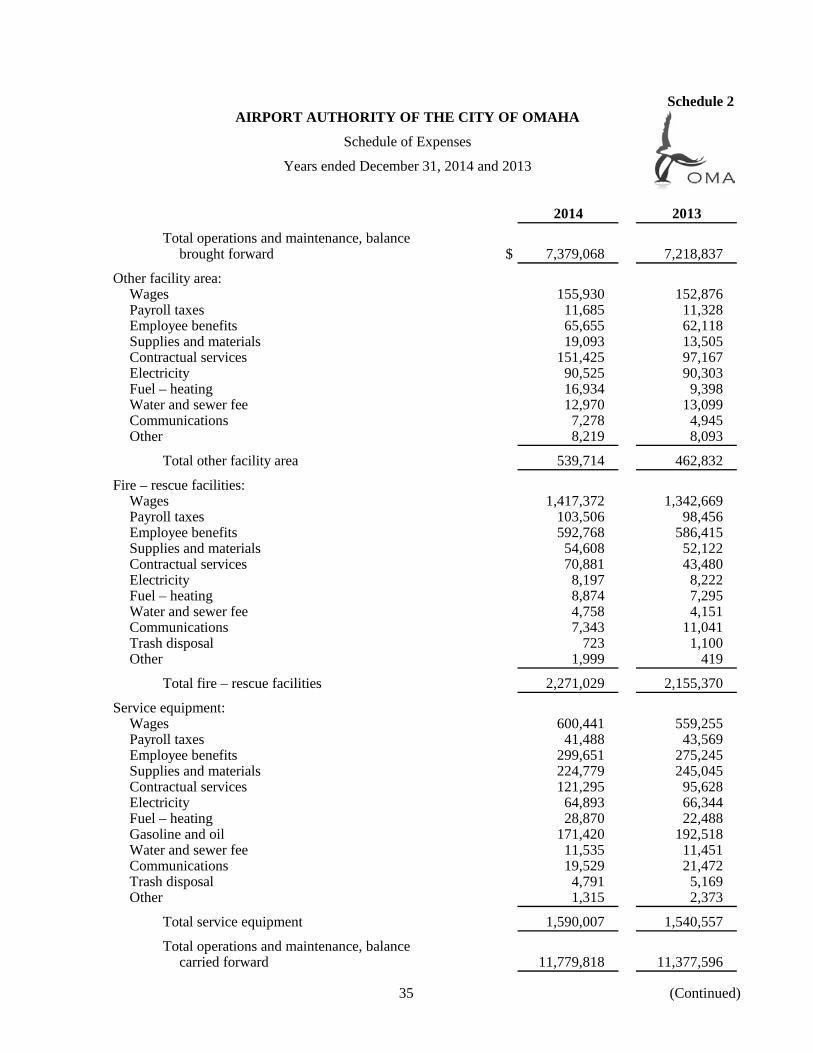
(Continued)35
Schedule 2AIRPORT AUTHORITY OF THE CITY OF OMAHA
Schedule of Expenses
Years ended December 31, 2014 and 2013
2014 2013
Total operations and maintenance, balancebrought forward $ 7,379,068 7,218,837
Other facility area:Wages 155,930 152,876 Payroll taxes 11,685 11,328 Employee benefits 65,655 62,118 Supplies and materials 19,093 13,505 Contractual services 151,425 97,167 Electricity 90,525 90,303 Fuel – heating 16,934 9,398 Water and sewer fee 12,970 13,099 Communications 7,278 4,945 Other 8,219 8,093
Total other facility area 539,714 462,832
Fire – rescue facilities:Wages 1,417,372 1,342,669 Payroll taxes 103,506 98,456 Employee benefits 592,768 586,415 Supplies and materials 54,608 52,122 Contractual services 70,881 43,480 Electricity 8,197 8,222 Fuel – heating 8,874 7,295 Water and sewer fee 4,758 4,151 Communications 7,343 11,041 Trash disposal 723 1,100 Other 1,999 419
Total fire – rescue facilities 2,271,029 2,155,370
Service equipment:Wages 600,441 559,255 Payroll taxes 41,488 43,569 Employee benefits 299,651 275,245 Supplies and materials 224,779 245,045 Contractual services 121,295 95,628 Electricity 64,893 66,344 Fuel – heating 28,870 22,488 Gasoline and oil 171,420 192,518 Water and sewer fee 11,535 11,451 Communications 19,529 21,472 Trash disposal 4,791 5,169 Other 1,315 2,373
Total service equipment 1,590,007 1,540,557
Total operations and maintenance, balancecarried forward 11,779,818 11,377,596
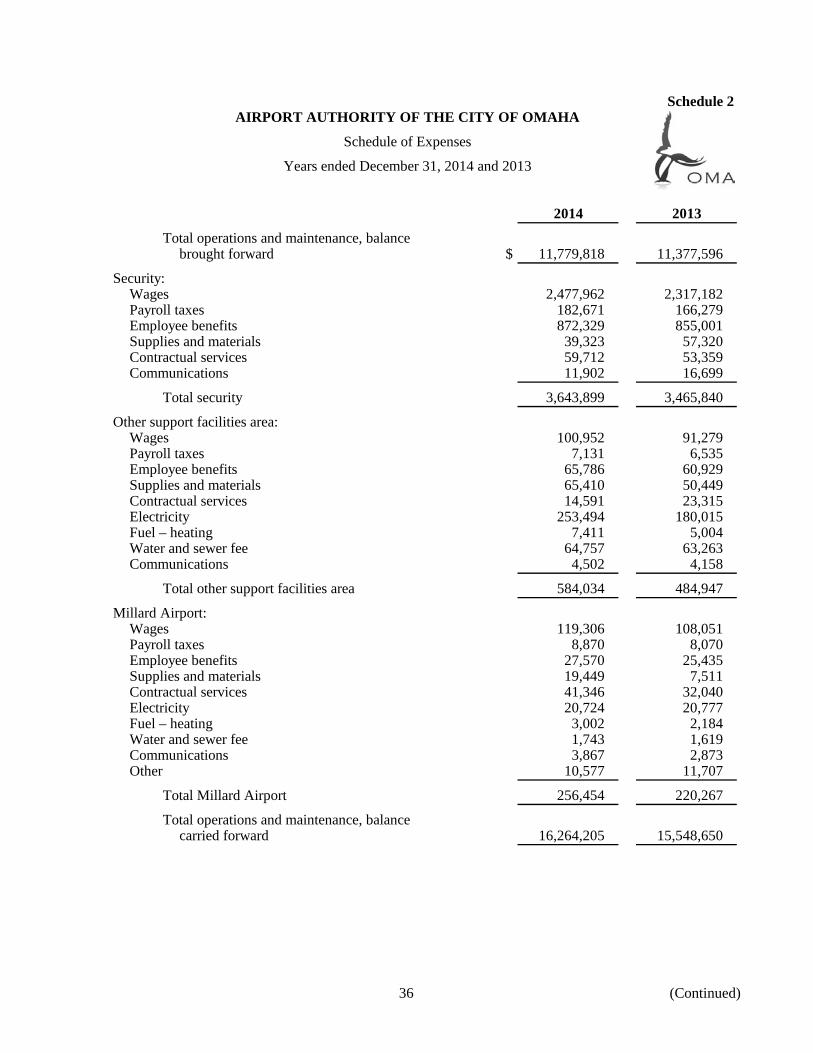
(Continued)36
Schedule 2AIRPORT AUTHORITY OF THE CITY OF OMAHA
Schedule of Expenses
Years ended December 31, 2014 and 2013
2014 2013
Total operations and maintenance, balancebrought forward $ 11,779,818 11,377,596
Security:Wages 2,477,962 2,317,182 Payroll taxes 182,671 166,279 Employee benefits 872,329 855,001 Supplies and materials 39,323 57,320 Contractual services 59,712 53,359 Communications 11,902 16,699
Total security 3,643,899 3,465,840
Other support facilities area:Wages 100,952 91,279 Payroll taxes 7,131 6,535 Employee benefits 65,786 60,929 Supplies and materials 65,410 50,449 Contractual services 14,591 23,315 Electricity 253,494 180,015 Fuel – heating 7,411 5,004 Water and sewer fee 64,757 63,263 Communications 4,502 4,158
Total other support facilities area 584,034 484,947
Millard Airport:Wages 119,306 108,051 Payroll taxes 8,870 8,070 Employee benefits 27,570 25,435 Supplies and materials 19,449 7,511 Contractual services 41,346 32,040 Electricity 20,724 20,777 Fuel – heating 3,002 2,184 Water and sewer fee 1,743 1,619 Communications 3,867 2,873 Other 10,577 11,707
Total Millard Airport 256,454 220,267
Total operations and maintenance, balancecarried forward 16,264,205 15,548,650
37
Schedule 2AIRPORT AUTHORITY OF THE CITY OF OMAHA
Schedule of Expenses
Years ended December 31, 2014 and 2013
2014 2013
Total operations and maintenance, balancebrought forward $ 16,264,205 15,548,650
General and administrative:Salaries 1,722,072 1,559,662 Payroll taxes 97,778 85,921 Employee benefits 653,151 584,995 Supplies, materials, and postage 86,453 96,377 Professional services 878,499 947,876 Promotion and public relations 35,912 20,953 Travel and transportation 23,290 20,684 Communications 17,901 14,627 Dues and subscriptions 53,174 56,387 Insurance 666,683 678,386 Other, including write-offs 15,903 452,068
Total general and administrative 4,250,816 4,517,936
Other postemployment benefit expense 4,061,330 3,897,773 Depreciation expense 15,866,510 15,681,905
Total operating expenses before net flood expenses 40,442,861 39,646,264
Flood expenses, (net of insurance proceeds) — 270,454
Total operating expenses 40,442,861 39,916,718
Interest expense 355,092 415,190 Total expenses $ 40,797,953 40,331,908
See accompanying independent auditors’ report.
Independent Auditors’ Report on Supplementary Schedule of Expenditures of Federal Awards Required by OMB Circular A-133
The Board of Directors Airport Authority of the City of Omaha:
We have audited the basic financial statements of the Airport Authority of the City of Omaha (the Authority) as of and for the year ended December 31, 2014, and have issued our report thereon dated April 3, 2015, which contained an unmodified opinion on those financial statements. Our audit was conducted for the purpose of forming an opinion on the basic financial statements as a whole. The accompanying supplementary schedule of expenditures of federal awards is presented for purposes of additional analysis as required by OMB Circular A-133 and is not a required part of the basic financial statements. Such information is the responsibility of management and was derived from and relates directly to the underlying accounting and other records used to prepare the basic financial statements. The information has been subjected to the auditing procedures applied in the audit of the basic financial statements and certain additional procedures, including comparing and reconciling such information directly to the underlying accounting and other records used to prepare the basic financial statements or to the basic financial statements themselves, and other additional procedures in accordance with auditing standards generally accepted in the United States of America. In our opinion, the supplementary schedule of expenditure of federal awards is fairly stated in all material respects in relation to the basic financial statements as a whole.
/s/KPMG LLP
Omaha, Nebraska April 3, 2015
KPMG LLP Suite 300 1212 N. 96th Street Omaha, NE 68114-2274 Suite 1600 233 South 13th Street Lincoln, NE 68508-2041
KPMG LLP is a Delaware limited liability partnership, the U.S. member firm of KPMG International Cooperative (“KPMG International”), a Swiss entity.
39
AIRPORT AUTHORITY OF THE CITY OF OMAHA
Supplementary Schedule of Expenditures of Federal Awards
Year ended December 31, 2014
CFDAGrant Program Number number Expenditures
U.S. Department of Transportation, Federal Aviation Administration,Airport Improvement Program:
Direct Programs:AIP-3-31-0053-008 20.106 $ 74,984 AIP-3-31-0053-009 20.106 1,266,515 AIP-3-31-0062-58 20.106 388,402 AIP-3-31-0062-59 20.106 425 AIP-3-31-0062-62 20.106 623,374 AIP-3-31-0062-63 20.106 98,587 AIP-3-31-0062-64 20.106 9,772,132 AIP-3-31-0062-65 20.106 1,515,068 AIP-3-31-0062-66 20.106 3,572,395
Total CFDA 20.106 17,311,882 Total federal expenditures $ 17,311,882
See accompanying independent auditors’ report and notes to supplementary schedule of expenditures of federal awards.
AIRPORT AUTHORITY OF THE CITY OF OMAHA
Notes to Supplementary Schedule of Expenditures of Federal Awards
December 31, 2014
(1) General
The reporting entity for the supplementary schedule of expenditures of federal awards (the Schedule) is the same as that disclosed in note 1 to the basic financial statements. The Schedule presents the activity of all federal awards programs of the Airport Authority of the City of Omaha (the Authority) for the year ended December 31, 2014. The Federal Aviation Administration Improvement Program is considered to be a major program.
(2) Basis of Accounting
The Schedule is prepared on the same basis of accounting as the financial statements.
The Authority has entered into grant agreements with government agencies on certain construction projects. The Authority recognizes grant revenue as construction progresses on each project and when eligibility requirements are met. The Authority has in process various grants from the U.S. Department of Transportation/Federal Aviation Administration for the funding of Airport Improvement Program.
(3) Relationship to Federal Financial Reports
The amounts reported in the Schedule are the same as amounts used for federal financial reporting.
40
Independent Auditors’ Report on Internal Control over Financial Reporting and on Compliance and Other Matters Based on an Audit of Financial Statements Performed in Accordance with
Government Auditing Standards
The Board of Directors Airport Authority of the City of Omaha:
We have audited, in accordance with the auditing standards generally accepted in the United States of America and the standards applicable to financial audits contained in Government Auditing Standards, issued by the Comptroller General of the United States, the basic financial statements of the Airport Authority of the City of Omaha (the Authority), which comprise the statement of net position as of December 31, 2014, and the related statements of revenues, expenses, and changes in net position and cash flows for the year then ended, and the related notes to the basic financial statements, and have issued our report thereon dated April 3, 2015.
Internal Control over Financial Reporting
In planning and performing our audit of the basic financial statements, we considered the Authority’s internal control over financial reporting (internal control) to determine the audit procedures that are appropriate in the circumstances for the purpose of expressing our opinion on the basic financial statements, but not for the purpose of expressing an opinion on the effectiveness of the Authority’s internal control. Accordingly, we do not express an opinion on the effectiveness of the Authority’s internal control.
A deficiency in internal control exists when the design or operation of a control does not allow management or employees, in the normal course of performing their assigned functions, to prevent, or detect and correct, misstatements on a timely basis. A material weakness is a deficiency, or combination of deficiencies, in internal control, such that there is a reasonable possibility that a material misstatement of the entity’s financial statements will not be prevented, or detected and corrected, on a timely basis. A significant deficiency is a deficiency, or a combination of deficiencies, in internal control that is less severe than a material weakness, yet important enough to merit attention by those charged with governance.
Our consideration of internal control was for the limited purpose described in the first paragraph of this section and was not designed to identify all deficiencies in internal control that might be material weaknesses or significant deficiencies. Given these limitations, during our audit, we did not identify any deficiencies in internal control that we consider to be material weaknesses. However, material weaknesses may exist that have not been identified.
Compliance and Other Matters
As part of obtaining reasonable assurance about whether the Authority’s basic financial statements are free from material misstatement, we performed tests of its compliance with certain provisions of laws, regulations, contracts, and grant agreements, noncompliance with which could have a direct and material
KPMG LLP Suite 300 1212 N. 96th Street Omaha, NE 68114-2274 Suite 1600 233 South 13th Street Lincoln, NE 68508-2041
KPMG LLP is a Delaware limited liability partnership, the U.S. member firm of KPMG International Cooperative (“KPMG International”), a Swiss entity.
effect on the determination of financial statement amounts. However, providing an opinion on compliance with those provisions was not an objective of our audit, and accordingly, we do not express such an opinion. The results of our tests disclosed no instances of noncompliance or other matters that are required to be reported under Government Auditing Standards.
Purpose of This Report
The purpose of this report is solely to describe the scope of our testing of internal control and compliance and the results of that testing, and not to provide an opinion on the effectiveness of the Authority’s internal control or on compliance. This report is an integral part of an audit performed in accordance with Government Auditing Standards in considering the Authority’s internal control and compliance. Accordingly, this communication is not suitable for any other purpose.
/s/KPMG LLP
Omaha, Nebraska April 3, 2015
42
Independent Auditors’ Report on Compliance for Each Major Program and Report on Internal Control over Compliance Required by OMB
Circular A-133, Audits of States, Local Governments, and Non-Profit Organizations
The Board of Directors Airport Authority of the City of Omaha:
Report on Compliance for Major Federal Program
We have audited the Airport Authority of the City of Omaha’s (the Authority) compliance with the types of compliance requirements described in the OMB Circular A-133 Compliance Supplement that could have a direct and material effect on the Authority’s major federal program for the year ended December 31, 2014. The Authority’s major federal program is identified in the summary of auditors’ results section of the accompanying schedule of findings and questioned costs.
Management’s Responsibility
Management is responsible for compliance with the requirements of laws, regulations, contracts, and grants applicable to its federal program.
Auditors’ Responsibility
Our responsibility is to express an opinion on compliance for the Authority’s major federal program based on our audit of the types of compliance requirements referred to above. We conducted our audit of compliance in accordance with auditing standards generally accepted in the United States of America; the standards applicable to financial audits contained in Government Auditing Standards, issued by the Comptroller General of the United States; and OMB Circular A-133, Audits of States, Local Governments, and Non-Profit Organizations. Those standards and OMB Circular A-133 require that we plan and perform the audit to obtain reasonable assurance about whether noncompliance with the types of compliance requirements referred to above that could have a direct and material effect on a major federal program occurred. An audit includes examining, on a test basis, evidence about the Authority’s compliance with those requirements and performing such other procedures as we considered necessary in the circumstances.
We believe that our audit provides a reasonable basis for our opinion on compliance for the major federal program. However, our audit does not provide a legal determination of the Authority’s compliance.
Opinion on Each Major Federal Program
In our opinion, the Authority complied, in all material respects, with the types of compliance requirements referred to above that could have a direct and material effect on its major federal program for the year ended December 31, 2014.
KPMG LLP Suite 300 1212 N. 96th Street Omaha, NE 68114-2274 Suite 1600 233 South 13th Street Lincoln, NE 68508-2041
KPMG LLP is a Delaware limited liability partnership, the U.S. member firm of KPMG International Cooperative (“KPMG International”), a Swiss entity.
Report on Internal Control over Compliance
Management of the Authority is responsible for establishing and maintaining effective internal control over compliance with the types of compliance requirements referred to above. In planning and performing our audit of compliance, we considered the Authority’s internal control over compliance with the types of requirements that could have a direct and material effect on the major federal program to determine the auditing procedures that are appropriate in the circumstances for the purpose of expressing an opinion on compliance for the major federal program and to test and report on internal control over compliance in accordance with OMB Circular A-133, but not for the purpose of expressing an opinion on the effectiveness of internal control over compliance. Accordingly, we do not express an opinion on the effectiveness of the Authority’s internal control over compliance.
A deficiency in internal control over compliance exists when the design or operation of a control over compliance does not allow management or employees, in the normal course of performing their assigned functions, to prevent, or detect and correct, noncompliance with a type of compliance requirement of a federal program on a timely basis. A material weakness in internal control over compliance is a deficiency, or combination of deficiencies, in internal control over compliance, such that there is a reasonable possibility that material noncompliance with a type of compliance requirement of a federal program will not be prevented, or detected and corrected, on a timely basis. A significant deficiency in internal control over compliance is a deficiency, or a combination of deficiencies, in internal control over compliance with a type of compliance requirement of a federal program that is less severe than a material weakness in internal control over compliance, yet important enough to merit attention by those charged with governance.
Our consideration of internal control over compliance was for the limited purpose described in the first paragraph of this section and was not designed to identify all deficiencies in internal control over compliance that might be material weaknesses or significant deficiencies. We did not identify any deficiencies in internal control over compliance that we consider to be material weaknesses. However, material weaknesses may exist that have not been identified.
The purpose of this report on internal control over compliance is solely to describe the scope of our testing of internal control over compliance and the results of that testing based on the requirements of OMB Circular A-133. Accordingly, this report is not suitable for any other purpose.
/s/KPMG LLP
Omaha, Nebraska April 3, 2015
44
AIRPORT AUTHORITY OF THE CITY OF OMAHA
Schedule of Findings and Questioned Costs
Year ended December 31, 2014
I Summary of Auditors’ Results
Financial Statements
Type of auditors’ report issued: Unmodified opinion
Internal control over financial reporting:
• Material weaknesses identified: No
• Significant deficiencies identified that are not considered to be material weaknesses: None reported
Noncompliance material to financial statements noted: No
Federal Awards
Internal control over major programs:
• Material weaknesses identified: No
• Significant deficiencies identified that are not considered to be material weaknesses: None reported
Type of auditors’ report issued on compliance for major programs: Unmodified opinion
Any audit findings disclosed that are required to be reported in accordance with Section 510(a) of OMB Circular A-133: No
Identification of major programs: CFDA #20.106, Airport Improvement Program
Dollar threshold used to distinguish between Type A and Type B programs: $519,996
Auditee qualified as low-risk auditee: Yes
II Findings Related to the Financial Statements That Are Required to Be Reported in Accordance with Government Auditing Standards
None
III Findings and Questioned Costs Related to Federal Awards
None
45