Embed Size (px)
Citation preview
DOT/FAA/AM-95/27
Office of Aviation Medicine Washington, D.C. 20591
Airman Research Questionnaire: Methodology and Overall Results
David R. Hunter
Office of Aviation Medicine
Federal Aviation Administration
Washington, DC 20591
October 1995
Final Report
This document is available to the public
through the National Technical Information
Service, Springfield, Virginia 22161.
U.S. Department of Transportation
Federal Aviation Administration
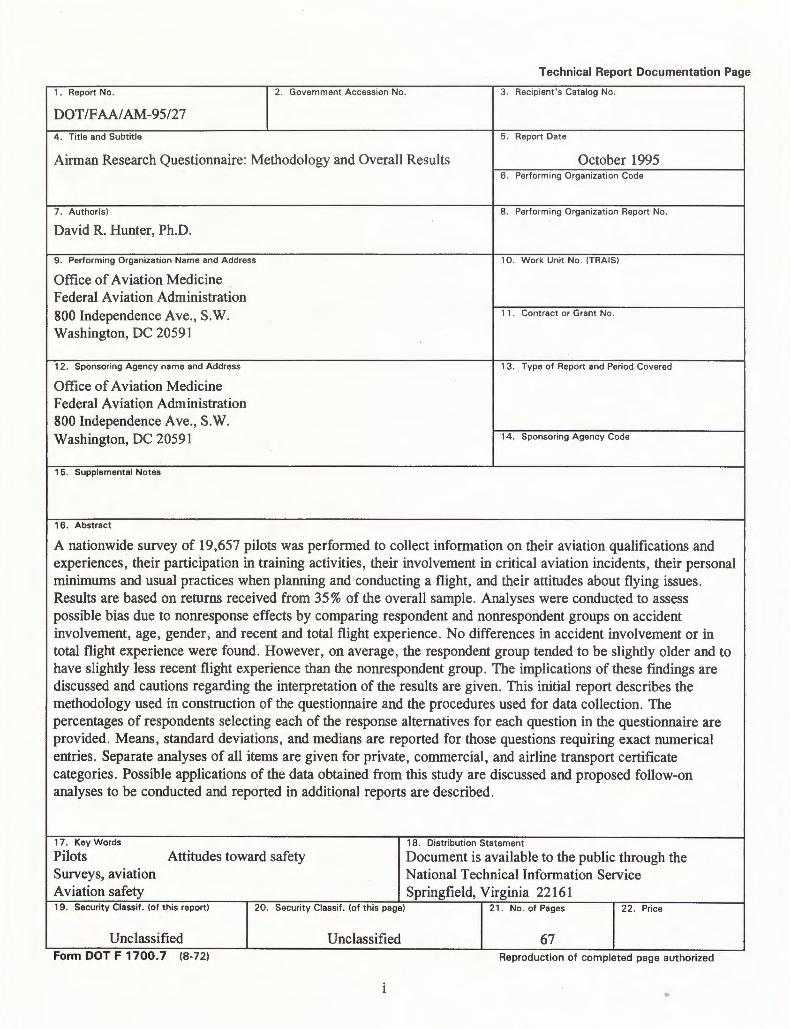
Technical Report Documentation Page
1 . Report No. 2 . Government Accession No. 3 . Recipient 's Catalog No .
DOT/FAA/AM-95/27
4 . Title and Subtitle 5 . Report Date
Airman Research Questionnaire: Methodology and Overall Results October 1995 6. Performing Organization Code
7. Author(s) 8. Performing Organization Report No .
David R. Hunter, Ph.D.
9. Performing Organization Name and Address 10. Work Unit No. (TRAIS)
Office of Aviation Medicine Federal Aviation Administration 800 Independence Ave., S.W. 11. Contract or Grant No .
Washington, DC 20591
12. Sponsoring Agency name and Address 13. Type of Report and Period Covered
Office of Aviation Medicine Federal Aviation Administration 800 Independence Ave., S.W. Washington, DC 20591 14. Sponsoring Agency Code
1 5. Supplemental Notes
1 6. Abstract
A nationwide survey of 19,657 pilots was performed to collect information on their aviation qualifications and experiences, their participation in training activities, their involvement in critical aviation incidents, their personal minimums and usual practices when planning and conducting a flight, and their attitudes about flying issues. Results are based on returns received from 35% of the overall sample. Analyses were conducted to assess possible bias due to nonresponse effects by comparing respondent and nonrespondent groups on accident involvement, age, gender, and recent and total flight experience. No differences in accident involvement or in total flight experience were found . However, on average, the respondent group tended to be slightly older and to have slightly less recent flight experience than the nonrespondent group. The implications of these findings are discussed and cautions regarding the interpretation of the results are given. This initial report describes the methodology used in construction of the questionnaire and the procedures used for data collection. The percentages of respondents selecting each of the response alternatives for each question in the questionnaire are provided. Means, standard deviations, and medians are reported for those questions requiring exact numerical entries. Separate analyses of all items are given for private, commercial, and airline transport certificate categories. Possible applications of the data obtained from this study are discussed and proposed follow-on analyses to be conducted and reported in additional reports are described.
1 7. Key Words 18. Distribution Statement
Pilots Attitudes toward safety Document is available to the public through the Surveys, aviation National Technical Information Service Aviation safety Springfield, Virginia 22161 19. Security Classif . (of this report) 20. Security Classif. (of this page) 21 . No. of Pages 22. Price
Unclassified Unclassified 67 Form DOT F 1700.7 (8-72) Reproduction of completed page authonzed
•
ACKNOWLEDGMENTS
This effort was sponsored by the Flight Standards Service (AFS-81 0). Mr. Roger M. Baker, Aviation Safety National Program Manager, provided program guidance on behalf of that organization and contributed significantly to the success of this research by his continued interest and support.
The author wishes to acknowledge the contributions of the many people who helped make this project possible. I am indebted to Mr. Bruce Landsberg of the Aircraft Owners and Pilots Association Aviation Safety Foundation and Captain Jim Irving for reviewing an early version of the survey instrument and making valuable comments. I also want to acknowledge the substantial help put forth by many members ofthe Federal Air Surgeon's Washington staff in addressing 20,000 followup postcards. Special thanks are also due to Mr. Sean Sanfilippo who contributed greatly to this project during his summer internship in my office. Between his other, more interesting activities, Sean took on the task of processing the returned questionnaires. Sean's initiative and determination to see the job through were a great help.
Finally, I want to thank the almost 7,000 pilots who sat down with their logbooks for up to four hours ·in some cases and filled out the questionnaire. Whatever measure of success this project achieves is due largely to their efforts.
iii
ACKNOWLEDGMENTS
This effort was sponsored by the Flight Standards Service (AFS-81 0). Mr. Roger M. Baker, Aviation Safety National Program Manager, provided program guidance on behalf of that organization and contributed significantly to the success of this research by his continued interest and support.
The author wishes to acknowledge the contributions of the many people who helped make this project possible. I am indebted to Mr. Bruce Landsberg ofthe Aircraft Owners and Pilots Association Aviation Safety Foundation and Captain Jim Irving for reviewing an early version of the survey instrument and making valuable comments. I also want to acknowledge the substantial help put forth by many members of the Federal Air Surgeon's Washington staff in addressing 20,000 followup postcards. Special thanks are also due to Mr. Sean Sanfilippo who contributed greatly to this project during his summer internship in my office. Between his other, more interesting activities, Sean took on the task of processing the returned questionnaires. Sean's initiative and determination to see the job through were a great help.
Finally, I want to thank the almost 7,000 pilots who sat down with their logbooks for up to four hours in some cases and filled out the questionnaire. Whatever measure of success this project achieves is due largely to their efforts.
iii
TABLE OF CONTENTS
INTR 0 D U CTI ON --------------------------------------------------------------------------------------------------------- 1
METH 0 D -------------------------------------------------------------------------------------------------------------------- 1 Subjects ------------------------------------------------------------------------------------------------------------- 1 Questionnaire Development ------------------------------------------------------------------------------------- 2 Mailing ------------------------------------------------------------------------------------------------------------- 2
RESULTS -------------------------------------------------------------------------------------------------------------------- 3 Return Rates ------------------------------------------------------------------------------------------------------- 3 Generalizability ---------------------------------------------------------------------------------------------------- 3
Sampling Error-------------------... -----------------------------------------.,.--------------------------------- 3 Nonsampling Error------------------------------------------------------------------------------------------ 4 Interpreting the Results ------------------------------------------------------------------------------------ 7
Analyses of Responses ------------------------------------------------------------------------------------------- 9 Aviation Qualifications and Experience --------------------------------------------------------------------- 10 Aircraft Most Frequently Flown ------------------------------------------------------------------------------ 10 Professional Aviation Careers --------------------------------------------------------------------------------- 10 Training ----------------------------------------------------------------------------------------------------------- 1 7 Safety Seminars -~------------------------------------------------------------------------------------------------ 1 7 Critical Aviation Incidents ------------------------------------------------------------------------------------- 17 Personal Minimums ---------------------------------------------------------------------------------------------- 22 Common Practices ----------------------------------------------------------------------------------------------- 24 Attitudes Toward Flying ---------------------------------------------------------------------------------------- 2 9 Participation in Future Research------------------------------------------------------------------------------ 34 Pilot Demographics ---------------------------------------------------------------------------------------------- 3 5 Flight Experience------------------------------------------------------------------------------------------------- 3 5
DISC US S I ON AND C 0 N C L US I 0 N S ------------------------------------------------------------------------------- 44
REFERENCES ------------------------------------------------------------------------------------------------------------45
APPEND IX - SURVEY INSTRUMENT --------------------------------------------------------------------------- A 1
v
LIST OF TABLES
Table 1. Table 2. Table 3. Table 4. Table 5. Table 6. Table 7.
Table 8. Table 9.
Table 10.
Table 11.
Table 12. Table 13. Table 14. Table 15. Table 16. Table 17. Table 18. Table 19. Table 20. Table 21. Table 22. Table 23. Table 24. Table 25. Table 26. Table 27. Table 28. Table29. Table 30.
Representative sample sizes and confidence intervals---------------------------------------------- 4 Comparison of accident rates for all respondents and nonrespondents -------------------------- 6 Comparison of response rates for certificate type -------------------------------------------------- 6 Comparison of response status by gender for all pilots-------------------------------------------- 6 Comparison of age and flight experience for all respondents and nonrespondents ------------ 6 Comparison of response status by gender for private pilots -------------------------------------- 7 Comparison of age and flight experience for respondent and · nonrespondent private pilots---------------------------------------------------------------------------- 8 Com pari son of response status by gender for commercial pilots--------------------------------- 8 Comparison of age and flight experience for respondent and nonrespondent commercial pilots ----------------------------------------------~----------------------- 8 Comparison of response status by gender for airline transport pilots-------------------------------------------------------------------------------------------- 9 Comparison of age and flight experience for respondent and · nonrespondent airline transport pilots----------------------------------------------------------------- 9 Aviation qualifications and experience--------------------------------------------------------------- 11 Most frequently flown aircraft ----------------------------------------------------------------------- 12 Present employer---------------------------------------------------------------------------------------- 13 Present position ----------------------------------------------------------------------------------------- 13 First em p Ioyer ------------------------------------------------------------------------------------------- 14 First professional aviation position------------------------------------------------------------------ 14 Locations worked during aviation career----------------------------------------------------------- 14 Number of training experiences over preceding two years -------------------------------------- 15 Attendance at safety seminars ------------------------------------------------------------------------ 18 Involvement in hazardous events--------------------------------------------------------------------- 19 Personal minimums for VFR flight------------------------------------------------------------------ 22 Usual practices - local flights --------------~------------------------------------------------------- 24 Usual practices- cross-country flights ----------------------------------------------------------- 27 Opinions about flying ---------------------------------------------------------------------------------- 3 0 Participation in future research ---------------------------------------------------------------------- 34 Demographic information ----------------------------------------------------------------------------- 3 5 Flight time during preceding 6 months, 12 months, and total career-------------------------- 36 Number of landings made ----------------------------------------------------------------------------- 4 3 Number of instrument approaches made------------------------------------------------------------ 43
LIST OF FIGURES
Figure 1. Figure 2.
Total flight hours for private pilots------------------------------------------------------------------ 42 Total flight hours for commercial pilots------------------------------------------------------------ 42
vi
AIRMAN RESEARCH QUESTIONNAIRE: METHODOLOGYANDOVERALLRESULTS
INTRODUCTION
This report describes a large-scale, nationwide survey of pilots conducted by the Federal Aviation Administration. The survey was originally conceived as a means of obtaining data to be used in support of research on aeronautical decision making (ADM). While formulating plans for the ADM research it soon became clear that certain underlying data were not available-specifically data which described the population of pilots in the United States. Although the characteristics of pilots who are involved in accidents are routinely tabulated (c.f., NTSB, 1989), such information was lacking for the much larger group ·of pilots who had not experienced an accident. Thus, while the numerator (the pilots involved in accidents) was well known, the denominator {the population of pilots in general) in accident risk equations was often only poorly estimated. This was of particular concern in the ADM research, because of the need to focus interventions on those groups of pilots most at-risk for accident involvement. This requirement dictated that information be available on the underlying population in order to properly distinguish at-risk groups from those with comparatively little likelihood of experiencing an accident.
Beyond this basic requirement, which would primarily be served by a detailed enumeration of flight times and similar characteristics, the use of a survey also provided a means for the collection of collateral information which could be of significant use when planning a marketing strategy for new ADM interventions. At present the primary vehicle for disseminating safety information used by the FAA is the safety seminar. These seminars are conducted at hundreds of locations across the country and draw thousands of pilots annually. Yet, little is known about which pilots attend the seminars, why they attend, what formats of instruction and topics are favored, and how often they attend. Therefore,
1
the scope of the survey was broadened to include questions relating to training in general, and safety seminars specifically.
Besides including questions on training issues, additional sections were developed to assess other factors which might be related to safety and accident involvement. These sections included questions on involvement in hazardous events (such as running out of fuel), personal minimums, and attitudes toward flying. One section was also added specifically dealing with the career patterns of professional pilots, in anticipation of future research in that area.
As eventually formulated, the goal of the survey was twofold. First, the survey should provide a reliable normative description of the pilot population that would serve as a basis for comparisons for relative risk evaluations. Secondly, the survey should provide an adequate database for exploratory research to evaluate the relationships among various pilot characteristics, behavior, and attitudes, and involvement in accidents or other critical events .
The information gained from the survey will be used, therefore, both by the sponsoring organization in evaluating its safety seminar programs and by the research community in conducting ADM and other aviation safety-related research.
METHOD
Subjects Subjects were selected using simple random sam
pling without replacement from the population of active airmen listed in the FAA Airmen Certification System. An active airman is one who has been issued a valid airman medical certificate within the preceding 25 months. The total population is approximately 561,486 pilots (excluding student pilots), from which 20,000 subjects were drawn.
Computer files were generated containing names, addresses, certificate types, and certain information (i.e ., total flight times , employer) from the FAA Aeromedical Certification database and these files were in tum used to create a research database. That database was examined to identify ineligible subjects (i .e., those residing outside the United States) who were then eliminated. This process reduced the sample to 19,657.
Questionnaire Development The questionnaire was designed to provide a thor
ough demographic profile of the pilot population and at the same time to provide initial information on a number of areas of particular interest. These areas included training experiences, involvement in incidents which had the potential for accidents, personal preferences and practices when flying, and attitudes about flying . The questions were refined a number of times and the questionnaire was reviewed by both general aviation and airline pilots for clarity of instructions, completeness of alternatives, and the use of appropriate language and terms. The questionnaire and survey principles established in the literature (Dillman, 197 8; Kanuk & Berenson, 1975; Kish, 1965; Patten, 1950) were utilized in layout and overall design of the instrument. The questionnaire was submitted to the Office of Management and Budget for approval and was subsequently assigned the OMB Approval Number of 2120-0566 .
A trial version of the questionnaire was printed in an optically scannable booklet format and distributed to a small sample of pilots (500 cases independent ofthe 20,000 cases described above) to pre-test the questionnaire and the scanning and data reduction process. Along with the questionnaire an additional sheet was included which asked for the amount of time required to complete the questionnaire, assessments of the clarity of instructions, and any other comments which the respondents might care to make. Approximately 50 responses were received to this pilot study. The average time required for this group to complete the questionnaire was one hour. Instructions were all rated as very
2
clear and no comments requiring substantial modifications to the instrument were received. However, the questionnaire was shortened somewhat by reducing the number of questions relating to the numbers and types of jobs held by professional airmen in an effort to increase the response rates .
The final version of the questionnaire contained 143 items : 16 dealing with general aviation qualifications, 19 dealing with the number of hours logged during the last 6 months, last 12 months, and during the entire career of the respondent, 8 questions dealing with the type of aircraft flown most frequently over the past year, 3 dealing with the careers of professional airmen, 15 dealing with training experiences, 13 questions regarding critical aviation incidents, 34 dealing with personal minimums and practices, 27 dealing with attitudes about flying, 5 dealing with participation in future research studies, and 3 dealing with general demographic information.
The questionnaire was printed as an opticallyscannable booklet and incorporated a cover letter describing the project as the first page of the booklet. Each booklet contained a unique code number identifying the recipient.
Mailing Questionnaire booklets were mailed to the sample
of pilots along with a self-addressed business reply envelope. One week after the booklets were mailed, a postcard containing a reminder was mailed to all the sample.
. All returned questionnaires were reviewed for stray marks and other damage before being scanned using an NCS Sentry 3000 optical mark scanner. Response files created by the scanner were transferred to a desk-top PC for further analysis using SPSS for Windows.
Handwritten comments were received from approximately 500 respondents and were categorized using a procedure developed by the author and a summer intern. The analysis of those comments is outside the scope of this report, but will be described in a future publication.
RESULTS
Return Rates Of the 19,657 questionnaires mailed out, 390
were returned as undeliverable-usually because the pilot had moved and the time limit on forwarding of mail had expired. In addition, 19 were returned because the pilot was deceased. This reduced the effective sample to 19,248. There were 6,808 questionnaire booklets returned, of which 6,735 were usable-the others having been so damaged in transit that they were not scannable. The effective return rate for the survey was therefore 35% (6, 735/19,248).
Generalizability When dealing with self-administered mail sur
vey data, such as are given in this report, one must appreciate the sources of error to which the data are subject. In general, these sources fall into two groups: sampling error and nonsampling error. Because it is important that these factors be understood to properly evaluate the results of this study, each will be described in some detail. The interested reader is also referred to any of several excellent texts on this subject (c.f. , Henry, 1990; Fowler, 1993; Rea & Parker, 1992).
Sampling Error. Sampling error is that error which is attributable to the sample drawn from the population of interest. It is the margin of error most commonly reported in descriptions of surveys and is typically stated to the effect that the survey responses are accurate to within plus or minus 5%. This statement means that there is a 95% (or greater) certainty that the observed value (for example, the percentage of pilots possessing an instrument rating in the current study) falls within 5% of the true or population value-that value which one would obtain if the entire population were measured on that attribute.
It is necessary to state this confidence interval because the values obtained from any particular sample are only estimates of the population values. If one were to draw samples repeatedly from a large population one would find that the values obtained
3
vary. In the present study we obtained the responses of one sample of pilots drawn from the total population of pilots. However, if we were to draw another sample of 20,000 pilots at random from the population and ask them the same questions in exactly the same way then we would expect that their responses might differ slightly from those we obtained from the first sample. This is simply due to random fluctuations in the characteristics of the individuals comprising the samples.
In general, the larger the samples we draw from the population, the smaller will be these differences. Further, for a large population such as we are dealing with here, the percentage of the population represented by a particular sample does not influence the accuracy of the data. Rather, it is the size of the sample. Thus, a sample of20,000 individuals drawn from a population of 500,000 produces the same degree of accuracy as a sample of20,000 individuals drawn from a population of 5,000,000. This is because the variability of the results depends solely upon the size of the sample and it is this variability that we are referring to when we talk about the accuracy of the results.
For the most part the data to be presented in this study consist of proportions (usually expressed as percentages) which indicate what portion of the specified sample chose a particular alternative for each question. For example, one of the first questions asks whether the pilot has a multi-engine rating. The possible alternatives are yes and no, and the numbers reported are the percentages of pilots in each of the three certificate categories who chose each of those alternatives. Of the Private Pilots, 11.3% indicated they had a multi-engine rating, while 88.7% indicated they did not. As noted earlier, if we were to repeat this survey with another group of randomly selected pilots, the responses to this question might be slightly different, simply as a result of random fluctuation in the group drawn from the population. The number which we obtain from any particular sample of that population is simply an estimate of the population value, and hence will be somewhat inaccurate. Fortunately, because we know the properties of this random variation, we know how accurate we may expect our results
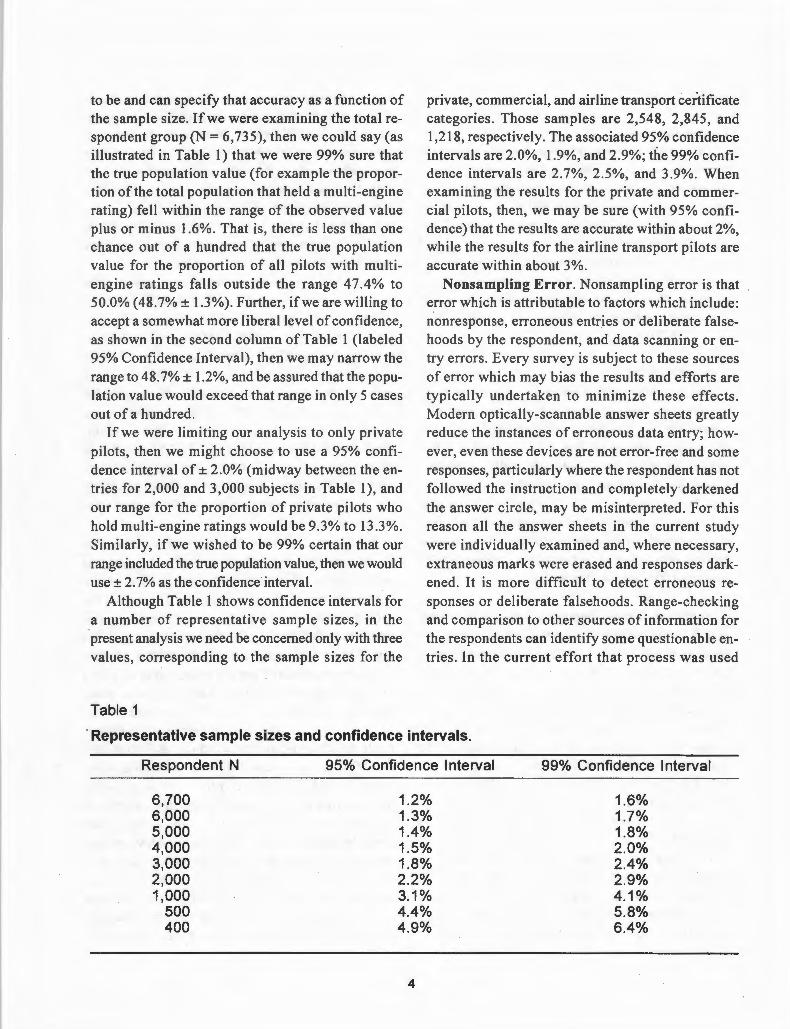
to be and can specify that accuracy as a function of the sample size. If we were examining the total respondent group (N = 6,735), then we could say (as illustrated in Table 1) that we were 99% sure that the true population value (for example the proportion of the total population that held a multi-engine rating) fell within the range of the observed value plus or minus 1.6%. That is, there is less than one chance out of a hundred that the true population value for the proportion of all pilots with multiengine ratings falls outside the range 47 .4% to 50.0% (48.7% ± 1.3%). Further, if we are willing to accept a somewhat more liberal level of confidence, as shown in the second column of Table 1 (labeled 95% Confidence Interval), then we may narrow the range to 48.7% ± 1.2%, and be assured that the population value would exceed that range in only 5 cases out of a hundred.
If we were limiting our analysis to only private pilots, then we might choose to use a 95% confidence interval of± 2.0% (midway between the entries for 2,000 and 3,000 subjects in Table 1), and our range for the proportion of private pilots who hold multi-engine ratings would be 9.3% to 13.3%. Similarly, if we wished to be 99% certain that our range included the true population value, then we would use± 2.7% as the confidence interval.
Although Table 1 shows confidence intervals for a number of representative sample sizes, in the present analysis we need be concerned only with three values, corresponding to the sample sizes for the
Table 1
private, commercial, and airline transport certificate categories. Those samples are 2,548, 2,845, and 1,218, respectively. The associated 95% confidence intervals are 2.0%, 1.9%, and 2.9%; the 99% confidence intervals are 2.7%, 2.5%, and 3.9%. When examining the results for the private and commercial pilots, then, we may be sure (with 95% confidence) that the results are accurate within about 2%, while the results for the airline transport pilots are accurate within about 3%.
Nonsampling Error. Nonsampling error is that error which is attributable to factors which include: nonresponse, erroneous entries or deliberate falsehoods by the respondent, and data scanning or entry errors . Every survey is subject to these sources of error which may bias the results and efforts are typically undertaken to minimize these effects. Modern optically-scannable answer sheets greatly reduce the instances of erroneous data entry; however, even these devices are not error-free and some responses, particularly where the respondent has not followed the instruction and completely darkened the answer circle, may be misinterpreted. For this reason all the answer sheets in the current study were individually examined and, where necessary, extraneous marks were erased and responses darkened. It is more difficult to detect erroneous responses or deliberate falsehoods . Range-checking and comparison to other sources of information for the respondents can identify some questionable entries. In the current effort that process was used
·Representative sample sizes and confidence intervals.
Respondent N
6,700 6,000 5,000 4,000 3,000 2,000 1,000
500 400
95% Confidence Interval
1.2% 1.3% 1.4% 1.5% 1.8% 2.2% 3.1% 4.4% 4.9%
4
99% Confidence Interval
1.6% 1.7% 1.8% 2.0% 2.4% 2.9% 4.1% 5.8% 6.4%
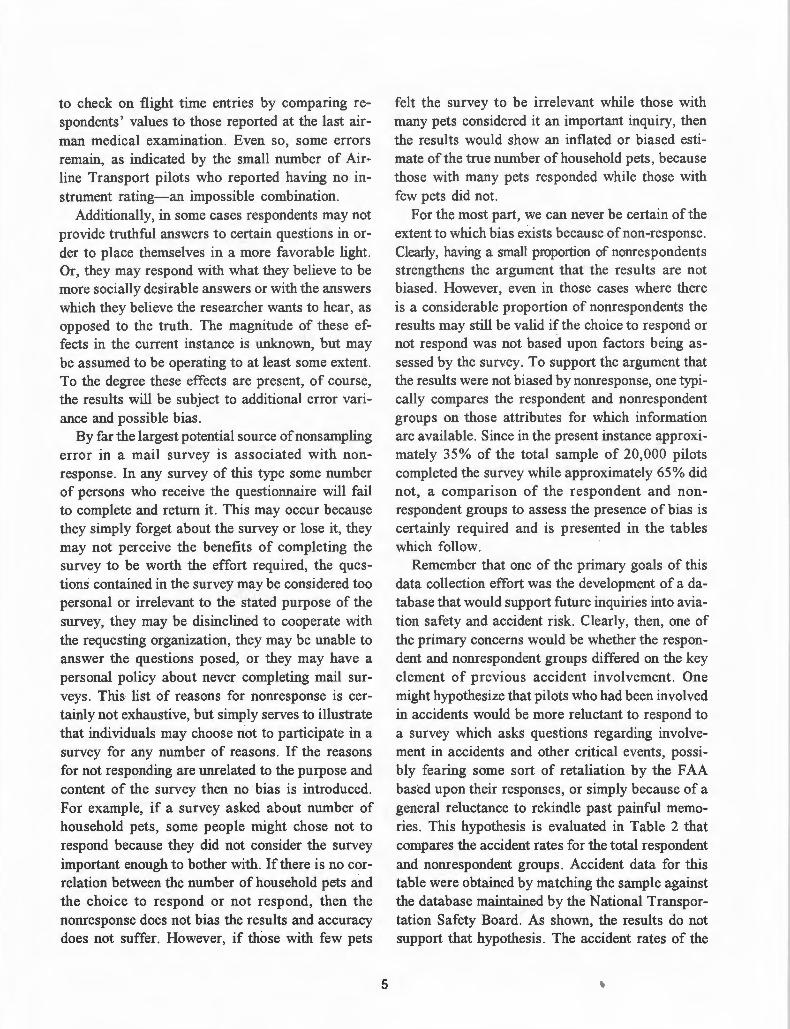
to check on flight time entries by comparing respondents' values to those reported at the last airman medical examination. Even so, some errors remain, as indicated by the small number of Airline Transport pilots who reported having no instrument rating-an impossible combination.
Additionally, in some cases respondents may not provide truthful answers to certain questions in order to place themselves in a more favorable light. Or, they may respond with what they believe to be more socially desirable answers or with the answers which they believe the researcher wants to hear, as opposed to the truth. The magnitude of these effects in the current instance is unknown, but may be assumed to be operating to at least some extent. To the degree these effects are present, of course, the results will be subject to additional error variance and possible bias.
By far the largest potential source of nonsampling error in a mail survey is associated with nonresponse. In any survey of this type some number of persons who receive the questionnaire will fail to complete and return it. This may occur because they simply forget about the survey or lose it, they may not perceive the benefits of completing the survey to be worth the effort required, the questions contained in the survey may be considered too personal or irrelevant to the stated purpose of the survey, they may be disinclined to cooperate with the requesting organization, they may be unable to answer the questions posed, or they may have a personal policy about never completing mail surveys. This list of reasons for nonresponse is certainly not exhaustive, but simply serves to illustrate that individuals may choose not to participate in a survey for any number of reasons. If the reasons for not responding are unrelated to the purpose and content of the survey then no bias is introduced. For example, if a survey asked about number of household pets, some people might chose not to respond because they did not consider the survey important enough to bother with. If there is no correlation between the number of household pets and the choice to respond or not respond, then the nonresponse does not bias the results and accuracy does not suffer. However, if those with few pets
5
felt the survey to be irrelevant while those with many pets considered it an important inquiry, then the results would show an inflated or biased estimate ofthe true number of household pets, because those with many pets responded while those with few pets did not.
For the most part, we can never be certain of the extent to which bias exists because of non-response. Clearly, having a small proportion of nonrespondents strengthens the argument that the results are not biased. However, even in those cases where there is a considerable proportion of nonrespondents the results may still be valid if the choice to respond or not respond was not based upon factors being assessed by the survey. To support the argument that the results were not biased by nonresponse, one typically compares the respondent and nonrespondent groups on those attributes for which information are available. Since in the present instance approximately 35% of the total sample of 20,000 pilots completed the survey while approximately 65% did not, a comparison of the respondent and nonrespondent groups to assess the presence of bias is certainly required and is presented in the tables which follow.
Remember that one of the primary goals of this data collection effort was the development of adatabase that would support future inquiries into aviation safety and accident risk. Clearly, then, one of the primary concerns would be whether the respondent and nonrespondent groups differed on the key element of previous accident involvement. One might hypothesize that pilots who had been involved in accidents would be more reluctant to respond to a survey which asks questions regarding involvement in accidents and other critical events, possibly fearing some sort of retaliation by the FAA based upon their responses, or simply because of a general reluctance to rekindle past painful memories. This hypothesis is evaluated in Table 2 that compares the accident rates for the total respondent and nonrespondent groups. Accident data for this table were obtained by matching the sample against the database maintained by the National Transportation Safety Board. As shown, the results do not support that hypothesis. The accident rates of the
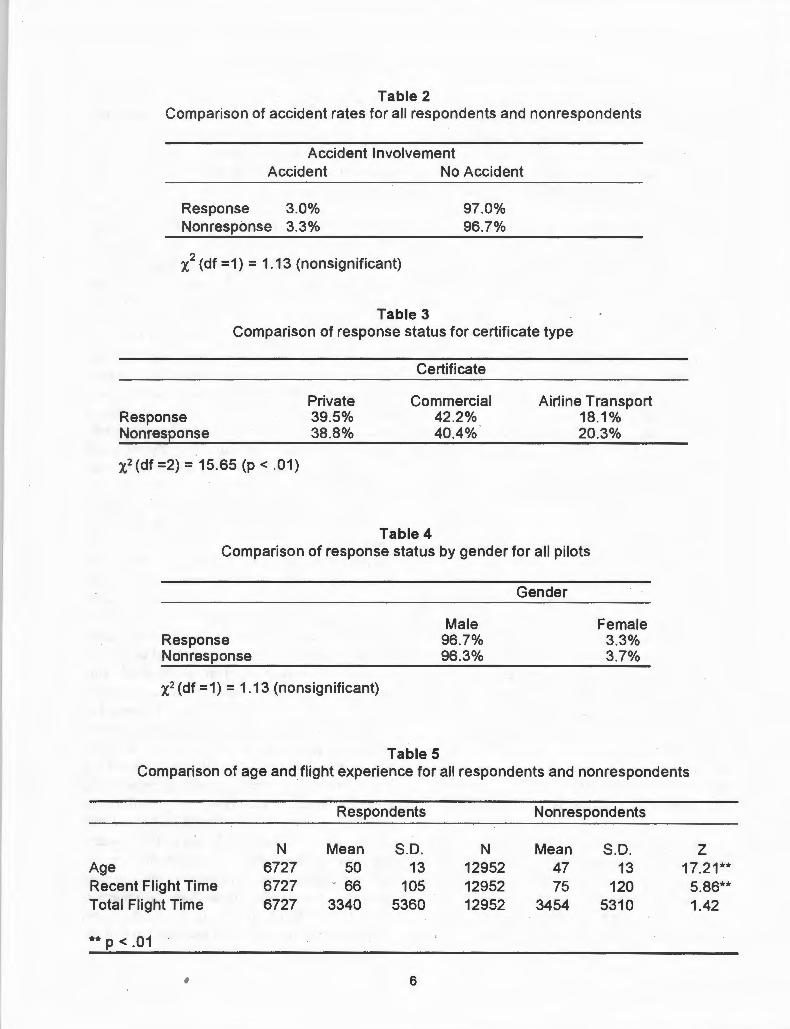
Table 2 Comparison of accident rates for all respondents and nonrespondents
Accident Involvement Accident No Accident
Response 3.0% Nonresponse 3.3%
x2 (df =1) = 1.13 (nonsignificant)
Table 3
97.0% 96.7%
Comparison of response status for certificate type
Response Non response
x2 (df =2) = 15.65 (P < .01)
Private 39.5% 38.8%
Certificate
Commercial 42.2% 40.4% .
Table 4
Airline Transport 18.1% 20.3%
Comparison of response status by gender for all pilots
Response Non response
X2 (df =1) = 1.13 (nonsignificant)
Table 5
Male 96.7% 96.3%
Gender
Female 3.3% 3.7%
Comparison of age and flight experience for all respondents and nonrespondents
Age Recent Flight Time Total Flight Time
** p < .01
'
N 6727 6727 6727
Respondents
Mean S.D. 50 13
. 66 105 3340 5360
6
Nonrespondents
N Mean S.D. z 12952 47 13 17.21** 12952 75 120 5.86** 12952 3454 5310 1.42
respondent and nonrespondent groups are very similar and a nonsignificant chi square is obtained leading us to believe that past accident involvement did not influence the decision to respond to the survey.
Tables 3, 4, and 5 provide some additional general comparisons of the respondent and nonrespondent groups. Table 3 demonstrates a significant difference in the response rates among the three pilot certificate levels. Although the absolute differences are not large (not more than 2% for any of the certificate groups) there is a significant difference in the response rates, with private pilots being the most likely to participate.
Tables 4 and 5 continue the comparison of the combined groups on gender, age, and flight time. In the combined certificate group there was no significant difference in gender between the respondent and nonrespondent groups, as demonstrated by the nonsignificant chi square shown in Table 4. Overall, there was a three year difference in the mean ages of the respondent and nonrespondent groups which was statistically significant. Respondents tended to be slightly older than nonrespondents. Similarly, though not the degree obtained for age, there was a significant difference in the recent flight time. Nonrespondents reported having flown an average of75 hours of recent flight time, while respondents reported having flown 66 hours. Comparison of total flight time, however, showed no significant difference between the two groups.
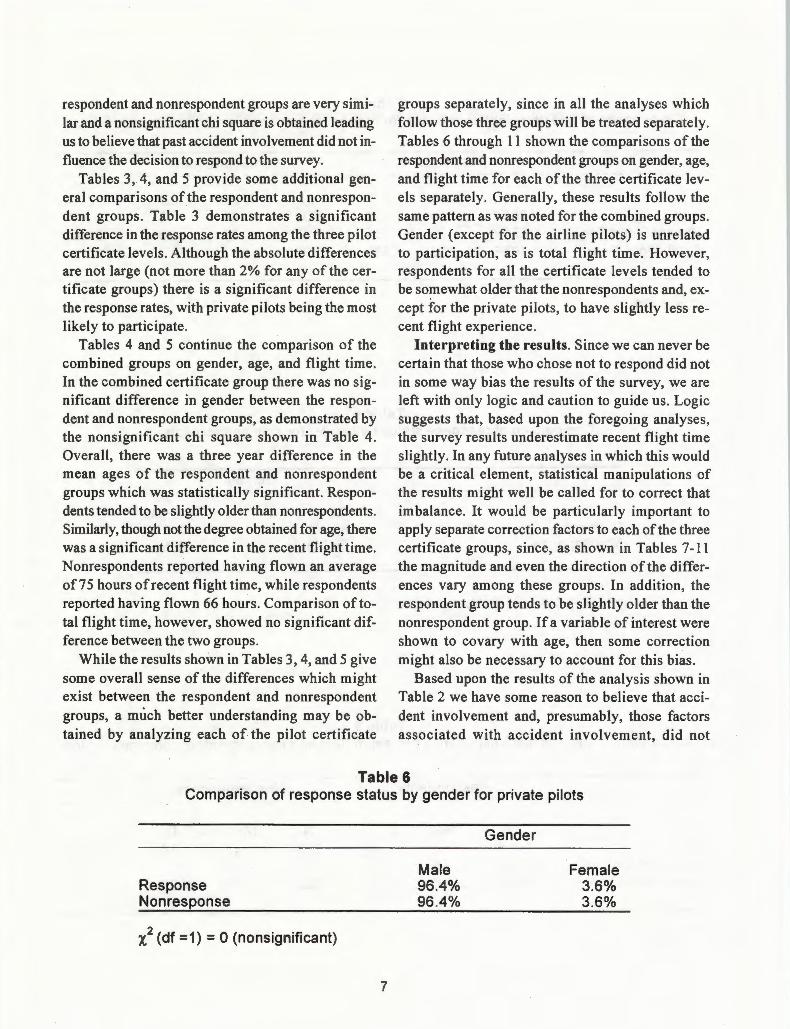
While the results shown in Tables 3, 4, and 5 give some overall sense of the differences which might exist between the respondent and nonrespondent groups, a much better understanding may be obtained by analyzing each of the pilot certificate
groups separately, since in all the analyses which follow those three groups will be treated separately. Tables 6 through 11 shown the comparisons of the respondent and nonrespondent groups on gender, age, and flight time for each of the three certificate levels separately. Generally, these results follow the same pattern as was noted for the combined groups. Gender (except for the airline pilots) is unrelated to participation, as is total flight time. However, respondents for all the certificate levels tended to be somewhat older that the nonrespondents and, except for the private pilots, to have slightly less recent flight experience.
Interpreting the results. Since we can never be certain that those who chose not to respond did not in some way bias the results of the survey, we are left with only logic and caution to guide us. Logic suggests that, based upon the foregoing analyses, the survey results underestimate recent flight time slightly. In any future analyses in which this would be a critical element, statistical manipulations of the results might well be called for to correct that imbalance. It would be particularly important to apply separate correction factors to each of the three certificate groups, since, as shown in Tables 7-11 the magnitude and even the direction of the differences vary among these groups. In addition, the respondent group tends to be slightly older than the nonrespondent group. If a variable of interest were shown to covary with age, then some correction might also be necessary to account for this bias.
Based upon the results of the analysis shown in Table 2 we have some reason to believe that accident involvement and, presumably, those factors associated with accident involvement, did not
Table 6 Comparison of response status by gender for private pilots
Response Nonresponse
l (df =1) = 0 (nonsignificant)
7
Male 96.4% 96.4%
Gender
Female 3.6% 3.6%
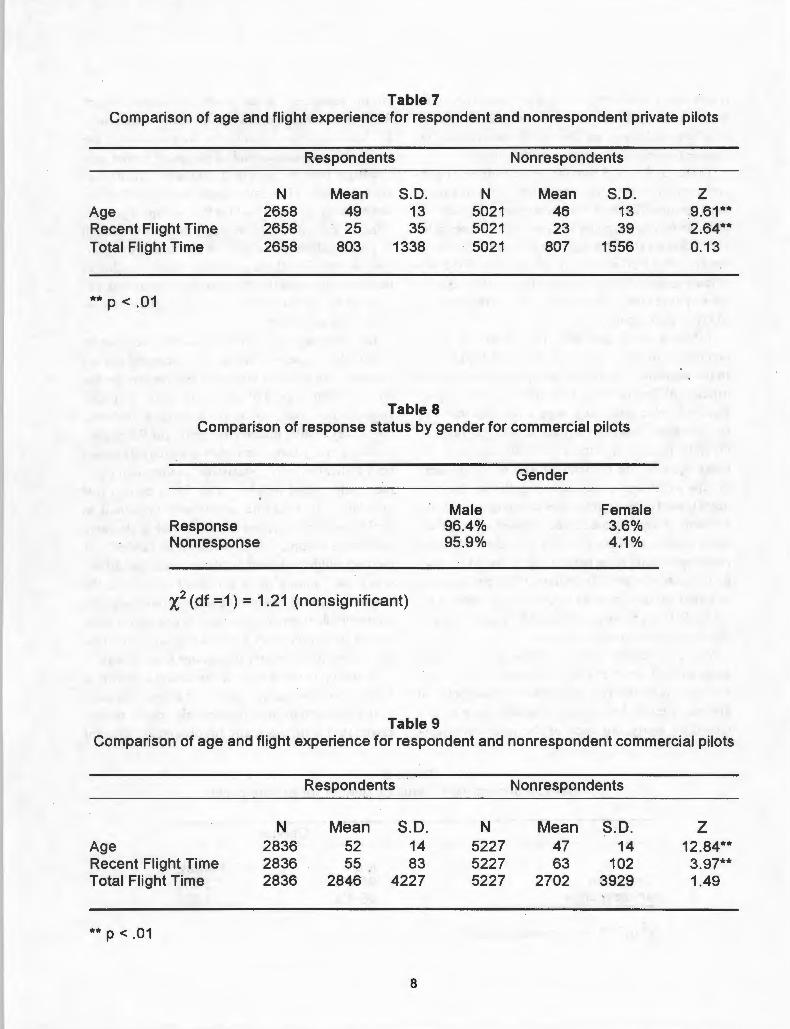
Table 7 Comparison of age and flight experience for respondent and nonrespondent private pilots
Age Recent Flight Time Total Flight Time
•• p < .01
N 2658 2658 2658
Respondents
Mean S.D. 49 13 25 35
803 1338
Table 8
Nonrespondents
N Mean S.D. 5021 46 13 5021 23 39 5021 807 1556
Comparison of response status by gender for commercial pilots
Response Non response
X2 (df =1) = 1.21 (nonsignificant)
Table 9
Male 96.4% 95.9%
Gender
Female 3.6% 4.1%
z 9.61** 2.64** 0.13
Comparison of age and flight experience for respondent and non respondent commercial pilots
Age Recent Flight Time Total Flight Time
•• p < .01
N 2836 2836 2836
Respondents
Mean S.D. 52 14 55 83
2846 4227
8
N 5227 5227 5227
Nonrespondents
Mean S.D. 47 14 63 102
2702 3929
z 12.84**
3.97** 1.49
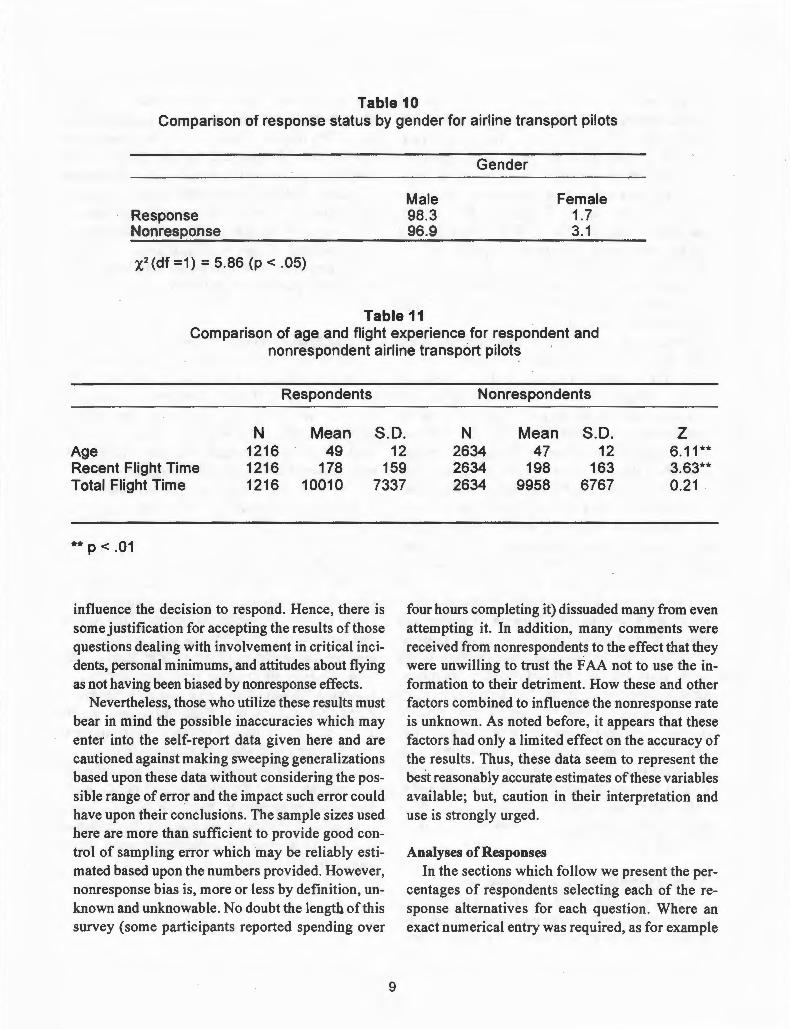
Table 10 Comparison of response status by gender for airline transport pilots
Response Non response
X2 (df =1 > = 5.86 (p < .05)
Male 98.3 96.9
Gender
Female 1.7 3.1
Table 11 Comparison of age and flight experience for respondent and
nonrespondent airline transport pilots
Respondents
N Mean S.D. Age 1216 49 12 Recent Flight Time 1216 178 159 Total Flight Time 1216 10010 7337
** p < .01
influence the decision to respond. Hence, there is some justification for accepting the results of those questions dealing with involvement in critical incidents, personal minimums, and attitudes about flying as not having been biased by nonresponse effects.
Nevertheless, those who utilize these results must bear in mind the possible inaccuracies which may enter into the self-report data given here and are cautioned against making sweeping generalizations based upon these data without considering the possible range of error and the impact such error could have upon their conclusions. The sample sizes used here are more than sufficient to provide good control of sampling error which may be reliably estimated based upon the numbers provided. However, nonresponse bias is, more or less by definition, unknown and unknowable. No doubt the length of this survey (some participants reported spending over
9
Nonrespondents
N Mean S.D. z 2634 47 12 6.11 ** 2634 198 163 3.63** 2634 9958 6767 0.21
four hours completing it) dissuaded many from even attempting it. In addition, many comments were received from nonrespondents to the effect that they were unwilling to trust the FAA not to use the information to their detriment. How these and other factors combined to influence the nonresponse rate is unknown. As noted before, it appears that these factors had only a limited effect on the accuracy of the results. Thus, these data seem to represent the best reasonably accurate estimates of these variables available; but, caution in their interpretation and use is strongly urged.
Analyses of Responses In the sections which follow we present the per
centages of respondents selecting each of the response alternatives for each question. Where an exact numerical entry was required, as for example
in the questions regarding flight time, the mean and standard deviation of the responses are given. For almost all of the questions requiring a numerical entry the median of the responses is also given.
The values are provided for all questions separately for each of the three pilot certificate categories: Private (N = 2,548), Commercial (N = 2,845), and Airline Transport (N = 1,218). Cases that did not fall into one of these three categories (for example, those pilots who reported having a student or recreational pilot license or who left this question blank) were excluded from the analyses . There were 124 cases so excluded.
The order of presentation in these analyses generally follows the order of presentation in the questionnaire. The exact wording given in the questionnaire may be compared to the abbreviated wording given in the analyses by referring to Appendix A, which contains the actual instrument used for data collection.
Given the extent of this database, an exhaustive analysis of the data in a single report is neither feasible nor desirable. Additional analyses of the characteristics associated with particular subgroups may be conducted in the future, provided there are sufficient numbers of cases available: At some points in the discussion of the results, follow-on analyses of this sort may be suggested where the results seem to raise particularly interesting questions . The reader must keep in mind however, that these are only suggestions at this point and that any analyses of that type must be predicated upon the availabililty of adequate data. Since it is difficult, if not impossible, to know a priori the research needs which may be served by these data and the exact form of the questions which need to be . addressed, such analyses will not be undertaken at this time. It is the intent in this initial report, therefore, to simply present the basic enumerations of responses and to defer more extensive analyses, particularly those involving subgroupings of the data where feasible, for future reports.
Aviation Qualifications and Experience One of the goals of this research was to develop a
normative database which could be used in later research to compare accident-involved pilots with those
10
who have not been involved in accidents and, if feasible, to develop a procedure for describing at-risk pilots. The data in Table 12 are the first elements of that normative database and provide information not formerly available on the characteristics of the pilot population. Although it is possible to make comparisons among the three certificate categories, the primary interest at this point is to better understand the characteristics of each individual group - recognizing that those with higher level certificates have of necessity passed through the lower stages at some point.
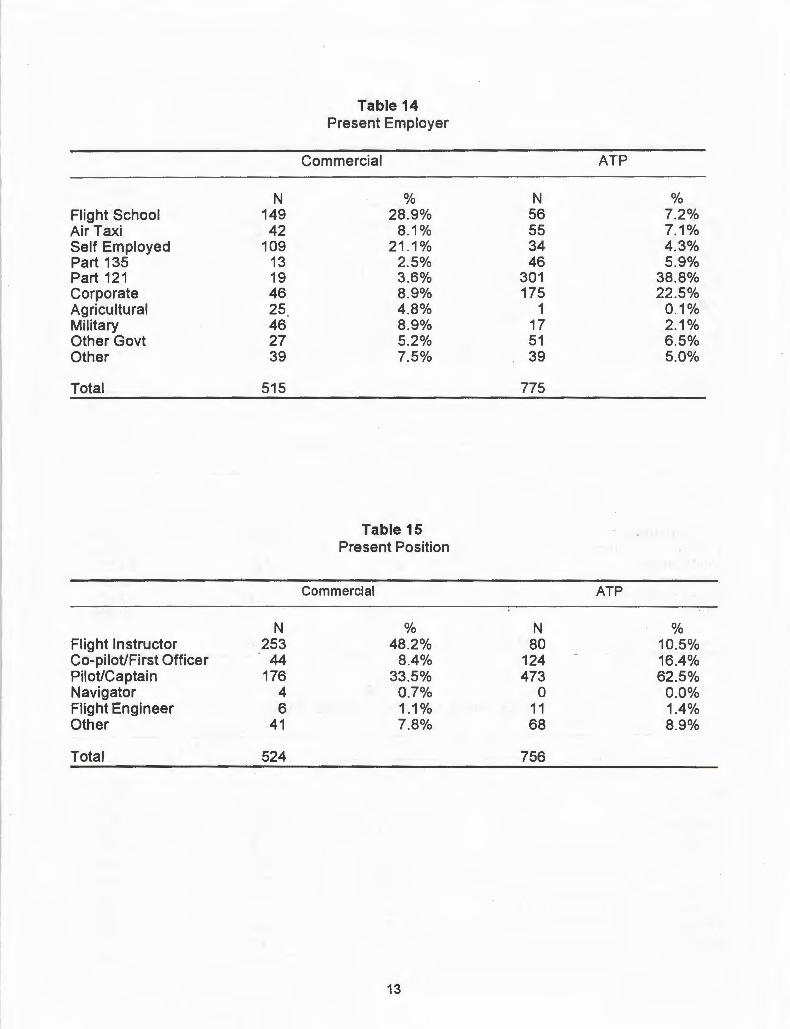
Aircraft Most Frequently Flown Several questions asked about the characteristics
of the aircraft that had been flown most frequently over the last year. Table 13 presents the responses for those questions. As might be expected, private pilots predominately flew single-engine piston aircraft with fixed landing gear, while those pilots .with more advanced certificates flew a progressively wider variety of aircraft types . For all pilot groups, however, the median number of different aircraft flown was two.
Professional Aviation Careers One section of the questionnaire was devoted spe
cifically to developing a better understanding of the career process of professional airmen. This section was included to provide baseline data on career progression that might be of use in later studies. The data also allow us to better break down the heterogeneous Commercial and ATP groups for possible studies dealing with only flight instructors or Part 121 pilots, for example. Because the first question in this series asked whether the pilot had ever been employed as a professional airman and directed those who had not to skip the following section, the numbers of pilots completing these questions is somewhat reduced. In addition, the question corresponding to Table 18 allowed for multiple responses, therefore no total is given.
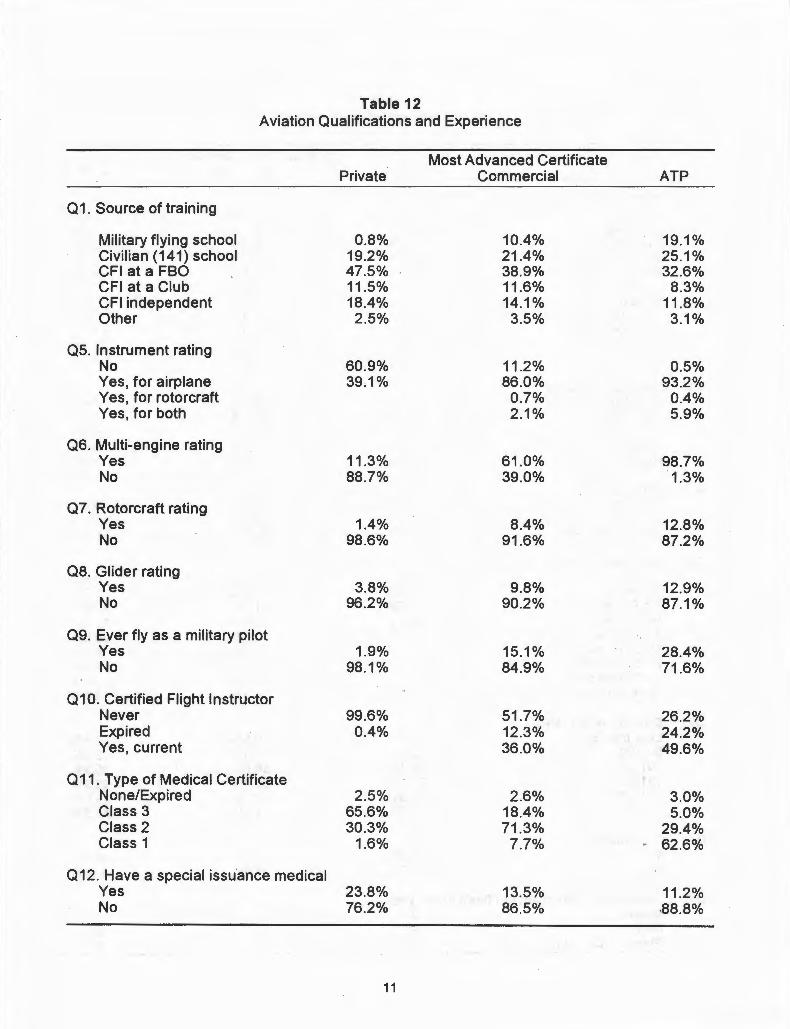
Table 12 Aviation Qualifications and Experience
Most Advanced Certificate Private Commercial ATP
01. Source of training
Military flying school 0.8% 10.4% 19.1% Civilian (141) school 19.2% 21.4% 25.1% CFI at a FBO 47.5% 38.9% 32.6% CFI at a Club 11 .5% 11.6% 8.3% CFI independent 18.4% 14.1% 11 .8% Other 2.5% 3.5% 3.1%
05. Instrument rating No 60.9% 11.2% 0.5% Yes, for airplane 39.1% 86.0% 93.2% Yes, for rotorcraft 0.7% 0.4% Yes, for both 2.1% 5.9%
06. Multi-engine rating Yes 11.3% 61 .0% 98.7% No 88.7% 39.0% 1.3%
07. Rotorcraft rating Yes 1.4% 8.4% 12.8% No 98.6% 91.6% 87.2%
Q8. Glider rating Yes 3.8% 9.8% 12.9% No 96.2% 90.2% 87.1%
09. Ever fly as a military pilot Yes 1.9% 15.1% 28.4% No 98.1% 84.9% 71.6%
010. Certified Flight Instructor Never 99.6% 51.7% 26.2% Expired 0.4% 12.3% 24.2% Yes, current 36.0% 49.6%
011. Type of Medical Certificate None/Expired 2.5% 2.6% 3.0% Class 3 65.6% 18.4% 5.0% Class 2 30.3% 71.3% 29.4% Class 1 1.6% 7.7% - 62.6%
012. Have a special issuance medical Yes 23.8% 13.5% 11 .2% No 76.2% 86.5% .88.8%
11
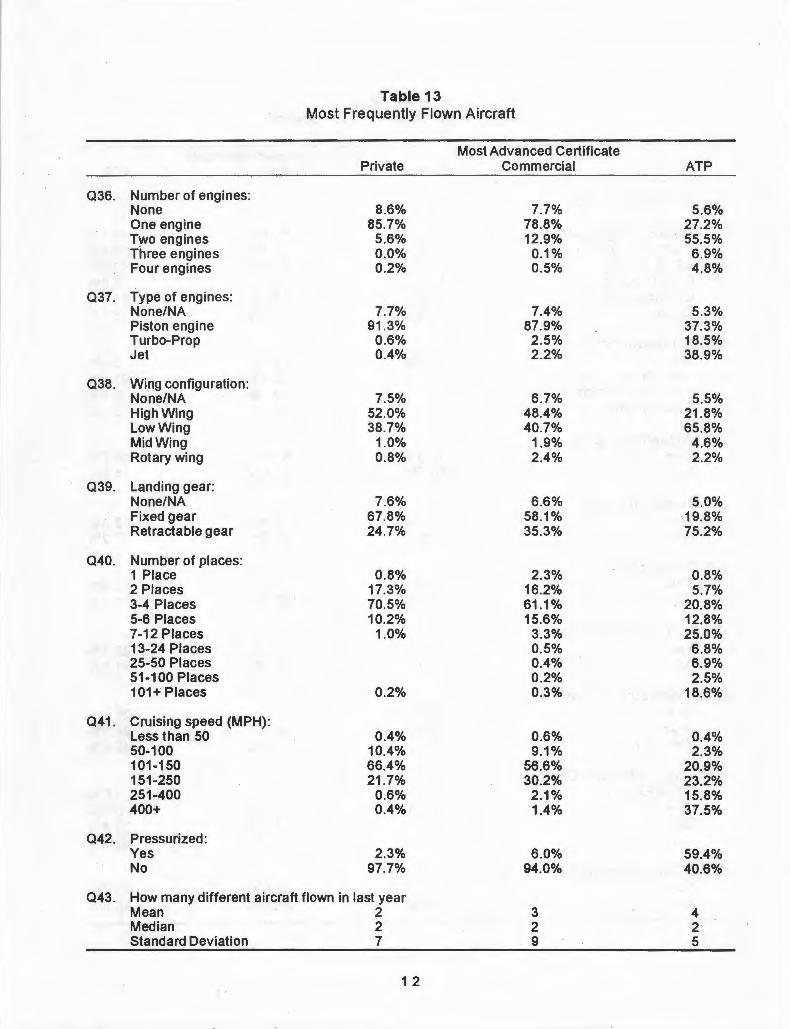
Table 13 Most Frequently Flown Aircraft
Most Advanced Certificate Private Commercial ATP
036. Number of engines: None 8.6% 7.7% 5.6% One engine 85.7% 78.8% 27.2% Two engines 5.6% 12.9% 55.5% Three engines 0.0% 0.1% 6.9% Four engines 0.2% 0.5% 4.8%
037. Type of engines: None/NA 7.7% 7.4% 5.3% Piston engine 91.3% 87.9% 37.3% Turbo-Prop 0.6% 2.5% 18.5% Jet 0.4% 2.2% 38.9%
038. Wing configuration: None/NA 7.5% 6.7% 5.5% High Wing 52.0% 48.4% 21.8% Low Wing 38.7% 40.7% 65.8% Mid Wing 1.0% 1.9% 4.6% Rotary wing 0.8% 2.4% 2.2%
039. Landing gear: None/NA 7.6% 6.6% 5.0% Fixed gear 67.8% 58.1% 19.8% Retractable gear 24.7% 35.3% 75.2%
040. Number of places: 1 Place 0.8% 2.3% 0.8% 2 Places 17.3% 16.2% 5.7% 3-4 Places 70.5% 61.1% 20.8% 5-6 Places 10.2% 15.6% 12.8% 7-12 Places 1.0% 3.3% 25.0% 13-24 Places 0.5% 6.8% 25-50 Places 0.4% 6.9% 51-100 Places 0.2% 2.5% 101+ Places 0.2% 0.3% 18.6%
041. Cruising speed (MPH): Less than 50 0.4% 0.6% 0.4% 50-100 10.4% 9.1% 2.3% 101-150 66.4% 56.6% 20.9% 151-250 21.7% 30.2% 23.2% 251-400 0.6% 2.1% 15.8% 400+ 0.4% 1.4% 37.5%
042. Pressurized: Yes 2.3% 6.0% 59.4% No 97.7% 94.0% 40.6%
043. How many different aircraft flown in last year Mean 2 3 4 Median 2 2 2 Standard Deviation 7 9 5
1 2
Flight School Air Taxi Self Employed Part 135 Part 121 Corporate Agricultural Military Other Govt Other
Total
Flight Instructor Co-pilot/First Officer Pilot/Captain Navigator Flight Engineer Other
Total
N 149 42
109 13 19 46 25 46 27 39
515
N 253
44 176
4 6
41
524
Table 14 Present Employer
Commercial
% 28.9%
8.1% 21.1%
2.5% 3.6% 8.9% 4.8% 8.9% 5.2% 7.5%
Table 15 Present Position
Commercial
% 48.2%
8.4% 33.5%
0.7% 1.1% 7.8%
13
N 56 55 34 46
301 175
1 17 51 39
775
N 80
124 473
0 11 68
756
ATP
ATP
% 7.2% 7.1% 4.3% 5.9%
38.8% 22.5%
0.1% 2.1% 6.5% 5.0%
% 10.5% 16.4% 62.5%
0.0% 1.4% 8.9%
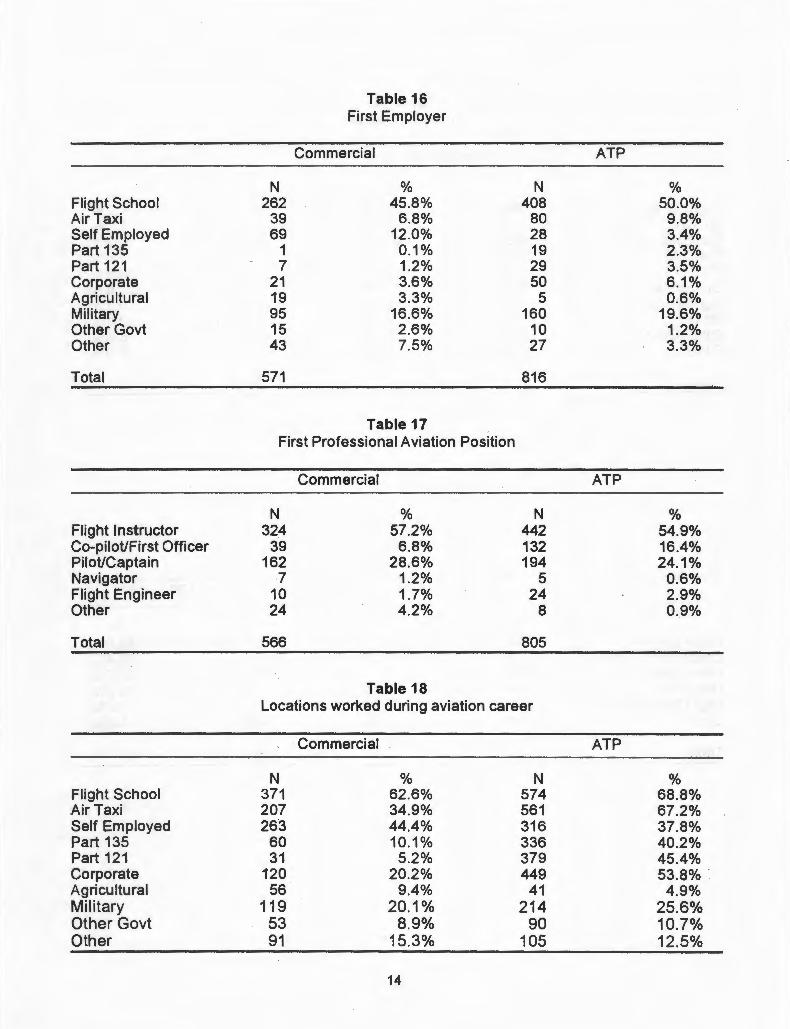
Table 16 First Employer
Commercial ATP
N % N % Flight School 262 45.8% 408 50.0% Air Taxi 39 6.8% 80 9.8% Self Employed 69 12.0% 28 3.4% Part 135 1 0.1% 19 2.3% Part 121 7 1.2% 29 3.5% Corporate 21 3.6% 50 6.1% Agricultural 19 3.3% 5 0.6% Military 95 16.6% 160 19.6% Other Govt 15 2.6% 10 1.2% Other 43 7.5% 27 3.3%
Total 571 816
Table 17 First Professional Aviation Position
Commercial ATP
N % N % Flight Instructor 324 57.2% 442 54.9% Co-piloUFirst Officer 39 6.8% 132 16.4% PiloUCaptain 162 28.6% 194 24.1% Navigator 7 1.2% 5 0.6% Flight Engineer 10 1.7% 24 2.9% Other 24 4.2% 8 0.9%
Total 566 805
Table 18 Locations worked during aviation career
Commercial ATP
N % N % Flight School 371 62.6% 574 68.8% Air Taxi 207 34.9% 561 67.2% Self Employed 263 44.4% 316 37.8% Part 135 60 10.1% 336 40.2% Part 121 31 5.2% 379 45.4% Corporate 120 20.2% 449 53.8% . Agricultural 56 9.4% 41 4.9% Military 119 20.1% 214 25.6% Other Govt 53 8.9% 90 10.7% Other 91 15.3% 105 12.5%
14
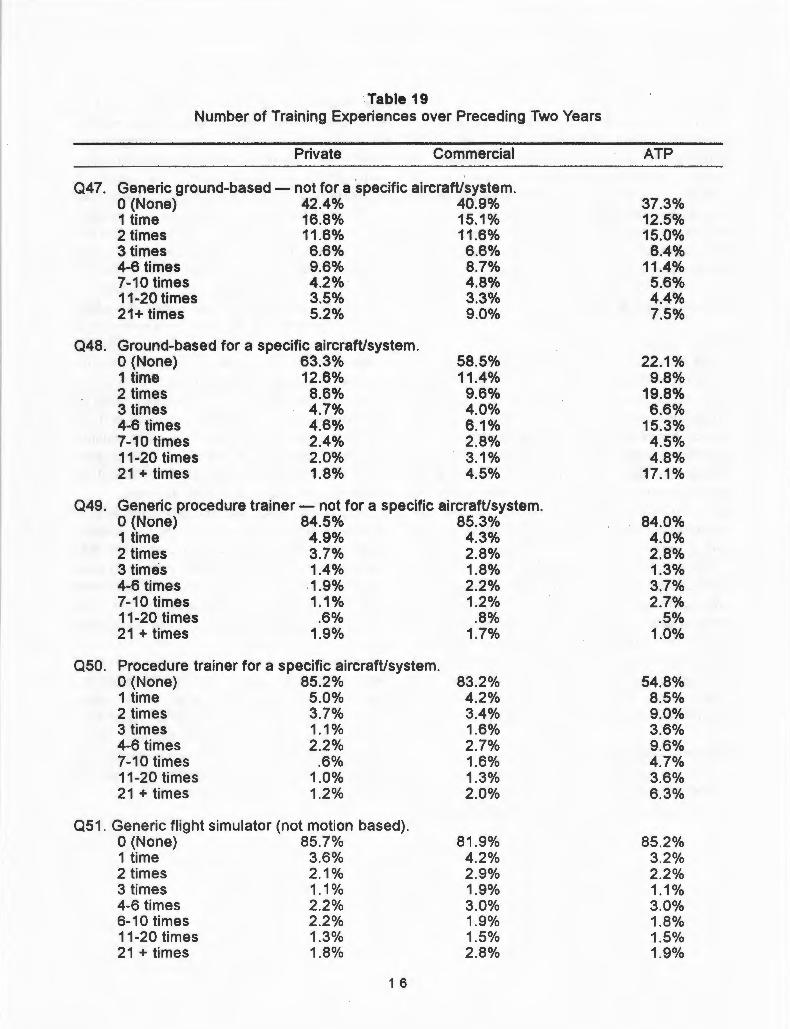
Training An area of particular interest to organizations dis
seminating safety information is that dealing with training. The questions relating to the number of training experiences over the last two years are given in Table 19. Clearly, the ATP and Commercial groups engage in more and different training activities than the Private group; however, even the majority of the Private pilots report having had some generic groundbased training over the last two years. In addition, 80% of the Private Pilots have had some in-flight training during that period.
Safety Seminars As shown in Table 20, the FAA Safety Seminars
attract predominately Private and Commercial pilots. Even among these groups, however, half report having never attended or having attended only once in the last two years. The most frequently reported reason for not attending among all three groups is that they are too busy, with location being another major consideration. Interestingly, the most appealing topic-pilot techniques-is probably the one least amenable to instruction in the typical lecture-oriented safety seminar.
Over the last several years the FAA has produced publications, videotapes, and other training materials dealing with aeronautical decision making. In most of these training materials the concept of hazardous thoughts, developed by Berlin et al. (1982a, b, c) based upon work by Jensen and Benel (1977), has been presented. The responses to Question 60 would suggest that, despite these efforts, this concept has reached only about half of the pilot population.
Critical Aviation Incidents Like the tip of the iceberg, accidents are only the
visible part of a much larger body of events which, for various reasons, do not result in catastrophe.
1 5
Many times pilots are involved in situations that do not develop into reportable accidents or incidents but might have done so had the situation changed even slightly. Because of the skill of the pilot, the reliability of the mechanical systems, or the capacity of the air traffic control system, situations which have the potential for serious consequences are neutralized. Yet, had the pilot been a little rusty, had the backup system also failed, or had the controller not provided a vital bit of information, then the chain of events leading to an accident might have ensued.
Accidents are relatively rare events in modern aviation. Demonstrating an impact on accident rates is therefore difficult because of the small number of events involved. However, if accidents are outgrowths of hazardous events and if hazardous events are much more common, even though they do not in the vast majority of times lead to an accident, then one might evaluate the impact of a safety training program by measuring the reduction in hazardous events. The logic being, if there are fewer hazardous events, then there should be fewer accidents.
Table 21 lists many hazardous events and the proportions of each certificate group who have experienced such events. Quite clearly, the data show that the more you fly, the more likely you are to have experienced one or more such events . Whereas 9% of the Private Pilots have been in an accident, 18% of the Airline Transport Pilots reporting having been in one or more accidents.
Continued VFR flight into IMC is the single largest cause of fatal accidents (particularly among the general aviation community) . It is interesting to note, therefore, that 25% of the Private Pilots report having flown into these conditions at least once. Turning back because of weather is a common practice, however, with about 72% of the Private Pilots reporting having turned back at some time.
·Table 19 Number of Training Experiences over Preceding Two Years
Private Commercial
047. Generic ground-based- not for a specific aircraft/system. 0 (None) 42.4% 40.9% 1 time 16.8% 15.1% 2 times 11.6% 11.6% 3 times 6.6% 6.6% 4-6 times 9.6% 8.7% 7-10 times 4.2% 4.8% 11-20 times 3.5% 3.3% 21+ times 5.2% 9.0%
048. Ground-based for a specific aircraft/system. 0 (None) 63.3% 1 time 12.6% 2 times 8.6% 3 times 4. 7% 4-6 times 4.6% 7-10 times 2.4% 11-20 times 2.0% 21 + times 1.8%
58.5% 11.4% 9.6% 4.0% 6.1 o/o 2.8% 3.1 o/o 4.5%
049. Generic procedure trainer- not for a specific aircraft/system. 0 (None) 84.5% 85.3% 1 time 4.9% 4.3% 2 times 3.7% 2.8% 3 times 1.4% 1.8% 4-6 times 1.9% 2.2% 7-10 times 1.1% 1.2% 11-20 times .6% .8% 21 +times 1.9% 1.7%
050. Procedure trainer for a specific aircraft/system. 0 (None) 85.2% 1 time 5.0% 2 times 3. 7% 3 times 1.1 o/o 4-6 times 2.2% 7-10 times .6% 11-20 times 1.0% 21 +times 1.2%
051 . Generic flight simulator (not motion based) . 0 (None) 85.7% 1 time 3.6% 2 times 2.1 o/o 3 times 1.1 o/o 4-6 times 2.2% 6-10 times 2.2% 11-20 times 1.3% 21 +times 1.8%
1 6
83.2% 4.2% 3.4% 1.6% 2. 7% 1.6% 1.3% 2.0%
81 .9% 4.2% 2.9% 1. 9% 3.0% 1. 9% 1.5% 2.8%
ATP
37.3% 12.5% 15.0% 6.4%
11.4% 5.6% 4.4% 7.5%
22.1% 9.8%
19.8% 6.6%
15.3% 4.5% 4.8%
17.1%
84.0% 4.0% 2.8% 1.3% 3.7% 2.7%
.5% 1.0%
54.8% 8.5% 9.0% 3.6% 9.6% 4. 7% 3.6% 6.3%
85.2% 3.2% 2.2% 1.1% 3.0% 1.8% 1.5% 1. 9%
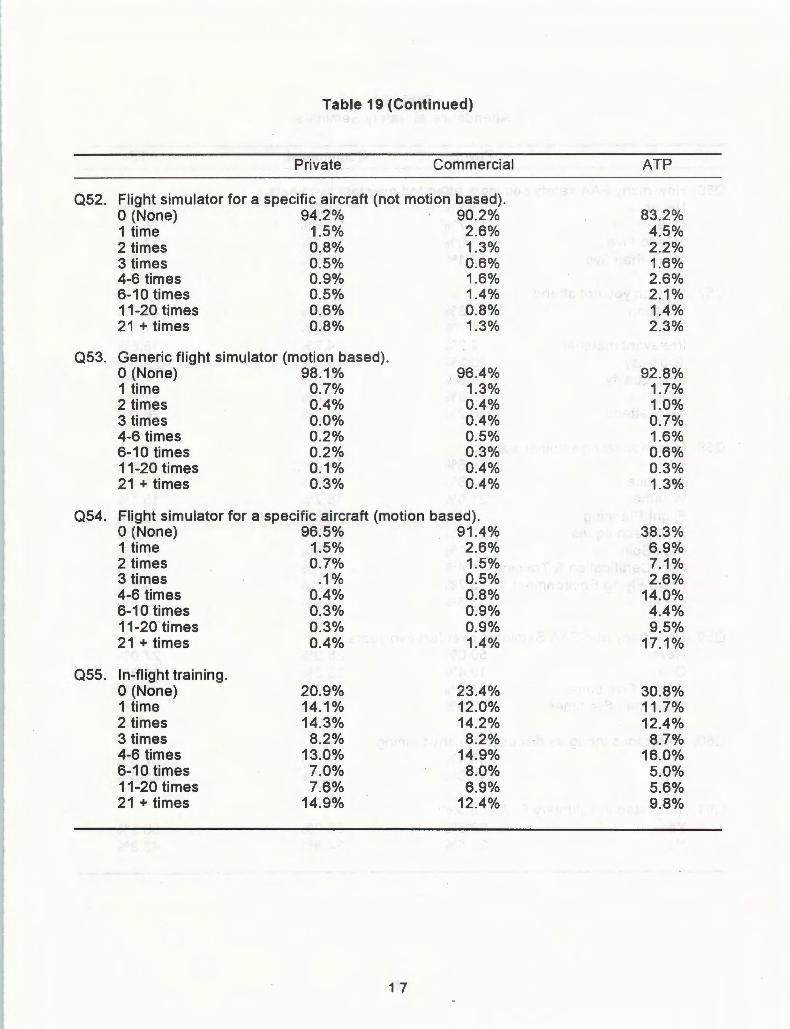
Table 19 (Continued)
Private Commercial
052. Flight simulator for a specific aircraft (not motion based). 0 (None) 94.2% 90.2% 1 time 1.5% 2.6% 2 times 0.8% 1.3% 3 times 0.5% 0.6% 4-6 times 0.9% 1.6% 6-10times 0.5% 1.4% 11-20 times 0.6% 0.8% 21 +times 0.8% 1.3%
053. Generic flight simulator (motion based). 0 (None) 98.1% 1 time 0.7% 2 times 0.4% 3 times 0.0% 4-6 times 0.2% 6-10 times 0.2% 11-20 times 0.1% 21 +times 0.3%
96.4% 1.3% 0.4% 0.4% 0.5% 0.3% 0.4% 0.4%
054. Flight simulator for a specific aircraft (motion based). 0 (None) 96.5% 91.4% 1 time 1.5% 2.6% 2 times 0.7% 1.5% 3times .1% 0.5% 4-6 times 0.4% 0.8% 6-10 times 0.3% 0.9% 11-20 times 0.3% 0.9% 21 +times 0.4% 1.4%
055. In-flight training. 0 (None) 20.9% 23.4% 1 time 14.1% 12.0% 2 times 14.3% 14.2% 3 times 8.2% 8.2% 4-6 times 13.0% 14.9% 6-10 times 7.0% 8.0% 11-20 times 7.6% 6.9% 21 +times 14.9% 12.4%
1 7
ATP
83.2% 4.5% 2.2% 1.6% 2.6% 2.1% 1.4% 2.3%
92.8% 1.7% 1.0% 0.7% 1.6% 0.6% 0.3% 1.3%
38.3% 6.9% 7.1% 2.6%
14.0% 4.4% 9.5%
17.1%
30.8% 11 .7% 12.4% 8.7%
16.0% 5.0% 5.6% 9.8%
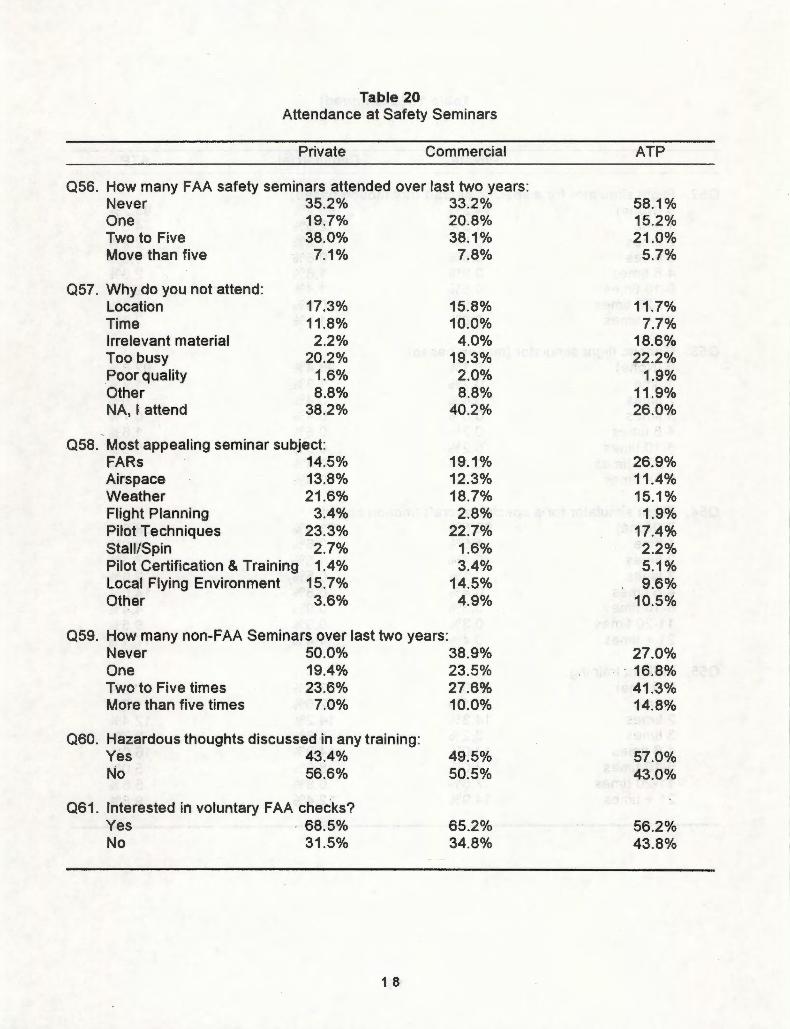
Table 20 Attendance at Safety Seminars
Private Commercial
056. How many FAA safety seminars attended over last two years: Never 35.2% 33.2% One 19.7% 20.8% Two to Five 38.0% 38.1 o/o Move than five 7.1 o/o 7.8%
057. Why do you not attend: Location 17.3% 15.8% Time 11.8% 10.0% Irrelevant material 2.2% 4.0% Too busy 20.2% 19.3% Poor quality 1.6% 2.0% Other 8.8% 8.8% NA, I attend 38.2% 40.2%
'
058. Most appealing seminar subject: FARs 14.5% 19.1% Airspace 13.8% 12.3% Weather 21.6% 18.7% Flight Planning 3.4% 2.8% Pilot Techniques 23.3% 22.7% Stall/Spin 2. 7% 1.6% Pilot Certification & Training 1.4% '3.4% Local Flying Environment 15.7% 14.5% Other 3.6% 4.9%
059. How many non-FAA Seminars over last two years: Never 50.0% 38.9% One 19.4% 23.5% Two to Five times 23.6% 27.6% More than five times 7.0% 10.0%
060. Hazardous thoughts discussed in any training: Yes 43.4% 49.5% No 56.6% 50.5%
061. Interested in voluntary FAA checks? Yes · 68.5% 65.2% No 31.5% 34.8%
1 8
ATP
58.1 o/o 15.2% 21.0%
5. 7%
11 .7% 7.7%
18.6% 22.2%
1.9% 11.9% 26.0%
26.9% 11.4% 15.1%
1. 9% 17.4% 2.2% 5.1 o/o 9.6%
10.5%
27.0% . 16.8%
41.3% 14.8%
57.0% 43.0%
56.2% 43.8%

Table 21 Involvement in Hazardous Events
Private Commercial ATP
062. Number of aircraft accidents 0 90.9% 82.6% 82.4% 1 7.6% 12.6% 12.8% 2 1.2% 3.1% 3.6% 3 0.2% 1.2% 1.0% 4 0.0% 0.3% 0.1% 5 0.1% 0.1% 6+ 0.1% 0.1%
063. Low fuel incidents 0 80.2% 66.0% 63.4% 1 15.9% 23.8% 24.6% 2 3.0% 6.8% 8.4% 3 0.7% 1.6% 1.7% 4 0.1% 0.6% 0.6% 5 0.2% 0.3% 6+ 0.2% 1.0% 1.0%
064. On-Airport Precautionary/forced landings 0 54.1% 40.5% 34.7% 1 23.0% 20.6% 19.0% 2 11 .0% 15.2% 14.5% 3 4.0% 6.8% 9.9% 4 2.0% 4.5% 4.7% 5 1.1% 2.1% 2.5% 6+ 4.7% 10.3% 14.7%
065. Off-airport precaution/forced landings 0 93.4% 82.4% 82.4% 1 4.9% 9.9% 12.1% 2 1.0% 2.8% 1.8% 3 0.1% 1.7% 1.3% 4 0.2% 0.6% 0.3% 5 0.1% 0.4% 0.3% 6+ 0.3% 2.3% 1.8%
066. Inadvertent stalls 0 94.2% 90.2% 90.9% 1 4.5% 6.2% 5.4% 2 0.7% 1.7% 1.8% 3 0.3% 0.4% 0.3% 4 0.0% 0.1% 0.3% 5 0.1% 0.2% 6+ 0.2% 1.1% 1.3%
1 9
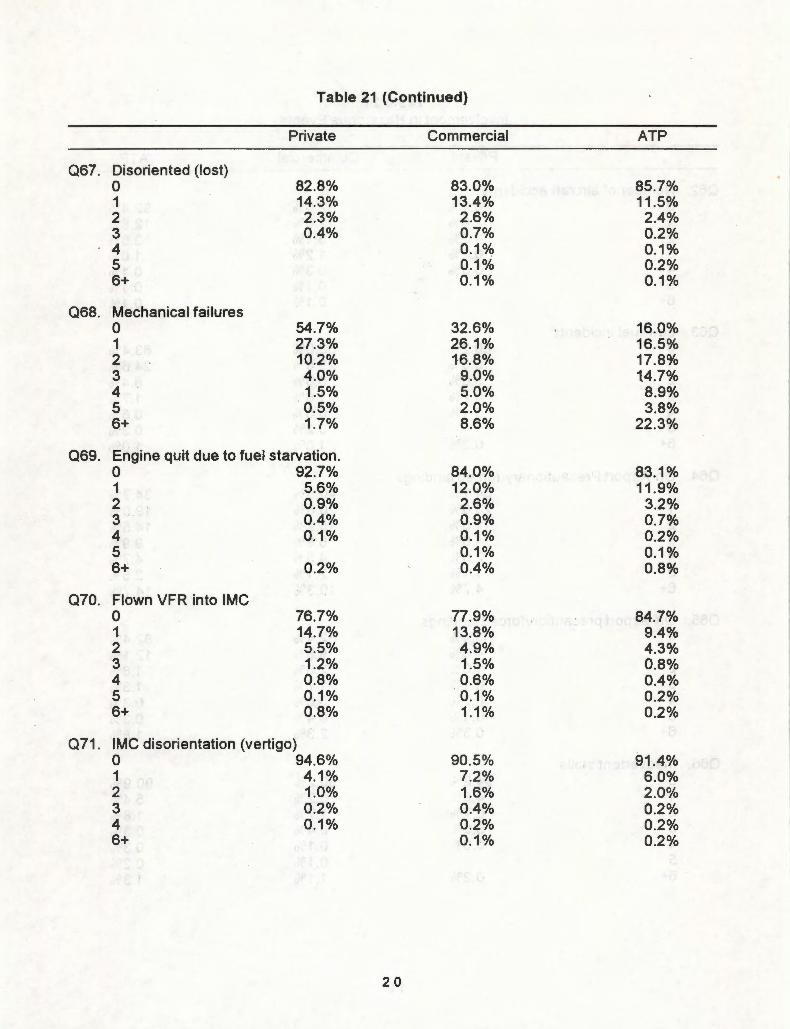
Table 21 (Continued)
Private Commercial ATP
Q67. Disoriented (lost) 0 82.8% 83.0% 85.7% 1 14.3% 13.4% 11.5% 2 2.3% 2.6% 2.4% 3 0.4% 0.7% 0.2% 4 0.1% 0.1% 5 0.1% 0.2% 6+ 0.1% 0.1%
Q68. Mechanical failures 0 54.7% 32.6% 16.0% 1 27.3% 26.1% 16.5% 2 10.2% 16.8% 17.8% 3 . 4.0% 9.0% 14.7% 4 1.5% 5.0% 8.9% 5 0.5% 2.0% 3.8% 6+ 1.7% 8.6% 22.3%
Q69. Engine quit due to fuel starvation. 0 92.7% 84.0% 83.1 o/o 1 5.6% 12.0% 11.9% 2 0.9% 2.6% 3.2% 3 0.4% 0.9% 0.7% 4 0.1% 0.1% 0.2% 5 0.1% 0.1% 6+ 0.2% 0.4% 0.8%
Q70. Flown VFR into IMC 0 76.7% 77.9% 84.7% 1 14.7% 13.8% 9.4% 2 5.5% 4.9% 4.3% 3 1.2% 1.5% 0.8% 4 0.8% 0.6% 0.4% 5 0.1% 0.1% 0.2% 6+ 0.8% 1.1% 0.2%
Q71. IMC disorientation (vertigo) 0 94.6% 90.5% 91.4% 1 4.1% 7.2% 6.0% 2 1.0% 1.6% 2.0% 3 0.2% 0.4% 0.2% 4 0.1% 0.2% 0.2% 6+ 0.1% 0.2%
20
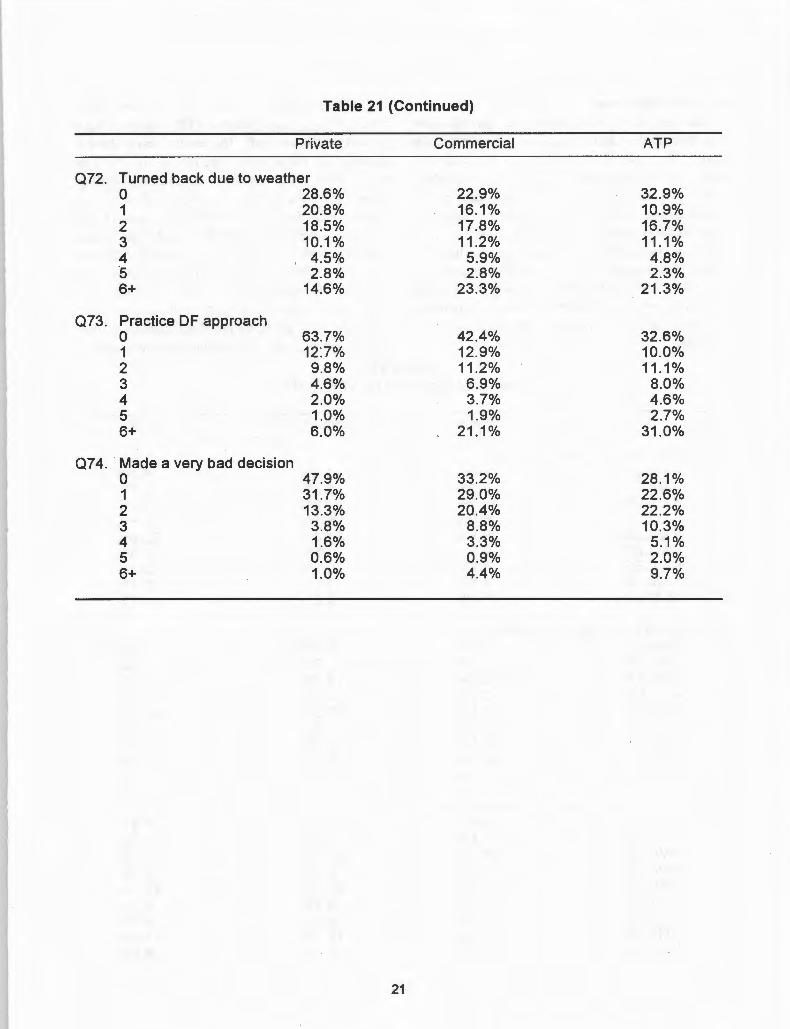
Table 21 (Continued)
Private Commercial ATP
072. Turned back due to weather 0 28.6% 22.9% 32 .9% 1 20.8% 16.1% 10.9% 2 18.5% 17.8% 16.7% 3 10.1% 11.2% 11.1% 4 4.5% 5.9% 4.8% .5 2.8% 2.8% 2.3% 6+ 14.6% 23.3% 21 .3%
073. Practice DF approach 0 63.7% 42.4% 32.6% 1 127% 12.9% 10.0% 2 9.8% 11 .2% 11 .1% 3 4.6% 6.9% 8.0% 4 2.0% 3.7% 4.6% 5 1.0% 1.9% 2.7% 6+ 6.0% 21.1% 31.0%
074. Made a very bad decision 0 47.9% 33.2% 28.1% 1 31 .7% 29.0% 22.6% 2 13.3% 20.4% 22.2% 3 3.8% 8.8% 10.3% 4 1.6% 3.3% 5.1% 5 0.6% 0.9% 2.0% 6+ 1.0% 4.4% 9.7%
21
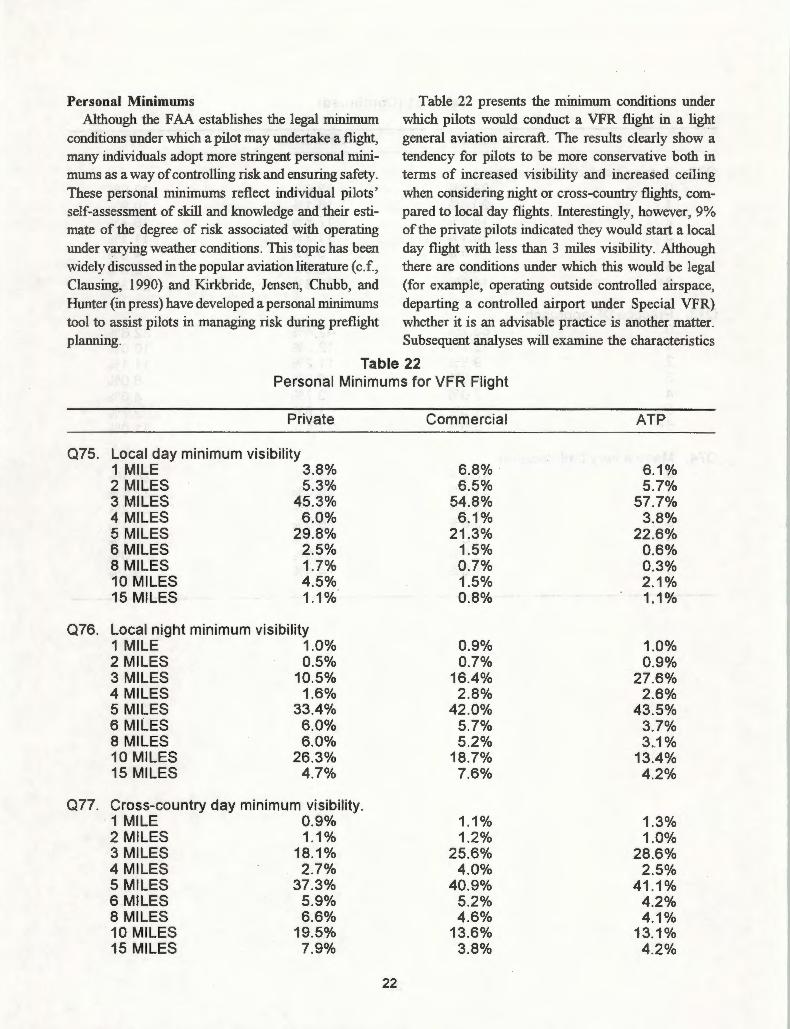
Personal Minimums Although the FAA establishes the legal minimum
conditions under which a pilot may undertake a flight, many individuals adopt more stringent personal minimums as a way of controlling risk and ensuring safety. These personal minimums reflect individual pilots' self-assessment of skill and knowledge and their estimate of the degree of risk associated with operating under varying weather conditions. This topic has been widely discussed in the popular aviation literature ( c.f. , Clausing, 1990) and Kirkbride, Jensen, Chubb, and Hunter (in press) have developed a personal minimums tool to assist pilots in managing risk during preflight planning.
Table 22 presents the minimum conditions under which pilots would conduct a VFR flight in a light general aviation aircraft. The results clearly show a tendency for pilots to be more conservative both in terms of increased visibility and increased ceiling when considering night or cross-country flights, compared to local day flights. Interestingly, however, 9% of the private pilots indicated they would start a local day flight with less than 3 miles visibility. Although there are conditions under which this would be legal (for example, operating outside controlled airspace, departing a controlled airport under Special VFR) whether it is an advisable practice is another matter. Subsequent analyses will examine the characteristics
Table 22 Personal Minimums for VFR Flight
Private Commercial ATP
075. Local day minimum visibility 1 MILE 3.8% 6.8% 6.1% 2 MILES 5.3% 6.5% 5.7% 3 MILES 45.3% 54.8% 57.7% 4 MILES 6.0% 6.1% 3.8% 5 MILES 29.8% 21.3% 22.6% 6 MILES 2.5% 1.5% 0.6% 8 MILES 1.7% 0.7% 0.3% 10 MILES 4.5% 1.5% 2.1% 15 MILES 1.1% 0.8% 1.1%
076. Local night minimum visibility 1 MILE 1.0% 0.9% 1.0% 2 MILES 0.5% 0.7% 0.9% 3 MILES 10.5% 16.4% 27.6% 4 MILES 1.6% 2.8% 2.6% 5 MILES 33.4% 42.0% 43.5% 6 MILES 6.0% 5.7% 3.7% 8 MILES 6.0% 5.2% 3 .. 1% 10 MILES 26.3% 18.7% 13.4% 15 MILES 4.7% 7.6% 4.2%
077. Cross-country day minimum visibility. 1 MILE 0.9% 1.1% 1.3% 2 MILES 1.1% 1.2% 1.0% 3 MILES 18.1% 25.6% 28.6% 4 MILES 2.7% 4.0% 2.5% 5 MILES 37.3% 40.9% 41 .1% 6 MILES 5.9% 5.2% 4.2% 8 MILES 6.6% 4.6% 4.1% 10 MILES 19.5% 13.6% 13.1% 15 MILES 7.9% 3.8% 4.2%
22
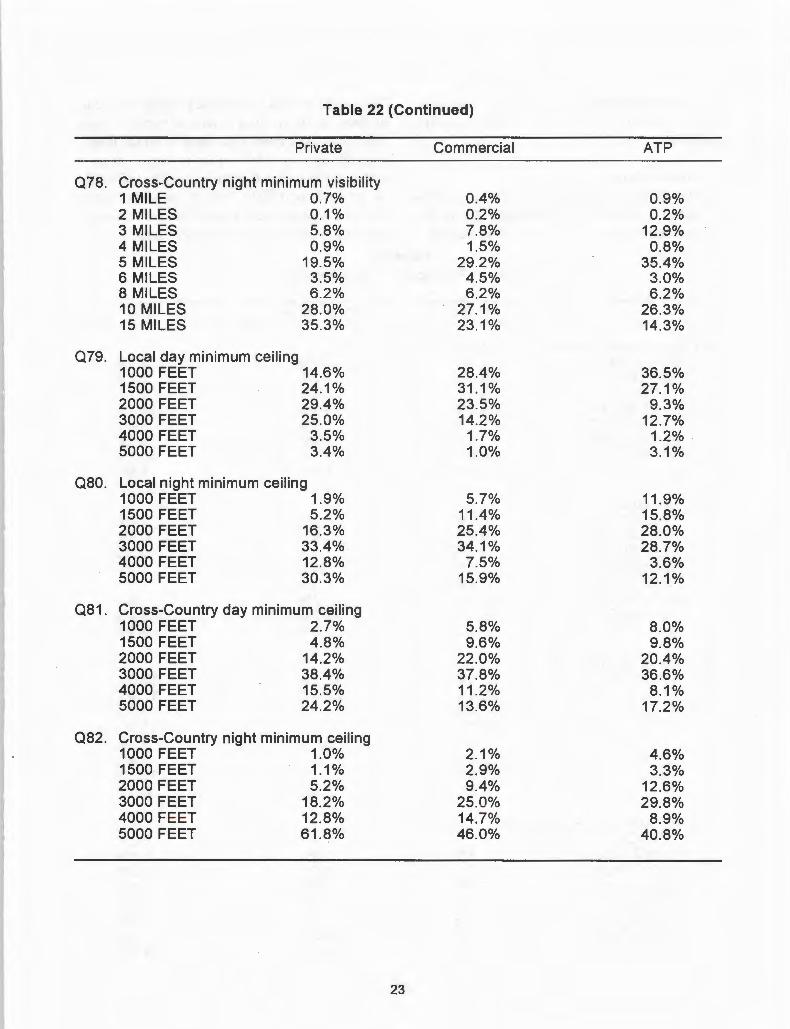
Table 22 (Continued)
Private Commercial ATP
078. Cross-Country night minimum visibility 1 MILE 0.7% 0.4% 0.9% 2 MILES 0.1% 0.2% 0.2% 3 MILES 5.8% 7.8% 12.9% 4 MILES 0.9% 1.5% 0.8% 5 MILES 19.5% 29.2% 35.4% 6 MILES 3.5% 4.5% 3.0% 8 MILES 6.2% 6.2% 6.2% 10 MILES 28.0% 27.1% 26.3% 15 MILES 35.3% 23.1% 14.3%
079. Local day minimum ceiling 1000 FEET 14.6% 28.4% 36.5% 1500 FEET 24.1% 31.1% 27.1% 2000 FEET 29.4% 23.5% 9.3% 3000 FEET 25.0% 14.2% 12.7% 4000 FEET 3.5% 1.7% 1.2% 5000 FEET 3.4% 1.0% 3.1%
080. Local night minimum ceiling 1000 FEET 1.9% 5.7% 11.9% 1500 FEET 5.2% 11.4% 15.8% 2000 FEET 16.3% 25.4% 28.0% 3000 FEET 33.4% 34.1% 28.7% 4000 FEET 12.8% 7.5% 3.6% 5000 FEET 30.3% 15.9% 12.1%
081. Cross-Country day minimum ceiling 1000 FEET 2.7% 5.8% 8.0% 1500 FEET 4.8% 9.6% 9.8% 2000 FEET 14.2% 22.0% 20.4% 3000 FEET 38.4% 37.8% 36.6% 4000 FEET 15.5% 11 .2% 8.1% 5000 FEET 24.2% 13.6% 17.2%
082. Cross-Country night minimum ceiling 1000 FEET 1.0% 2.1% 4.6% 1500 FEET 1.1% 2.9% 3.3% 2000 FEET 5.2% 9.4% 12.6% 3000 FEET 18.2% 25.0% 29.8% 4000 FEET 12.8% 14.7% 8.9% 5000 FEET 61.8% 46.0% 40.8%
23
of those pilots who indicated more conservative minimums compared to those who have less conservative mtmmums.
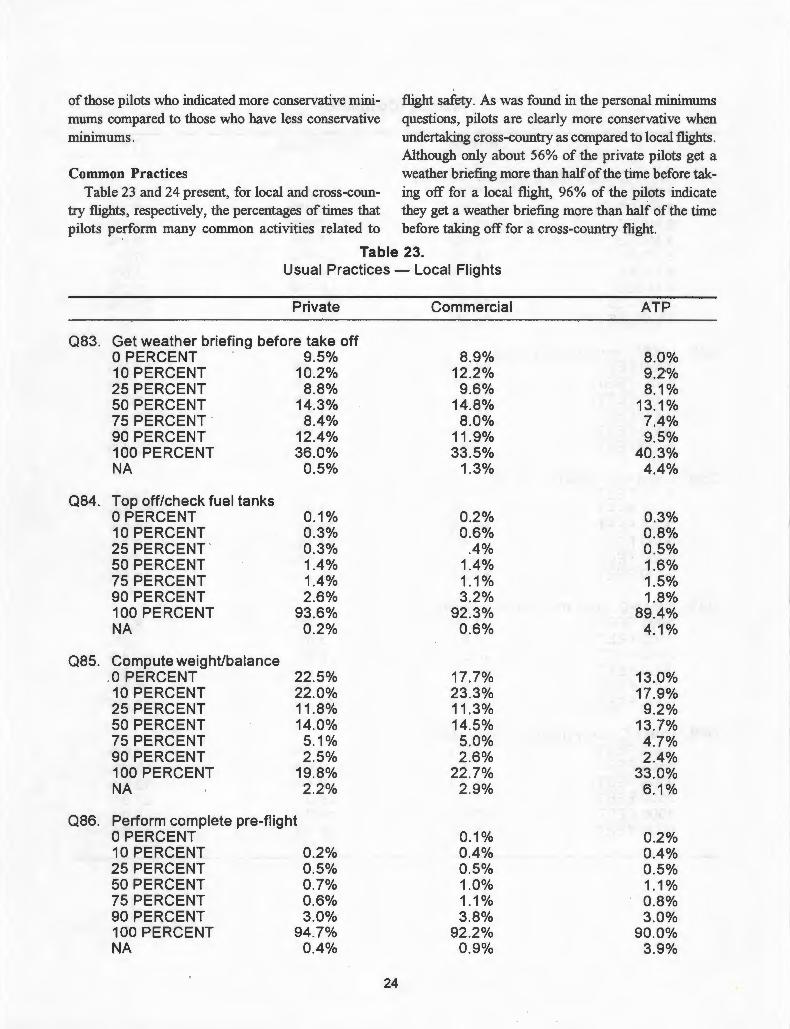
flight safety. As was found in the personal minimums questions, pilots are clearly more conservative when undertaking cross-country as compared to local flights . Although only about 56% of the private pilots get a
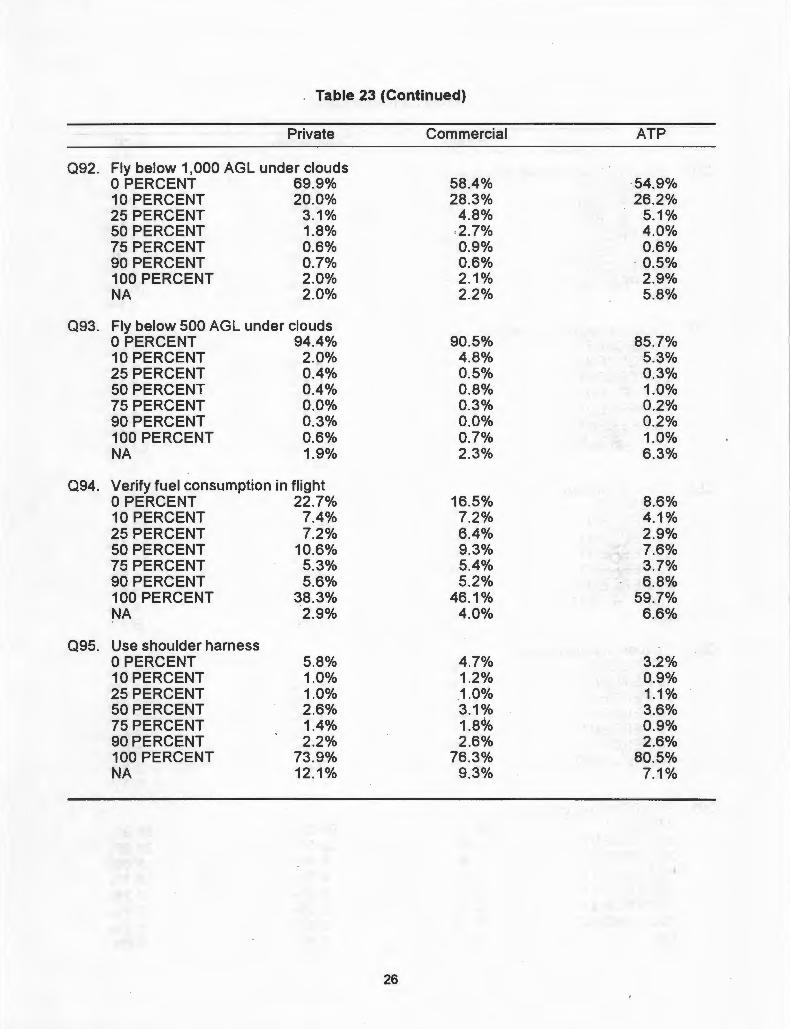
Common Practices weather briefing more than half of the time before talc-Table 23 and 24 present, for local and cross-coun- ing off for a local flight, 96% of the pilots indicate
try flights , respectively, the percentages of times that they get a weather briefing more than half of the time pilots perform many common activities related to before taking off for a cross-country flight.
Table 23. Usual Practices - Local Flights
Private Commercial ATP
Q83. Get weather briefing before take off 0 PERCENT 9.5% 8.9% 8.0% 10 PERCENT 10.2% 12.2% 92% 25 PERCENT 8.8% 9.6% 8.1% 50 PERCENT 14.3% 14.8% 13.1% 75 PERCENT 8.4% 8.0% 7.4% 90 PERCENT 12.4% 11.9% 9.5% 100 PERCENT 36.0% 33.5% 40.3% NA 0.5% 1.3% 4.4%
Q84. Top off/check fuel tanks 0 PERCENT 0.1% 0.2% 0.3% 10 PERCENT 0.3% 0.6% 0.8% 25 PERCENT 0.3% .4% 0.5% 50 PERCENT 1.4% 1.4% 1.6% 75 PERCENT 1.4% 1.1% 1.5% 90 PERCENT 2.6% 3.2% 1.8% 100 PERCENT 93.6% 92.3% 89.4% NA 0.2% 0.6% 4.1%
Q85. Compute weight/balance 0 PERCENT 22.5% 17.7% 13.0% 10 PERCENT 22.0% 23.3% 17.9% 25 PERCENT 11 .8% 11 .3% 9.2% 50 PERCENT 14.0% 14.5% 13.7% 75 PERCENT 5.1% 5.0% 4.7% 90 PERCENT 2.5% 2.6% 2.4% 100 PERCENT 19.8% 22.7% 33.0% NA 2.2% 2.9% 6.1%
Q86. Perform complete pre-flight 0 PERCENT 0.1% 0.2% 10 PERCENT 0.2% 0.4% 0.4% 25 PERCENT 0.5% 0.5% 0.5% 50 PERCENT 0.7% 1.0% 1.1% 75 PERCENT 0.6% 1.1% 0.8% 90 PERCENT 3.0% 3.8% 3.0% 100 PERCENT 94.7% 92.2% 90.0% NA 0.4% 0.9% 3.9%
24
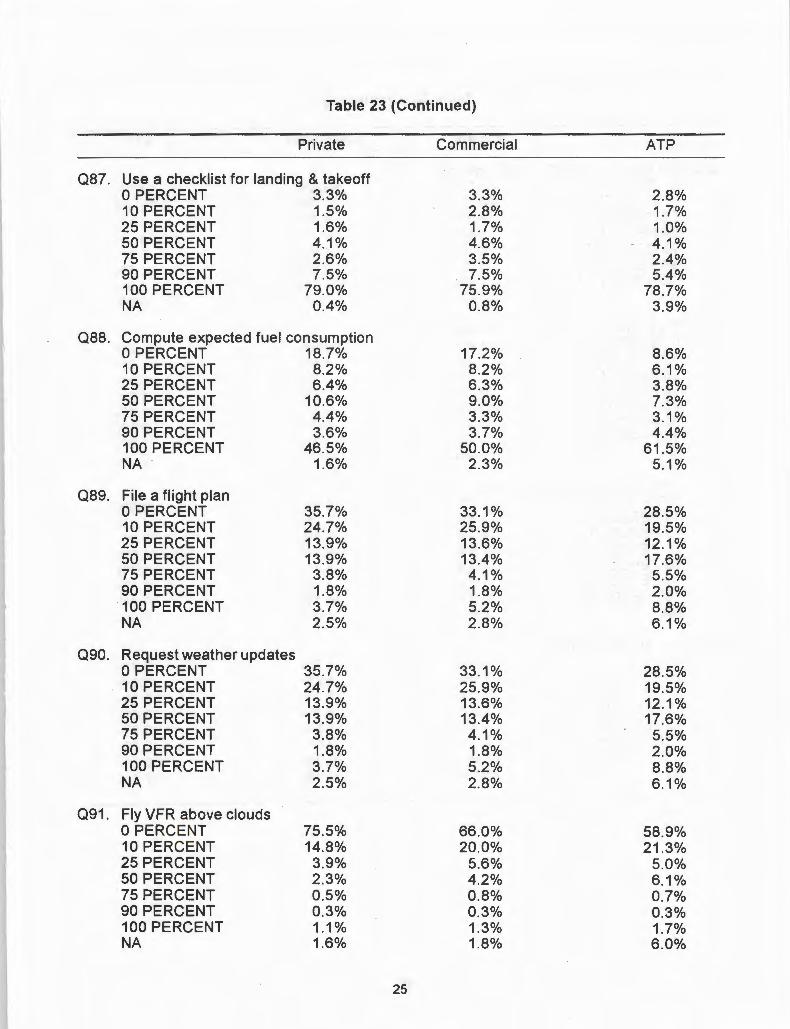
Table 23 (Continued)
Private Commercial ATP
087. Use a checklist for landing & takeoff 0 PERCENT 3.3% 3.3% 2.8% 10 PERCENT 1.5% 2.8% 1.7% 25 PERCENT 1.6% 1.7% 1.0% 50 PERCENT 4 .. 1% 4.6% 4.1% 75 PERCENT 2.6% 3.5% 2.4% 90 PERCENT 7.5% 7.5% 5.4% 100 PERCENT 79.0% 75.9% 78.7% NA 0.4% 0.8% 3.9%
088. Compute expected fuel consumption 0 PERCENT 18.7% 17.2% 8.6% 10 PERCENT 8.2% 8.2% 6.1% 25 PERCENT 6.4% 6.3% 3.8% 50 PERCENT 10.6% 9.0% 7.3% 75 PERCENT 4.4% 3.3% 3.1% 90 PERCENT 3.6% 3.7% 4.4% 100 PERCENT 46.5% 50.0% 61 .5% NA 1.6% 2.3% 5.1%
089. File a flight plan 0 PERCENT 35.7% 33.1% 28.5% 10 PERCENT 24.7% 25.9% 19.5% 25 PERCENT 13.9% 13.6% 12.1% 50 PERCENT 13.9% 13.4% 17.6% 75 PERCENT 3.8% 4.1% 5.5% 90 PERCENT 1.8% 1.8% 2.0% 100 PERCENT 3.7% 5.2% 8.8% NA 2.5% 2.8% 6.1%
090. Request weather updates 0 PERCENT 35.7% 33.1% 28.5% 10.PERCENT 24.7% 25.9% 19.5% 25 PERCENT 13.9% 13.6% 12.1% 50 PERCENT 13.9% 13.4% 17.6% 75 PERCENT 3.8% 4.1% 5.5% 90 PERCENT 1.8% 1.8% 2.0% 100 PERCENT 3.7% 5.2% 8.8% NA 2.5% 2.8% 6.1%
091. Fly VFR above clouds 0 PERCENT 75.5% 66.0% 58.9% 10 PERCENT 14.8% 20.0% 21.3% 25 PERCENT 3.9% 5.6% 5.0% 50 PERCENT 2.3% 4.2% 6.1% 75 PERCENT 0.5% 0.8% 0.7% 90 PERCENT 0.3% 0.3% 0.3% 100 PERCENT 1.1% 1.3% 1.7% NA 1.6% 1.8% 6.0%
25
. Table 23 (Continued)
Private Commercial ATP
092. Fly below 1,000 AGL under clouds 0 PERCENT 69.9% 58.4% 54.9% 10 PERCENT 20.0% 28.3% 26.2% 25 PERCENT 3.1 o/o 4.8% 5.1 o/o 50 PERCENT 1.8% ·2.7% 4.0% 75 PERCENT 0.6% 0.9% 0.6% 90 PERCENT 0. 7% 0.6% . 0.5% 100 PERCENT 2.0% 2.1 o/o 2.9% NA 2.0% 2.2% 5.8%
093. Fly below 500 AGL under clouds 0 PERCENT 94.4% 90.5% 85.7% 10 PERCENT 2.0% 4.8% 5.3% 25 PERCENT 0.4% 0.5% 0.3% 50 PERCENT 0.4% 0.8% 1.0% 75 PERCENT 0.0% 0.3% 0.2% 90 PERCENT 0.3% 0.0% 0.2% 100 PERCENT 0.6% 0. 7% 1.0% NA 1. 9% 2.3% 6.3%
094. Verify fuel consumption in flight 0 PERCENT 22.7% 16.5% 8.6% 10 PERCENT 7.4% 7.2% 4.1% 25 PERCENT 7.2% 6.4% 2.9% 50 PERCENT 10.6% 9.3% 7.6% 75 PERCENT 5.3% 5.4% 3. 7% 90 PERCENT 5.6% 5.2% 6.8% 100 PERCENT 38.3% 46.1% 59.7% NA 2.9% 4.0% 6.6%
095. Use shoulder harness 0 PERCENT 5.8% 4.7% 3.2% 10 PERCENT 1.0% 1.2% 0.9% 25 PERCENT 1.0% 1.0% 1.1% 50 PERCENT 2.6% 3.1 o/o 3.6% 75 PERCENT 1.4% 1.8d/o 0.9% 90 PERCENT 2.2% 2.6% 2.6% 100 PERCENT 73.9% 76.3% 80.5% NA 12.1% 9.3% 7.1%
26
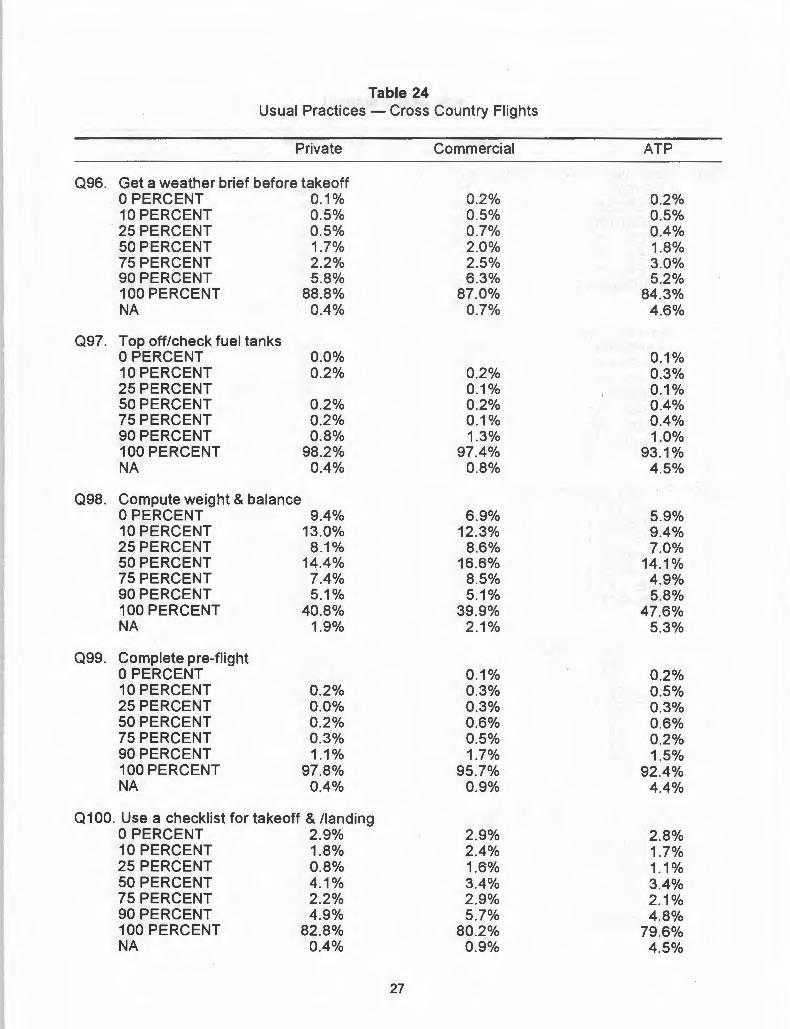
Table 24 Usual Practices -Cross Country Flights
Private Commercial ATP
096. Get a weather brief before takeoff 0 PERCENT 0.1% 0.2% 0.2% 10 PERCENT 0.5% 0.5% 0.5%
. 25 PERCENT 0.5% 0.7% 0.4% 50 PERCENT 1.7% 2.0% 1.8% 75 PERCENT 2.2% 2.5% 3.0% 90 PERCENT 5.8% 6.3% 5.2% 100 PERCENT 88.8% 87.0% 84.3% NA 0.4% 0.7% 4.6%
097. Top off/check fuel tanks 0 PERCENT 0.0% 0.1% 10 PERCENT 0.2% 0.2% 0.3% 25 PERCENT 0.1% 0.1% 50 PERCENT 0.2% 0.2% 0.4% 75 PERCENT 0.2% 0.1% 0.4% 90 PERCENT 0.8% 1.3% 1.0% 100 PERCENT 98.2% 97.4% 93.1% NA 0.4% 0.8% 4.5%
098. Compute weight & balance 0 PERCENT 9.4% 6.9% 5.9% 10 PERCENT 13.0% 12.3% 9.4% 25 PERCENT 8.1% 8.6% 7.0% 50 PERCENT 14.4% 16.6% 14.1% 75 PERCENT 7.4% 8.5% 4.9% 90 PERCENT 5.1% 5.1% 5.8% 100 PERCENT 40.8% 39.9% 47.6% NA 1.9% 2.1% 5.3%
099. Complete pre-flight 0 PERCENT 0.1% 0.2% 10 PERCENT 0.2% 0.3% 0.5% 25 PERCENT 0.0% 0.3% 0.3% 50 PERCENT 0.2% 0.6% 0.6% 75 PERCENT 0.3% 0.5% 0.2% 90 PERCENT 1.1% 1.7% 1.5% 100 PERCENT 97.8% 95.7% 92.4% NA 0.4% 0.9% 4.4%
0100. Use a checklist for takeoff & /landing 0 PERCENT 2.9% 2.9% 2.8% 10 PERCENT 1.8% 2.4% 1.7% 25 PERCENT 0.8% 1.6% 1.1% 50 PERCENT 4.1% 3.4% 3.4% 75 PERCENT 2.2% 2.9% 2.1% 90 PERCENT 4.9% 5.7% 4.8% 100 PERCENT 82.8% 80.2% 79.6% NA 0.4% 0.9% 4.5%
27
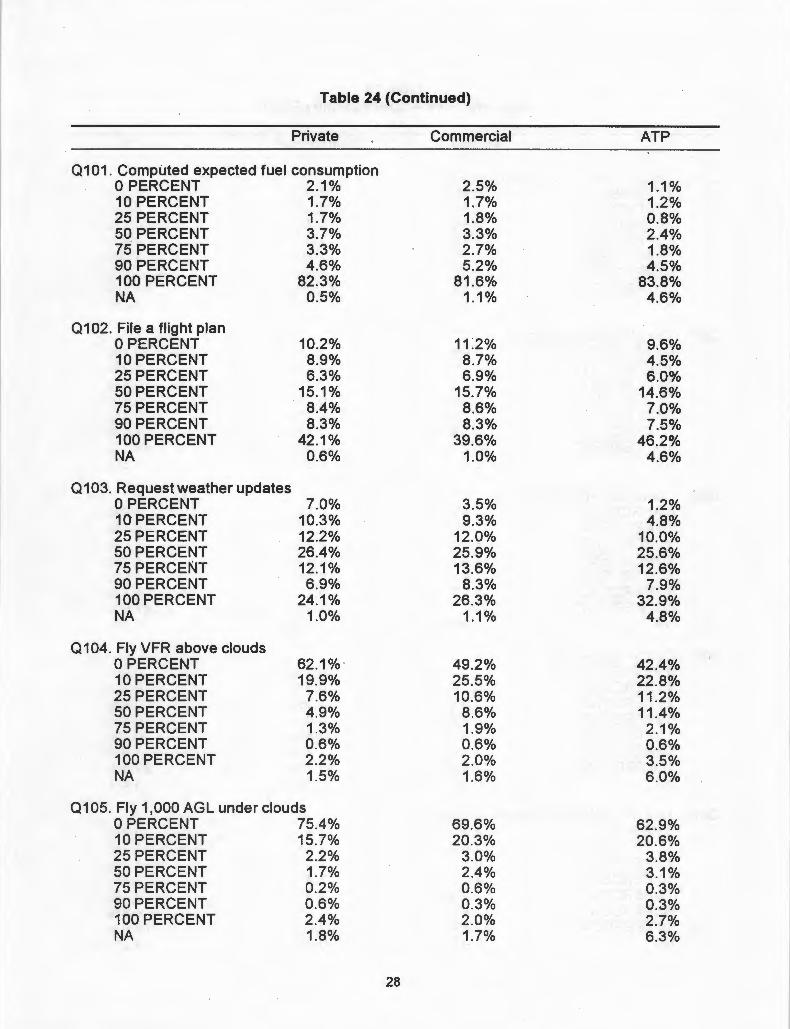
Table 24 (Continued)
Private Commercial ATP
0101. Computed expected fuel consumption 0 PERCENT 2.1% 2.5% 1.1% 10 PERCENT 1.7% 1.7% 1.2% 25 PERCENT 1.7% 1.8% 0.8% 50 PERCENT 3.7% 3.3% 2.4% 75 PERCENT 3.3% 2.7% 1.8% 90 PERCENT 4.6% 5.2% 4.5% 100 PERCENT 82.3% 81.6% 83.8% NA 0.5% 1.1% 4.6%
0102. Fire a flight plan 0 PERCENT 10.2% 11 .2% 9.6% 10 PERCENT 8.9% 8.7% 4.5% 25 PERCENT 6.3% 6.9% 6.0% 50 PERCENT 15.1% 15.7% 14.6% 75 PERCENT 8.4% 8.6% 7.0% 90 PERCENT 8.3% 8.3% 7.5% 100 PERCENT 42.1% 39.6% 46.2% NA 0.6% 1.0% 4.6%
0103. Request weather updates 0 PERCENT 7.0% 3.5% 1.2% 10 PERCENT 10.3% 9.3% 4.8% 25 PERCENT 12.2% 12.0% 10.0% 50 PERCENT 26.4% 25.9% 25.6% 75 PERCENT 12.1% 13.6% 12.6% 90 PERCENT 6.9% 8.3% 7.9% 100 PERCENT 24.1% 26.3% 32.9% NA 1.0% 1.1% 4.8%
0104. Fly VFR above clouds 0 PERCENT 62.1% · 49.2% 42.4% 10 PERCENT 19.9% 25.5% 22.8% 25 PERCENT 7.6% 10.6% 11.2% 50 PERCENT 4.9% 8.6% 11.4% 75 PERCENT 1.3% 1.9% 2.1% 90 PERCENT 0.6% 0.6% 0.6% 100 PERCENT 2.2% 2.0% 3.5% NA 1.5% 1.6% 6.0%
0105. Fly 1,000 AGL under clouds 0 PERCENT 75.4% 69.6% 62.9% 10 PERCENT 15.7% 20.3% 20.6% 25 PERCENT 2.2% 3.0% 3.8% 50 PERCENT 1.7% 2.4% 3.1% 75 PERCENT 0.2% 0.6% 0.3% 90 PERCENT 0.6% 0.3% 0.3% 100 PERCENT 2.4% 2.0% 2.7% NA 1.8% 1.7% 6.3%
28
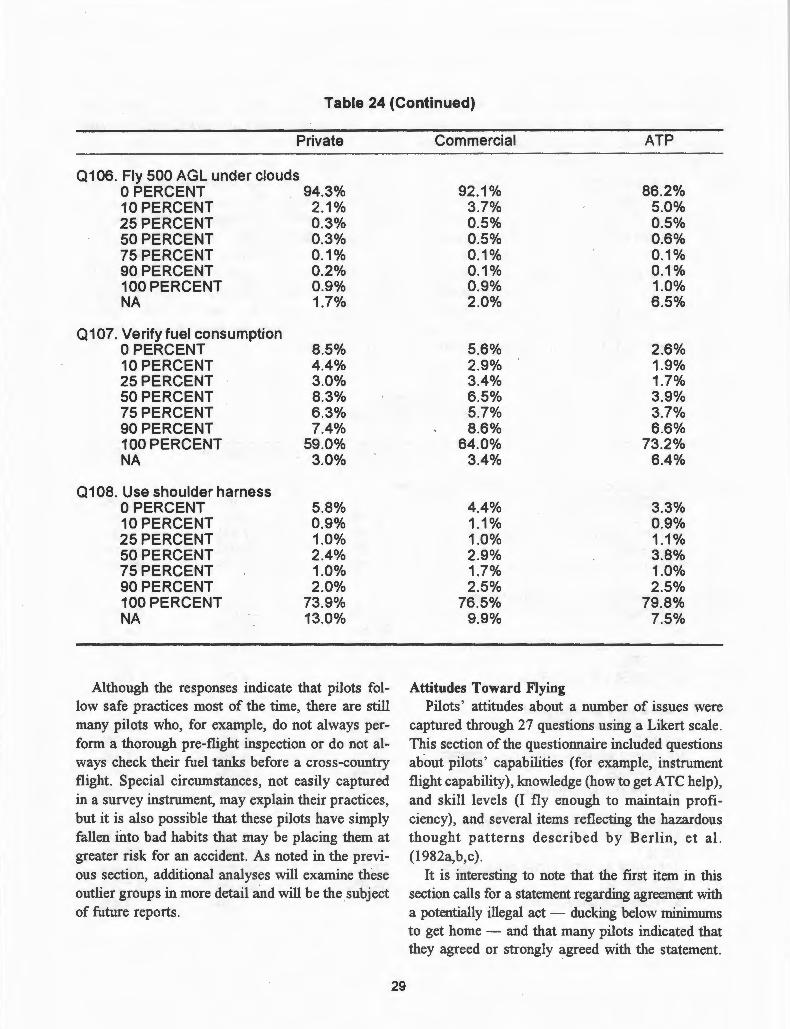
Table 24 (Continued}
Private
0106. Fly 500 AGL under clouds 0 PERCENT 94.3% 10 PERCENT 2.1% 25 PERCENT 0.3% 50 PERCENT 0.3% 75 PERCENT 0.1% 90 PERCENT 0.2% 100 PERCENT 0.9% NA 1.7%
0107. Verify fuel consumption 0 PERCENT 8.5% 10 PERCENT 4.4% 25 PERCENT 3.0% 50 PERCENT 8.3% 75 PERCENT 6.3% 90 PERCENT 7.4% 100 PERCENT 59.0% NA 3.0%
0108. Use shoulder harness 0 PERCENT 5.8% 10 PERCENT 0.9% 25 PERCENT 1.0% 50 PERCENT 2.4% 75 PERCENT 1.0% 90 PERCENT 2.0% 100 PERCENT 73.9% NA 13.0%
Although the responses indicate that pilots follow safe practices most of the time, there are still many pilots who, for example, do not always perform a thorough pre-flight inspection or do notalways check their fuel tanks before a cross-country flight . Special circumstances, not easily captured in a survey instrument, may explain their practices, but it is also possible that these pilots have simply fallen into bad habits that may be placing them at greater risk for an accident. As noted in the previous section, additional analyses will examine these outlier groups in more detail and will be the . subject of future reports .
29
Commercial ATP
92.1% 86.2% 3.7% 5.0% 0.5% 0.5% 0.5% 0.6% 0.1% 0.1% 0.1% 0.1% 0.9% 1.0% 2.0% 6.5%
5.6% 2.6% 2.9% 1.9% 3.4% 1.7% 6.5% 3.9% 5.7% 3.7% 8.6% 6.6%
64.0% 73.2% 3.4% 6.4%
4.4% 3.3% 1.1% 0.9% 1.0% 1.1% 2.9% 3.8% 1.7% 1.0% 2.5% 2.5%
76.5% 79.8% 9.9% 7.5%
Attitudes Toward Flying Pilots ' attitudes about a number of issues were
captured through 27 questions using a Likert scale. This section of the questionnaire included questions about pilots ' capabilities (for example, instrument flight capability), knowledge (how to get A TC help), and skill levels (I fly enough to maintain proficiency), and several items reflecting the hazardous thought patterns described by Berlin, et al. (1982a,b,c) .
It is interesting to note that the first item in this section calls for a statement regarding agreement with a potentially illegal act - ducking below minimums to get home - and that many pilots indicated that they agreed or strongly agreed with the statement.
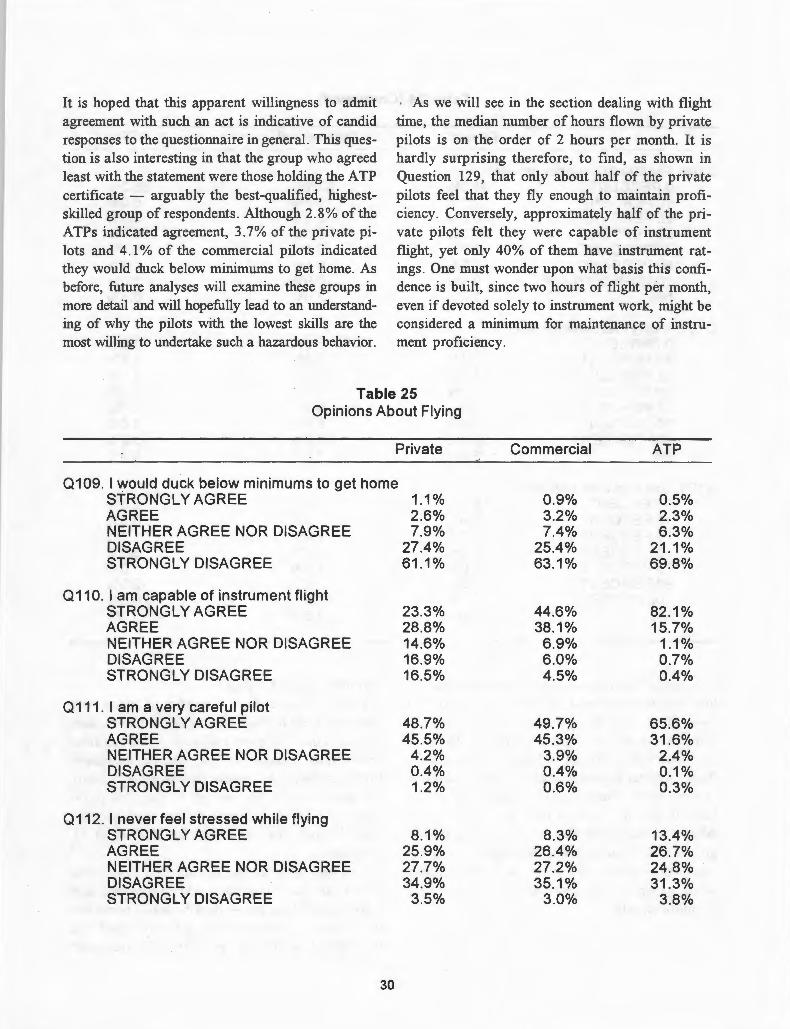
It is hoped that this apparent willingness to admit agreement with such an act is indicative of candid responses to the questionnaire in general. This question is also interesting in that the group who agreed least with the statement were those holding the A TP certificate - arguably the best-qualified, highestskilled group of respondents. Although 2.8% of the ATPs indicated agreement, 3 .7% of the private pilots and 4.1% of the commercial pilots indicated they would duck below minimums to get home. As before, future analyses will examine these groups in more detail and will hopefully lead to an understanding of why the pilots with the lowest skills are the most willing to undertake such a hazardous behavior.
· As we will see in the section dealing with flight time, the median number of hours flown by private pilots is on the order of 2 hours per month. It is hardly surprising therefore, to find, as shown in Question 129, that only about half of the private pilots feel that they fly enough to maintain proficiency. Conversely, approximately half of the private pilots felt they were capable of instrument flight, yet only 40% of them have instrument ratings . One must wonder upon what basis this confidence is built, since two hours of flight per month, even if devoted solely to instrument work, might be considered a minimum for maintenance of instrument proficiency.
Table 25 Opinions About Flying
Private Commercial ATP
Q109. I would duck below minimums to get home STRONGLY AGREE 1.1% 0.9% 0.5% AGREE 2.6% 3.2% 2.3% NEITHER AGREE NOR DISAGREE 7.9% 7.4% 6.3% DISAGREE 27.4% 25.4% 21.1% STRONGLY DISAGREE 61.1% 63.1% 69.8%
Q110. I am capable of instrument flight STRONGLY AGREE 23.3% 44.6% 82.1% AGREE 28.8% 38.1% 15.7% NEITHER AGREE NOR DISAGREE 14.6% 6.9% 1.1% DISAGREE 16.9% 6.0% 0.7% STRONGLY DISAGREE 16.5% 4.5% 0.4%
Q111. I am a very careful pilot STRONGLY AGREE 48.7% 49.7% 65.6% AGREE 45.5% 45.3% 31.6% NEITHER AGREE NOR DISAGREE 4.2% 3.9% 2.4% DISAGREE 0.4% 0.4% 0.1% STRONGLY DISAGREE 1.2% 0.6% 0.3%
Q112. I never feel stressed while flying STRONGLY AGREE 8.1% 8.3% 13.4% AGREE 25.9% 26.4% 26.7% NEITHER AGREE NOR DISAGREE 27.7% 27.2% 24.8% DISAGREE 34.9% 35.1% 31.3% STRONGLY DISAGREE 3.5% 3.0% 3.8%
30
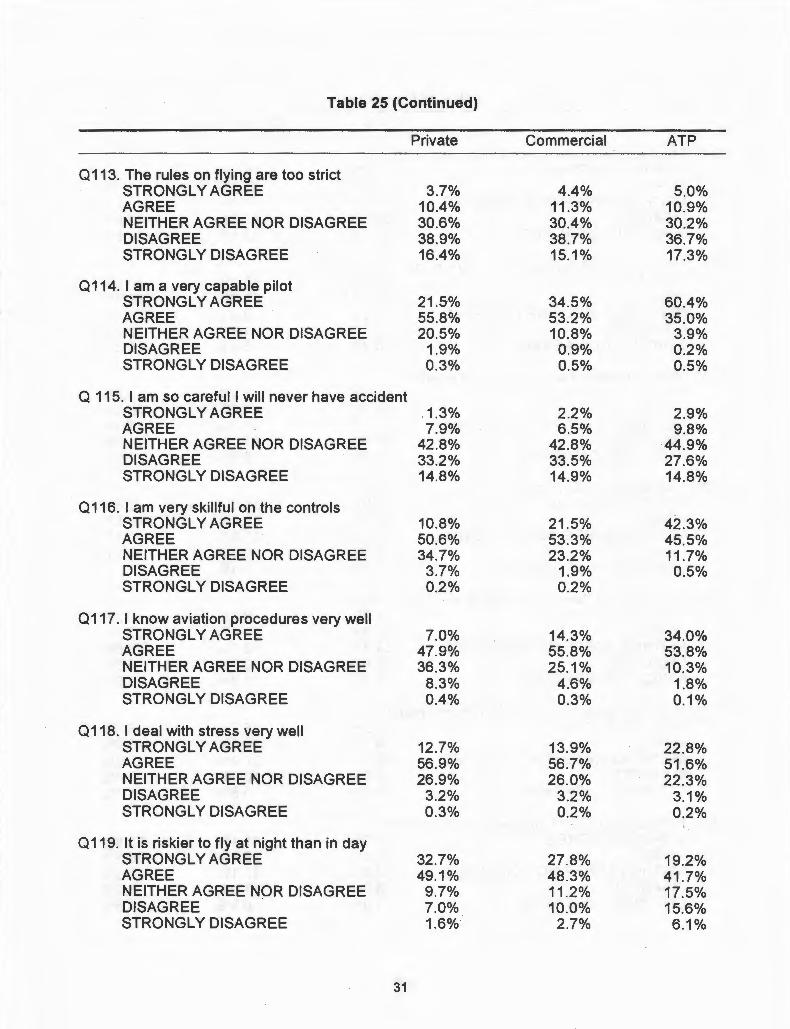
Table 25 (Continued)
Private Commercial ATP
a 113. The rules on flying are too strict STRONGLY AGREE 3.7% 4.4% 5.0% AGREE 10.4% 11 .3% 10.9% NEITHER AGREE NOR DISAGREE 30.6% 30.4% 30.2% DISAGREE 38.9% 38.7% 36.7% STRONGLY DISAGREE 16.4% 15.1% 17.3%
a114. I am a very capable pilot STRONGLY AGREE 21.5% 34.5% 60.4% AGREE 55.8% 53.2% 35.0% NEITHER AGREE NOR DISAGREE 20.5% 10.8% 3.9% DISAGREE 1.9% 0.9% 0.2% STRONGLY DISAGREE 0.3% 0.5% 0.5%
a 115. I am so careful I will never have accident STRONGLY AGREE .1.3% 2.2% 2.9% AGREE 7.9% 6.5% 9.8% NEITHER AGREE NOR DISAGREE 42.8% 42.8% 44.9% DISAGREE 33.2% 33.5% 27.6% STRONGLY DISAGREE 14.8% 14.9% 14.8%
a116. I am very skillful on the controls STRONGLY AGREE 10.8% 21.5% 42.3% AGREE 50.6% 53.3% 45.5% NEITHER AGREE NOR DISAGREE 34.7% 23.2% 11 .7% DISAGREE 3.7% 1.9% 0.5% STRONGLY DISAGREE 0.2% 0.2%
a117. I know aviation procedures very well STRONGLY AGREE 7.0% 14.3% 34.0% AGREE 47.9% 55.8% 53.8% NEITHER AGREE NOR DISAGREE 36.3% 25.1% 10.3% DISAGREE 8.3% 4.6% 1.8% STRONGLY DISAGREE 0.4% 0.3% 0.1%
a118. I deal with stress very well STRONGLY AGREE 12.7% 13.9% 22.8% AGREE 56.9% 56.7% 51.6% NEITHER AGREE NOR DISAGREE 26.9% 26.0% 22.3% DISAGREE 3.2% 3.2% 3.1% STRONGLY DISAGREE 0.3% 0.2% 0.2%
a119. It is riskier to fly at night than in day STRONGLY AGREE 32.7% 27.8% 19.2% AGREE 49.1% 48.3% 41.7% NEITHER AGREE N.OR DISAGREE 9.7% 11 .2% 17.5% DISAGREE 7.0% 10.0% 15.6% STRONGLY DISAGREE 1.6% 2.7% 6.1%
31
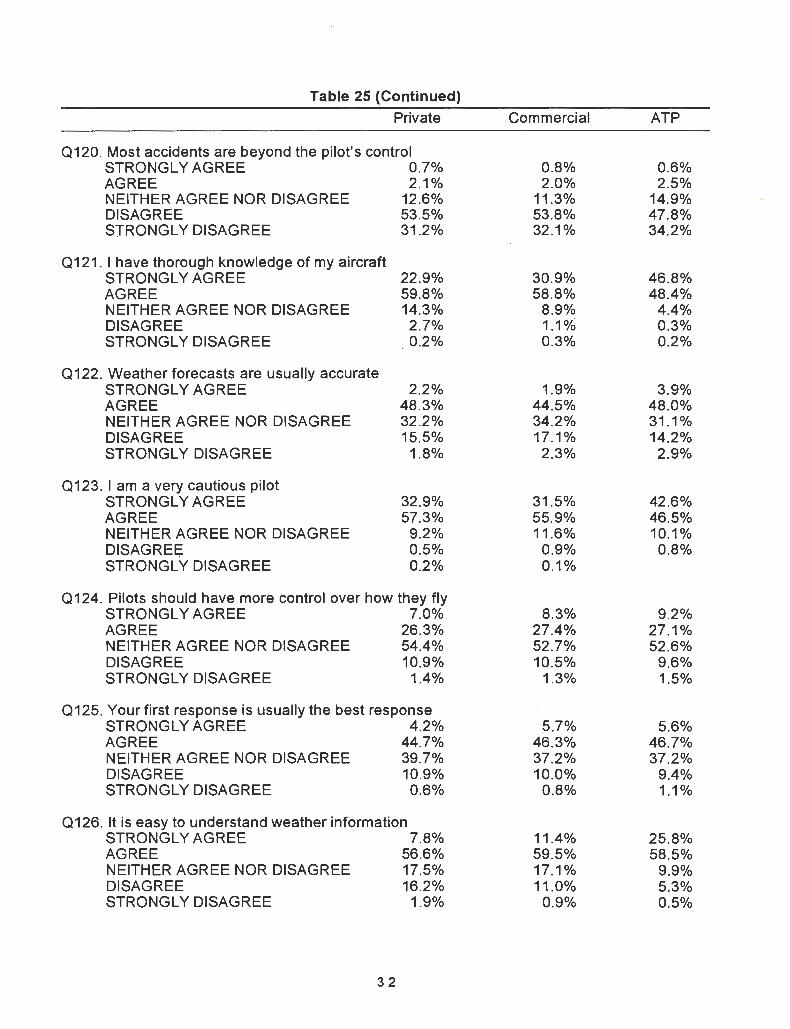
Table 25 (Continued) Private Commercial ATP
0120. Most accidents are beyond the pilot's control STRONGLY AGREE 0.7% 0.8% 0.6% AGREE 2.1% 2.0% 2.5% NEITHER AGREE NOR DISAGREE 12.6% 11 .3% 14.9% DISAGREE 53.5% 53.8% 47.8% STRONGLY DISAGREE 31.2% 32.1% 34.2%
0121. I have thorough knowledge of my aircraft STRONGLY AGREE 22.9% 30.9% 46.8% AGREE 59.8% 58.8% 48.4% NEITHER AGREE NOR DISAGREE 14.3% 8.9% 4.4% DISAGREE 2.7% 1.1 °/~ 0.3% STRONGLY DISAGREE 0.2% 0.3% 0.2%
0122. Weather forecasts are usually accurate STRONGLY AGREE 2.2% 1.9% 3.9% AGREE 48.3% 44.5% 48.0% NEITHER AGREE NOR DISAGREE 32.2% 34.2% 31.1%
. DISAGREE 15.5% 17.1% 14.2% STRONGLY DISAGREE 1.8% 2.3% 2.9%
0123. I am a very cautious pilot STRONGLY AGREE 32.9% 31.5% 42.6% AGREE 57.3% 55.9% 46.5% NEITHER AGREE NOR DISAGREE 9.2% 11.6% 10.1% DISAGREE 0.5% 0.9% 0.8% STRONGLY DISAGREE 0.2% 0.1%
0124. Pilots should have more control over how they fly STRONGLY AGREE 7.0% 8.3% 9.2% AGREE 26.3% 27.4% 27.1% NEITHER AGREE NOR DISAGREE 54.4% 52.7% 52.6% DISAGREE 10.9% 10.5% 9.6% STRONGLY DISAGREE 1.4% 1.3% 1.5%
0125. Your first response is usually the best response STRONGLY AGREE 4.2% 5.7% 5.6% AGREE 44.7% 46.3% 46.7% NEITHER AGREE NOR DISAGREE 39.7% 37.2% 37.2% DISAGREE 10.9% 10.0% 9.4% STRONGLY DISAGREE 0.6% 0.8% 1.1%
0126. It is easy to understand weather information STRONGLY AGREE 7.8% 11.4% 25.8% AGREE 56.6% 59.5% 58.5% NEITHER AGREE NOR DISAGREE 17.5% 17.1% 9.9% DISAGREE 16.2% 11.0% 5.3% STRONGLY DISAGREE 1.9% 0.9% 0.5%
32
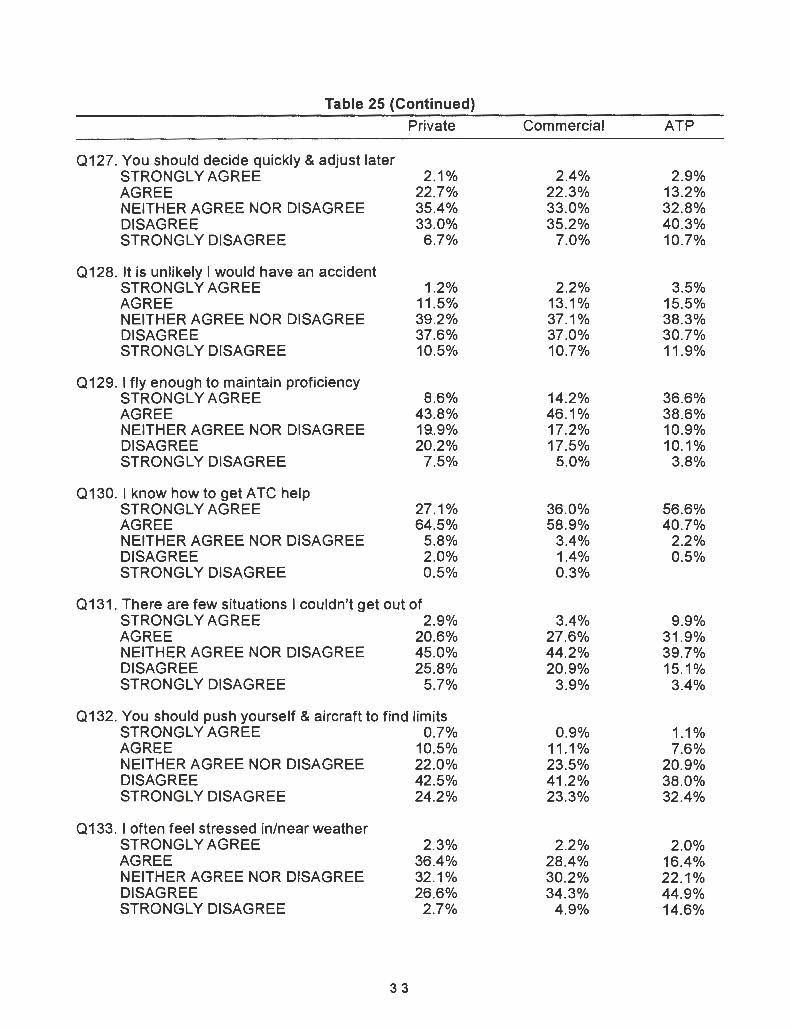
Table 25 (Continued}
Private Commercial ATP
0127. You should decide quickly & adjust later STRONGLY AGREE 2.1% 2.4% 2.9% AGREE 22.7% 22.3% 13.2% NEITHER AGREE NOR DISAGREE 35.4% 33.0% 32.8% DISAGREE 33.0% 35.2% 40.3% STRONGLY DISAGREE 6.7% 7.0% 10.7%
0128. It is unlikely I would have an accident STRONGLY AGREE 1.2% 2.2% 3.5% AGREE 11 .5% 13.1% 15.5% NEITHER AGREE NOR DISAGREE 39.2% 37.1% 38.3% DISAGREE 37.6% 37.0% 30.7% STRONGLY DISAGREE 10.5% 10.7% 11.9%
0129. I fly enough to maintain proficiency STRONGLY AGREE 8.6% 14.2% 36.6% AGREE 43.8% 46.1% 38.6% NEITHER AGREE NOR DISAGREE 19.9% 17.2% 10.9% DISAGREE 20.2% 17.5% 10.1% STRONGLY DISAGREE 7.5% 5.0% 3.8%
0130. I know how to get ATC help STRONGLY AGREE 27.1% 36.0% 56.6% AGREE 64.5% 58.9% 40.7% NEITHER AGREE NOR DISAGREE 5.8% 3.4% 2.2% DISAGREE 2.0% 1.4% 0.5% STRONGLY DISA.GREE 0.5% 0.3%
0131. There are few situations I couldn't get out of STRONGLY AGREE 2.9% 3.4% 9.9% AGREE 20.6% 27.6% 31.9% NEITHER AGREE NOR DISAGREE 45.0% 44.2% 39.7% DISAGREE 25.8% 20.9% 15.1% STRONGLY DISAGREE 5.7% 3.9% 3.4%
0132. You should push yourself & aircraft to find limits STRONGLY AGREE 0.7% 0.9% 1.1% AGREE 10.5% 11 .1% 7.6% NEITHER AGREE NOR DISAGREE 22.0% 23.5% 20.9% DISAGREE 42.5% 41 .2% 38.0% STRONGLY DISAGREE 24.2% 23.3% 32.4%
0133. I often feel stressed in/near weather STRONGLY AGREE 2.3% 2.2% 2.0% AGREE 36.4% 28.4% 16.4% NEITHER AGREE NOR DISAGREE 32.1% 30.2% 22.1% DISAGREE 26.6% 34.3% 44.9% STRONGLY DISAGREE 2.7% 4.9% 14.6%
33
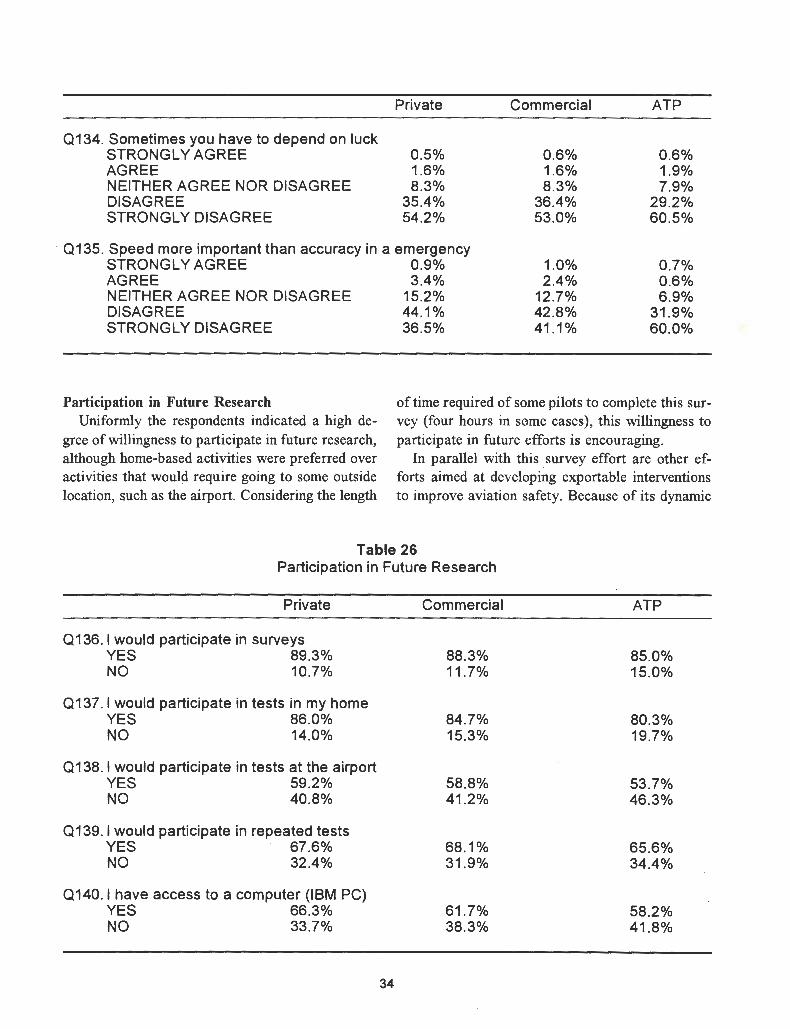
0134. Sometimes you have to depend on luck STRONGLY AGREE AGREE NEITHER AGREE NOR DISAGREE DISAGREE STRONGLY DISAGREE
Private
0.5% 1.6% 8.3%
35.4% 54.2%
· 0135. Speed more important than accuracy in a emergency STRONGLY AGREE 0.9% AGREE 3.4% NEITHER AGREE NOR DISAGREE 15.2% DISAGREE 44.1% STRONGLY DISAGREE 36.5%
Commercial
0.6% 1.6% 8.3%
36.4% 53.0%
1.0% 2.4%
12.7% 42.8% 41.1%
ATP
0.6% 1.9% 7.9%
29.2% 60.5%
0.7% 0.6% 6.9%
31 .9% 60.0%
Participation in Future Research Uniformly the respondents indicated a high de
gree of willingness to participate in future research, although home-based activities were preferred over activities that would require going to some outside location, such as the airport. Considering the length
of time required of some pilots to complete this survey (four hours in some cases), this willingness to participate in future efforts is encouraging.
In parallel with this survey effort are other efforts aimed at developing exportable interventions to improve aviation safety. Because of its dynamic
Table 26 Participation in Future Research
Private Commercial ATP
0136. I would participate in surveys YES 89.3% 88.3% 85.0% NO 10.7% 11.7% 15.0%
0137. 1 would participate in tests in my home YES 86.0% 84.7% 80.3% NO 14.0% 15.3% 19.7%
0138. I would participate in tests at the airport YES 59.2% 58.8% 53.7% NO 40.8% 41 .2% 46.3%
0139. 1 would participate in repeated tests YES 67.6% 68.1% 65.6% NO 32.4% 31 .9% 34.4%
0140. 1 have access to a computer (IBM PC) YES 66.3% 61.7% 58.2% NO 33.7% 38.3% 41.8%
34
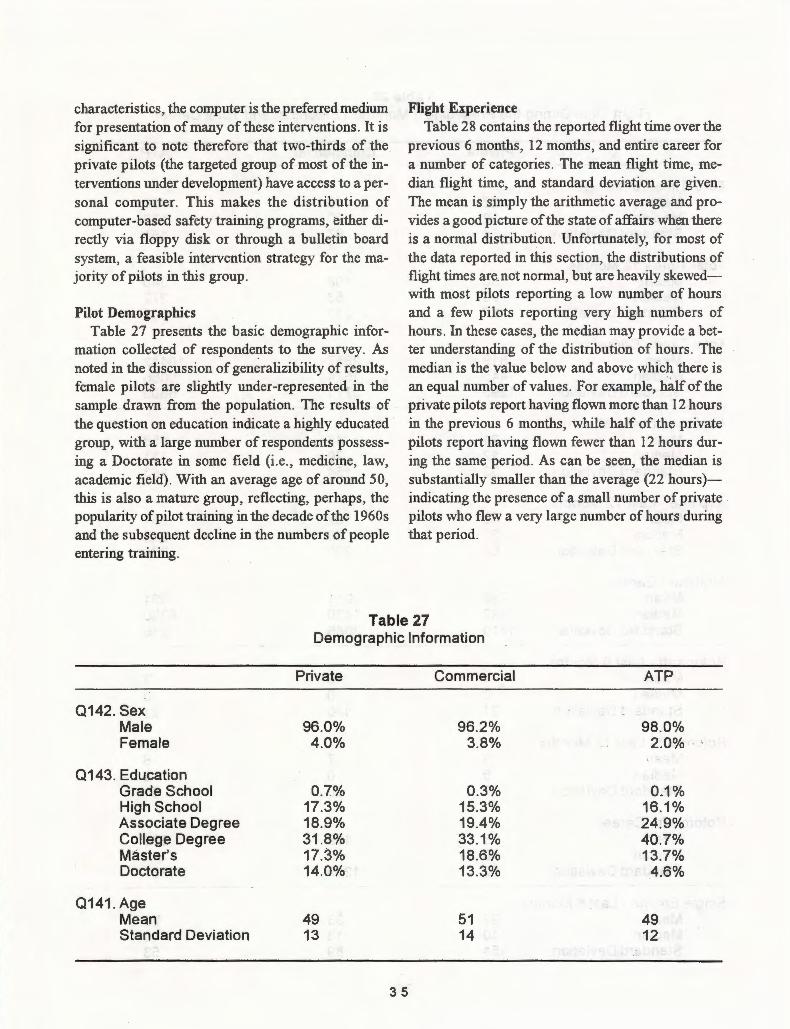
characteristics, the computer is the preferred medium for presentation of many of these interventions. It is significant to note therefore that two-thirds of the private pilots (the targeted group of most of the interventions under development) have access to a personal computer. This makes the distribution of computer-based safety training programs, either directly via floppy disk or through a bulletin board system, a feasible intervention strategy for the majority of pilots in this group.
Pilot Demographics Table 27 presents the basic demographic infor
mation collected of respondents to the survey. As noted in the discussion of generalizibility of results, female pilots are slightly under-represented in the sample drawn from the population. The results of the question on education indicate a highly educated group, with a large number of respondents possessing a Doctorate in some field (i.e., medicine, law, academic field). With an average age of around 50, this is also a mature group, reflecting, perhaps, the popularity of pilot training in the decade of the 1960s and the subsequent decline in the numbers of people entering training.
Flight Experience Table 28 contains the reported flight time over the
previous 6 months, 12 months, and entire career for a number of categories. The mean flight time, median flight time, and standard deviation are given. The mean is simply the arithmetic average and provides a good picture of the state of affairs when there is a normal distribution. Unfortunately, for most of the data reported in this section, the distributions of flight times are_ not normal, but are heavily skewedwith most pilots reporting a low number of hours and a few pilots reporting very high numbers of hours . In these cases, the median may provide a better understanding of the distribution of hours . The median is the value below and above which there is an equal number of values. For example, half of the private pilots report having flown more than 12 hours in the previous 6 months, while half of the private pilots report having flown fewer than 12 hours during the same period. As can be seen, the median is substantially smaller than the average (22 hours)indicating the presence of a small number of private pilots who flew a very large number of hours during that period.
Table 27 Demographic Information
Private Commercial ATP
0142. Sex Male 96.0% 96.2% 98.0% Female 4.0% 3.8% 2.0%
0143. Education Grade School 0.7% 0.3% 0.1% High School 17.3% 15.3% 16.1% Associate Degree 18.9% 19.4% 24.9% College Degree 31.8% 33.1% 40.7% Master's 17.3% 18.6% 13.7% Doctorate 14.0% 13.3% 4.6%
0141. Age Mean 49 51 49 Standard Deviation 13 14 12
35
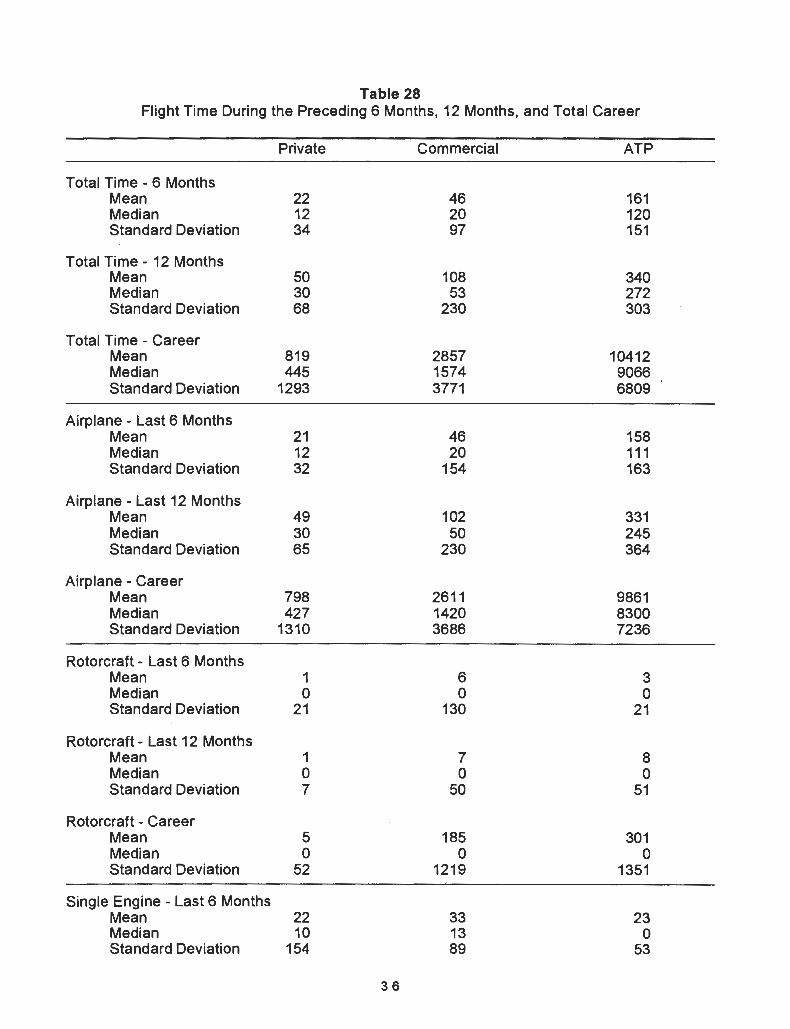
Table 28 Flight Time During the Preceding 6 Months, 12 Months, and Total Career
Private Commercial ATP
Total Time - 6 Months Mean 22 46 161 Median 12 20 120 Standard Deviation 34 97 151
Total Time- 12 Months Mean 50 108 340 Median 30 53 272 Standard Deviation 68 230 303
Total Time - Career Mean 819 2857 10412 Median 445 1574 9066 Standard Deviation 1293 3771 6809
Airplane - Last 6 Months Mean 21 46 158 Median 12 20 111 Standard Deviation 32 154 163
Airplane - Last 12 Months Mean 49 102 331 Median 30 50 245 Standard Deviation 65 230 364
Airplane - Career Mean 798 2611 9861 Median 427 1420 8300 Standard Deviation 1310 3686 7236
Rotorcraft - Last 6 Months Mean 1 6 3 Median 0 0 0 Standard Deviation 21 130 21
Rotorcraft - Last 12 Months Mean 1 7 8 Median 0 0 0 Standard Deviation 7 50 51
Rotorcraft - Career Mean 5 185 301 Median 0 0 0 Standard Deviation 52 1219 1351
Single Engine - Last 6 Months Mean 22 33 23 Median 10 13 0 Standard Deviation 154- 89 53
36
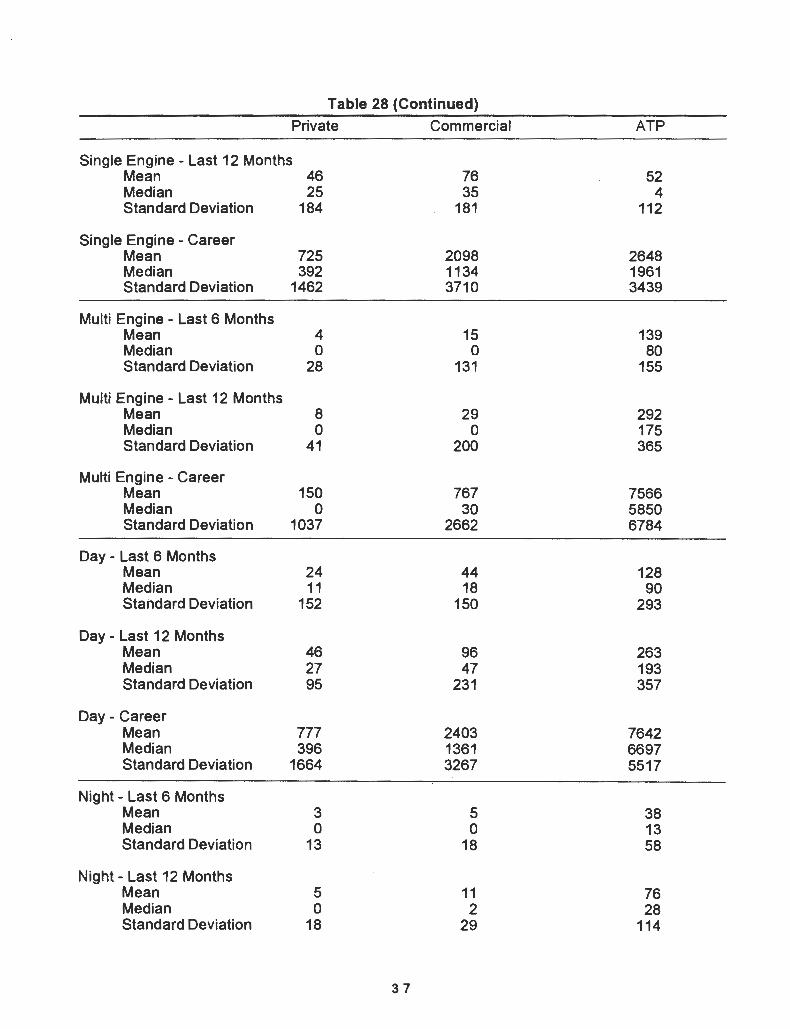
Table 28 (Continued}
Private Commercial ATP
Single Engine - Last 12 Months Mean 46 76 52 Median 25 35 4 Standard Deviation 184 181 112
Single Engine - Career Mean 725 2098 2648 Median 392 1134 1961 Standard Deviation 1462 3710 3439
Multi Engine - Last 6 Months Mean 4 15 139 Median 0 0 80 Standard Deviation 28 131 155
Multi Engine- Last 12 Months Mean 8 29 292 Median 0 0 175 Standard Deviation 41 200 365
Multi Engine - Career Mean 150 767 7566 Median 0 30 5850 Standard Deviation 1037 2662 6784
Day - Last 6 Months Mean 24 44 128 Median 11 18 90 Standard Deviation 152 150 293
Day - Last 12 Months Mean 46 96 263 Median 27 47 193 Standard Deviation 95 231 357
Day- Career Mean 777 2403 7642 Median 396 1361 6697 Standard Deviation 1664 3267 5517
Night - Last 6 Months Mean 3 5 38 Median 0 0 13 Standard Deviation 13 18 58
Night- Last 12 Months Mean 5 11 76 Median 0 2 28 Standard Deviation 18 29 114
37
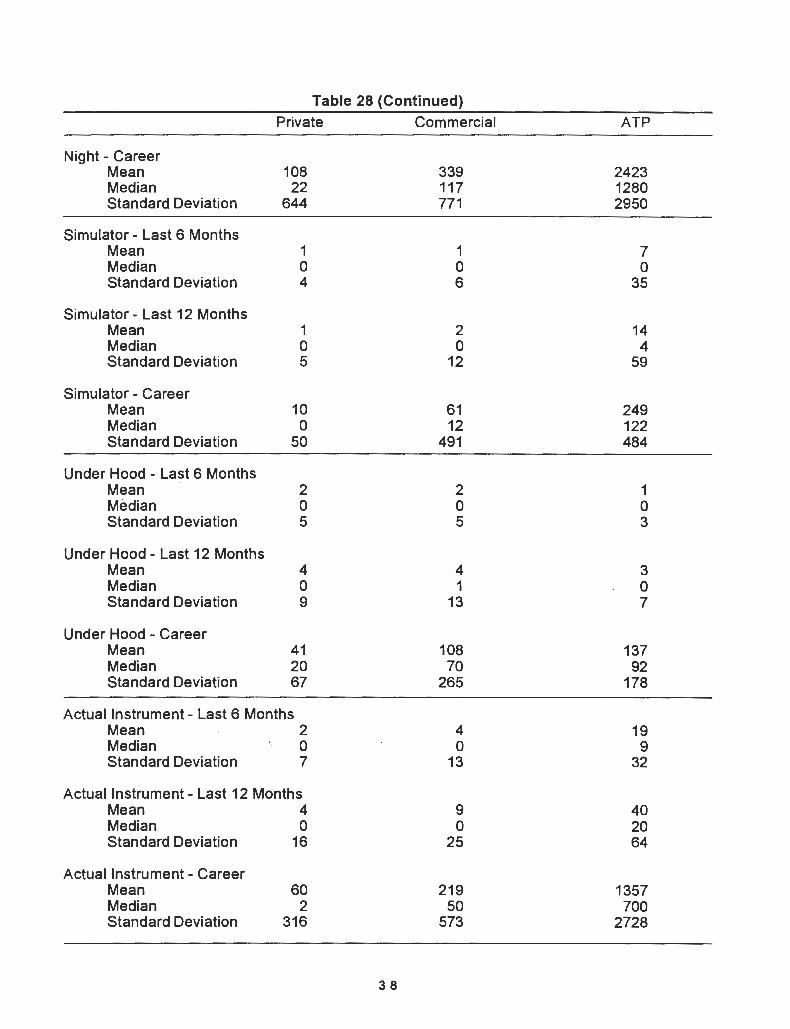
Table 28 {Continued} Private Commercial ATP
Night - Career Mean 108 339 2423 Median 22 117 1280 Standard Deviation 644 771 2950
Simulator- Last 6 Months Mean 1 1 7 Median 0 0 0 Standard Deviation 4 6 35
Simulator - Last 12 Months Mean 1 2 14 Median 0 0 4 Standard Deviation 5 12 59
Simulator - Career Mean 10 61 249 Median 0 12 122 Standard Deviation 50 491 484
Under Hood - Last 6 Months Mean 2 2 1 Median 0 0 0 Standard Deviation 5 5 3
Under Hood- Last 12 Months Mean 4 4 3 Median 0 1 0 Standard Deviation 9 13 7
Under Hood - Career Mean 41 108 137 Median 20 70 92 Standard Deviation 67 265 178
Actual Instrument- Last 6 Months Mean 2 4 19 Median 0 0 9 Standard Deviation 7 13 32
Actual Instrument- Last 12 Months Mean 4 9 40 Median 0 0 20 Standard Deviation 16 25 64
Actual Instrument- Career Mean 60 219 1357 Median 2 50 700 Standard Deviation 316 573 2728
38
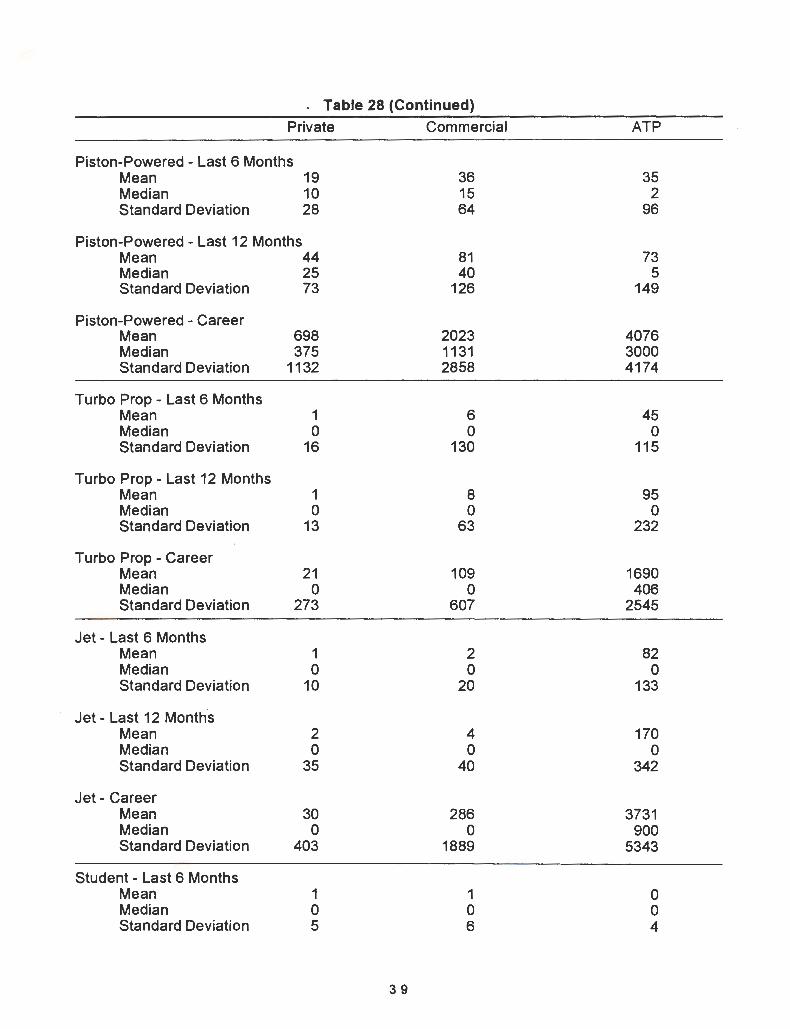
. Table 28 (Continued)
Private Commercial ATP
Piston-Powered - Last 6 Months Mean 19 36 35 Median 10 15 2 Standard Deviation 28 64 96
Piston-Powered - Last 12 Months Mean 44 81 73 Median 25 40 5 Standard Deviation 73 126 149
Piston-Powered - Career Mean 698 2023 4076 Median 375 1131 3000 Standard Deviation 1132 2858 4174
Turbo Prop - Last 6 Months Mean 1 6 45 Median 0 0 0 Standard Deviation 16 130 115
Turbo Prop - Last 12 Months Mean 1 8 95 Median 0 0 0 Standard Deviation 13 63 232
Turbo Prop - Career Mean 21 109 1690 Median 0 0 406 Standard Deviation 273 607 2545
Jet - Last 6 Months Mean 1 2 82 Median 0 0 0 Standard Deviation 10 20 133
Jet- Last 12 Months Mean 2 4 170 Median 0 0 0 Standard Deviation 35 40 342
Jet- Career Mean 30 286 3731 Median 0 0 900 Standard Deviation 403 . 1889 5343
Student - Last 6 Months Mean 1 1 0 Median 0 0 0 Standard Deviation 5 6 4
39
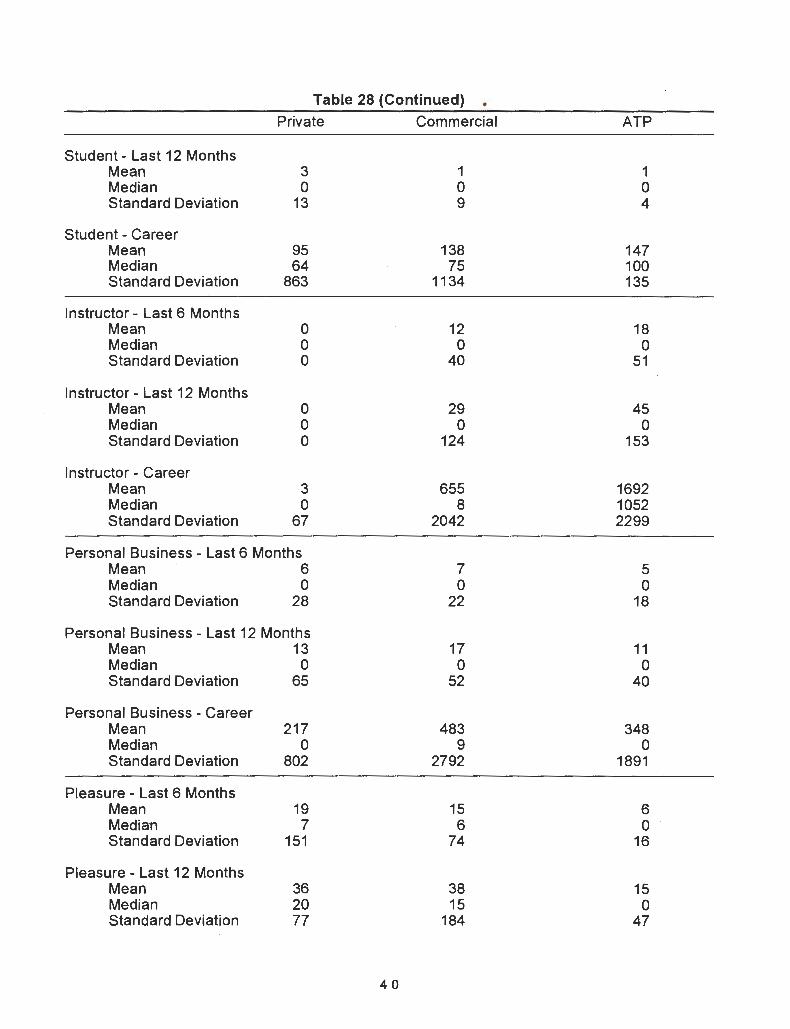
Table 28 (Continued} • Private Commercial ATP
Student- Last 12 Months Mean 3 1 1 Median 0 0 0 Standard Deviation 13 9 4
Student - Career Mean 95 138 147 Median 64 75 100 Standard Deviation 863 1134 135
Instructor- Last 6 Months Mean 0 12 18 Median 0 0 0 Standard Deviation 0 40 51
Instructor- Last 12 Months Mean 0 29 45 Median 0 0 0 Standard Deviation 0 124 153
Instructor- Career Mean 3 655 1692 Median 0 8 1052 Standard Deviation 67 2042 2299
Personal Business - Last 6 Months Mean 6 7 5 Median 0 0 0 Standard Deviation 28 22 18
Personal Business - Last 12 Months Mean 13 17 11 Median 0 0 0 Standard Deviation 65 52 40
Personal Business- Career Mean 217 483 348 Median 0 9 0 Standard Deviation 802 2792 1891
Pleasure - Last 6 Months Mean 19 15 6 Median 7 6 0 Standard Deviation 151 74 16
Pleasure - Last 12 Months Mean 36 38 15 Median 20 15 0 Standard Deviation 77 184 47
40
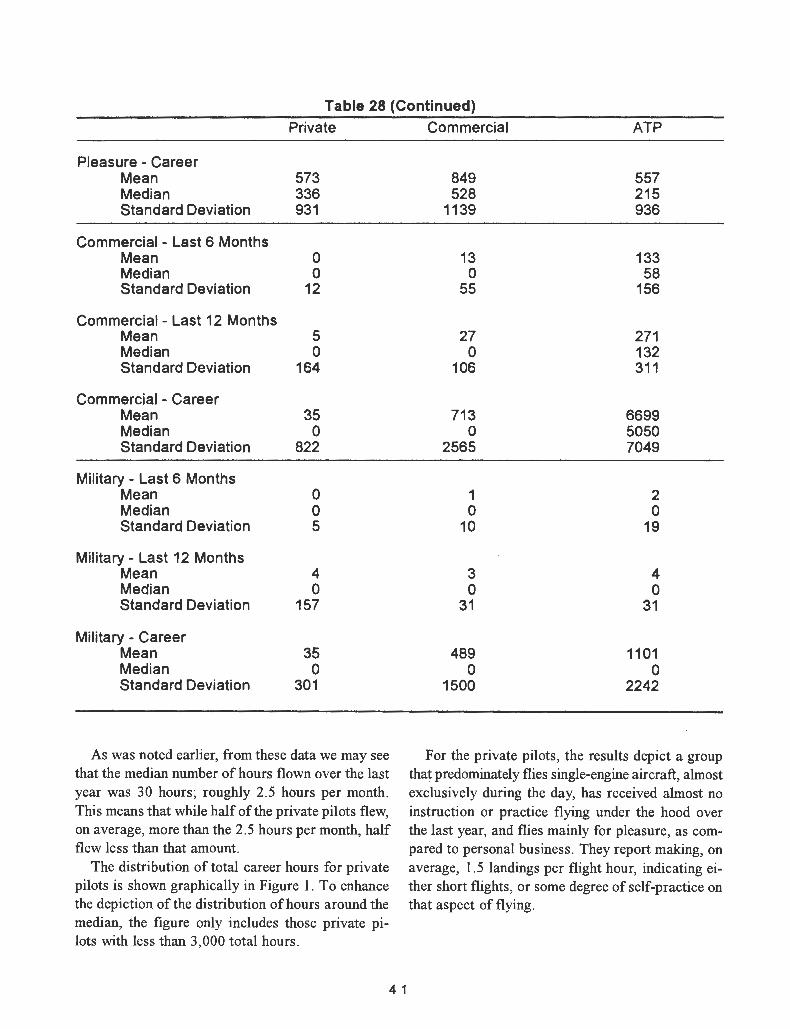
Table 28 (Continued)
Private
Pleasure - Career Mean 573 Median 336 Standard Deviation 931
Commercial - Last 6 Months Mean 0 Median 0 Standard Deviation 12
Commercial - Last 12 Months Mean 5 Median 0 Standard Deviation 164
Commercial - Career Mean 35 Median 0 Standard Deviation 822
Military - Last 6 Months Mean 0 Median 0 Standard Deviation 5
Military- Last 12 Months Mean 4 Median 0 Standard Deviation 157
Military - Career Mean 35 Median 0 Standard Deviation 301
As was noted earlier, from these data we may see that the median number of hours flown over the last year was 30 hours; roughly 2.5 hours per month. This means that while half of the private pilots flew, on average, more than the 2.5 hours per month, half flew less than that amount.
The distribution of total career hours for private pilots is shown graphically in Figure 1. To enhance the depiction of the distribution of hours around the median, the figure only includes those private pilots with less than 3, 000 total hours.
4 1
Commercial ATP
849 557 528 215
1139 936
13 133 0 58
55 156
27 271 0 132
106 311
713 6699 0 5050
2565 7049
1 2 0 0
10 19
3 4 0 0
31 31
489 1101 0 0
1500 2242
For the private pilots, the results depict a group that predominately flies single-engine aircraft, almost exclusively during the day, has received almost no instruction or practice flying under the hood over the last year, and flies mainly for pleasure, as compared to personal business. They report making, on average, 1.5 landings per flight hour, indicating either short flights , or some degree of self-practice on that aspect of flying .
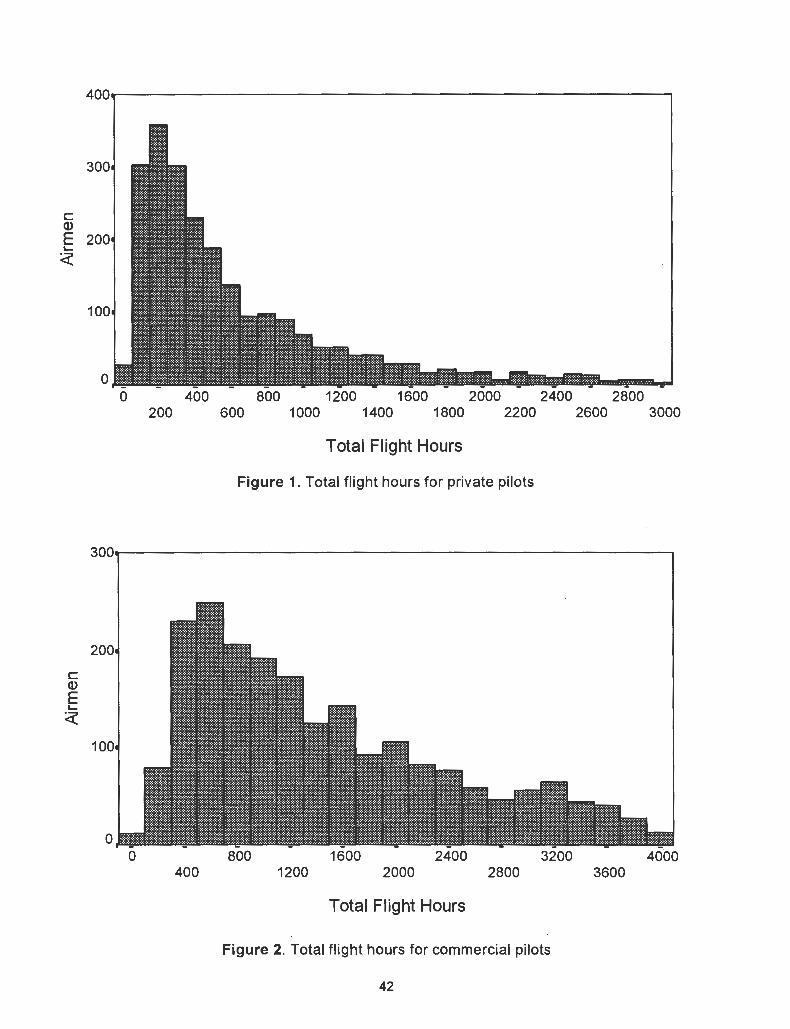
c Q)
E 200 '-<(
100
0 0 400 800 1200 1600 2000 2400 2800
200 600 1000 1400 1800 2200 2600 3000
Total Flight Hours
Figure 1. Total flight hours for private pilots
3uu,~----------------------------------------------------~
c Q)
E '-<(
200
100
0
400 1200 2000 2800 3600
Total Flight Hours
Figure 2. Total flight hours for commercial pilots
42
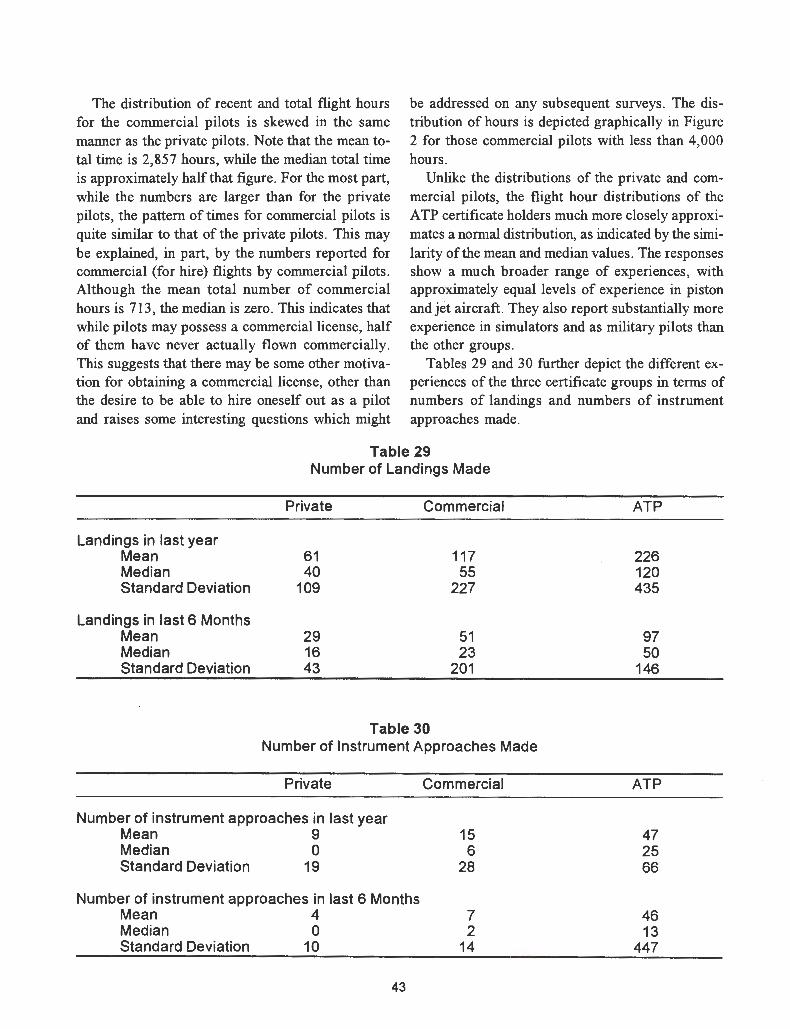
The distribution of recent and total flight hours for the commercial pilots is skewed in the same manner as the private pilots . Note that the mean total time is 2,857 hours, while the median total time is approximately half that figure. For the most part, while the numbers are larger than for the private pilots, the pattern of times for commercial pilots is quite similar to that of the private pilots . This may be explained, in part, by the numbers reported for commercial (for hire) flights by commercial pilots . Although the mean total number of commercial hours is 713, the median is zero. This indicates that while pilots may possess a commercial license, half of them have never actually flown commercially. This suggests that there may be some other motivation for obtaining a commercial license, other than the desire to be able to hire oneself out as a pilot and raises some interesting questions which might
be addressed on any subsequent surveys. The distribution of hours is depicted graphically in Figure 2 for those commercial pilots with less than 4,000 hours .
Unlike the distributions of the private and commercial pilots, the flight hour distributions of the ATP certificate holders much more closely approximates a normal distribution, as indicated by the similarity of the mean and median values . The responses show a much broader range of experiences, with approximately equal levels of experience in piston and jet aircraft. They also report substantially more experience in simulators and as military pilots than the other groups.
Tables 29 and 30 further depict the different experiences of the three certificate groups in terms of numbers of landings and numbers of instrument approaches made.
Table 29 Number of Landings Made
Private Commercial
Landings in last year Mean 61 117 Median 40 55 Standard Deviation 109 227
Landings in last 6 Months Mean 29 51 Median 16 23 Standard Deviation 43 201
Table 30 Number of Instrument Approaches Made
Private Commercial
Number of instrument approaches in last year Mean 9 15 Median 0 6 Standard Deviation 19 28
Number of instrument approaches in last 6 Months Mean 4 7 Median 0 2 Standard Deviation 10 14
43
ATP
226 120 435
97 50
146
ATP
47 25 66
46 13
447
While the private pilot group averaged around 1.5 landings per flight hour, the commercial and ATP groups averaged approximately 1 and 0.5 landings per flight hour, respectively, indicating longer flight segments for these groups . In terms of instrument approaches, the median number of approaches for the private pilots was zero, reflecting the general lack of an instrument rating by members of this group. Interestingly, the numbers of instrument approaches reported by both the commercial and ATP groups were also quite low compared to their total number of flight hours. Over a one year period, the ATP group reported a mean of 4 7 instrument approaches and a median of 25 . This works out to about one instrument approach per week, using the mean value, or one every two weeks using the median value. Further, the difference between the mean and median values indicates a skewed distribution, with some ATP certificate holders performing many instrument approaches, while a large number perform very few-a reflection, perhaps, of regional weather differences. Additional analyses will certainly be needed to develop a better understanding of this observation.
DISCUSSION AND CONCLUSIONS
Within the limits on generalizability discussed earlier, the results of this survey provide a basis for the conduct of future aviation safety research. Previously, information at this level of detail was not available on the population of non-accident involved pilots . Hence, comparisons between the characteristics of pilots who had been involved in accidents and those who had not been involved in accidents were not possible. It is believed that the present study will alleviate to some degree, this lack of information about the general population of pilots and facilitate future safety studies by providing an empirical database for comparisons.
The normative purposes of the survey are also served by the development of information on the career paths of professional pilots . As the recent report of the Pilot and Aviation Maintenance Technician Blue Ribbon Panel (DOT, 1993) indicates, aviation is in a state of change, and the old career paths which, for many of the major air carriers, led
44
from the military cockpit to the civil airliner iue being dissolved by the cutbacks in military training al\d increased retention of military pilots . The data contained here represent a snapshot to some degree of the pilot workforce at a time when those changes are just starting to be felt and may well prove very useful in assessing the impact of these environmental forces as they progress .
To a large degree this survey was not intended as an end in itself, but as a basis or resource for a variety of research. The normative information gathered here, particularly that dealing with flight hours, will prove especially useful to those performing analyses of aviation accidents . The information on career paths will be used in studies of pilot selection and career management and training. Ongoing research on improving pilots risk management skills through the use of personal minimums will use the data on personal minimums. In addition, that and other intervention-oriented research will use the information on participation in training activities and safety seminars in the development of effective marketing strategies.
This initial report has only just begun the process of analyzing the data obtained from the survey. In the brief discussions which accompanied the tabulated results several potential analyses were suggested to investigate the characteristics of various groups of interest. Where the data permit such analyses, a number of additional studies of the data reported here will be undertaken, to further examine the relationships between pilot characteristics and behaviors of interest, such as attendance at safety seminars.
This survey was unique in both the scope of its content and the size of the sample used. However, due caution must be observed in utilizing these results because of the limitations and potential for error associated with self-report survey research described earlier. Nevertheless, if properly conducted the future analyses alluded to above can do much to expand our understanding of the nature of the relationships among the factors assessed by this survey and our understanding of the dynamic pilot population- furthering both our scientific knowledge and helping to bring about our ultimate goal of a safer pilot.
REFERENCES
Berlin, J. 1., Gruber, E. V., Holmes, C. W ., Jensen, P, K., Lau, J. R., Mills, J. W ., & O'Kane, J . M. (1982a). Pilot judgement training and evaluation- Volume I. (DOT/FANCT-82/56-1). Washington, DC: Federal Aviation Administration.
Berlin, J. 1., Gruber, E. V., Holmes, C. W., Jensen, P, K.,Lau, J. R., Mills, J. W., & O'Kane, J. M. (1982b). Pilot judgement training and evaluation- Volume II. (DOT/FANCT-82/56-11). Washington, DC: Federal Aviation Administration.
Berlin, J. 1., Gruber, E. V., Holmes, C. W ., Jensen, P, K., Lau, J. R., Mills, J. W., & O'Kane, J. M. (1982c) . Pilot judgement training and evaluation - Volume Ill. (DOT/FANCT-82/56-III). Washington, DC: Federal Aviation Administration.
Clausing, D.J. (1990). Improving your flying skills: Tips from a pro. Blue Ridge Summit, P A: TAB.
DepartmentofTransportation (1993). Pilots and aviation maintenance technicians for the twenty-first century: An assessment of availability and quality. Washington, DC: Federal Aviation Administration.
Dillman, D. A. (1978). Mail and telephone surveys: The total design method. New York: Wiley.
Fowler, F. J. (1993). Survey research methods. Second Edition. Newbury Park: Sage Publications.
45
Guilford, J.P ., & Fruchter, B. (1973). Fundamental statistics in psychology and education. New York: McGraw-Hill.
Henry, G. T. (1990) . Practical sampling. Newbury Park: Sage Publications.
Jensen, R. S., & Benel, R. A. (1977). Judgement evaluation and instruction in civil pilot training. (FAA-RD-78-24) . Washington, DC: Federal Aviation Administration.
Kanuk, L., & Berenson, C. (1975). Mail surveys and response rates: A literature review. Journal of Marketing Research, 12, 440-453 .
Kirkbride, L. A., Jensen, R. S., Chubb, G. P., & Hunter, D. R. (in press). Developing the personal minimums tool for managing risk during preflight go/no-go decisions. DOTIFANAM-95/XX. Washington, DC: Federal Aviation Administration.
Kish, L. (1965). Survey sampling. New York: Wiley.
NTSB (1989). Annual review of aircraft accident data: US. general aviation calendar year 1987. NTSB/ARG-89/01. Washington, DC: National Transportation Safety Board.
Parten, M. (1950). Surveys, polls, and samples: Practical procedures. New York: Harper & Brothers .
Rea, L. M., & Parker, R. A. (1992). Designing and conducting survey research: A comprehensive guide. San Francisco: Jossey-Bass .
... . . . . ... ••• . . . . . . .
US.Depca ..... dla ISPCQJibi ,...... Alllallon
APPENDIX A
: •: •: Adii*Mu3on . .. . . . . . . . ..... . . ... . . . . ... Dear Airman:
In order to improve aviation safety, the FAA has begun a lon&·tenn. scientific study ol American airmen. This study will examine how ainnen make decisions critical to the safety ol flight, how ainnen develop and maintain their skills, how professional ainnen progress t:hrou8h their careers and how training, experience and other personal factors affect flight safety.
As the first step in this study, I need your help in completing the enclosed AIRMAN RESEARCH QUESTIONNAIRE.
You are one of a random sample of airmen selected from across the country to participate in this study. Your opinions and experiences will be combined with those of the others in the sample to represent the thoughts and experiences of all the ainnen within the United States. Therefore, it is very important th;lt you complete and return the questionnaire.
The survey includes questions about your background, your career as an ainnan, your aviation -experience, training, and involvement in accidents, and your opinions on a variety of issues. As you will see, some questions are oriented toward non-commercial general aviation pilots and some toward commercial pilot&. However, you should answer all the questions based upon your personal experiences.
A1
Appendix A
When you are ready to complete the questionnaire, fmt review the instructions carefully before you , , , begin answering the questions. When you are through, return only the answer sheet, aJoos with any : , , , : comments you might want to include, using the return envelope provided in the packet. Please do not , • , •: fold or staple the answer sheets. • , :
The results d this study will be described in reports published by the Offace r1 Aviation Medicine and will be made available to the public through the National Technicallnlormation Service.
If you have any questions regarding this survey, you may write or call me at:
Office d Aviation Medicine, AAM-240 Federal Aviation Administration 800 Independence Avenue, S.W. Washington, OC 20591
(202) 366-6935
I appreciate your assistance, and hope that you will take the time to complete the questionnaire as soon as possible.
Enclosed: 1. Questionnaire 2. Return Envelope
Sincerely,
t~~Jl/~ David R. Hunter, Ph.D. Program Scientist
A2
. . . . . . . . . .. . . . . . . . . . .
Airman Research Questionnaire
••• • • • • ... ••• • • • . . • • ••• • • • • • • •
•• . . • • • • • ..... . . ... . . . . ...
U.S. DEPARTMENT OF TRANSPORTATION FEDERAL AVIATION ADMINISTRATION
AIRMAN RESEARCH QUESTIONNAIRE
1\it Wac , ~ ••• calicdaa Co.6ir.. ID .._.a-t.-.....~~~~ .. ......._.~~~~· 1., d!eiWenl Oc::w
..,_ ....... ..___., ................... n.e w....daa ,....~ ...... olllyfar -we.~,....._. .. IICitM paiiiWied or releued a •Y fora dt.ll ....U--' lpedflc w.--. ...,_,...,-...........,. WeedlleWe .....,.....h• "fbl. ................ ...,..,...,.. ., die Of&e., Y. 1 t _. 8aoftlt. _. ... loeee II- • OMB Appro¥~~ H..- fllllzo.o566.
AGENCY DISPLAY OF liSTIWATm BURDIN
'l1lc puWic nportlac ...... Iorch~~ collecdoa ol mtor-doa II --.c.d to •ftnlll' - hour per ICipCiftl&o U yau ..W. to-em die-_., ol the estilute or .Ue .,..._lor reclaclat,.... bunlea. pkMe olrect your_,..., OMB _.die FAA at the lollowiac .....__
Of&e oil+ 1 1 eat Uld Buoftet ... r.,er-lt IWadiaa Pftlject (li20-0S66) ~DClOSOl
. _ ....
US ne,.-t ol TI'UIIIIpllltati Feolenl..w.doe AdaiDIIcndca Office ol Ari11C1oa Medidae. AAM·l40 w.w..-, DC ZOS91
READ THIS BEFORE YOU ANSWER ANY OUES1JQNS
l
<
• .i • . .
VOLUNTARY PARTICIPATION: This is a voluntary survey-you do Dot have to take part if you do not wish to do so and the FAA will take no action bued upon your refuaal.
PURPOSE OF STUDY: This is a scientific study of airmen's careen and their decilioo m.akin& pnxesaes.
USES OF DATA: The data you provide will be combined with similar data from other rnpondine airmen and analy:ed to identify career pattel"'ll and to develop models of airman decision pnxesses. The data will be kept on file and will periodicaUy be compared with aviation accident reports to develop profiles of airmen at risk fot decision-related accidents.
SAFEGUARDS AGAINST DISCLOSURE: The information you provide in this survey will be protected. Information idenrifvin& you penonally {for example. your name and certificate number) will be removed from aU data files. Only the Proeram Scientist will have access to the key which links your Subject Identification Number with your name and certificate number. That key will be kept secured at aU times to prevent inadvertent disclosure of personal infonnation.
•
... J. ; : · z. _, ·:
INSI'RlJCIIONS
• <1 ptuwet ..,
• Make heavy black marks that completely flD the circle. • Erue any chanaa cleanly and completely. • Do not make any stray marks in this booklet. • Please do not fold this documeat. • Answer each question except when directed to skip a section. • Read the quationll ~fuUy before selectift& an answer. • If you select an answer that is not identified in the list of
options, write only in the space provided.
· • """' ""; You will be ulted to pve numbers for ~ .ame answers. 1 :.~ u youi i.UWa: i.·t.u
I •Wrir<dwn ... oNriadw ~} ~ ~~ ....... ..u.ou ...... '" LAST NI.IMBEll io ~ • CD ~
olwovtplacodO>dw ·f ~:t • r,I RICHT HAND BOX.
·~· ~ ~ (i• t,_!.•
• FUIO> the UNl"SU> ~' ~ \! • ...... widt ZEllOS. ~ @ ~· ~I
•llwa...tr.dw (!) € €· <!:· ....wac a.. ......... ~· ® Cf· ~ EACHt.o.. ·:!· ® (!) ~
CORRECT MARKS • ::. 2 INCORRECT MARKS l. ~ e ':!) ·:!: ! :! :!:
0001725
• ••
A3
-• ------------------------------------------------------------ I -
Appendix A
------------------------------------------------------------ pace 4 -- •• *U.S.GOVEIINMENT,_,._OFA:e:1--
•
A4
... . . . . ... . . . . . . . . . . ... . . . . . . . .. . . ..... . . ... . . . . ...
•
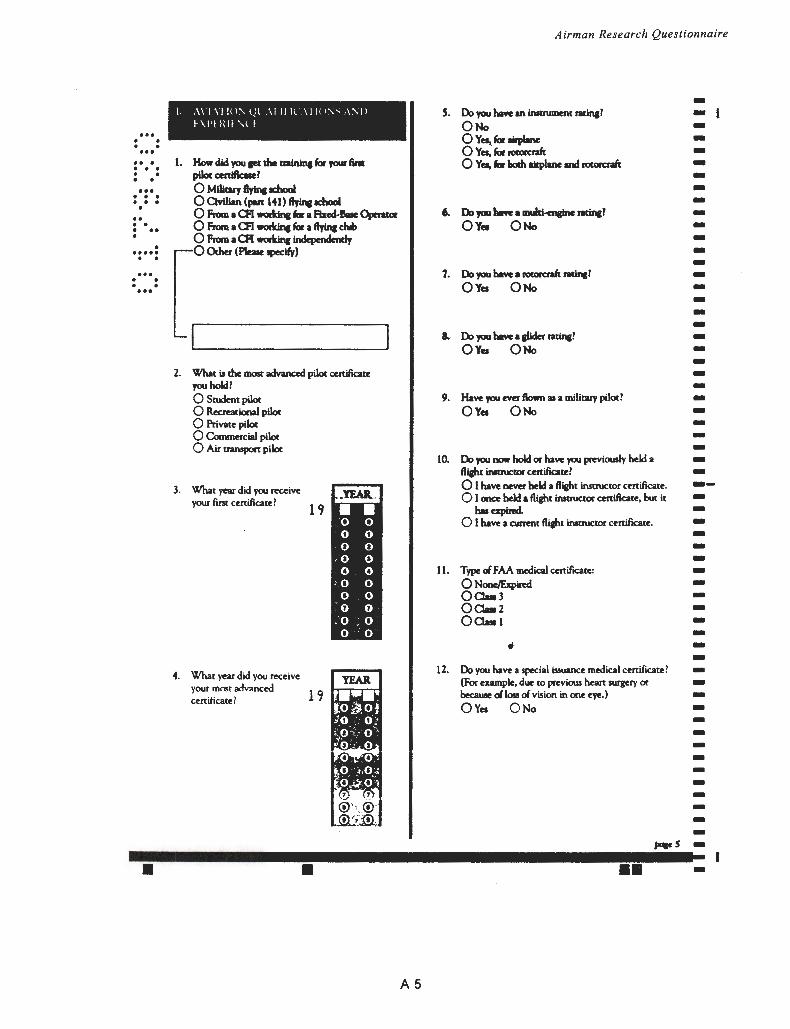
... • • . . ••• ...
• • • . . • • ••• • • • • • • •
•• .. • •• •
• ..... . . ... . . . . •••
•
I. ,\\1 \Ill l''d,l\ \II Ill \II<''-" ,\'\ll t '\1'1 lUI VI
l. How did you Ft dw aainina for your lint pib celtifble? 0 Military ftyinc tcbool 0 CMlian (put 141) ftyinc tcbool 0 From a CFI workina for a FUcd-s- ()puaror 0 From a CFI workina for a flytna club 0 From a CFI workinc indepaldmdy 0 Other (PinK tpeeify) .
2. What i$ the most advanced pilot cenifJCate you hold? OStudmtpilot 0 Recreational pilot 0 Private pilot 0 Commercial pilot 0 Air traNpOrt pilot
3. What year did you receive your fim certificate?
4. What year did you receive your m<ll't advanced certiticate?
19
19
•
A5
Airman Research Questionnaire
S. Do you haft Ul inluument ratiJla? ONo 0 Ya, for airplane 0 Ya, for KlCili'Cralt 0 Ya, for lloch airplane and rotorcraft
7. Do you haw. rooxcnlt l'llline? Ova ONo
a. Do you haw. Jlider ratiJla? OYa ONo
9. Have you ever flown u a military pilot?
0Ya 0No
10. Do you now hold or have you previously held a f1icht inltructDr certificate? 0 I have never held a f1icht instruCtor certificate. 0 I once held a flight insauctor certificate, but it
has expired. 0 I have a current flight instructor certificate.
II. Type c:/FAA medical certif~ate: 0 None/Expired 00..3 00..2 Oa-t
12. Do you have a special issuance medical certificate? (For example, due to previous heart surgery or because ci loa ci vision in one eye.)
0Ya 0No
-------------------------------------------------------------,...s --•• -
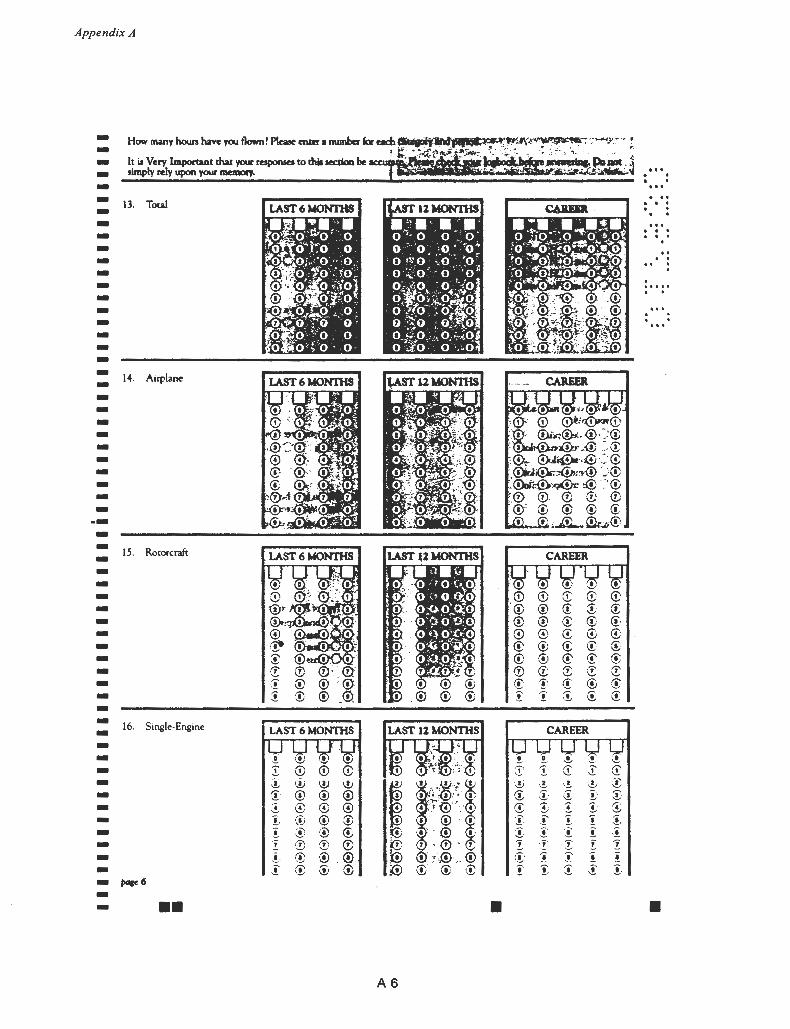
Appendix A
------ 13. Total --------------- 14. Airplane --------------- 15. Rotorcraft -------------- 16. Single-Engine -- \.!) !. - CD J\ ------· ~~' I
\!)
1 ~~-~ a :': · a, (!: • _t@ "'.' . ~ I : {!) ' I t,!: ,, ._ . ® •· ~~ 7 • (!)'7 !:
(!. ~ \.!) \.!J (!· (!) ® ® ·~ ~ @ 0 ~ ·:I> (!) ® !,
! ::!) ® ® '! ® ® (!) -- I: ;'.{ij ,. ® '1·
® $ i:!; ! .! (!) ·~ .. ® ! (!) (!;' ® - ,..e6 -- •• •
A6
@ (!) (!:' (!: (!)
! (!, Ci
CAREER
,!.. .!,·
'i· C!: J: ·.!. •! '.!i T (! "1' I i :! ·'!; ~
-! ! ! 1 i 1 ·! !: ! "! :! ! ! : -~· J'·
\!. (!' ~ ~-~ :t ·! '! ! :!,
... . . . . ... . .. . . . . . .. ... . . . . . . . .. ... . . ..... . .
•
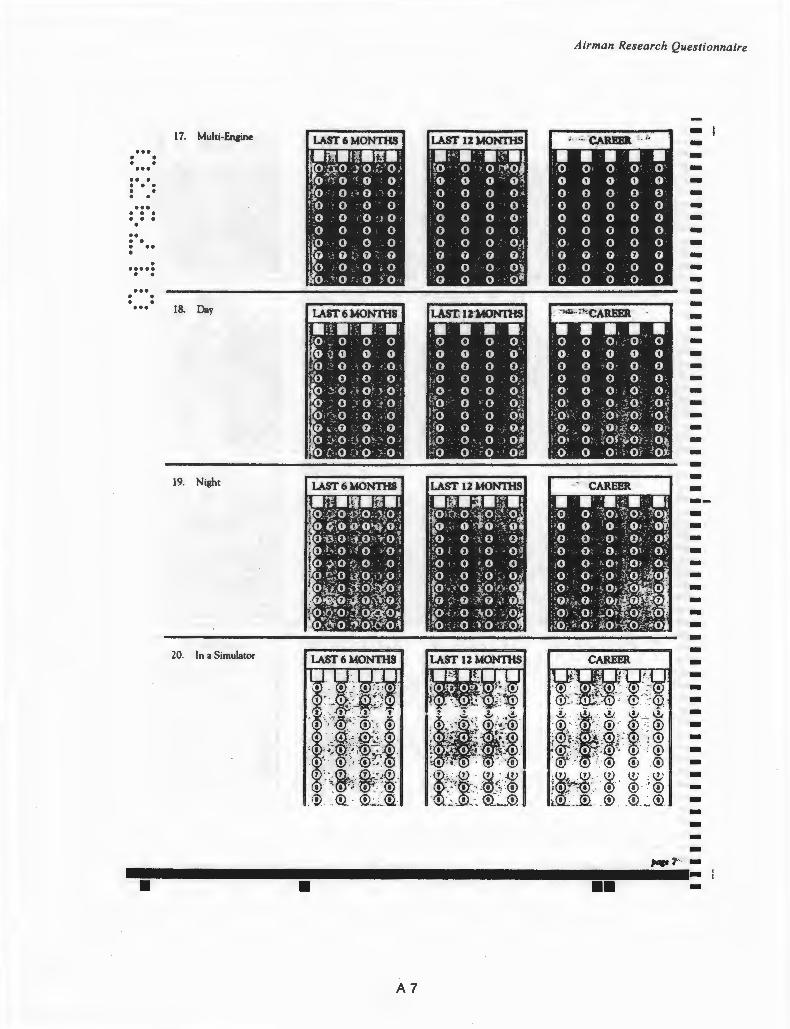
... • • • • ... ... . . . . . . . ... • • • • • • • •• .. . . . • . ..... • • ... . . . . ...
Airman Research Questionnaire
17. Multi-En,ine ----------------18. Day --------------19. Night -------------20. In a Simulator ----------
I.!J . I.!J -------ptJce 7 -. -
A7
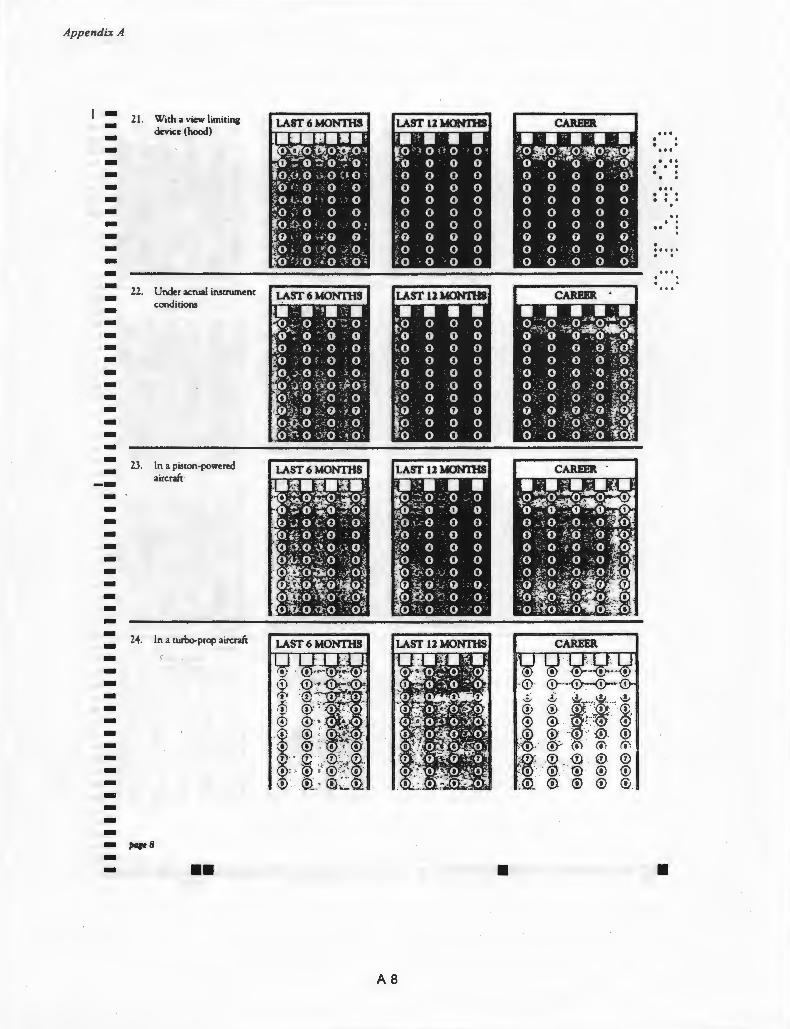
Appendix A
------------------------------------------------------------
21. With a view limitine device (hood)
22. Under acrual i.tutrument conditions
2.3. In a piston-powered aircraft
2-4. In a turbo-prop aircraft
- fH!ce8 -- ••
AS
... . . . . . .. . . . . . . ... . . . . . . . .. . . .. . . . ..... . .
• •
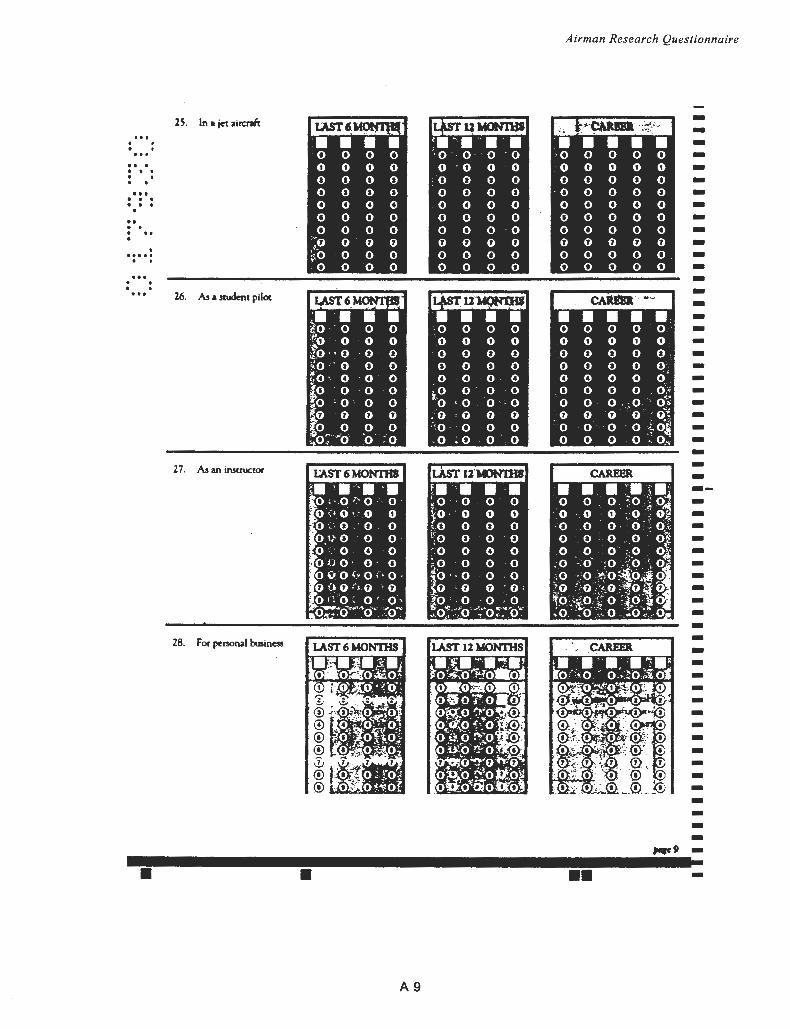
Airman Research Questionnaire
-25. In a jet aircraft ---.. • -• • . -• . • . ... -• . . • . . -• -.. -• • • .. • -. ..... -. . --... . . -• . ... 26 . M a student pilot -----
•••• • • • • • • • • • • • to o 0 0 : 0 0 0 0 0 0 0 0 o · ;.o o 0 0 0 0 0 0 0 0 0 0 0 ~f.} ·i 0 0 0 0 0 0 0 0 0 0 0 0 ;o ,. o 0 0 0 0 0 0 0 0 0 0 o·· -------;, ·
0 0 0 0 0 0 0 0 0 0 o,'. ~o · o "O . 0 0 0 ·0 0 0 0 0 0 0 0 o,; ~'o '0 · 0 0 '·o • 0 0 ·. o 0 0 o .,o I 0~
'0 0
0 0 .·o ' 0 0 0 0 0 0 ·· o ,.o3
~:·~~ 0 0 '~o · o 0 0 0 · o 0 o +o~ ·o :o .o ; o 0 0 0 0 0 . o ~· o. : -27. As an instructor ----------------28. For ~rsonal business ----------------,., -• • •• -
A9
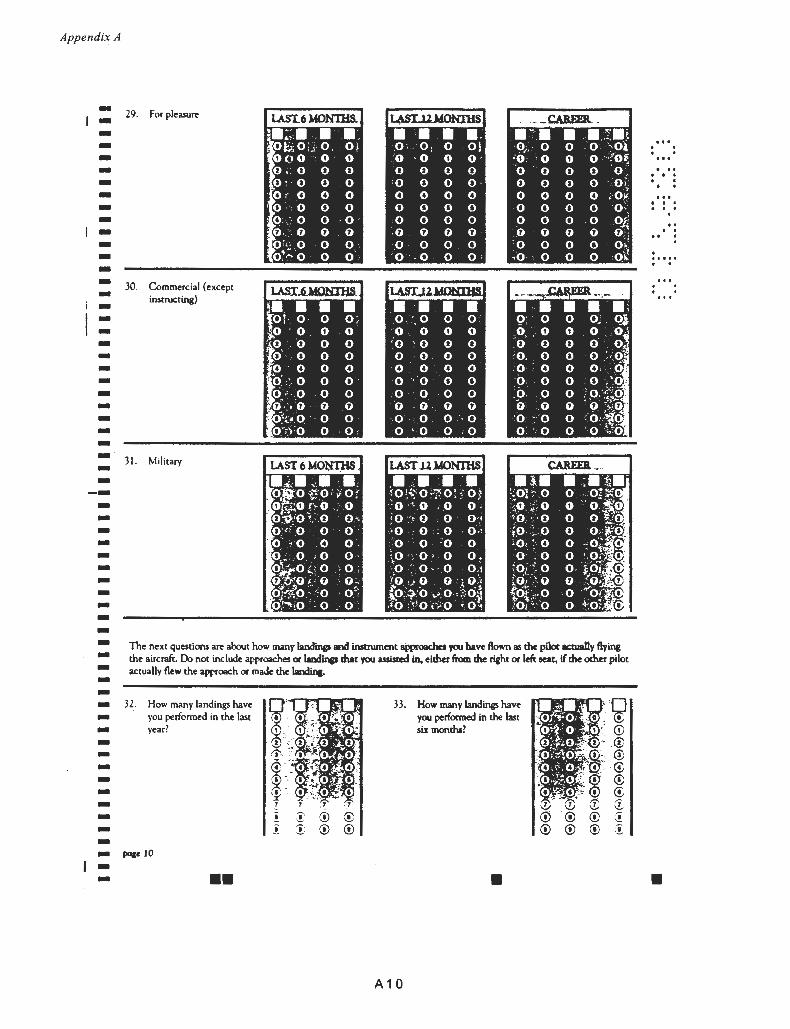
Appendix A
-- 29. For pleasure --------------- 30. Commercial (except instructing) ------------· - 3!. Military ----------------- The next questions are about how many Ja.ndines and instrument ipproac.hes you have flown as the pilot actually flyine
the aircraft. Do not include approaches or landinat that you assisted in, either from the right or lc:ft seat, if the other pilot actually flew the approach or made the Jandint. --- 3l. How many landings have
- you performed in the last - year? ------- ! - i -- pace 10 -- ••
,_1
I · ~ 1: <!)
33. How many landings have you performed in the last six months?
•
A1 0
l
... . . ... . .. . . . . . . . .. . . . . . . . . . .. . ..... . .
•
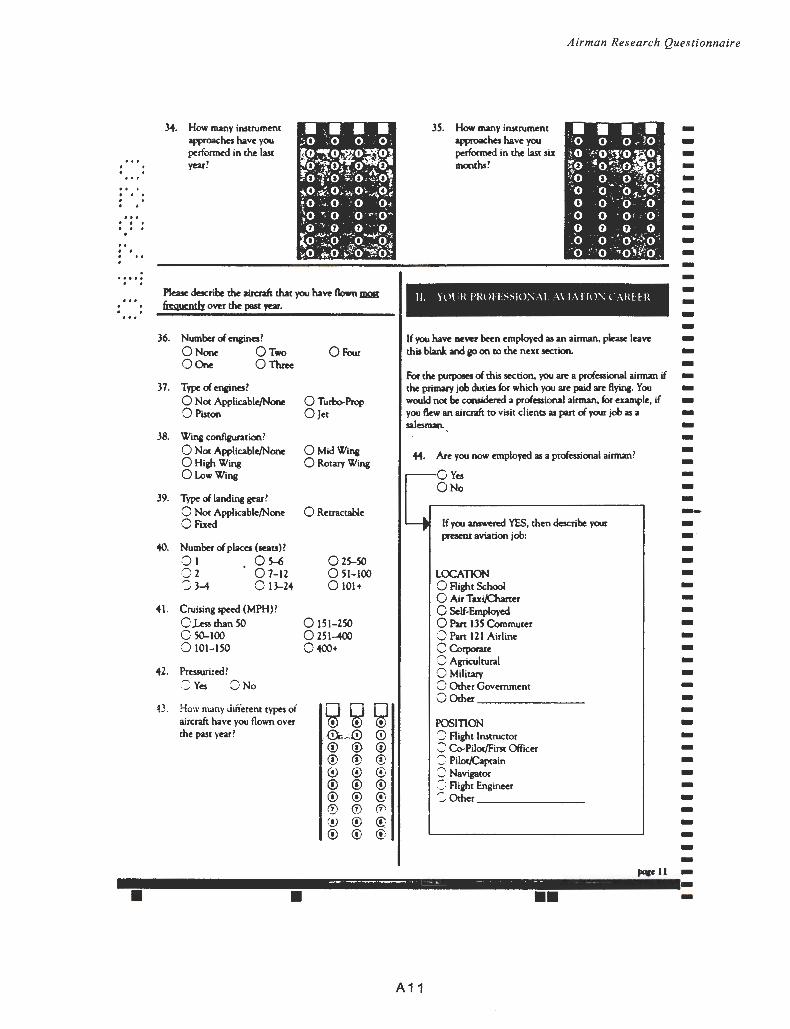
... . . . ... . . . . . . . .. . . . ..... . .
•
34. How many instrument approaches have you performed in the last yeat?
Please describe the aircraft that you ha~ flown fllllll freqycndx over the past year.
36. Number oE engines? 0None 0Two 0Four Oe>ne OThree
37. Type oE engines? 0 Not Applicable/None 0 Turbo-Prop 0 Piston 0 Jet
38. Wing configuration? 0 Not Applicable/None OMidWing OHighWing 0 Rotary Wing OLowWine
39. Type oE landing gear? 0 Not Applicable/None 0 Retractable 0 Fixed
40. Number oE places (seats}? 01 Os..o 025-50 :J2 07-12 0 51-100 OJ.-4 On-24 0 101+
41. Cruisine speed (MPH)? 0 ,Less than 50 0151-250 0 50-100 0 251-400 0101-150 0400+
42. Pressurized? 2 Yes ONo
43. Hew many ,.iifierem types oi ~I;} ~ aircrah have you flown over the past year? ·0;..:.0 (j)
® ® ® <!) <!) ® ~ <!) 0 ® ® ® ® ® ® ® ® ~ (.!) <!) ® ® ® (!';
Airman Research Questionnaire
35. How many instrument approaches have you performed in the last six months?
--------------II. \Pl H ('f{Ol b"I0:\ .\1 \\I \110:\ C \IU H~ ---If you have -~ been employed as an airman, please leave -this blank and eo on to the next section. --For the purpoaes oE this section, you are a pro(esional airman if -the primary job duties for which you are paid are flying. You -would not be considered a prolesional airman, for example, if -you flew an aircrah to visit clients as pan oE your job as a -
salesman., -
44. Are you now employed as a professional airman?
~OYes 0No
If you answered YES, then describe your present aviation job:
LOCATION 0 Right School 0 Air Taxi/Charter 0 Self-Employed 0 Part IJ5 Commuter 0 Pan 121 Airline 0Corporate 0 Agricultural 0 Military 0 Other Government 0 Other ______ _
POSITION 'J Right Instructor ,-:;: Co-Pilot/First Officer : Pilor/Capcain ·:; Navigator :::·. Right Engineer ~Other ______________ _
---------· --------------------------~11 -~ -....,...- ----~- -· -.. - - -- -• •• -
A 11
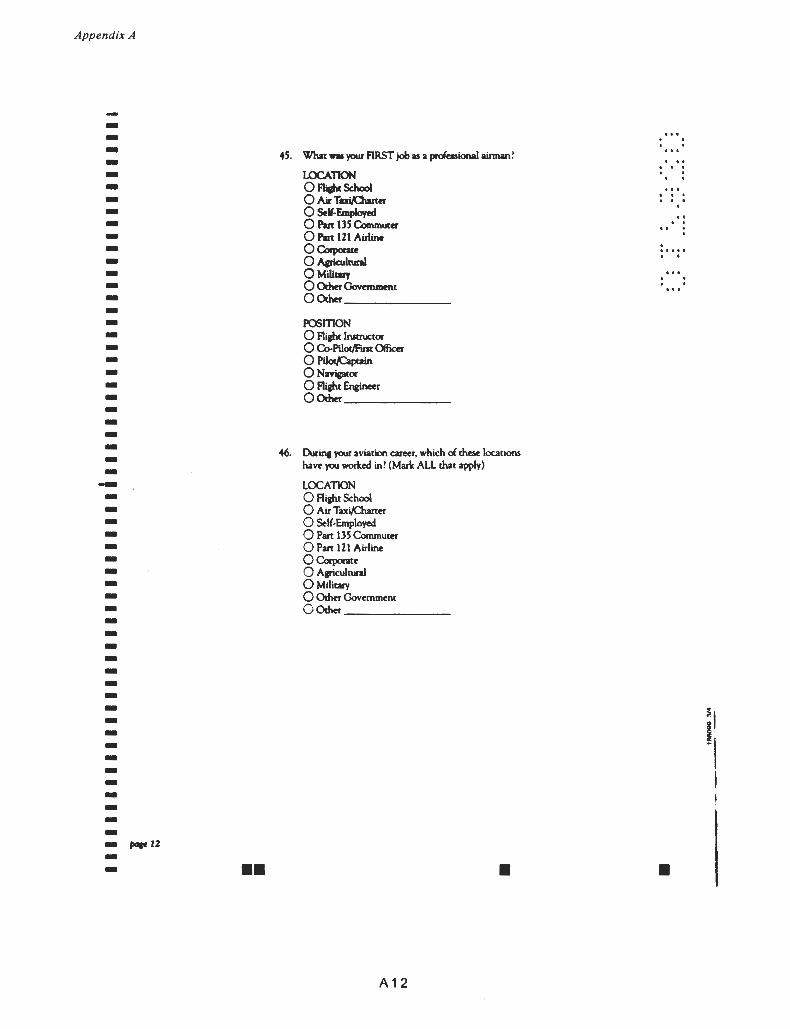
Appendix A l
---- 45. What- your RRST job as a pro(eaional airman? .. . - LOCATION . . . - 0 Riaht School 0 AM Tai,Owter
. - . . . . - 0 Sell-Employed - 0 Pan 135 Commuter - 0 Pan 121 Airline - 0Corporare
. ..... . . - 0 A,ricultural - 0Miliary - 0 Odwr Govanmmt - oomer -- POSmON - 0 Richt Instructor - 0 Co-Pilot/Fint OffiCer - 0 Pilot.Capuin - ONaviptor - 0 Richt Engineer - oomer ---- 46. Durinc your aviation career, which c:i these locations - have you worked in? (Ma.rlt ALL that apply) -- LOCATION - 0 Rieht School - 0 Air Taxi/Charter - 0 Self-Employed - 0 Part IJS Commuter - 0 Part 121 Airline - 0Corporate - 0 Apicultural - 0Milirary - 0 Other Government - OOther -------- ~I -- !I --- i -.. ---- j~Q&cll -- •• • •
A12
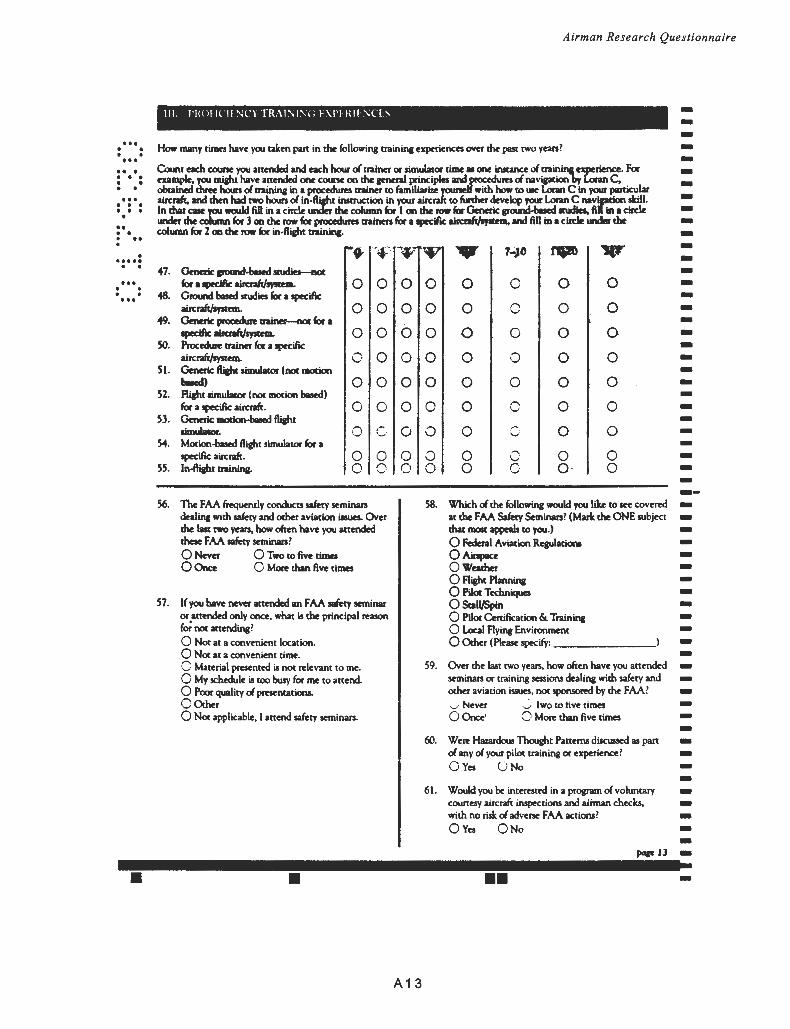
••• • • • • ••• ••• • • • • • . . . ... • • • • • • • •• • • • • • •
• ••••• . . ••• . .
• • •••
•
Airman Research Questionnaire
---How many rimes have you taken part in the following rrainin& experiences over the pasr rwo yean? --Count each course you attended and exh hour c:l trainer or simulator rime • one instance c:l trainine experience. For example, you mialu have attended one course on the ameraJ ~· iples and edura c:l navigation by Laan C. ---obaincd three hOun c:l training in a procedura trainer ro familiarize with how ro 111e Lonn C in your ~ aircnlt.llld then had two houn c:1 it\.fliaht inltruction in your · ro further ~lop your Lonn C naviption skill . In that ca.e you would lUI in a cirde uncfer the column for l on the row for Generic ~ trudies, fiH ill a circle under the column for 3 on the row for pnxedura trainers b a~peeifiC ai~ and All in a cirde under the column for 2 on the row for in·tlighr trainin&.
---47. Generic around-l-1 studi&-aot
for. tpeci6c: ~ 48. Ground based studies for a tpeeific
aircraft/"fftmt. 49. Generic procedure trainer-not b a
..,ecific~ 50. Procedure miner for a tpeeific
aircraft/system. 51. Generic ftiaht timularor (noc ..ooon
baled) 52. Riaht limulator (noc IIIO(ion based)
b a tpeeific aircnlt. 53. Generic~ fllcht
umua-. 54. Morion·based tlighr simulator for a
tpeeilk aircnlt. 55. ln..fliebt trainin&·
0
0
0
0
0
0
0
0 0
0
0
0
0
0
0
56. The FAA ~ndy conducts safety seminan dealing with safety and other aviation iuues. Over the last two years. how often have you attended these FAA safety seminars? 0 Never 0 Two ro five times 0 Once 0 MOft than five tima
57. If you have never attended an FAA safety seminar or attended only once, what is the principal reason f~ noc attending? 0 Nor at a convenient location. 0 Nor at a convenient rime. C Material presented is nor relevant to me. 0 My schedule is too busy for me to attend. 0 Poor quality c:l praentations. OOtber 0 Nor applicable, I attend safety seminars.
•
0 0
0 0
0 0
0 0
0 0
0 0
0 0
0 0 0 0
0
0
0
0
0
0
0
0 0
0
0
0
0
0
c
0
0
0
0
0
0
0
0 0 ·
0
0
0
0
0
0
0
0 0
----------------------58. Which c:l the following would you like ro see covered -ar the FAA Safety Seminars? (Mark the ONE subject -that 11101t appeals ro you.) -0 Federal Aviation Rqulationl -
OA.inpece -0Weacher -0 Riaht Planninc -0 Pilol Techniques -0 Scaii/Spin -0 Pilot CertiAcarion &. Trainin& -0 local Aying Environment -0 Other (Please tpeeify: --59. Over the last rwo yean, how often have you attended -seminars or training sessions dealine with safety and -other aviation i11Ul'5, nor sponsored by the FAA? -v Never ·-.) lwo to live tirMS -OOnce· 0 MOft than five rimes --60. Were Hazardous 'Thought Patterns discussed as part -ol any of your pilot training or experience? -
OYes U No --61. Would you be interested in a program of voluntary -counesy aircraft inspections and airman checks, -with no risk of adverse FAA actions? -
0Yes ONo --pap 13 -
•• -
A13
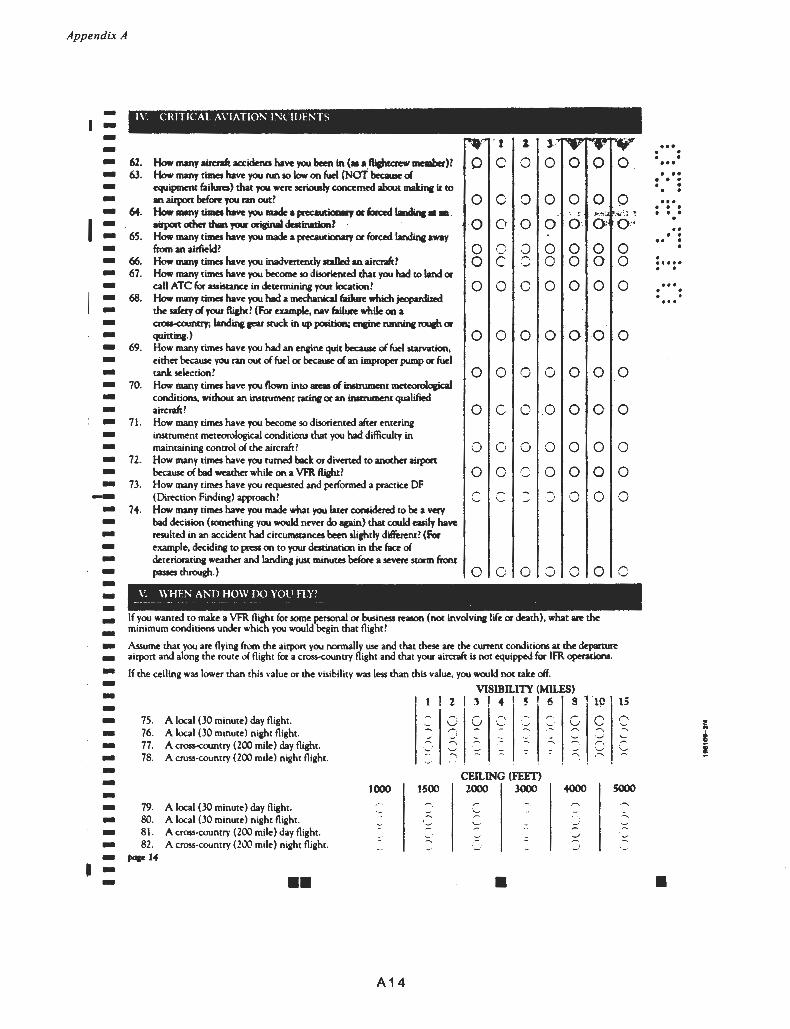
Appendix A
---------I -----------------------------------------------------• --
1\'. CRITICAL A\'IATIO!'\ II"UDfNTS
. l 1.
62. How many aircraft accidma have you been in (a • .ftictitaew member}? 0 .C 0 0 0 63. How many times have you run !0 low on fuel (NOT because ol
equipmmt &illftS) that you we~ seriously conccmed about makinc it to an airport bd~ you ran out? 0 0 0 0 0 0
64. How -.ty times haw you made • ~or bad landinc • • . - . :. J' ~:;
airport other tMn your oricinal dettinadonl -0 0 0 0 o · 0 65. How many times have you made a precautionary or forced landinc away
from an airf~tld? 0 ,..., ~.... .. 0 0 0 0
66. How many times have you inadvertently stalled an aircralt? 0 c ,-, 0 0 0 . ..., 67. How many times have you become !0 disoriented that you had to land or
call ATC for assistance in determininc your location? 0 0 0 0 0 0 68. How many times have you had a mechanical ~ which jeopardized
the safety ol your flicht? (For example, nav failure while oo a croa-counay; landinc sear stuck in up politioo; encine runnin& roueb or quinine.) 0 0 0 0 0 ·0
69. How many times have you had an engine quit because of fuel starVation, either because you ran out of fuel or because of an improper pump or fuel tank selection? 0 0 0 0 0 0
70. How many times have you flown into areas ol inltrument mereorolop:al conditions, without an instrument ratinc or an inltrument qualified aircraft? 0 c 0 0 0 0
71. How many times have you become so disoriented after enterinc instrument meteorological conditions that you had diffkulty in maintaining control of the aircraft? 0 C• 0 0 0 0
72. How many times have you turned back or diverted to another airport because of bad weather while on a VFR fli&ht? 0 0 c 0 0 0
73. How many times have you ~quested and performed a practice OF (Direction Finding) approach? r- r- - ..... 0 0 '-' '- ..)
74. How many times have you made what you later corwidered to be a very bad decision (!Omtthing you would Mver do apin) that could easily have resulted in an accident had circUINtal\ces been sliehtly di~~t? (For example, decidinc to press on to your destination in the face of deterioratin& weather and landinc just minutes bef~ a se~ storm front passes through.) 0 0 0 0 0 0
V. WHEN AND HOW IX) YOL' FlY? --- - -
If you wanted to make a VFR flight for some penonal or business reason (not involvinc life or death), what are the minimum conditiens under which you would begin that flight?
0 .
0 :i; ;,; !
o ·· 0 0
0
0
0
0
0
0
0
n -'
Assume that you are flying from the airport you normally use and that these are the cumnt conditions at the departure airport and along the route of flight for a cross-country flight and that your aircraft is not equipped for IFR operations.
If the ceiling was lower than this value or the visibility was le5s than this value, you would not take off.
75. A local (30 minute) day flight. 76. A local (30 minute) night flight . 77. A cross-country (200 mile) day flight. 78. A cross-country (ZOO mile) night flight.
1000
79. A local (30 minute) day flight. 80. A local (30 minute) night flight. 81. A cross-country ( 200 mile) day flight .
..
::
82. A cross-country (ZOO mile) night flight . -
~~·
••
A14
~
~-
VISmiLITY (MILES) I 2 I 3 I 4 ! 5 I 6 I 8
0 0 --, ,.... -~ -~ ~· '-'' ,....;
;::..,_ :::: ·- :::. .::.. ~.
'-' ::::: :: -~·
' -CEILING (FEET)
1 10
0 "'\ ·.J
0 ......
1500 2000 3000 4000
' .-,
:::. I ~-·--
: -~ -=-
:::. = ....)
_,
•
I 15 ("'\ ~
~
-~
'-'
sooo
.::.. -:::. -.
... . . . . ... ... . . . • . • . ... . . . . . . . .. . . .. . .....
• . ... . . . .
l t !
•
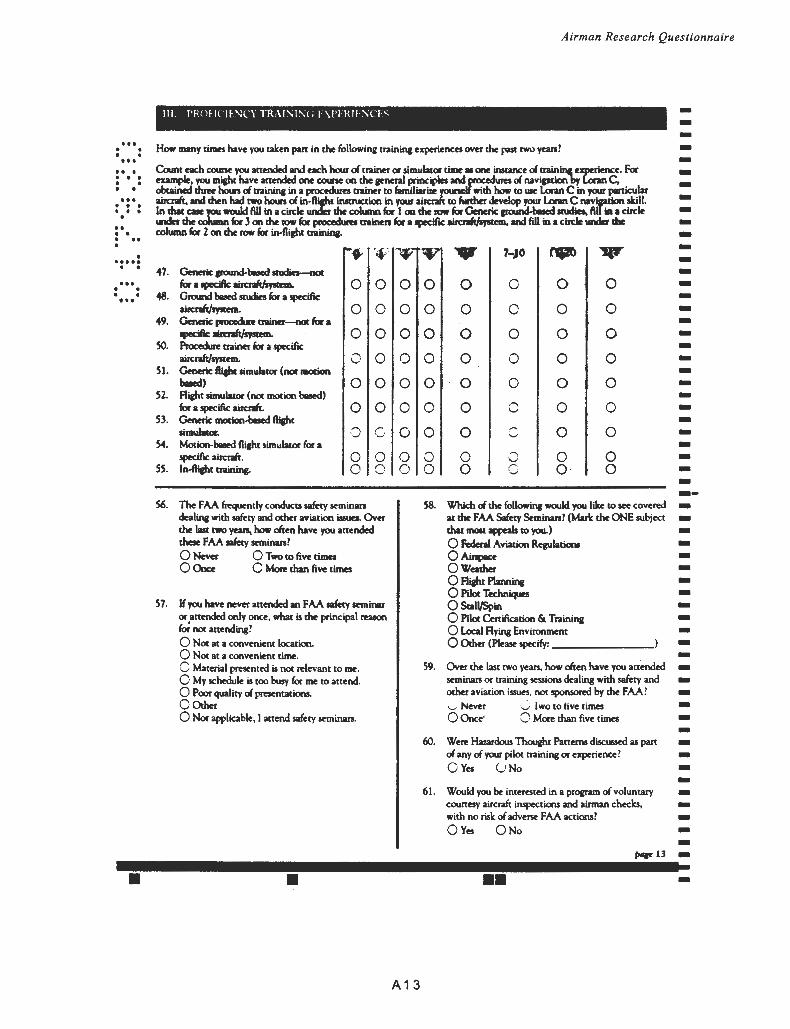
••• • • • • ••• ••• • • • • • • • ... • • • • • • • •• • • • • • •
• ..... . . ••• . . . . •••
•
Airman Research Questionnaire
---How many times have you taken pan in the followine trainiJ\i experiences over the past twO yean? --Count each coune you attended and each hour ci trainer or simulator time • one inlunce ci trainine experience. For example, you mieN have attended one coune on the aeneral ~· ipla and edures ci naviption by Loran C. ---obcained three hours ci trainine in a procedures trainer to f'aniiliarize with how to use Loran C in your puticular aircnfr, .nd !hen had twO houn ci m-1\iahl iNtruction in your . to further dew lop your Loran c navlpdon skill . In that c.e you would fill in a circle llnlfer !he column lor I on !he 101r lor Generic~ llUdiel, fill ill a circle under !he column lor J on !he 101r lor pcoadura trainen for a~peeifiC u~ and flU in a circle under rhe column for 2 on !he lOW for in-flight traininl .
------47. Generic pound-t-1 saxfiet.-.not bai(IKillc~ 0 0 0 0 0
0
0
0
0
0
0
0 0
0
0
0
0
0
0
0
0
0
0
0
0
0 0 ·
0
0
0
0
0
0
0
0 0
-48. Ground baed studies for a !peeific aircnitlfJI(em.
49. Generic~ trainer-not for a lpCific rilcrllt/sysum.
50. Procedure trainer for a !peeific aircnitiSfSlem.
51. Generic fticht simulator (not motion t.ed)
0 0
0 0
0 0
0 0
0 0
0 0
0 0
0 0
---------52. Ri&ht simulator (nor mocion based) for a !peeific aircraft.
53. Ommc JDOdon..t-f Riaht limu&.x.
0 0 0 0
0 c 0 0
c ---54. MOlion·based flight simulatOl for a !peeific aircraft.
55. ln.flicbt aaiftin&. 0 0
56. 'The FAA fftquendy conducts safety seminan dealine with safety and other aviation ilaues. Over the last twO yean, how often have you attended these FAA sakty seminars? 0 Never 0 Two to five rima 0 OtiCe 0 More than five times
57. If you have never attended an FAA sakty seminar or attended only once, what is the principal reaaon (~nor attending?
0 NOl at a convmiem location. 0 NOl at a convenient time. C Material presented is nor relevant to me. 0 My schedule is too busy for me to attend. 0 Poor quality ci presentations. OOther 0 NOl applicable, I attend safety seminan.
•
-0 0 0 0
0 c --
A13
---58. Which ci the following would you like to see covered -at !he FAA Salety Seminan? (Mark the ONE subject -that DIOit appeals to you.) -0 Federal Aviation Rqulationl -
0Ampece -Oweamer -0 Ri&ht Plannina -0 Pilot Techniques -0 StaiiJSpin -0 Pilot Certifkation &. Trainina -0 local Rying Environment -0 Other (Please !peeify: --59. Over the last rwo years, how often have you attended -seminars or training sessions dealing with safety and -Olher aviation issues, nOf sponsored by the FAA? -v Never 0 lwo to tive times -OOnce• 0 More than five times --60. Were Hazardous lbought Pattema discussed as pan -of any of your pilot training or experience? -
OY~ UNo --61. Woold you be inter~ted in a program ci voluntary -coun~ aircraft inspections and airman checks, -with no risk of adverse FAA actions? -
OY~ ONo -
fi'CIICU -
•• -
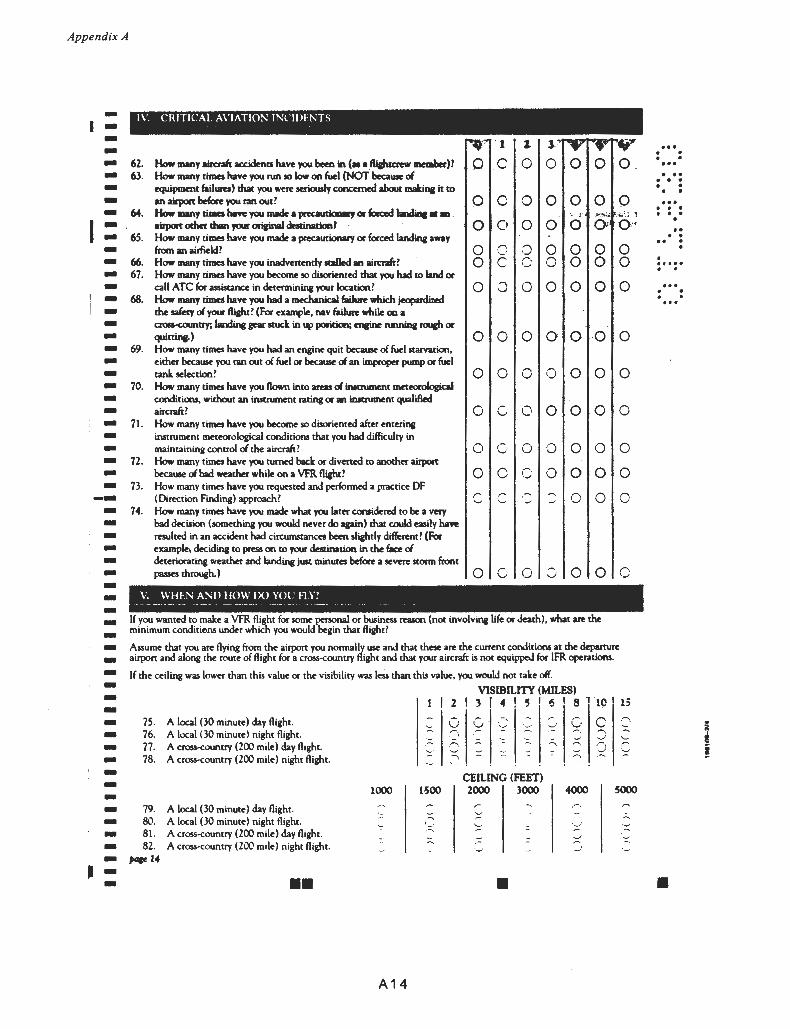
Appendix A
---------I -----------------------------------------------------• --
1\'. CRITICAl AVIATION 11\:l'IDfNTS
1.
62. How many ain:nlt acciderus have you been in (• • .~ member)? 0 c 0 0 0 63. How many times have you Nn 50 low on fuel (NOT because of
equipment &ih.ns) that you were seriously concemed about makina it to
an airport before you ran out? 0 0 0 0 0 0 64. How ~Y times haft you made a~ or fa.ad landirlc • a . ·• J' ~:;
airport ocher than your orieinal datinadonl ·0 0 0 0 0' 0 65. How many times have you madt a precautionary or forced landina away
from an airf.eld? 0 ,..., \_.• 0 0 0 0
66. How many times have you inadvertently salJed an aircralt? 0 c ,...., 0 0 0 . _.
67. How many times have you become 50 disoriented that you had to land or call ATC for assistance in dtterminina your location? 0 0 0 0 0 0
68. How many times have you had a mechanical failure which jeopatdi:ed the safety of your fti&hr? (For example, nav failure while on a crou-counay; Iandin& pr stuck in up polition; mcine runninc roueh or quinine-) 0 0 0 0 0 ·0
69. How many times have you had an engine quit because of fuel starvation, either because you ran out of fuel or because of an improper pump or fuel tank selection? 0 0 0 0 0 0
70. How many times have you flown into areas of inltrument meteorological conditiom, without an in.stru~t~tnt rating or an inltrument qualified aircraft? 0 c 0 0 0 0
71. How many times have you bec0111t 50 disoriented after enterina instrulfltnt lfltteorological conditions that you had difficulty in maintaining control of the aircraft? 0 C· 0 0 0 0
72. How many times have you turned back or diverted to another airport because of bad weather while on a VFR fli&ht? 0 0 c 0 0 0
73. How many times have you requested and perforlfltd a practice OF (Direction Finding) approach? r ,... ~ ..... 0 0 "-' '- ..)
74. How many times have you made what you later corwidtred to be a very bad decision (something you would never do again) that could easily have resulted in an accident had circumstances been sliehtly d~rent? (For example, deciding to press on to your destination in the face of dtterioratin& weather and landing just minutes before a se~ storm front passes through.) 0 0 0 0 0 0
V. WHEN AND HOW 00 YOLl FlY? ~ - -- - - - -
If you wanted to make a VFR flight for 10me penonal or business reaaon (not involvina life or death), what are the minimum conditiens undtr which you would begin that flight?
0 .
0 : ii ;. : !
o ·· 0 0
0
0
0
0
0
0
0
c
Assume that you are flying from the airport you nonnally use and that these are the current conditions at the departure airport and along the route of flight for a cross-country flieht and that your aircraft is not equipped for IFR operations.
If the ceiling was lower than this value or the visibility was lm than this value, you would not take off. VISIBILITY (MILES)
I 2 I 3 I .. ' 5 I 5 I 8 1 10 ' 15
·"" ~ ~
.......
,... 0 ~· v ""\ ·~·
~. ~. 0 ~
·...-' -.. ......
75. A local (30 minute) day flight. 0 0 ~,
':::_ ':: '~ 76. A local (30 minute) night flight.
,...., -' '
77. A cros&-country (200 mile) day flight. .""\ ;:: - ~ -· ::::: ::
78. A cross·countty (200 mile) night flight. ~. -CEILING (FEET)
1000 1500 2000 3000 4000 sooo 79. A local (30 minute) day flight. ·~
.-, 80. A local (30 minute) night flight.
.. ~
'-· ';:::' 81. A cross·country (ZOO mile) day flight.
-:: -~. ::
82. A cross-country (200 mile) night flight . - ::., ::::: = -i
jlclce J.f
•• •
A14
... . . . . ... ... . . . • • • • ... . . . . . . . .. . . .. . . . ..... . . ... . . . . ...
~ I i
•
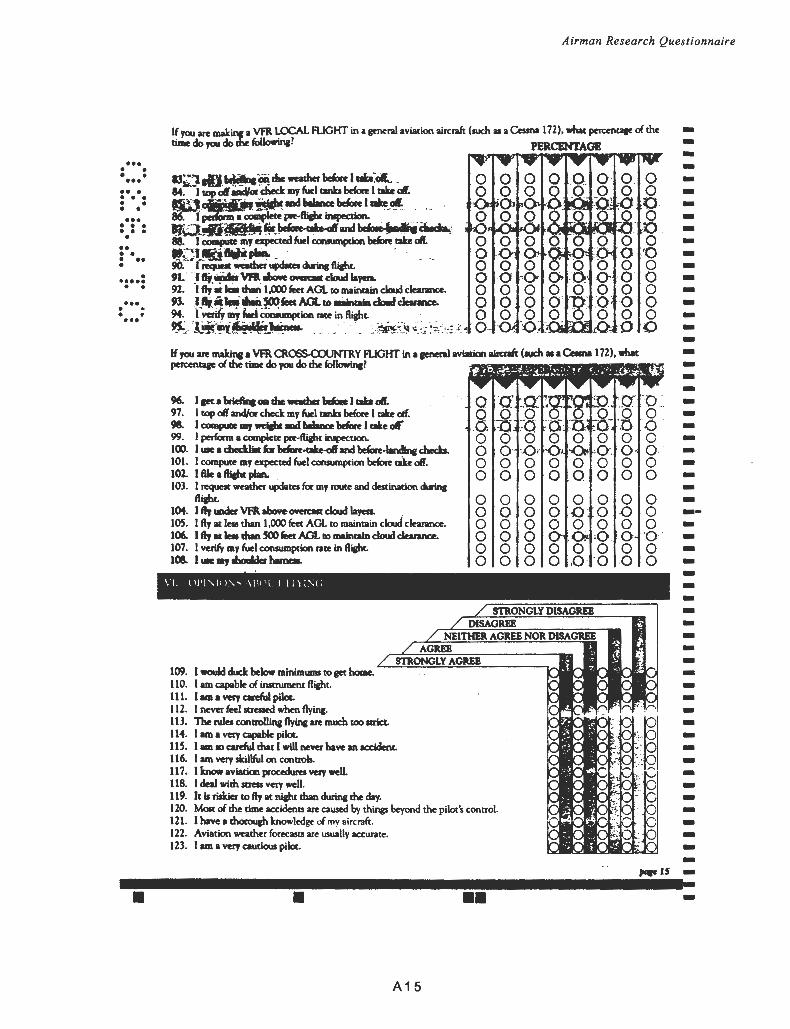
••• • • • • ••• •• • • • • • • • • ••• • • • • • • •
•• •• • •• • • ••••• • •
••• . . • • ...
•
Airman Research Questionnaire
------------------If you an: maJan, a VFR OlQISS.(X)lJNTII.Y RJGHT in a aenem aviation aimalt (such • a c-.. 172), what -percentqe «the rime do you do the f'ollowinc? -
96. l&Ka~-chewadlerW.IabrL 97. I top alf and/u check my fuel tanb before I cake elf. 98. I COIIIpiU 111J wetabc -r Waac:e Wen I .Xe cl 99. I periorm a complete s-·fliaht iNpection. 100. I we a chedlilt b t.i:ft-cakc-af and befcn-landlne checb. 101. I compute my expected fuel consumption before mu alf. 102. I file a fticht plan. 103. I ~weather updata for my route and destination durin&
fliaht. 104. I fly Wider VFR above ove«at cloud layaa. . lOS. I fly at less than 1,000 ~t AGL to maintain cloud clearance. 106. I fly ar lea chan SOO feet AGlto maintain cloud cltarance. 107. I verify my fuel consumption rate in flight. 108. .... .., thoalder bar-.
109. I would cld below minimums to act N.e. 110. I am capable« iNtrument flight. 111. I am a YaY cmeful pilot. 112. I never feel smaed when flyinc. 113. 1be rules controllinc flvin& an: much too lttkt. 114. I am a very capable pilot. liS. lam10 carelul that I will never have an ICddent. 116. I am very skillful on conaols. 117. I maw aviatiOn procedwa very well 118. I deal with streu very well. 119. It II riskier to fly at nJaht than durin& the day.
0 0 0 0 0 0 0 0 0 0 0 0
120. Most «the time accidents are caused by things beyond the pilot's conttol. 121. I have a thoroueh lcnowledge of my aircraft. 122. Aviation weather forecasts are usually accurate. 123. I am a very cautious pilot.
• ••
A15
-----------------------------------------,.u --
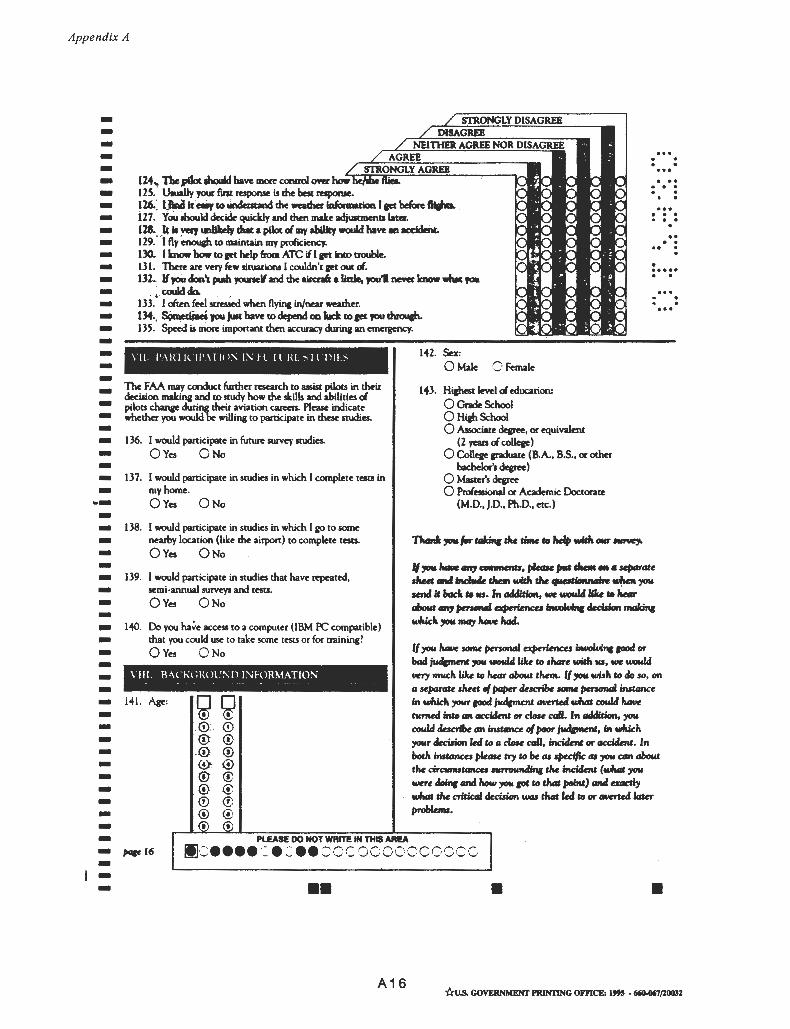
Appendix A
------- 124.., The ,pilot .oould have more c.onaol over hooi 12S." U..Uy your f111t response is the bat raponae.
... . . . .
-- 126.~ l'lloCI 1r a11r ro Ynclentand the -mer IMxmatim 1 au belen a.-. . i27. Yw ibould decide quickly and then make ad;Uitlllella later.
... . . . . . . . ... . . . . . . . -- 128 •. k II YaJ lmlikdy that a pi)oc c:i DIY ability would have •ICddent. 129.' '1 fly~ to maintain my proficiency.
.. . . .. . . - 130. I know ho. to ttl help &om ATC if I au inrD trouble. - 131. 'There are very kw situations I couldn't ttl out c:i. - 131. II JOil don't pUib younelf and the aircn6 a little, yoU'D ne.s bow .t.t ,_ . ..... . . -- ~ . couldch . .
133. I often feel stressed when flying in/nar weather. -- 134 .. S!:meriinei yOu )Ill haw to depend 00 hd to ttl you rhrou&h. IJS. Speed is niore important then accuracy during an emergency.
... . . . . ... -- \II. I'.\Hillll'\110:'\ 1:'\ H Il Hl..,ll Dll., -- The FAA may conduct further research to assist pilots in their - decision making and to study how the skills and abilities c:i - piloa change durirw their aviation careers. Please indicate - whether ycu would "be willing to participate in these studies. -- 136. I would participate in future survey studies.
- 0Yes 0No -- 137. I would participate in srudies in which I complete tesu in
- myhome . ... _ OYes ONo --------------------------
138. I would participate in studies in which I eo to IOille nearby location (like the airport) to complete tests.
0Yes 0No
139. I would participate in studies that have repeated, semi-annual surveys and tests.
OYes 0No
140. Do you ha~e access to a computer (IBM PC compatible) that you could use to take some tests or for training?
OYes 0No
i41. Age:
142. Sex: 0 Male C Female
143. Hill- level c:i education:
0 Grade School 0 Hi,h School 0 Aslociate dqree, or equivalent
(2 yean c:i collqe) 0 Collqe paduate (B.A .• B.S., oc other
bachelor's degree) 0 Master's dqree 0 Professional or Academic Doctocate
(M.D., J.D .• Ph.D., etc.)
lf:JOK '- ,_, annen~.~, fll- ,_dieM • • .,_au ,_. _, lncWe dian with tile~ -"en,_ aend it !Jed to ... "' oddidon, - -u lib to .._. about,., jleriGMI ~ ~ deddon malcinc wlaich ,_ _, ,_ held.
If,_ haw- pnwnaJ ~ inwh>inr JOOCI ~~' bad judpwnt ,_ -LIIilc.c co share with au, - -'d wry nNCh liJc.c co hear about them. If,_ wish co clo so, on
a HJICmlk wet of paper describe - jla'sonGl inseance in wlaich )'OUf JOOCI ;.ulrment 4WI1af uM could '-'e turned inco 11ft acddent II' doae CGil. '" addition, ,_ could describe 11ft inseance of poor,...,._,.,, in wlskh )'OUf decirion led co a doae call, inddaat or acddent. In both inseancu please try co be as specific as ,_ CGn about the ciramueanca l1m'llllftdinc tile incident (...Mt ,_
. were dainr -' '- :JOK ..,C to that point) -' emcdy ..U the aiticdl decision was tlwd led to « awned laur
. problau.
- PlEASE DO NOT WRITE IH THIS AREA
- ,..16 Ill~•••• ·= • :ee :: oc ococ~ cccccc --- •• • •
A16 *U.S. GOVERNMENI' PRIN11NG OFFICE: lftS • "'-t67/28032