Embed Size (px)
Citation preview
7/29/2019 Airline Schedule Competition_ Product-Quality Choice in a Duopoly Model
http://slidepdf.com/reader/full/airline-schedule-competition-product-quality-choice-in-a-duopoly-model 1/32
AIRLINE SCHEDULE COMPETITION: PRODUCT-
QUALITY CHOICE IN A DUOPOLY MODEL
JAN K. BRUECKNER
R ICARDO FLORES-FILLOL
CESIFO WORKING PAPER NO. 1731CATEGORY 9: I NDUSTRIAL ORGANISATION
MAY 2006
An electronic version of the paper may be downloaded
• fromthe SSRN website: www.SSRN.com
• fromthe RePEc website: www.RePEc.org
• fromthe CESifo website: Twww.CESifo-group.deT
7/29/2019 Airline Schedule Competition_ Product-Quality Choice in a Duopoly Model
http://slidepdf.com/reader/full/airline-schedule-competition-product-quality-choice-in-a-duopoly-model 2/32
CESifo Working Paper No. 1731
AIRLINE SCHEDULE COMPETITION: PRODUCT-QUALITY CHOICE IN A DUOPOLY MODEL
Abstract
This paper presents a simple model of airline schedule competition that circumvents the
complexities of the spatial approach used in earlier papers. Consumers choose between twoduopoly carriers, each of which has evenly spaced flights, by comparing the combinations of
fare and expected schedule delay that they offer. In contrast to the spatial approach, the
particular departure times of individual flights are thus not relevant. The model generates a
number of useful comparative-static predictions, while welfare analysis shows that
equilibrium flight frequencies tend to be inefficiently low.
JEL Code: L0, L9.
J an K. BruecknerDepartment of Economics
University of California, Irvine3151 Social Science Plaza
Irvine, CA 92697USA
Ricardo Flores-FillolDepartment of EconomicsUniversity of Barcelona
Building BBellaterra (Barcelona) 08193
April 2006
7/29/2019 Airline Schedule Competition_ Product-Quality Choice in a Duopoly Model
http://slidepdf.com/reader/full/airline-schedule-competition-product-quality-choice-in-a-duopoly-model 3/32
Airline Schedule Competition: Product-Quality Choicein a Duopoly Model
by
Jan K. Brueckner and Ricardo Flores-Fillol*
1. Introduction
Despite the existence of a large theoretical literature analyzing the economics of airline
behavior, little attention has been devoted to a key aspect of airline operations: scheduling
decisions in competitive markets. Since the convenience of airline schedules is a paramount
concern of passengers along with the fares they pay, this omission represents a serious gap in
the theoretical literature.1 The purpose of the present paper is to help fill this gap by analyzing
a simple model of schedule competition in a duopolistic airline market.
The few existing papers on schedule competition mostly take a spatial approach to the
problem. In these models, consumers have a distribution of desired departure times, and
airlines set their flight schedules taking account of this distribution, along with the schedules
of competitors, while also setting fares. In its most general form, the resulting problem is
one of spatial competition, where a long tradition of analysis exists. d’Aspremont et al. (1979)
present the classic treatment of the simplest spatial-competition problem, where two firms each
choose a single location (flight time) along a line while also setting prices. While this problem
is difficult enough, the most general analysis of schedule competition would allow firms to
endogenously choose, in Nash fashion, the number of locations at which they operate (number
of flights), a choice that requires prior computation of the spatial-competition equilibrium for
each possible combination of flight numbers for the two firms.
Because this problem is unmanageable analytically, various simplifying assumptions are
imposed in the papers that analyze spatial schedule competition. Schipper et al. (2003, 2006)
suppress the locational-choice dimension of the problem by assuming that flights are spaced
equally around a circle, with competitors’ flights interleaved to the maximum extent possible.
In the duopoly case, interleaving is perfect when flight numbers are equal (with adjacent flights
1
7/29/2019 Airline Schedule Competition_ Product-Quality Choice in a Duopoly Model
http://slidepdf.com/reader/full/airline-schedule-competition-product-quality-choice-in-a-duopoly-model 4/32
always belonging to different airlines), but otherwise, some adjacent flights belong to the same
firm. By contrast, Lindsey and Tomaszewska’s (1998) analysis eliminates the choice of flight
frequency, with each airline operating a fixed number of flights. Once a consumer has identified
each airline’s best flight from among those it operates, the remaining choice between airlines is
governed by a random utility model. The analysis of the resulting flight-location/fare equilibria
is done numerically.2
To avoid the complexities of spatial models, the present paper takes a non-spatial approach
to analyzing schedule competition. The analysis uses elements of the monopoly scheduling
model of Brueckner (2004) along with the brand-loyalty framework from Brueckner and Whalen
(2000). In Brueckner (2004), consumers must commit to travel before knowing their preferred
departures times, which are uniformly distributed around a circle. Letting T denote the time
circumference of the circle, consumer utility then depends on expected schedule delay,3 which
equals T /4f , where f is number of (evenly spaced) flights operated by the monopoly airline.
Adapting this approach to a competitive setting, the consumer is assumed to compare expected
schedule delays for the two duopoly airlines, T /4f 1 and T /4f 2, along with the fares they charge,
p1 and p2, in making a choice between them. While this approach may not be fully accurate for
individual consumers, it appears to capture the choice setting of a corporate travel department,
which must sign an exclusive contract with a particular airline for transporting its employees.
The travel department cares about the average schedule delay for the company employees,
while also seeking low fares. It signs an exclusive contract with the airline providing the best
combination of these features. Alternatively, the model could apply to individual business
travelers, who cannot predict their travel times and thus purchase refundable full-fare tickets,
which allow them to board the next flight upon arriving at the airport. In either case, the
precise departure times of individual flights are not relevant, accounting for the simplicity of
the overall approach.
Without further assumptions, the airline with the most attractive frequency/fare com-
bination would attract all the passengers in the market. To avoid this outcome, consumers
(corporate travel departments) are presumed to exhibit brand loyalty to particular carriers,
which means that an airline with an inferior frequency/fare combination can still attract some
2
7/29/2019 Airline Schedule Competition_ Product-Quality Choice in a Duopoly Model
http://slidepdf.com/reader/full/airline-schedule-competition-product-quality-choice-in-a-duopoly-model 5/32
passengers. Following Brueckner and Whalen (2000), this approach is formalized by specifying
a utility gain from using airline 1 rather than airline 2, denoted a, and assuming that this gain
is uniformly distributed over the range [−α/2, α/2], so that half the consumers prefer airline
1 and half prefer airline 2. Note that α is a measure of (exogenous) product differentiation in
the sense that a small α implies a small maximum gain from using one airline or the other,
indicating similar products.4
Under the above assumptions, the two carriers compete by choosing both frequencies and
fares to maximize profit. The resulting model is very similar in its broad outlines to the frame-
work used by Heimer and Shy (2006) to study the formation of airline alliances, which they
portray as benefiting passengers via the higher flight frequencies made possible by combining
airline operations. The present model differs, however, by using more-realistic functional forms
and by offering a richer specification of the market setting. These differences will be spelled
out more fully in the ensuing discussion.
The model is also related to the literature on vertical product differentiation, initiated
by Gabszewicz and Thisse (1979) and Shaked and Sutton (1982) and summarized by Tirole
(1988).5 In such models, consumer utility is usually given by λs − p, where s is product
quality and p is price. As seen below, the analogous portion of the utility function in the
present model is −γ/f − p, which differs only in the reciprocal form of the quality measure
(flight frequency). Despite this similarity, the sources of consumer heterogeneity are entirely
different in the two setups. While consumers have different valuations of product quality (λ)
in vertical product-differentiation models, all consumers value flight frequency equally under
the present approach. Heterogeneity arises instead through brand loyalty, which introduces a
consumer-specific additive shift factor (rather than slope variation) into the utility function.
As noted above, the dispersion of this brand-loyalty factor, which ranges over [−α/2, α/2],
captures an exogenous degree of product differentiation that is built into the model rather
than determined in equilibrium.
Because of this difference in the treatment of consumer heterogeneity, equilibria differ in
a fundamental way under the two approaches. In the vertical-differentiation literature, en-
dogenous product differentiation emerges, with one firm choosing the highest possible product
3
7/29/2019 Airline Schedule Competition_ Product-Quality Choice in a Duopoly Model
http://slidepdf.com/reader/full/airline-schedule-competition-product-quality-choice-in-a-duopoly-model 6/32
quality and the other choosing a lower quality, as firms seek to soften price competition.
Consumers select between the two goods according to their valuations of quality. With all
consumers valuing flight frequency equally in the present model, an impetus for the delivery
of different product qualities does not exist. The relevant equilibrium is then symmetric, with
both firms offering identical frequencies, while recognizing that their quality choices affect de-
mand. Note that a symmetric equilibrium is realistic in the airline context, where competing
firms usually offer similar flight frequencies. Observe also that, despite its portrayal of flight-
frequency competition, a model of this type could be applied more generally in other contexts
within industrial organization.
The goal of the paper is to demonstrate the tractability and usefulness of the non-spatial
approach to schedule competition, while also highlighting the general value of this alternative
portrayal of product-quality competition. This goal is achieved by exploring the nature and
comparative-static properties of equilibrium and by carrying out welfare analysis. The plan
of the paper is as follows. Section 2 analyzes the model under the assumption that fares and
flight frequencies are chosen simultaneously by the duopolists. Comparative-static analysis of
the resulting equilibrium is presented, showing how equilibrium fares and frequencies depend
on the various parameters of the model. Because some of the comparative-static effects are
ambiguous in sign, section 3 presents illustrative numerical examples. Section 4 characterizes
the social optimum, comparing optimal frequencies and traffic levels to those emerging in
equilibrium. Section 5 considers sequential (rather than simultaneous) choices of fares and
frequencies, with the frequency choice made first, and compares the resulting equilibrium to
both the simultaneous-choice equilibrium and the social optimum. Section 6 offers conclusions.
2. The Model and the Simultaneous-Choice Equilibrium
2.1. Basic analysis
In the model, utility for a consumer traveling by air is given by c + travel benefit −schedule delay cost, where c is consumption expenditure. Schedule delay cost is equal to
a disutility parameter δ > 0 times the expected schedule delay expression from above, thus
equaling δT /4f i ≡ γ/f i for airline i, i = 1, 2, where γ = δT /4. Travel benefit has two
4
7/29/2019 Airline Schedule Competition_ Product-Quality Choice in a Duopoly Model
http://slidepdf.com/reader/full/airline-schedule-competition-product-quality-choice-in-a-duopoly-model 7/32
components: b, equal to the gain from air travel, and a, the airline brand-loyalty variable from
above, which gives the additional gain from using airline 1 (relative to travel on airline 2).
Recall that a varies across consumers. For consumers using airline i, consumption expenditure
equals y−
pi, where y is income, assumed to be uniform across consumers without loss of
generality, and pi is airline i’s fare. Utility from travel on airline 1 is thus given by y− p1 + b +
a−γ/f 1, and utility from travel on airline 2 is given by the analogous expression with a = 0.6
Assuming that the consumer undertakes air travel, he will choose airline 1 when
y − p1 + b + a − γ/f 1 > y − p2 + b − γ/f 2, (1)
or when
a > p1 − p2 + γ/f 1 − γ/f 2. (2)
Thus, for the consumer to choose airline 1, brand loyalty to 1 must be at least as large as
the fare plus delay-cost difference between airlines 1 and 2. Otherwise, conditional on flying,
the consumer will choose airline 2. As for the air-travel decision itself, the benefit from the
consumer’s “outside option” (the next best alternative) must be considered. That option might
involve not traveling at all, but more realistically, the outside option could be travel using a
different transport mode, such as automobile or train. Whatever its characteristics, the outside
option will be unattractive when the air-travel benefit b is sufficiently high, making the margin
of choice the one between airlines 1 and 2. One group of consumers in the model satisfies
this requirement, having a common high level of the air-travel benefit, denoted bH . This
high-benefit group (denoted type H ) represents a proportion µ of the consumer population.
To use (2) to compute airline 1’s passenger traffic from among the type-H group, let the
consumer population size be normalized to unity, and recall that a is uniformly distributed
over the range [−α/2, α/2]. Then airline 1’s type-H traffic is given by
q H 1 = µ
α/2 p1− p2+γ/f 1−γ/f 2
1
αda, (3)
where 1/α gives the density of a.
5
7/29/2019 Airline Schedule Competition_ Product-Quality Choice in a Duopoly Model
http://slidepdf.com/reader/full/airline-schedule-competition-product-quality-choice-in-a-duopoly-model 8/32
The rest of the population, representing a fraction 1 − µ, has a common low level of the
air-travel benefit, denoted bL. It is assumed that, in equilibrium, a portion of this group ends
up not undertaking air travel, an outcome that is assured when bL and other parameters in
the model take appropriate values (see below). To understand this outcome, let the common
benefit level from the outside option, net of any fare paid or schedule delay incurred, be denoted
g, yielding a utility level of y + g. Then consider a consumer who is indifferent between the
airlines, with a = 0. This individual will prefer the outside option to traveling on airline 1 if
y − p1 + bL − γ/f 1 < y + g, or if bL − g < p1 + γ/f 1, and will prefer the outside option to
traveling on airline 2 if bL−g < p2+ γ/f 2. If both inequalities are satisfied, a type-L consumer
indifferent between the airlines thus will not undertake air travel. But the additional benefit
from airline brand loyalty may tip the balance if it is strong enough. For example, a passenger
loyal to airline 1 will find air travel and the outside option equally attractive when his loyalty
value satisfies y − p1 + bL + a− γ/f 1 = y + g, or a = p1 + γ/f 1 − bL + g.7 Normalizing g to
zero for simplicity, consumers with a values larger than
a = p1 + γ/f 1 − bL (4)
will then strictly prefer travel on airline 1 to the outside option. Since bL < p2 + γ/f 2 holds
by assumption, the inequality in (2) is satisfied for all these passengers, indicating that airline
1 is also preferred to airline 2. Therefore, airline 1’s passenger traffic from among the type-L
group is equal to
q L1 = (1 − µ)
α/2
a
1
αda. (5)
The margin of choice for the type-L group is thus between the preferred airline and the
outside option, while the type-H choice margin is between airlines 1 and 2. Observe, however,
that the relevant margin for a given group is in fact endogenous and dependent on equilibrium
fares and frequencies.8 It is assumed that, in equilibrium, the relevant margins are as indicated.
Carrying out the integration in (3) and (5) and adding the results, airline 1’s total traffic,
6
7/29/2019 Airline Schedule Competition_ Product-Quality Choice in a Duopoly Model
http://slidepdf.com/reader/full/airline-schedule-competition-product-quality-choice-in-a-duopoly-model 9/32
q H 1 + q L1 , is equal to
q 1 =1
2− 1
α
p1 − µp2 + γ/f 1 − µγ/f 2 − (1− µ)bL
, (6)
and airline 2’s traffic is given by the analogous expression with the 1 and 2 subscripts inter-
changed. Note from (6) that airline 1 loses traffic when its fare rises or its frequency falls,
while it gains traffic when p2 rises or f 2 falls. In the first case, type-H traffic is lost to airline
2, and type-L traffic is lost to the outside option. To further interpret (6), suppose that the
entire population is of type H , so that µ = 1. Then, in a symmetric equilibrium, where p1 = p2
and f 1 = f 2, (6) indicates that the airlines each carry traffic of 1/2, equal to half of the total
unitary population (all of which undertakes air travel). When µ < 1, traffic is less than 1/2,
but its magnitude depends on the equilibrium fare and frequency.
To characterize the equilibrium, the airline cost structure, which is symmetric across the
carriers, must be specified. Following Brueckner (2004), an airline operates aircraft with s
seats, with the load factor assumed to equal 100%, so that all seats are filled. A flight’s
operating cost is given by θ + τ s, where θ is a fixed cost independent of aircraft size and τ
is the marginal cost per seat.9 Under this specification, cost per seat realistically falls with
aircraft size. Flight frequency, s and traffic are all related by the equation q = fs, which
says that an airline’s total traffic equals frequency times seats per flight. Thus, while s is
endogenous, its value is determined residually once q and f are known. Viewing f as product
quality, this cost structure presumes that quality has a fixed cost but no associated variable
cost, an assumption that is sometimes used in the vertical product-differentiation literature.
Using the above information and (6), airline 1’s profit is equal to
π1 = p1q 1 − f 1(θ + τ s1)
= p1q 1 − θf 1 − τ q 1
= ( p1 − τ )
1
2− 1
α
p1 − µp2 + γ/f 1 − µγ/f 2 − (1− µ)bL
− θf 1. (7)
Note in the second line of (7) that costs separate into the fixed cost of flights and the variable
cost of seats, which is independent of the number of flights.
7
7/29/2019 Airline Schedule Competition_ Product-Quality Choice in a Duopoly Model
http://slidepdf.com/reader/full/airline-schedule-competition-product-quality-choice-in-a-duopoly-model 10/32
Given that an airline can adjust its flight frequency fairly easily, it may be reasonable
to assume that, in maximizing profit, fares and frequencies are chosen simultaneously. For
comparison purposes, the sequential case (where frequency is chosen first) is considered below.
With simultaneous choice, airline 1 chooses p1 and f 1 to maximize (7), viewing p2 and f 2 as
parametric. The first-order conditions are
∂π1∂p1
=1
2− 1
α
p1 − µp2 + γ/f 1 − µγ/f 2 − (1− µ)bL
− p1 − τ
α= 0 (8)
∂π1
∂f 1= ( p1 − τ )
γ
αf 21
− θ = 0. (9)
The second-order conditions ∂ 2
π1/∂p2
1, ∂ 2
π1/∂f 2
1 < 0 are satisfied by inspection, and theremaining positivity condition on the Hessian determinant is assumed to hold.
With firm symmetry, the symmetric equilibrium is the natural focus, and this equilibrium
is found by setting p1 = p2 = p, f 1 = f 2 = f in (8) and (9) and solving for these common
values. Substituting (9) into (8) and rearranging, the f solution satisfies
αγ/2 + ( 1 − µ)γ (bL − τ )
f − (1− µ)γ 2 = (2− µ)αθf 3, (10)
and the p solution conditional on f is then found by rearranging (9):
p =αθf 2
γ + τ. (11)
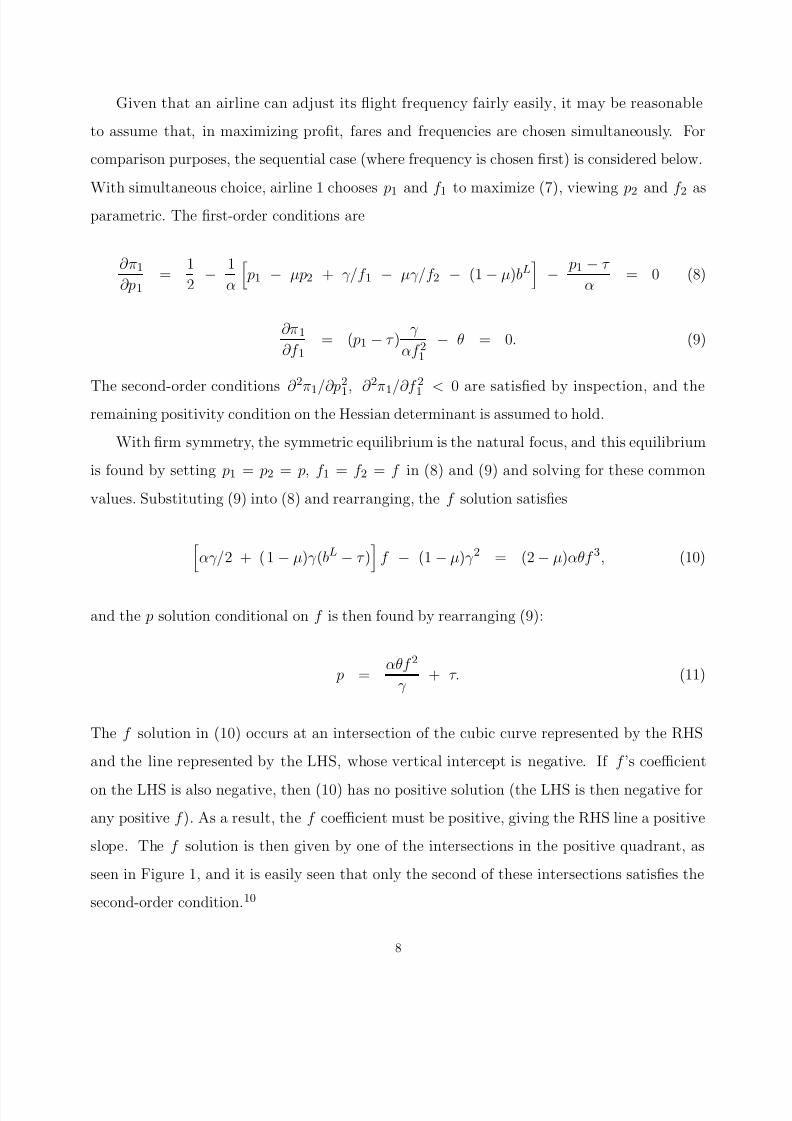
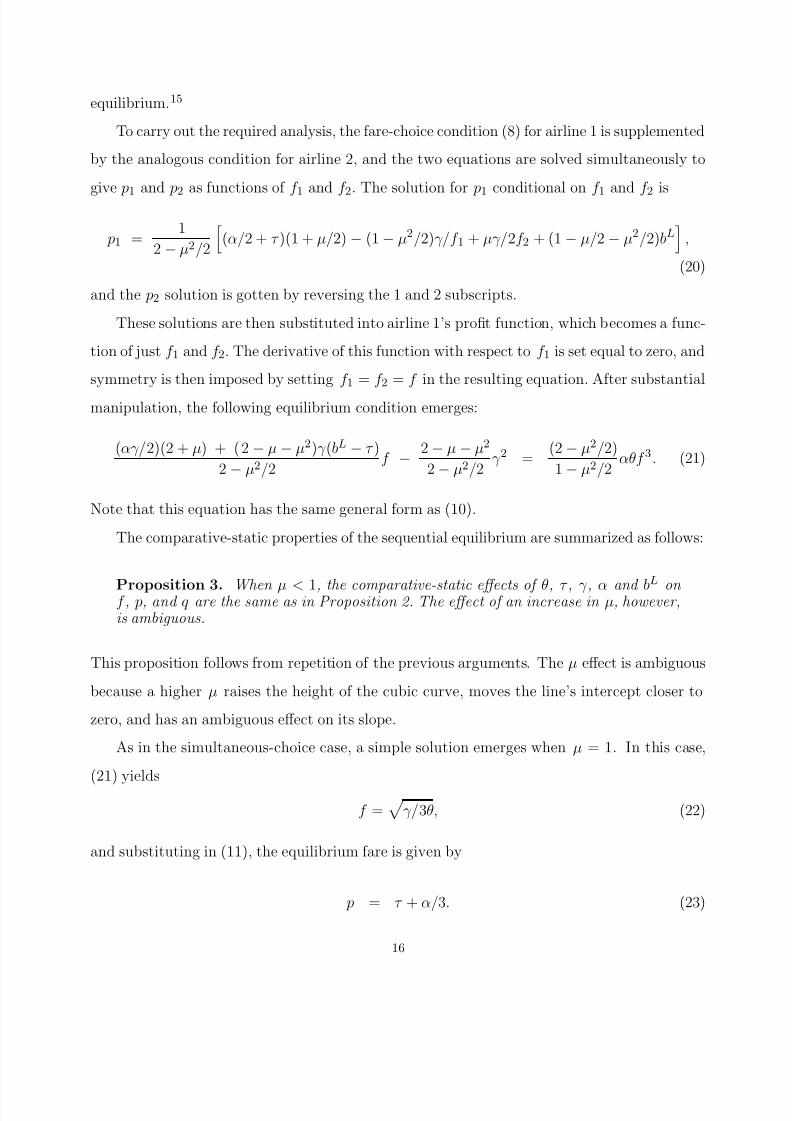
The f solution in (10) occurs at an intersection of the cubic curve represented by the RHS
and the line represented by the LHS, whose vertical intercept is negative. If f ’s coefficient
on the LHS is also negative, then (10) has no positive solution (the LHS is then negative for
any positive f ). As a result, the f coefficient must be positive, giving the RHS line a positive
slope. The f solution is then given by one of the intersections in the positive quadrant, as
seen in Figure 1, and it is easily seen that only the second of these intersections satisfies the
second-order condition.10
8
7/29/2019 Airline Schedule Competition_ Product-Quality Choice in a Duopoly Model
http://slidepdf.com/reader/full/airline-schedule-competition-product-quality-choice-in-a-duopoly-model 11/32
2.2. Comparative statics
To illustrate the properties of the equilibrium, this section presents comparative-static
analysis. To start, it is interesting to consider the solution that emerges when µ = 1, indicating
the absence of type-L consumers. Substituting µ = 1 into (10) and (11) yields
f =
γ/2θ (12)
p = τ + α/2. (13)
Thus, the fare p equals the marginal cost of a seat (τ ) plus a markup that depends on the
degree of product differentiation (α/2). As differentiation disappears (with α converging to
zero), the fare converges to marginal cost, the Bertrand-equilibrium outcome. Frequency f ,
on the other hand, is independent of τ and α but rises with the disutility of schedule delay (γ )
and falls as the fixed flight cost θ rises, both intuitive conclusions. Note that since the entire
population undertakes air travel in the absence of type-L consumers, traffic remains fixed at
1/2 regardless of parameter values.11
To conduct comparative-static analysis when µ < 1, it is useful to rewrite (8) in the
following two different forms, after imposing symmetry:
p =α/2 − (1− µ)(γ/f − bL) + τ
2− µ; q =
p − τ
α. (14)
Compared to (11), the first equation in (14) provides an alternate solution for p in terms of f
that is useful in evaluating comparative-static effects. Once the effect of a parameter change
on p is known, the second equation in (14) is used to determine the impact on traffic. The
analysis can be carried out mostly by inspection, using (14) along with (10), (11) and Figure
1.
An increase in the fixed flight cost θ raises the height of the cubic curve in Figure 1’s
positive quadrant without affecting the line, leading to a decrease in f . While the p effect from
(11) appears ambiguous, (14) shows that p actually falls, as does q . Since costs have risen,
this fare decrease is counterintuitive, but the apparent explanation comes from the decline in
9
7/29/2019 Airline Schedule Competition_ Product-Quality Choice in a Duopoly Model
http://slidepdf.com/reader/full/airline-schedule-competition-product-quality-choice-in-a-duopoly-model 12/32
frequency, which worsens service quality (the drop in traffic in response to higher cost does
make sense, however). Note the contrast to the µ = 1 case, where p is unaffected by the level
of fixed cost. Thus, for θ to affect fares, an air-travel/outside-option margin must exist, so
that total traffic is endogenous rather than fixed at a value of 1/2.When the marginal seat cost τ rises, the slope of the line in Figure 1 falls, reducing f .
However, the changes in both p and q are ambiguous. Recall, by contrast, that a higher τ
leaves f unchanged while unambiguously raising p in the µ = 1 case.
When the disutility of schedule delay (γ ) rises, the slope of the line changes in an ambiguous
direction while its intercept becomes more negative, leading to an ambiguous change in f .
However, as µ approaches 1, the intercept approaches zero and the effect of its change becomes
negligible, while the slope impact becomes unambiguously positive. The positive slope effect
thus dominates the outcome, raising f . While this impact matches intuition, the associated
changes in p and q are ambiguous.
When product differentiation (α) increases, both the slope of the line and the height of
the cubic curve rise, again suggesting an ambiguous effect on f . However when the type-L
travel benefit is low, with τ > bL holding, the net effect is to push the intersection to the right,
raising f .12 From (11) or (14), p rises, while the change in q from (14) is ambiguous. Thus,
when the perceived brand difference between the two airlines widens, flight frequency and the
fare rise provided that bL is less than the marginal cost of a seat, although traffic could rise or
fall.
Given that greater product differentiation should weaken price competition between the
carriers, the emergence of a higher fare makes sense. While this logic also explains the rise
in p when µ = 1, flight frequency is unaffected by the extent of product differentiation in
this case. The difference is again explained by the existence of an air-travel/outside-option
margin when µ < 1. In this case, a higher α, by raising the upper limit of integration in (5),
initially increases the number of type-L consumers choosing air travel. This fact then induces
adjustments in f and q , although the ultimate change in traffic is ambiguous.
When bL rises, the slope of the line in Figure 1 increases, raising f . Using (11) or (14), p
then rises, as does q from (14). Since the increase in bL raises the demand for air travel among
10
7/29/2019 Airline Schedule Competition_ Product-Quality Choice in a Duopoly Model
http://slidepdf.com/reader/full/airline-schedule-competition-product-quality-choice-in-a-duopoly-model 13/32
type-L consumers, these responses also make sense.
Finally, when µ increases, the cubic curve shifts down, while the line’s intercept shifts up
toward zero. If τ > bL, then the line’s slope rises, leading to an increase in f . In this case, (11)
and (14) show that both p and q also rise. Thus, if the air-travel benefit for type-L consumersis low, a decline in their population share raises frequency, the fare and traffic. Otherwise, the
effects are ambiguous.
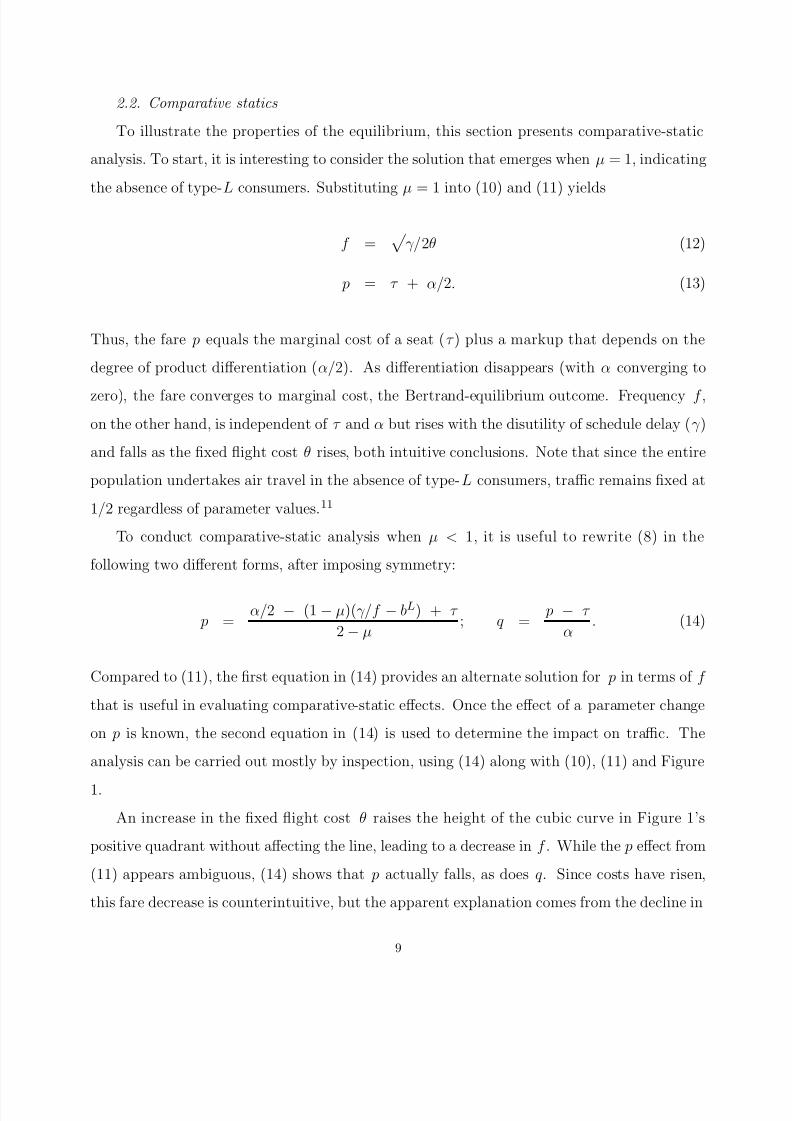
These results are summarized as follows, and in Table 1 (which also shows results for the
µ = 1 case):
Proposition 1. If the population includes some type-L consumers (µ < 1), then:
(i )
Flight frequency falls with an increase in the fixed flight cost or marginal seat cost.Frequency rises with an increase in the disutility of schedule delay (when µ is sufficiently
large ), product differentiation (when τ > bL), the type-L air-travel benefit, or the share
of type-H passengers (when τ > bL).
(ii ) The fare falls with an increase in the fixed flight cost. The fare rises with an increase
in product differentiation (when τ > bL), the type-L air-travel benefit, or the type-H share (when τ > bL).
(iii ) Traffic falls with an increase in the fixed flight cost. Traffic rises with an increase
in the type-L air-travel benefit or the type-H share (when τ > bL).
To provide a sense of the likely directions of those comparative-static effects that are theoret-
ically ambiguous, the next section offers some numerical examples.
3. Numerical Examples
Given the stylized nature of the model, parameter choices are necessarily arbitrary. The
requirement τ > bL from above is imposed, however, and parameters are chosen so that the
critical value of brand loyalty
a above which type-L consumers undertake air travel is less
than α/2, making this set of consumers nonempty (see (5)).13 Given these requirements, the
base-case parameter values are α = 30, bL = 18, γ = 0.2, θ = 25, τ = 20, and µ = 0.5. Note
the type-L air-travel benefit is only slightly greater than the maximum brand-loyalty benefit
(equal to 15). Since bL is measured relative to the benefit g from the outside option, which
is normalized to zero, this small gap is plausible. In addition, the fixed cost θ is of the same
11
7/29/2019 Airline Schedule Competition_ Product-Quality Choice in a Duopoly Model
http://slidepdf.com/reader/full/airline-schedule-competition-product-quality-choice-in-a-duopoly-model 14/32
order of magnitude as the marginal seat cost τ , indicating weak increasing returns, and the
type-L and type-H groups are equal in size. Note finally that the schedule-delay disutility
parameter γ has no natural connection to any of the other parameter values and can be set
independently.Recall that the variable s, seats per flight, is determined residually via choice of f and p
(which together determine q and hence s = q/f ). Since the comparative statics for s are all
analytically ambiguous, numerical results for this variable are presented along with results for
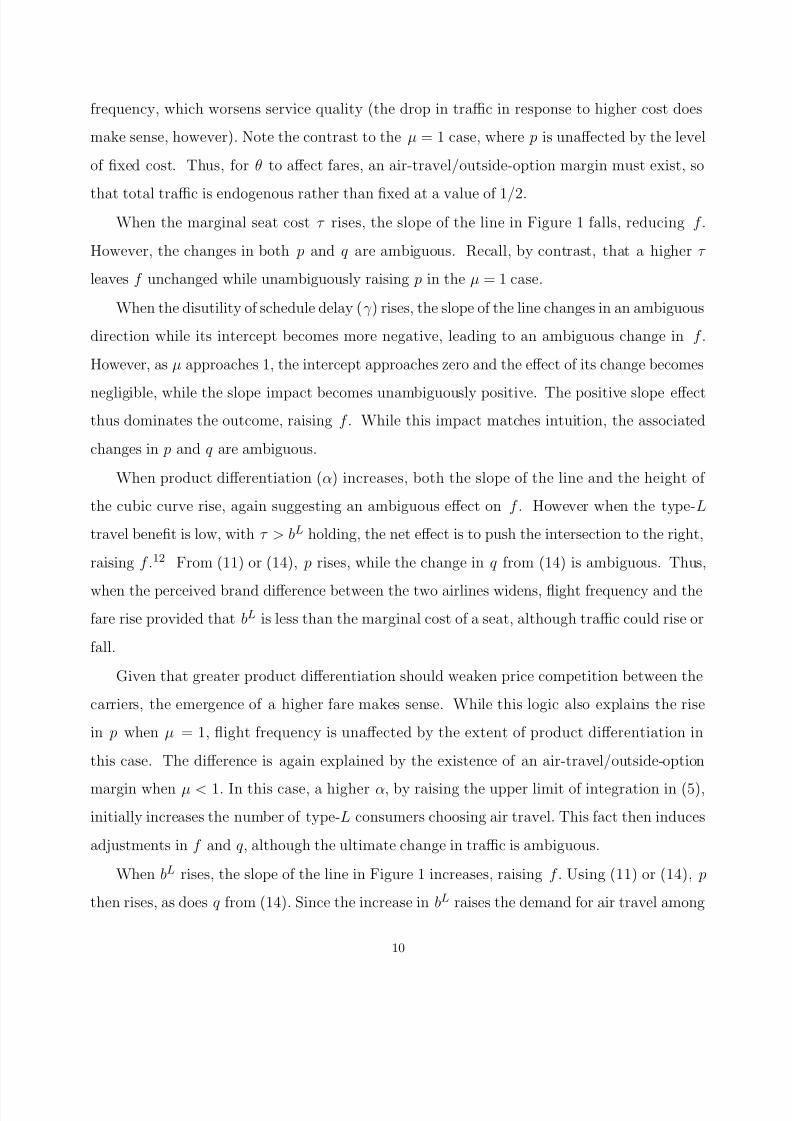
the variables f , p, q and π (profit). The first line of Table 2 shows the base case solution.
While the magnitudes of the solution values are not particularly meaningful, the remainder of
the Table shows how these values change when parameters are altered.
When the fixed cost θ increases from 25 to 26, f , p and q all decline, as in Proposition 1.
In addition, Table 2 shows that the decline in q is proportionally smaller than the decline in
f , so that s = q/f rises, indicating use of larger aircraft. This outcome makes intuitive sense
given the higher fixed cost per flight.
When the marginal cost per seat rises from 20 to 21, f falls, matching the prediction of
Proposition 1. Although the general effects are ambiguous, the fare rises and traffic falls in
the example, an outcome always observed in the computations. Note that, unlike in case of
a fixed-cost increase, which counterintuitively lowers the fare, the positive effect of a higher τ
on p matches intuition. In addition, aircraft size falls, again an intuitive outcome.
When the schedule-delay disutility γ increases from 0.2 to 0.3, frequency rises. While
Proposition 1 predicts this result when µ is sufficiently large, the assumed value of 0.5 is
evidently large enough. In addition, Table 2 shows that γ ’s impacts on the fare and traffic,
ambiguous in general, are both negative in the example, an outcome that emerged in all of
the computations. Aircraft size also falls. Thus, the results suggest that a greater dislike of
schedule delay leads to more-frequent, less-expensive flights on smaller aircraft.
When product differentiation rises (with α increasing from 30 to 31), all the solution values
increase. The higher values of f , p, and q are consistent with Proposition 1 given τ > bL. Since
the increase in traffic is proportionally greater than the increase in frequency, s rises, so that
larger aircraft are used.
12
7/29/2019 Airline Schedule Competition_ Product-Quality Choice in a Duopoly Model
http://slidepdf.com/reader/full/airline-schedule-competition-product-quality-choice-in-a-duopoly-model 15/32
When the type-L air-travel benefit bL rises from 18 to 19, all the solution values increase,
results that are again consistent with Proposition 1. Aircraft size s again rises, a conclusion
consistent with the demand increase reflected in the higher bL.
Finally, when the type-H share rises from 0.5 to 0.55, all the solution values increase, an
outcome consistent with Proposition 1 given τ > bL. Note that the increase in aircraft size
again reflects the demand increase associated with a higher µ.
As for the profit changes, all are consistent with predicted effects, which can be computed
as partial derivatives of the π function in (7), using the envelope theorem.
4. The Social Optimum
With the comparative-static properties of the equilibrium understood, attention now shifts
to welfare analysis, where a social planner chooses flight frequency and traffic. Social surplus is
computed as the sum of total utility and airline profit. Letting a∗ denote the air-travel/outside-
option loyalty margin for type-L consumers, as chosen by the planner, total utility can be
written
U = 2µ
α/20
(y − p + bH + a − γ/f )1
αda
+ 2(1 − µ) α/2a∗
(y − p + bL + a − γ/f )1
α da +a∗y
α . (15)
Note that the 2 factors in (15) are needed because two airlines are present, and that the last
term inside the brackets captures utility for type-L consumers choosing the outside option.
Total airline profit is given by
2π = 2
( p− τ )
µ
1
2+ (1− µ)
1
2− a∗
α − θf
, (16)
where (1−µ)(1/2−a∗/α) gives the number of type-L passengers per airline. Carrying out the
integration in (15) and adding (16), surplus is equal to
W = y + µα
4+ (1− µ)
α
4− a∗2
α
+ µbH + (1− µ)
1 − a∗
α/2
bL
13
7/29/2019 Airline Schedule Competition_ Product-Quality Choice in a Duopoly Model
http://slidepdf.com/reader/full/airline-schedule-competition-product-quality-choice-in-a-duopoly-model 16/32
− (τ + γ/f )
µ + (1− µ)
1 − a∗
α/2
− 2θf. (17)
Note that bL’s coefficient equals the total number of type-L passengers, so that the last two
terms in the first line of (17) give aggregate air-travel benefits. The last line gives flight costs
plus the cost of schedule delay, and the second term in the first line gives total brand-loyalty
benefits for type-H passengers (their population share times average benefits of α/4). The
third term gives the same quantity for type-L passengers.14
The first-order condition for choice of a∗ reduces to
a∗ = τ + γ/f − bL, (18)
indicating that, for the marginal type-L air traveler, the benefits from air travel and brand
loyalty are exactly balanced by the marginal seat cost seat plus the disutility from schedule
delay. The condition for choice of f is 2θ − (γ/f 2)[1 − (1− µ)2a∗/α] = 0, and substituting
(18) and rearranging, it reduces to
αγ/2 + ( 1− µ)γ (bL − τ )
f − (1− µ)γ 2 = αθf 3. (19)
Using these conditions, the social optimum and equilibrium are easily compared. Note
first that (19) is identical to the equilibrium condition (10) except for the absence of the 2 − µ
coefficient multiplying f 3. Thus, the cubic curve in (19) is lower than the cubic curve in
the equilibrium condition as long as µ < 1, while the curves coincide when µ = 1. As a
result, the socially optimal flight frequency is higher than the equilibrium frequency as long
the population contains some type-L consumers. If everyone is of type-H , the equilibrium
frequency is optimal, with both equaling γ/2θ.
In addition, when µ < 1, the equilibrium number of type-L consumers undertaking
air travel is too small. To see this conclusion, recall from (4) that the equilibrium air-
travel/outside-option margin for type-L consumers equals a = p + γ/f − bL. Since p > τ
from (11) and since the equilibrium frequency is too low, it follows from (18) that a∗ < a.
14
7/29/2019 Airline Schedule Competition_ Product-Quality Choice in a Duopoly Model
http://slidepdf.com/reader/full/airline-schedule-competition-product-quality-choice-in-a-duopoly-model 17/32
Thus, at the optimum, an additional group of type-L consumers with relatively low brand
loyalties ends up undertaking air travel. Note that when µ = 1, the entire population under-
takes air travel both at the optimum and in equilibrium, so that no consumers are inefficiently
excluded.Summarizing these results yields
Proposition 2. If the population includes some type-L consumers, then the equilib-rium has inefficiently low flight frequency and too few type-L air travelers. If the entire population is of type H , then the equilibrium is efficient.
As was shown in the analysis of section 2, the comparative-static properties of the equi-
librium differ markedly between the µ = 1 and µ < 1 cases. Proposition 2 shows that the
same conclusion applies to its efficiency properties. The proposition shows that equilibrium is
inefficient only in the case where airline market power affects total traffic (i.e., when an air-
travel/outside-option margin exists). In this case, each airline has effective monopoly power
over its type-L passengers, whose next best choice is the outside option. In a familiar fashion,
this monopoly power leads to a suboptimal level of traffic and a corresponding underprovision
of frequency. By contrast, when µ = 1, the exercise of market power only affects the division of
a fixed amount of traffic between the carriers, and inefficiency disappears. In this case, airlines
exert no monopoly power over any passenger, although they can still affect the division of the
fixed traffic pool by their choices of fares and frequencies. This difference between the two
cases also accounts for the divergence in comparative-static results between them, as seen in
Table 1.
5. The Sequential-Choice Equilibrium
While the analysis in section 2 assumed simultaneous choice of fares and frequencies,
arguing that both variables are easily adjusted, it could be argued that fares can be adjusted
more quickly than frequencies. If this view is appropriate, then a sequential-choice model,
where frequency is chosen before fares, may be more realistic. In such a model, fares are
chosen conditional on frequencies in a second stage, with frequencies chosen in a first stage
taking into account their second-stage fare impacts. The outcome is a subgame perfect Nash
15
7/29/2019 Airline Schedule Competition_ Product-Quality Choice in a Duopoly Model
http://slidepdf.com/reader/full/airline-schedule-competition-product-quality-choice-in-a-duopoly-model 18/32
equilibrium.15
To carry out the required analysis, the fare-choice condition (8) for airline 1 is supplemented
by the analogous condition for airline 2, and the two equations are solved simultaneously to
give p1 and p2 as functions of f 1 and f 2. The solution for p1 conditional on f 1 and f 2 is
p1 =1
2 − µ2/2
(α/2 + τ )(1 + µ/2) − (1− µ2/2)γ/f 1 + µγ/2f 2 + (1− µ/2− µ2/2)bL
,
(20)
and the p2 solution is gotten by reversing the 1 and 2 subscripts.
These solutions are then substituted into airline 1’s profit function, which becomes a func-
tion of just f 1 and f 2. The derivative of this function with respect to f 1 is set equal to zero, and
symmetry is then imposed by setting f 1 = f 2 = f in the resulting equation. After substantial
manipulation, the following equilibrium condition emerges:
(αγ/2)(2 + µ) + ( 2− µ− µ2)γ (bL − τ )
2 − µ2/2f − 2− µ − µ2
2− µ2/2γ 2 =
(2− µ2/2)
1− µ2/2αθf 3. (21)
Note that this equation has the same general form as (10).
The comparative-static properties of the sequential equilibrium are summarized as follows:
Proposition 3. When µ < 1, the comparative-static effects of θ, τ , γ , α and bL
on f , p, and q are the same as in Proposition 2. The effect of an increase in µ, however,is ambiguous.
This proposition follows from repetition of the previous arguments. The µ effect is ambiguous
because a higher µ raises the height of the cubic curve, moves the line’s intercept closer to
zero, and has an ambiguous effect on its slope.
As in the simultaneous-choice case, a simple solution emerges when µ = 1. In this case,
(21) yields
f =
γ/3θ, (22)
and substituting in (11), the equilibrium fare is given by
p = τ + α/3. (23)
16
7/29/2019 Airline Schedule Competition_ Product-Quality Choice in a Duopoly Model
http://slidepdf.com/reader/full/airline-schedule-competition-product-quality-choice-in-a-duopoly-model 19/32
Note that frequency is smaller than in the simultaneous-choice case (compare (12)), and that
the fare involves a smaller markup over marginal seat cost (compare (13)).
While the sequential frequency will remain smaller, by continuity, when µ is close to 1,
this relationship cannot be established for arbitrary µ > 0. However, since the sequential andsimultaneous f ’s are identical for µ = 0,16 it seems likely that the sequential f never rises
above the simultaneous value, a conclusion that is confirmed in all of the computations.
Rather than being socially optimal, as before, the equilibrium frequency is too small in the
sequential case when µ = 1 (
γ/3θ vs.
γ/2θ). Underprovision of frequency also occurs when
µ < 1 provided that the sequential case has the smaller equilibrium f . Since the simultaneous-
choice f is then larger as well as inefficiently low by Proposition 2, the result follows. Note that
underprovision of frequency, if it occurs, would also be accompanied by inefficiently low trafficin the sequential case, given that a∗ < a would continue to hold in the sequential equilibrium.
Summarizing the preceding discussion yields
Proposition 4. When frequencies and fares are chosen sequentially and µ = 1, the equilibrium frequency is smaller than in the simultaneous-choice case, and numerical results suggest that this conclusion is likely to hold when 0 < µ < 1. Under these circumstances, the sequential-choice frequency is inefficiently low, and traffic is toosmall when µ < 1.
6. Conclusion
This paper has presented a simple model of airline schedule competition that circumvents
the complexities of the spatial approach used in earlier papers. The framework also has gen-
eral applicability outside the airline context, offering a different approach to product-quality
competition than the usual vertical-differentiation model. The analysis generates a number
of useful comparative-static predictions, while also showing that equilibrium flight frequencies
tend to be inefficiently low.
While the paper has been devoted to exploring the properties of the model, the non-spatial
approach to schedule competition is ripe for applications to particular issues in the airline
industry. As mentioned above, Heimer and Shy (2006) use this type of model to study airline
alliances, and other applications might be fruitful. For example, Brueckner and Girvin (2006)
17
7/29/2019 Airline Schedule Competition_ Product-Quality Choice in a Duopoly Model
http://slidepdf.com/reader/full/airline-schedule-competition-product-quality-choice-in-a-duopoly-model 20/32
use a version of the model to study the effect of airport noise regulation on flight frequency and
aircraft “quietness” in a competitive setting, and the model could also be used in an analysis
of airport congestion pricing.
Although the analysis is carried out in the airline context, the approach applies in other
transportation settings where scheduling matters. The model, for example, could apply to the
market for intercity bus transportation, or to any type of cargo market, where frequency of
service is often a concern of shippers. Finally, variants of the model could be used to analyze
quality competition in other industries.
18
7/29/2019 Airline Schedule Competition_ Product-Quality Choice in a Duopoly Model
http://slidepdf.com/reader/full/airline-schedule-competition-product-quality-choice-in-a-duopoly-model 21/32
2112 γ µτγ µαγ )()]()(/[ −−−−+ f b
L
32 f αθµ)( −
f
Figure 1: The f solution
7/29/2019 Airline Schedule Competition_ Product-Quality Choice in a Duopoly Model
http://slidepdf.com/reader/full/airline-schedule-competition-product-quality-choice-in-a-duopoly-model 22/32
Table 1Comparative-Static E¤ects
( = 1 case in parentheses)
VariableParameter f (freq.) p (fare) q (tra¢c)
(…xed cost) () (0) (0) (seat cost) (0) ? (+) ? (0) (delay disutility)* + (+) ? (0) ? (0) (product di¤erentiation)** + (0) + (+) ? (0)
bL
(type-L bene…t) + (0) + (0) + (0) (type-H share)** + (0) + (0) + (0)
* < 1 e¤ects require su¢ciently large.
** < 1 e¤ects require > bL.
7/29/2019 Airline Schedule Competition_ Product-Quality Choice in a Duopoly Model
http://slidepdf.com/reader/full/airline-schedule-competition-product-quality-choice-in-a-duopoly-model 23/32
Table 2Numerical Examples for the Simultaneous Case
Cases f (freq.) p (fare) q (tra¢c) s (seats) (pro…ts)
Base 0:046 27:880 0:263 5:730 0:923" ( = 26) 0:045 () 27:847 () 0:262 () 5:831 (+) 0:886 () " ( = 21) 0:045 () 28:510 (+) 0:250 () 5:594 () 0:761 () " ( = 0:3) 0:055 (+) 27:509 () 0:250 () 4:567 () 0:509 () " ( = 31) 0:046 (+) 28:219 (+) 0:265 (+) 5:757 (+) 1:028 (+)
bL
" (bL
= 19) 0:047 (+) 28:245 (+) 0:275 (+) 5:861 (+) 1:094 (+)" ( = 0:55) 0:047 (+) 28:414 (+) 0:280 (+) 5:921 (+) 1:175 (+)
Base case: = 25; = 20; = 0:2; = 30; bL= 18 and = 0:5:
7/29/2019 Airline Schedule Competition_ Product-Quality Choice in a Duopoly Model
http://slidepdf.com/reader/full/airline-schedule-competition-product-quality-choice-in-a-duopoly-model 24/32
References
Brueckner, J.K., 2004. Network structure and airline scheduling, Journal of Industrial Economics 52, 291-312.
Brueckner, J.K., Whalen, T., 2000. The price effects of international airline alliances,Journal of Law and Economics 43, 503-545.
Brueckner, J.K., Zhang, Y., 2001. A model of scheduling in airline networks: How a hub-and-spoke system affects flight frequency, fares and welfare, Journal of Transport Economics and Policy 35, 195-222.
Brueckner, J.K., Girvin, R., 2006. Airport noise regulation, airline service quality, and
social welfare, unpublished paper, University of California, Irvine.
Choi, C.J., Shin, H.S., 1992. A comment on a model of vertical product differentiation,Journal of Industrial Economics 40, 229-231.
d’Aspremont, C., Gabszewicz, J., Thisse, J.-F., 1979. On Hotelling’s stability in com-petition, Econometrica 47, 1045-1050.
Encaoua, D., Moreaux, M., Perrot, A., 1996. Compatibility and competition in air-lines: Demand side network effects, International Journal of Industrial Organization 14,701-726.
Gabszewicz, J.J., Thisse, J.-F., 1979. Price competition, quality, and income distribution,Journal of Economic Theory 20, 340-359.
Heimer, O., Shy, O., 2006. Code-sharing agreements, frequency of flights, and profitsunder parallel operation, In: D. Lee (Ed.), Advances in Airline Economics , Vol. 1, Elsevier,Amsterdam.
Lindsey, R., Tomaszewska, E., 1998. Schedule competition, fare competition and preda-tion in a duopoly airline market, unpublished paper, University of Alberta.
Morrison, S.A., Winston, C., 1995. The Evolution of the Airline Industry , BrookingsInstitution, Washington, D.C.
Panzar, J.C., 1979. Equilibrium and welfare in unregulated airline markets, American Eco-
nomic Review 69, 92-95.
Salop, S.C., 1979. Monopolistic competition with outside goods, Bell Journal of Economics
19
7/29/2019 Airline Schedule Competition_ Product-Quality Choice in a Duopoly Model
http://slidepdf.com/reader/full/airline-schedule-competition-product-quality-choice-in-a-duopoly-model 25/32
10, 141-156.
Schipper, Y., Nijkamp, P., Rietveld, P., 2003. Airline deregulation and external costs:A welfare analysis, Tranportation Research Part B 37, 699-718.
Schipper, Y., Nijkamp, P., Rietveld, P., 2006. Deregulation and welfare in airlinemarkets: An analysis of frequency equilibria, European Journal of Operations Research ,forthcoming.
Shaked, A., Sutton, J., 1982. Relaxing price competition through product differentiation,Review of Economic Studies 49, 3-13.
Tirole, J., 1988. The Theory of Industrial Organization , MIT Press, Cambridge.
Wauthy, X., 1996. Quality choice in models of vertical differentiation, Journal of Industrial
Economics 44, 345-353.
20
7/29/2019 Airline Schedule Competition_ Product-Quality Choice in a Duopoly Model
http://slidepdf.com/reader/full/airline-schedule-competition-product-quality-choice-in-a-duopoly-model 26/32
Footnotes
∗Flores-Fillol acknowledges financial support from the Spanish Ministry of Education andScience (fellowship SEC2002-02506 and research grant BEC2003-01132) and Generalitat deCatalunya (research grant 2005SGR00836). We thank Robert Larner for a helpful sugges-tion, Jiawei Chen and Jun Ishii for guidance on some of the relevant literature, and RobinLindsey, Ines Macho-Stadler and Xavier Martınez-Giralt for comments.
1Estimates by Morrison and Winston (1995) show that the increase in flight frequenciesfollowing U.S. airline deregulation has generated cumulative consumer benefits in excess of $10 billion, testifying to the importance of airline scheduling decisions.
2
Using a spatial approach, Brueckner and Zhang (2001) analyze a scheduling model for amonopoly airline, with the goal of understanding how network structure affects flight fre-quencies. By contrast, Panzar (1979) uses a spatial model to analyze frequency equilibriawhen each airline operates a single flight. Since free entry along with a zero-profit conditiondetermines equilibrium flight frequency, his model does not depict schedule competition.Salop (1979) presents a similar but more-general model of monopolistic competition in a cir-cular spatial market. Firm locations are interpreted as product brands, but they could alsobe viewed as flight departure times in the case where each airline offers a single flight. In an-other analysis of scheduling, Encaoua et al. (1996) analyze the strategic choice of departuretimes for two airlines when one relies on connecting traffic from the other.
3Schedule delay is the difference between the preferred and actual departure times.
4The variation in brand loyalty across consumers could be viewed as adding a spatial elementto the model, but the key to the analysis is its nonspatial treatment of flight frequencies.
5See Choi and Shin (1992) and Wauthy (1996) for more-recent contributions.
6Heimer and Shy (2006) assume that consumer utility equals f − p plus a brand-loyalty elementthat, though different in form, is ultimately equivalent to that in the present specification.
While convenient, the linear form of f in their utility function is difficult to justify from firstprinciples.
7While a represents the gain from traveling on airline 1 relative to airline 2, the above conditionrequires measurement of the absolute gain from traveling on 1. For an easy transitionbetween the relative and absolute cases, it is assumed that when a > 0, the absolute gain fromusing airline 1 equals a itself while the absolute gain from airline 2 equals zero. Conversely,
21
7/29/2019 Airline Schedule Competition_ Product-Quality Choice in a Duopoly Model
http://slidepdf.com/reader/full/airline-schedule-competition-product-quality-choice-in-a-duopoly-model 27/32
when a < 0, the absolute gain from airline 1 equals 0 while the absolute gain from airline 2equals a itself.
8If both bH and bL are sufficiently large, the airline 1-2 margin could be relevant for both
the type-H and type-L groups, or the air-travel/outside-option margin could be relevant forboth groups if both benefit levels are low. However, the relevant margins for the groupscannot be the reverse of the ones assumed in the text. In contrast to the present setup,Heimer and Shy (2006) assume homogeneous travel benefits and distinguish between twotypes of equilibria: one where all consumers undertake air travel and the relevant margin isbetween airlines 1 and 2, and another where the margin is between air travel and the outsideoption. Although some of the details are different, Brueckner (2004) effectively considersthis latter case, where each airline operates as a monopolist.
9By contrast, Heimer and Shy (2006) assume that the cost per flight is given by θf + τ s, so
that fixed cost is increasing in the number of flights, a specification that could be viewed asless natural than the present one.
10Alternatively, a single intersection (representing a tangency) might arise, or no intersectionmight occur in the positive quadrant, in which case a meaningful solution does not exist.To see that the second intersection is relevant when two intersections are present, note thatpositivity of the Hessian determinant can be shown to require p−τ −γ/4f > 0 or 4αθf 3 > γ 2
using (9) (the firm subscript is dropped). Then observe that, for the second intersection tobe relevant, the slope of the cubic curve must exceed the slope of line at the solution, sothat (2−µ)3αθf 3 > [αγ/2 + ( 1− µ)γ (bL− τ )]f . Substituting on the RHS of this inequalityfrom (10), and rearranging yields [(2
−µ)/(1
−µ)]2αθf 3 > γ 2. Since (2
−µ)/(1
−µ)≥
2,the positive-determinant condition implies satisfaction of this last inequality, yielding thedesired conclusion.
11For all type-H consumers to undertake air travel while some type-L consumers do not, theinequalities bL < p + γ/f < bH must hold. When µ = 1, only the second of these inequalitiesis relevant, and substituting from (12) and (13), it reduces to τ + α/2 +
√ 2γθ < bH . Since
closed-form f and p solutions are not available when µ < 1, the inequalities in bL < p+γ/f <bH cannot be rewritten in terms of parameter values in this case. However, when µ is closeto 1, the p and f solutions will be close to those in (12) and (13). As a result, it followsthat, if bL lies well below τ + α/2 +
√ 2γθ while bH lies well above it, the assumed type-H
and type-L travel patterns will emerge when µ is close to 1.
12To see this conclusion, subtract the RHS of (10) from the LHS and differentiate the resultingexpression (call it Ω) with respect to α, which yields (γ/2)f − (2− µ)θf 3. If this expressionis negative or zero, then inspection of (10) shows that Ω itself must also be negative as longas τ > bL, when in fact Ω = 0 must hold at a solution. Therefore, the above derivativemust be positive when τ > bL, indicating that Ω is increasing in α. This conclusion in turn
22
7/29/2019 Airline Schedule Competition_ Product-Quality Choice in a Duopoly Model
http://slidepdf.com/reader/full/airline-schedule-competition-product-quality-choice-in-a-duopoly-model 28/32
implies that f is also increasing in α when τ > bL.
13Recalling that
a = p + γ/f − bL and using (14) to eliminate p, this requirement translates
into the inequality [(1−µ)αγ/2+γ (bL−τ )]f −γ 2 > 0. Note that while the LHS of condition(10) must be positive at a solution, the latter condition is more stringent. In other words,its satisfaction implies positivity of the LHS of (10), but not vice versa.
14The term in brackets equals average type-L loyalty benefits, 2 α/2a∗ (a/α)da.
15Heimer and Shy (2006) analyze the sequential case.
16When µ = 0, the airlines are pure monopolists, which means that sequential and simultaneouschoices of p and f must give the same solutions.
23
7/29/2019 Airline Schedule Competition_ Product-Quality Choice in a Duopoly Model
http://slidepdf.com/reader/full/airline-schedule-competition-product-quality-choice-in-a-duopoly-model 29/32
CESifo Working Paper Series (for full list see Twww.cesifo-group.de) T
___________________________________________________________________________
1665 Samuel Muehlemann and Stefan C. Wolter, Regional Effects on Employer Provided
Training: Evidence from Apprenticeship Training in Switzerland, February 2006
1666 Laszlo Goerke, Bureaucratic Corruption and Profit Tax Evasion, February 2006
1667 Ivo J. M. Arnold and Jan J. G. Lemmen, Inflation Expectations and Inflation
Uncertainty in the Eurozone: Evidence from Survey Data, February 2006
1668 Hans Gersbach and Hans Haller, Voice and Bargaining Power, February 2006
1669 Françoise Forges and Frédéric Koessler, Long Persuasion Games, February 2006
1670 Florian Englmaier and Markus Reisinger, Information, Coordination, and the
Industrialization of Countries, February 2006
1671 Hendrik Hakenes and Andreas Irmen, Something out of Nothing? Neoclassical Growth
and the ‘Trivial’ Steady State, February 2006
1672 Torsten Persson and Guido Tabellini, Democracy and Development: The Devil in the
Details, February 2006
1673 Michael Rauber and Heinrich W. Ursprung, Evaluation of Researchers: A Life Cycle
Analysis of German Academic Economists, February 2006
1674 Ernesto Reuben and Frans van Winden, Reciprocity and Emotions when Reciprocators
Know each other, February 2006
1675 Assar Lindbeck and Mats Persson, A Model of Income Insurance and Social Norms,
February 2006
1676 Horst Raff, Michael Ryan and Frank Staehler, Asset Ownership and Foreign-Market
Entry, February 2006
1677 Miguel Portela, Rob Alessie and Coen Teulings, Measurement Error in Education and
Growth Regressions, February 2006
1678 Andreas Haufler, Alexander Klemm and Guttorm Schjelderup, Globalisation and the
Mix of Wage and Profit Taxes, February 2006
1679 Kurt R. Brekke and Lars Sørgard, Public versus Private Health Care in a National
Health Service, March 2006
1680 Dominik Grafenhofer, Christian Jaag, Christian Keuschnigg and Mirela Keuschnigg,Probabilistic Aging, March 2006
7/29/2019 Airline Schedule Competition_ Product-Quality Choice in a Duopoly Model
http://slidepdf.com/reader/full/airline-schedule-competition-product-quality-choice-in-a-duopoly-model 30/32
1681 Wladimir Raymond, Pierre Mohnen, Franz Palm and Sybrand Schim van der Loeff,
Persistence of Innovation in Dutch Manufacturing: Is it Spurious?, March 2006
1682 Andrea Colciago, V. Anton Muscatelli, Tiziano Ropele and Patrizio Tirelli, The Role of
Fiscal Policy in a Monetary Union: Are National Automatic Stabilizers Effective?,March 2006
1683 Mario Jametti and Thomas von Ungern-Sternberg, Risk Selection in Natural Disaster
Insurance – the Case of France, March 2006
1684 Ken Sennewald and Klaus Waelde, “Itô’s Lemma“ and the Bellman Equation for
Poisson Processes: An Applied View, March 2006
1685 Ernesto Reuben and Frans van Winden, Negative Reciprocity and the Interaction of
Emotions and Fairness Norms, March 2006
1686 Françoise Forges, The Ex Ante Incentive Compatible Core in Exchange Economies
with and without Indivisibilities, March 2006
1687 Assar Lindbeck, Mårten Palme and Mats Persson, Job Security and Work Absence:
Evidence from a Natural Experiment, March 2006
1688 Sebastian Buhai and Coen Teulings, Tenure Profiles and Efficient Separation in a
Stochastic Productivity Model, March 2006
1689 Gebhard Kirchgaessner and Silika Prohl, Sustainability of Swiss Fiscal Policy, March
2006
1690 A. Lans Bovenberg and Peter Birch Sørensen, Optimal Taxation and Social Insurance in
a Lifetime Perspective, March 2006
1691 Moritz Schularick and Thomas M. Steger, Does Financial Integration Spur Economic
Growth? New Evidence from the First Era of Financial Globalization, March 2006
1692 Burkhard Heer and Alfred Maussner, Business Cycle Dynamics of a New Keynesian
Overlapping Generations Model with Progressive Income Taxation, March 2006
1693 Jarko Fidrmuc and Iikka Korhonen, Meta-Analysis of the Business Cycle Correlation
between the Euro Area and the CEECs, March 2006
1694 Steffen Henzel and Timo Wollmershaeuser, The New Keynesian Phillips Curve and the
Role of Expectations: Evidence from the Ifo World Economic Survey, March 2006
1695 Yin-Wong Cheung, An Empirical Model of Daily Highs and Lows, March 2006
1696 Scott Alan Carson, African-American and White Living Standards in the 19th Century
American South: A Biological Comparison, March 2006
1697 Helge Berger, Optimal Central Bank Design: Benchmarks for the ECB, March 2006
7/29/2019 Airline Schedule Competition_ Product-Quality Choice in a Duopoly Model
http://slidepdf.com/reader/full/airline-schedule-competition-product-quality-choice-in-a-duopoly-model 31/32
1698 Vjollca Sadiraj, Jan Tuinstra and Frans van Winden, On the Size of the Winning Set in
the Presence of Interest Groups, April 2006
1699 Martin Gassebner, Michael Lamla and Jan-Egbert Sturm, Economic, Demographic and
Political Determinants of Pollution Reassessed: A Sensitivity Analysis, April 2006
1700 Louis N. Christofides and Amy Chen Peng, Major Provisions of Labour Contracts and
their Theoretical Coherence, April 2006
1701 Christian Groth, Karl-Josef Koch and Thomas M. Steger, Rethinking the Concept of
Long-Run Economic Growth, April 2006
1702 Dirk Schindler and Guttorm Schjelderup, Company Tax Reform in Europe and its
Effect on Collusive Behavior, April 2006
1703 Françoise Forges and Enrico Minelli, Afriat’s Theorem for General Budget Sets, April2006
1704 M. Hashem Pesaran, Ron P. Smith, Takashi Yamagata and Liudmyla Hvozdyk,
Pairwise Tests of Purchasing Power Parity Using Aggregate and Disaggregate Price
Measures, April 2006
1705 Piero Gottardi and Felix Kubler, Social Security and Risk Sharing, April 2006
1706 Giacomo Corneo and Christina M. Fong, What’s the Monetary Value of Distributive
Justice?, April 2006
1707 Andreas Knabe, Ronnie Schoeb and Joachim Weimann, Marginal Employment
Subsidization: A New Concept and a Reappraisal, April 2006
1708 Hans-Werner Sinn, The Pathological Export Boom and the Bazaar Effect - How to
Solve the German Puzzle, April 2006
1709 Helge Berger and Stephan Danninger, The Employment Effects of Labor and Product
Markets Deregulation and their Implications for Structural Reform, May 2006
1710 Michael Ehrmann and Marcel Fratzscher, Global Financial Transmission of MonetaryPolicy Shocks, May 2006
1711 Carsten Eckel and Hartmut Egger, Wage Bargaining and Multinational Firms in General
Equilibrium, May 2006
1712 Mathias Hoffmann, Proprietary Income, Entrepreneurial Risk, and the Predictability of
U.S. Stock Returns, May 2006
1713 Marc-Andreas Muendler and Sascha O. Becker, Margins of Multinational Labor
Substitution, May 2006
1714 Surajeet Chakravarty and W. Bentley MacLeod, Construction Contracts (or “How to
Get the Right Building at the Right Price?”), May 2006
7/29/2019 Airline Schedule Competition_ Product-Quality Choice in a Duopoly Model
http://slidepdf.com/reader/full/airline-schedule-competition-product-quality-choice-in-a-duopoly-model 32/32
1715 David Encaoua and Yassine Lefouili, Choosing Intellectual Protection: Imitation, Patent
Strength and Licensing, May 2006
1716 Chris van Klaveren, Bernard van Praag and Henriette Maassen van den Brink,
Empirical Estimation Results of a Collective Household Time Allocation Model, May2006
1717 Paul De Grauwe and Agnieszka Markiewicz, Learning to Forecast the Exchange Rate:
Two Competing Approaches, May 2006
1718 Sijbren Cnossen, Tobacco Taxation in the European Union, May 2006
1719 Marcel Gérard and Fernando Ruiz, Interjurisdictional Competition for Higher Education
and Firms, May 2006
1720 Ronald McKinnon and Gunther Schnabl, China’s Exchange Rate and InternationalAdjustment in Wages, Prices, and Interest Rates: Japan Déjà Vu?, May 2006
1721 Paolo M. Panteghini, The Capital Structure of Multinational Companies under Tax
Competition, May 2006
1722 Johannes Becker, Clemens Fuest and Thomas Hemmelgarn, Corporate Tax Reform and
Foreign Direct Investment in Germany – Evidence from Firm-Level Data, May 2006
1723 Christian Kleiber, Martin Sexauer and Klaus Waelde, Bequests, Taxation and the
Distribution of Wealth in a General Equilibrium Model, May 2006
1724 Axel Dreher and Jan-Egbert Sturm, Do IMF and World Bank Influence Voting in the
UN General Assembly?, May 2006
1725 Swapan K. Bhattacharya and Biswa N. Bhattacharyay, Prospects of Regional
Cooperation in Trade, Investment and Finance in Asia: An Empirical Analysis on
BIMSTEC Countries and Japan, May 2006
1726 Philippe Choné and Laurent Linnemer, Assessing Horizontal Mergers under Uncertain
Efficiency Gains, May 2006
1727 Daniel Houser and Thomas Stratmann, Selling Favors in the Lab: Experiments on
Campaign Finance Reform, May 2006
1728 E. Maarten Bosker, Steven Brakman, Harry Garretsen and Marc Schramm, A Century
of Shocks: The Evolution of the German City Size Distribution 1925 – 1999, May 2006
1729 Clive Bell and Hans Gersbach, Growth and Enduring Epidemic Diseases, May 2006
1730 W. Bentley MacLeod, Reputations, Relationships and the Enforcement of Incomplete
Contracts, May 2006
1731 Jan K. Brueckner and Ricardo Flores-Fillol, Airline Schedule Competition: Product-


![arXiv:1510.08017v1 [math.OC] 27 Oct 2015Model Type Duopoly Oligopoly Oligopoly Duopoly Duopoly Duopoly Oligopoly Sales Decay No No No Yes No No Yes E ort To Market Potential Yes Yes](https://img.pdfslide.us/doc/110x75/5ed99b62801c872007065b8e/arxiv151008017v1-mathoc-27-oct-2015-model-type-duopoly-oligopoly-oligopoly.jpg)