Embed Size (px)
Citation preview
[Reuben et. al., Vol.6 (Iss.9): September 2018] ISSN- 2350-0530(O), ISSN- 2394-3629(P)
(Received: August 19, 2018 - Accepted: September 23, 2018) DOI: 10.5281/zenodo.1451872
Http://www.granthaalayah.com ©International Journal of Research - GRANTHAALAYAH [373]
Science
AIRFOIL CONSIDERATIONS IN THE DESIGN OF HIGH
PERFORMANCE, LOW REYNOLDS NUMBER PROPELLERS
Umunna J Reuben 1, Koju Hiraki 2, Miyamoto Shohei 3 1, 2, 3 Space Dynamic Laboratory, Kyushu Institute of Technology, Japan
Abstract
A propeller was designed using 2D airfoil data obtained from a panel method numeric code. The
propeller was designed to operate at 75% chord based Reynolds number of 20k. At low Reynolds
numbers <40k, there are no publicly available 2D airfoil force data largely because of inherent
difficulty in their measurement. Theoretical prediction of the propeller’s peak efficiency was 0.67
while experiment results was 0.58. To improve the propeller efficiency by using better performing
airfoils, six (6) airfoils of varying thickness and camber were studied. Three of the six airfoils were
chosen and used in the design of three propellers - a single airfoil for each propeller design. The
propellers were designed to operate at Reynolds number of 30k at 0.75 radius and the 2D airfoil
force data used for the designs were obtained from a numeric code. Theoretical predictions of
efficiency were all > 81% in each of the designed propellers.
Nomenclature
T = Thrust
B = Number of blades
D = Blade diameter
r = Station radius
CD = Drag coefficient
CL = Lift coefficient
Re = Reynolds number
c = Blade chord
V = Free airstream velocity
J = Advance ratio
CT = Thrust coefficient
CP = Power coefficient
η = Efficiency
Keywords: Propeller Design; Low-Reynolds Number; Airfoil Data; Xrotor.
Cite This Article: Umunna J Reuben, Koju Hiraki, and Miyamoto Shohei. (2018). “AIRFOIL
CONSIDERATIONS IN THE DESIGN OF HIGH PERFORMANCE, LOW REYNOLDS
[Reuben et. al., Vol.6 (Iss.9): September 2018] ISSN- 2350-0530(O), ISSN- 2394-3629(P)
(Received: August 19, 2018 - Accepted: September 23, 2018) DOI: 10.5281/zenodo.1451872
Http://www.granthaalayah.com ©International Journal of Research - GRANTHAALAYAH [374]
NUMBER PROPELLERS.” International Journal of Research - Granthaalayah, 6(9), 373-384.
https://doi.org/10.5281/zenodo.1451872.
1. Introduction
With decreasing Reynolds number (<40) it becomes increasingly challenging to obtain reliable 2D
airfoil force data. At these Low Reynolds number, Aerodynamic force data from experiment or
numeric sources cannot be absolutely depended upon. (Selig, Guglielmo, Broeren, & Philippe,
1995) presented experiment data of A18, BE50, and SD8030 at Reynolds number of 40k.
However, while it was possible to measure lift coefficients for these airfoils, reliable measurement
of drag coefficient proved difficult to obtain and are hence unavailable.
For most low inertia flows over an airfoil, that result in Reynolds number <100k, the presence of
laminar separation degrades the performance of such airfoils. Describing the mechanism by which
LSB degrades airfoil performance, (Michael, The Design of Airfoils at Low Reynolds Numbers,
1985) posits that LSB progresses forward towards the leading edge with increasing angle of attack
until flow separates from the trailing edge of the airfoil leading to airfoil stall. However, airfoils
can also be designed so that the LSB modifies the airfoil shape and consequently improves
aerodynamic force coefficients of airfoils. (Muller, 1985) suggest that short LSB can act as a
turbulator thereby improving 2D airfoil performance. (Grundy T.M, Keefe G.P, & Lowson M.V,
2000) measured lift and drag forces acting on E61 airfoil between Reynolds number range of 25k
and 60k and concluded that at high angle of attack long LSB break down into short bubbles
resulting in an increase in lift and decrease in drag. Grundy further added that high acoustic
activity in the vicinity of the measurement promoted a quick transitioning of flow states.
High frictional forces and low inertia associated with Low Reynolds number flows often results in
adverse pressure during flow transition at the upper surface of the airfoil. The sensitivity of low-
Reynolds number flows makes it onerous to acquire the aerodynamic forces that govern the flow
thus, reducing the quality of 2D airfoil data collected from experiments. On the other hand, 2D
airfoil characteristics obtained from numeric codes are also not reliable. The limited understanding
of the actual physics of low Reynolds number flows further extends to lower the accuracy of force
coefficient predictions by numerical codes. (Smedresman, Yeo, & Shyy, 2011) used Xfoil to
predict the aerodynamic characteristics of MA409 at Reynolds number between 10k and 22k and
used the data in the design of a propeller. In their work, uncertainties associated with 2D airfoil
force data was partly blamed for observed discrepancy in the propeller performance between
theory and experiment. Ultimately, inherent uncertainties from 2-D airfoil aerodynamic force data
prevent accurate propeller performance prediction.
2. Methodology
2.1. XFLR-5
Xflr-5 (Drela, XFOIL: An Analysis and Design System for Low Reynolds Number Airfoils, 1989)
is a numeric code that uses vortices panel method for the analysis of airfoils at low Reynolds
numbers. It combines high-order panel methods with coupled interaction between viscous and
inviscid layer flows to predict airfoil characteristics. An eN envelope method allows the inclusion
[Reuben et. al., Vol.6 (Iss.9): September 2018] ISSN- 2350-0530(O), ISSN- 2394-3629(P)
(Received: August 19, 2018 - Accepted: September 23, 2018) DOI: 10.5281/zenodo.1451872
Http://www.granthaalayah.com ©International Journal of Research - GRANTHAALAYAH [375]
of a representative boundary layer transition effects in solutions within the subsonic flow regime.
Airfoils can be directly modified in Xflr-5 by direct specifying new geometric parameters such as
maximum thickness and camber, trailing thickness and leading edge radius.
2.2. XROTOR
Xrotor is an open source propeller design tool developed at MIT. It was used throughout this work
for the design of the propellers. Xrotor implements graded blade element momentum theory
(Larrabee & French, 1983), which uses Betz-Prandtl correction factor for the calculation of
induced velocities and losses and Goldstein’s method in which a helicoidal wake is prescribed and
solved to obtained near optimum propeller twist and chord for given propeller operating
conditions.
𝐶𝑃 =𝑃
𝜌𝑛3𝐷5 (1)
𝐶𝑇 =𝑇
𝜌𝑛2𝐷4 (2)
𝐽 = 𝑉
𝑛𝐷 (3)
𝜂 =𝐶𝑇
𝐶𝑝∗ 𝐽 (4)
2.3. Propeller Design
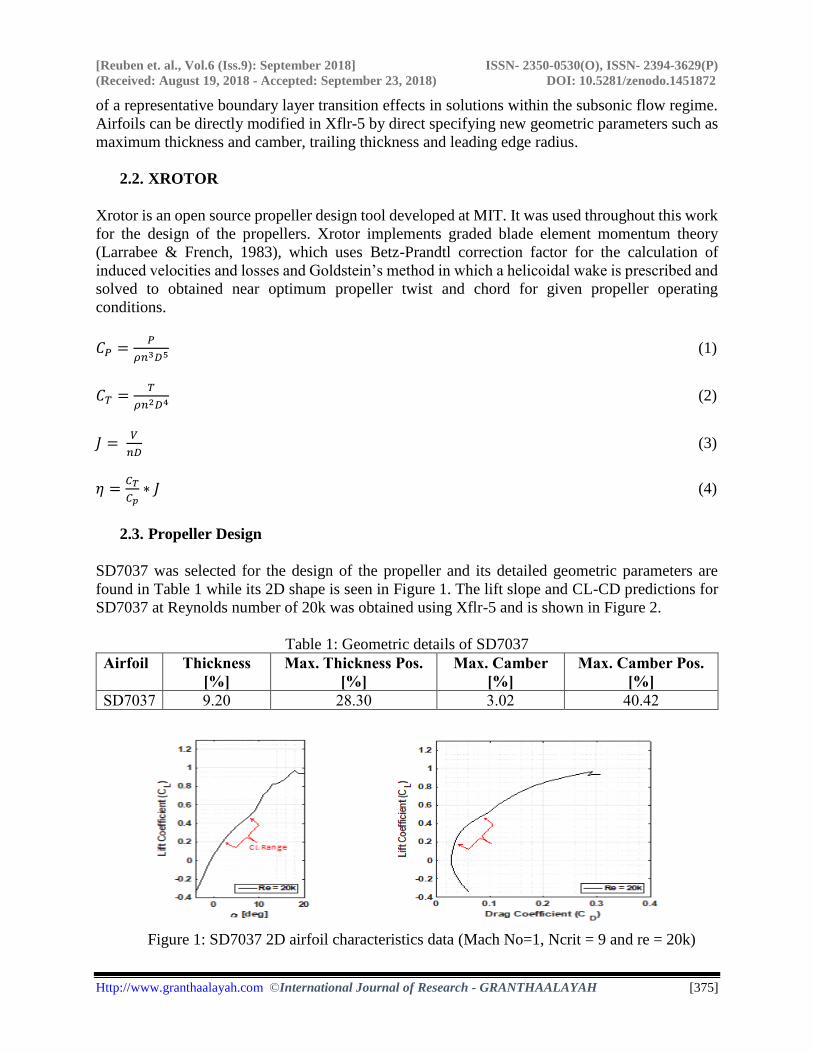
SD7037 was selected for the design of the propeller and its detailed geometric parameters are
found in Table 1 while its 2D shape is seen in Figure 1. The lift slope and CL-CD predictions for
SD7037 at Reynolds number of 20k was obtained using Xflr-5 and is shown in Figure 2.
Table 1: Geometric details of SD7037
Airfoil Thickness
[%]
Max. Thickness Pos.
[%]
Max. Camber
[%]
Max. Camber Pos.
[%]
SD7037 9.20 28.30 3.02 40.42
Figure 1: SD7037 2D airfoil characteristics data (Mach No=1, Ncrit = 9 and re = 20k)
[Reuben et. al., Vol.6 (Iss.9): September 2018] ISSN- 2350-0530(O), ISSN- 2394-3629(P)
(Received: August 19, 2018 - Accepted: September 23, 2018) DOI: 10.5281/zenodo.1451872
Http://www.granthaalayah.com ©International Journal of Research - GRANTHAALAYAH [376]
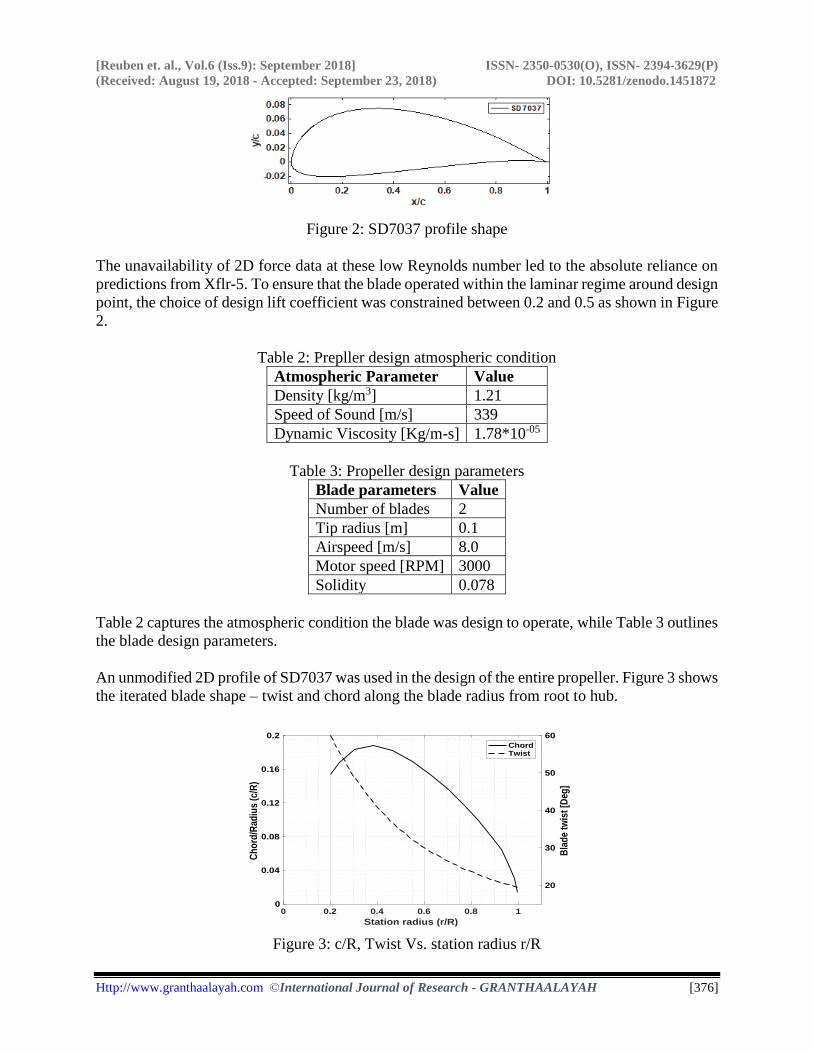
Figure 2: SD7037 profile shape
The unavailability of 2D force data at these low Reynolds number led to the absolute reliance on
predictions from Xflr-5. To ensure that the blade operated within the laminar regime around design
point, the choice of design lift coefficient was constrained between 0.2 and 0.5 as shown in Figure
2.
Table 2: Prepller design atmospheric condition
Atmospheric Parameter Value
Density [kg/m3] 1.21
Speed of Sound [m/s] 339
Dynamic Viscosity [Kg/m-s] 1.78*10-05
Table 3: Propeller design parameters
Blade parameters Value
Number of blades 2
Tip radius [m] 0.1
Airspeed [m/s] 8.0
Motor speed [RPM] 3000
Solidity 0.078
Table 2 captures the atmospheric condition the blade was design to operate, while Table 3 outlines
the blade design parameters.
An unmodified 2D profile of SD7037 was used in the design of the entire propeller. Figure 3 shows
the iterated blade shape – twist and chord along the blade radius from root to hub.
Figure 3: c/R, Twist Vs. station radius r/R
0 0.2 0.4 0.6 0.8 1
Station radius (r/R)
0
0.04
0.08
0.12
0.16
0.2
Ch
ord
/Rad
ius
(c/R
)
20
30
40
50
60
Bla
de
twis
t [D
eg]
ChordTwist
[Reuben et. al., Vol.6 (Iss.9): September 2018] ISSN- 2350-0530(O), ISSN- 2394-3629(P)
(Received: August 19, 2018 - Accepted: September 23, 2018) DOI: 10.5281/zenodo.1451872
Http://www.granthaalayah.com ©International Journal of Research - GRANTHAALAYAH [377]
3. Fabrication and Experiment Test Set-Up
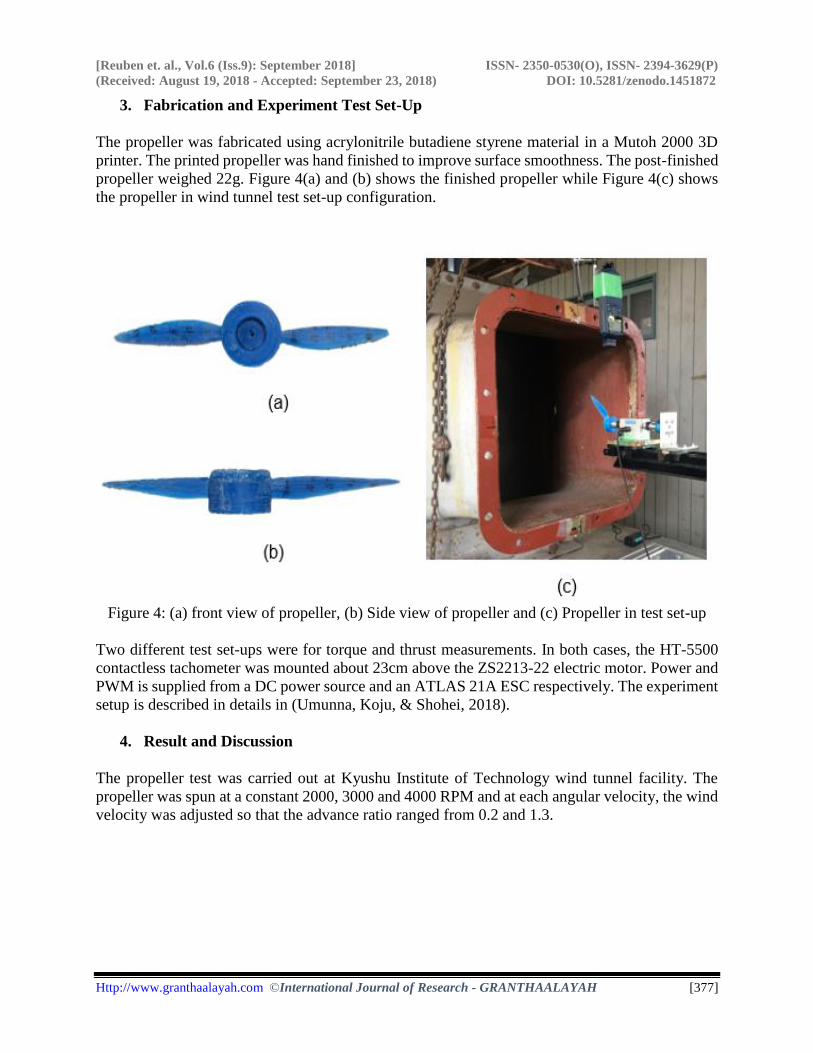
The propeller was fabricated using acrylonitrile butadiene styrene material in a Mutoh 2000 3D
printer. The printed propeller was hand finished to improve surface smoothness. The post-finished
propeller weighed 22g. Figure 4(a) and (b) shows the finished propeller while Figure 4(c) shows
the propeller in wind tunnel test set-up configuration.
Figure 4: (a) front view of propeller, (b) Side view of propeller and (c) Propeller in test set-up
Two different test set-ups were for torque and thrust measurements. In both cases, the HT-5500
contactless tachometer was mounted about 23cm above the ZS2213-22 electric motor. Power and
PWM is supplied from a DC power source and an ATLAS 21A ESC respectively. The experiment
setup is described in details in (Umunna, Koju, & Shohei, 2018).
4. Result and Discussion
The propeller test was carried out at Kyushu Institute of Technology wind tunnel facility. The
propeller was spun at a constant 2000, 3000 and 4000 RPM and at each angular velocity, the wind
velocity was adjusted so that the advance ratio ranged from 0.2 and 1.3.
[Reuben et. al., Vol.6 (Iss.9): September 2018] ISSN- 2350-0530(O), ISSN- 2394-3629(P)
(Received: August 19, 2018 - Accepted: September 23, 2018) DOI: 10.5281/zenodo.1451872
Http://www.granthaalayah.com ©International Journal of Research - GRANTHAALAYAH [378]
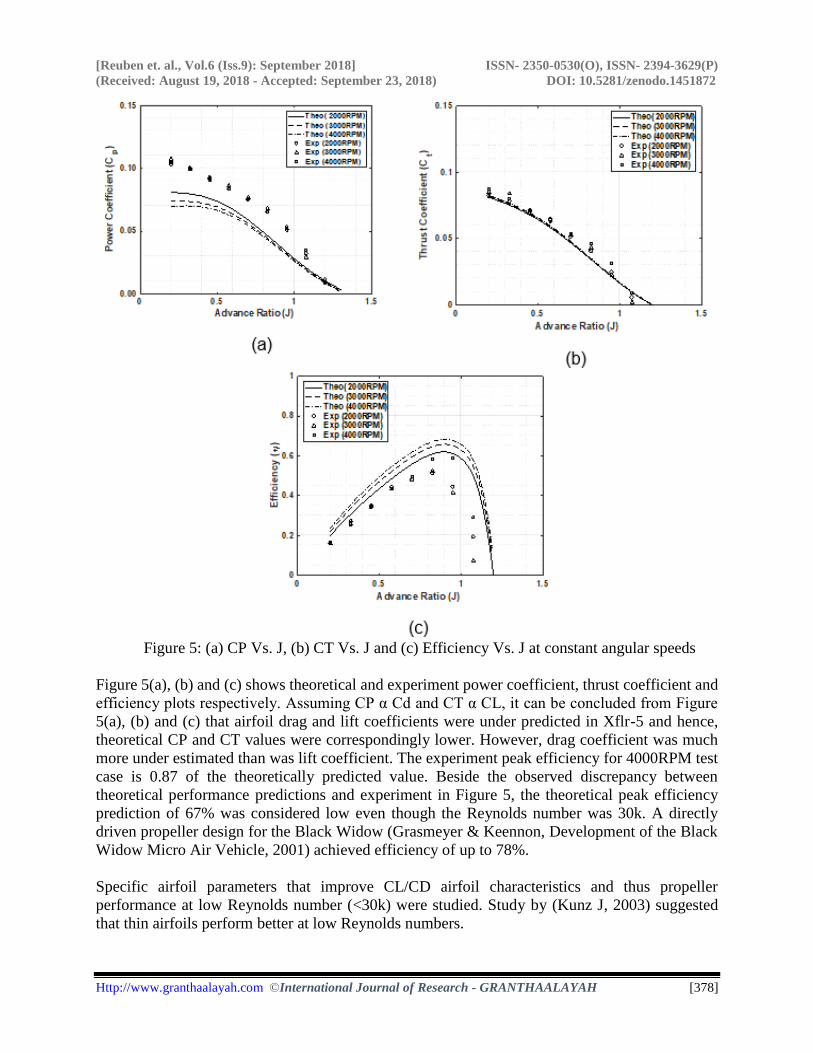
Figure 5: (a) CP Vs. J, (b) CT Vs. J and (c) Efficiency Vs. J at constant angular speeds
Figure 5(a), (b) and (c) shows theoretical and experiment power coefficient, thrust coefficient and
efficiency plots respectively. Assuming CP α Cd and CT α CL, it can be concluded from Figure
5(a), (b) and (c) that airfoil drag and lift coefficients were under predicted in Xflr-5 and hence,
theoretical CP and CT values were correspondingly lower. However, drag coefficient was much
more under estimated than was lift coefficient. The experiment peak efficiency for 4000RPM test
case is 0.87 of the theoretically predicted value. Beside the observed discrepancy between
theoretical performance predictions and experiment in Figure 5, the theoretical peak efficiency
prediction of 67% was considered low even though the Reynolds number was 30k. A directly
driven propeller design for the Black Widow (Grasmeyer & Keennon, Development of the Black
Widow Micro Air Vehicle, 2001) achieved efficiency of up to 78%.
Specific airfoil parameters that improve CL/CD airfoil characteristics and thus propeller
performance at low Reynolds number (<30k) were studied. Study by (Kunz J, 2003) suggested
that thin airfoils perform better at low Reynolds numbers.
[Reuben et. al., Vol.6 (Iss.9): September 2018] ISSN- 2350-0530(O), ISSN- 2394-3629(P)
(Received: August 19, 2018 - Accepted: September 23, 2018) DOI: 10.5281/zenodo.1451872
Http://www.granthaalayah.com ©International Journal of Research - GRANTHAALAYAH [379]
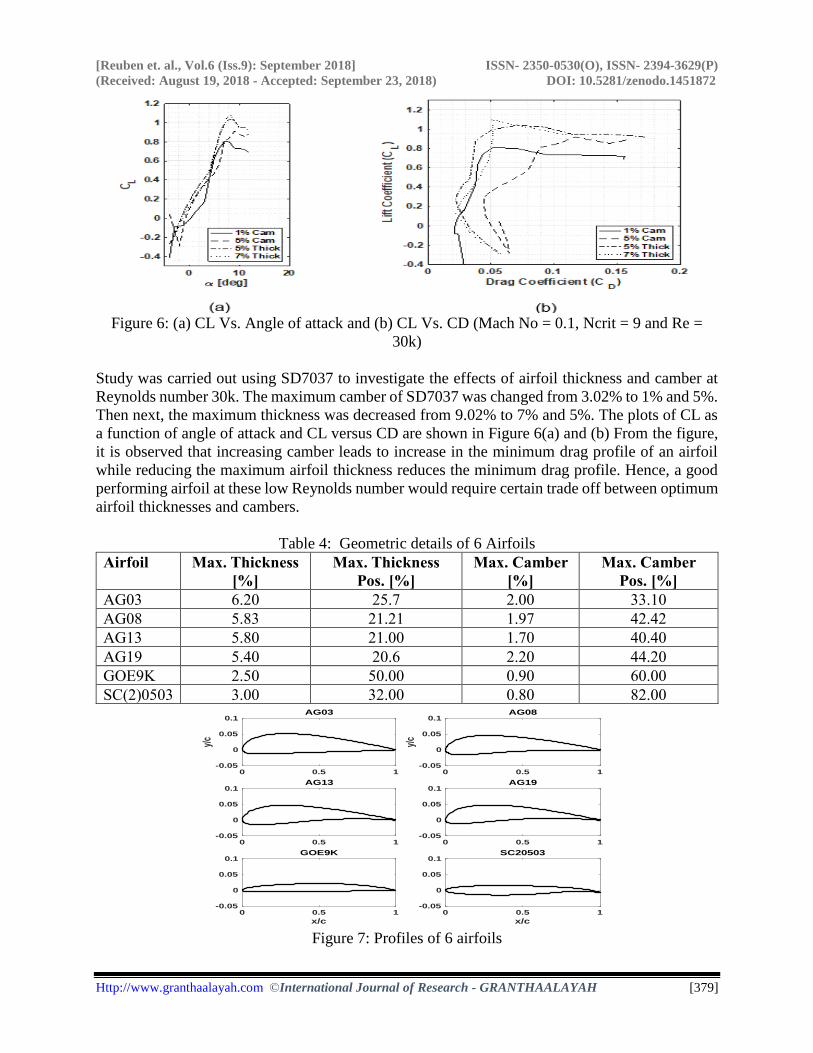
Figure 6: (a) CL Vs. Angle of attack and (b) CL Vs. CD (Mach No = 0.1, Ncrit = 9 and Re =
30k)
Study was carried out using SD7037 to investigate the effects of airfoil thickness and camber at
Reynolds number 30k. The maximum camber of SD7037 was changed from 3.02% to 1% and 5%.
Then next, the maximum thickness was decreased from 9.02% to 7% and 5%. The plots of CL as
a function of angle of attack and CL versus CD are shown in Figure 6(a) and (b) From the figure,
it is observed that increasing camber leads to increase in the minimum drag profile of an airfoil
while reducing the maximum airfoil thickness reduces the minimum drag profile. Hence, a good
performing airfoil at these low Reynolds number would require certain trade off between optimum
airfoil thicknesses and cambers.
Table 4: Geometric details of 6 Airfoils
Airfoil Max. Thickness
[%]
Max. Thickness
Pos. [%]
Max. Camber
[%]
Max. Camber
Pos. [%]
AG03 6.20 25.7 2.00 33.10
AG08 5.83 21.21 1.97 42.42
AG13 5.80 21.00 1.70 40.40
AG19 5.40 20.6 2.20 44.20
GOE9K 2.50 50.00 0.90 60.00
SC(2)0503 3.00 32.00 0.80 82.00
Figure 7: Profiles of 6 airfoils
0 0.5 1-0.05
0
0.05
0.1
y/c
AG03
0 0.5 1-0.05
0
0.05
0.1
y/c
AG08
0 0.5 1-0.05
0
0.05
0.1AG13
0 0.5 1-0.05
0
0.05
0.1AG19
0 0.5 1
x/c
-0.05
0
0.05
0.1GOE9K
0 0.5 1
x/c
-0.05
0
0.05
0.1SC20503
[Reuben et. al., Vol.6 (Iss.9): September 2018] ISSN- 2350-0530(O), ISSN- 2394-3629(P)
(Received: August 19, 2018 - Accepted: September 23, 2018) DOI: 10.5281/zenodo.1451872
Http://www.granthaalayah.com ©International Journal of Research - GRANTHAALAYAH [380]
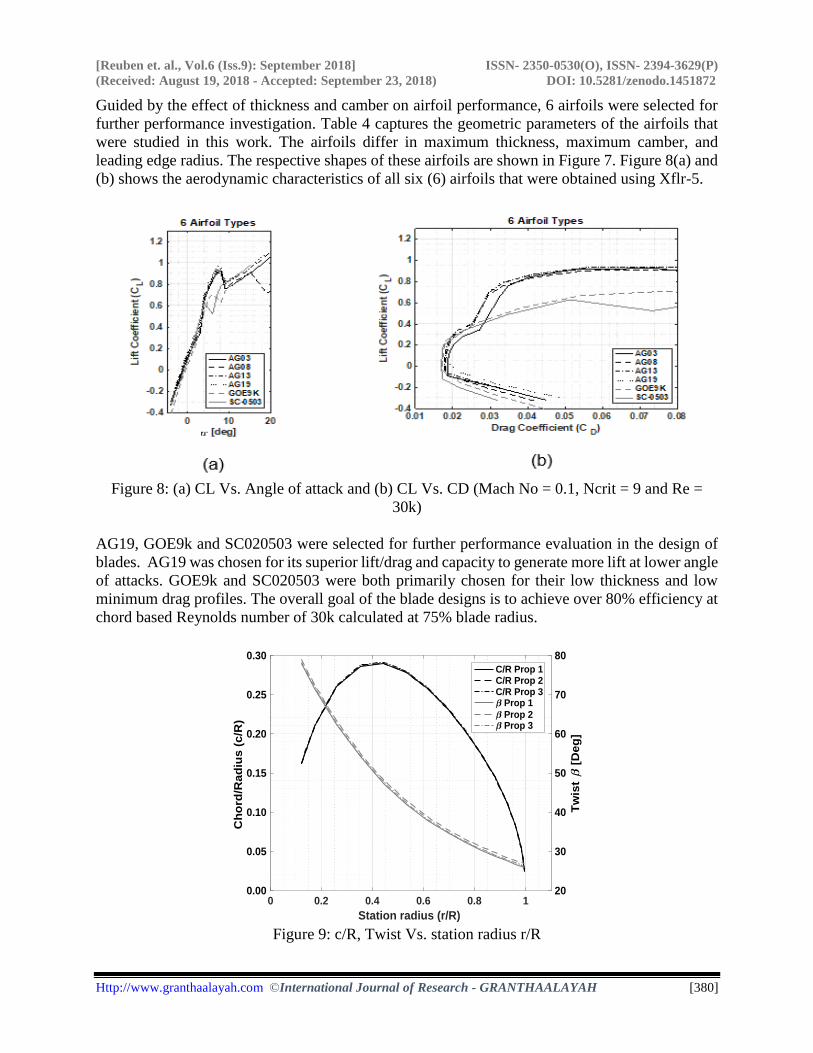
Guided by the effect of thickness and camber on airfoil performance, 6 airfoils were selected for
further performance investigation. Table 4 captures the geometric parameters of the airfoils that
were studied in this work. The airfoils differ in maximum thickness, maximum camber, and
leading edge radius. The respective shapes of these airfoils are shown in Figure 7. Figure 8(a) and
(b) shows the aerodynamic characteristics of all six (6) airfoils that were obtained using Xflr-5.
Figure 8: (a) CL Vs. Angle of attack and (b) CL Vs. CD (Mach No = 0.1, Ncrit = 9 and Re =
30k)
AG19, GOE9k and SC020503 were selected for further performance evaluation in the design of
blades. AG19 was chosen for its superior lift/drag and capacity to generate more lift at lower angle
of attacks. GOE9k and SC020503 were both primarily chosen for their low thickness and low
minimum drag profiles. The overall goal of the blade designs is to achieve over 80% efficiency at
chord based Reynolds number of 30k calculated at 75% blade radius.
Figure 9: c/R, Twist Vs. station radius r/R
0 0.2 0.4 0.6 0.8 1
Station radius (r/R)
0.00
0.05
0.10
0.15
0.20
0.25
0.30
Ch
ord
/Ra
diu
s (
c/R
)
20
30
40
50
60
70
80
Tw
ist
[D
eg
]
C/R Prop 1C/R Prop 2C/R Prop 3
Prop 1
Prop 2 Prop 3
[Reuben et. al., Vol.6 (Iss.9): September 2018] ISSN- 2350-0530(O), ISSN- 2394-3629(P)
(Received: August 19, 2018 - Accepted: September 23, 2018) DOI: 10.5281/zenodo.1451872
Http://www.granthaalayah.com ©International Journal of Research - GRANTHAALAYAH [381]
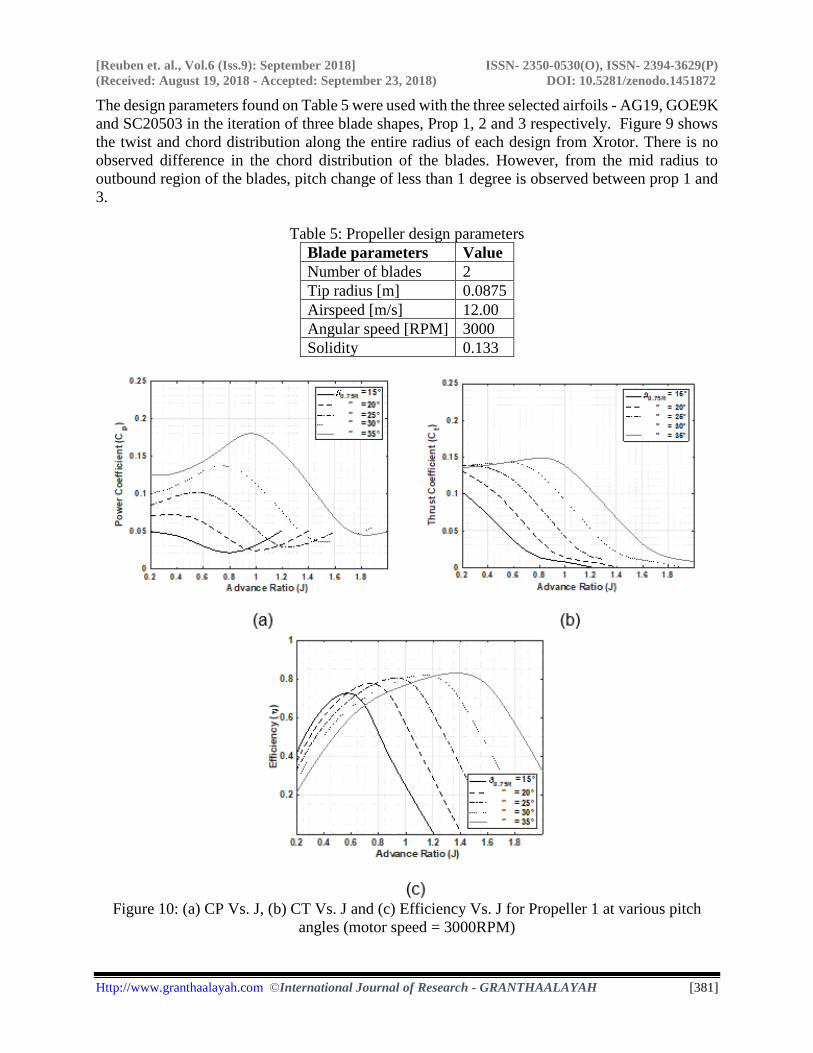
The design parameters found on Table 5 were used with the three selected airfoils - AG19, GOE9K
and SC20503 in the iteration of three blade shapes, Prop 1, 2 and 3 respectively. Figure 9 shows
the twist and chord distribution along the entire radius of each design from Xrotor. There is no
observed difference in the chord distribution of the blades. However, from the mid radius to
outbound region of the blades, pitch change of less than 1 degree is observed between prop 1 and
3.
Table 5: Propeller design parameters
Blade parameters Value
Number of blades 2
Tip radius [m] 0.0875
Airspeed [m/s] 12.00
Angular speed [RPM] 3000
Solidity 0.133
Figure 10: (a) CP Vs. J, (b) CT Vs. J and (c) Efficiency Vs. J for Propeller 1 at various pitch
angles (motor speed = 3000RPM)
[Reuben et. al., Vol.6 (Iss.9): September 2018] ISSN- 2350-0530(O), ISSN- 2394-3629(P)
(Received: August 19, 2018 - Accepted: September 23, 2018) DOI: 10.5281/zenodo.1451872
Http://www.granthaalayah.com ©International Journal of Research - GRANTHAALAYAH [382]
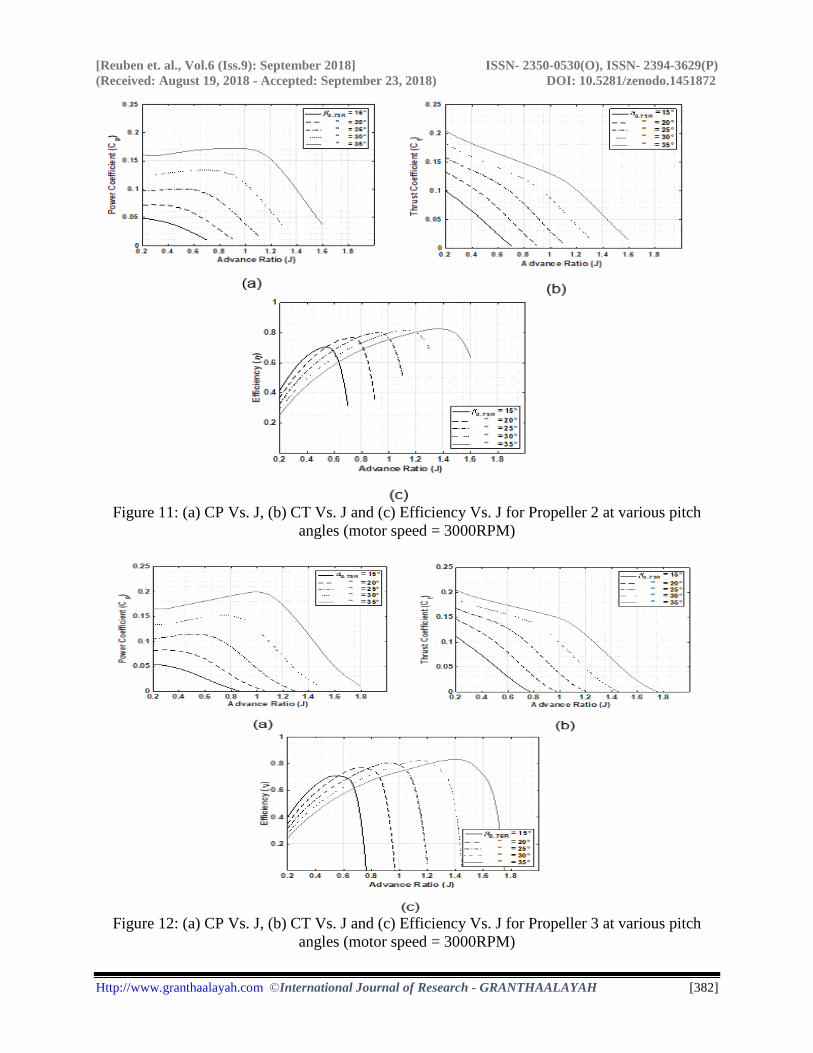
Figure 11: (a) CP Vs. J, (b) CT Vs. J and (c) Efficiency Vs. J for Propeller 2 at various pitch
angles (motor speed = 3000RPM)
Figure 12: (a) CP Vs. J, (b) CT Vs. J and (c) Efficiency Vs. J for Propeller 3 at various pitch
angles (motor speed = 3000RPM)
[Reuben et. al., Vol.6 (Iss.9): September 2018] ISSN- 2350-0530(O), ISSN- 2394-3629(P)
(Received: August 19, 2018 - Accepted: September 23, 2018) DOI: 10.5281/zenodo.1451872
Http://www.granthaalayah.com ©International Journal of Research - GRANTHAALAYAH [383]
The Performance of each blade design was evaluated across a range of advance ratios and blade
pitch, which was calculated at 75% radius. Figure 10(a), (b) and (c) shows the theoretical
performance prediction of propeller. The predicted propeller efficiency reached 81% at pitch angle
of 35deg as seen in Figure 10(c). The lift superiority of AG19 observed in Figure 10(a) delayed
stall and eventually resulted in a wider range of advance ratio coverage. Similarly, propeller 2
reached efficiency of 81% as seen in Figure 11(c), however, limited maximum lift attainable by
the airfoil correspondingly restricts the advance ratio. Propeller 3, achieved efficiency of 83% as
shown in Figure 12(c).
All three airfoil used in the design of three propellers have maximum thickness less than 5.5% of
chords and minimum drag coefficients <0.019, as result, the predicted propeller efficiency
increased dramatically to above 80%. Thus, the performance of low Reynolds number propellers
can be greatly enhanced by reduction in the airfoil profile drag by reducing thickness, camber or
both while ensuring that lift generation capabilities is not compromised. For applications where a
large flight envelope range is not desired, for example air vehicles that may be directly deployed
into their operation environment or do not require ground takeoff’s, airfoils with high stall angles
may be traded for thin and low cambered airfoils.
5. Conclusion
A propeller was designed using 2D airfoil data obtained from a numeric code that uses vortices
panel method. The propeller was designed to operate at 75% chord based Reynolds number of 20k.
Theoretical efficiency of the fabricated propeller achieved a maximum of 67%, while experiment
data from efficiency was up to 13% less than theoretically predicted value. Inaccurate prediction
of 2D airfoil force data was the major contributor to the discrepancy between experiment and
theory. However, propeller deflection and manufacturing limitations were also contributors.
To improve the overall propeller efficiency, three out of six airfoils evaluated were selected on the
basis of their performance at 30k Reynolds numbers and used in the design of 3 propellers. All
three propellers showed more than 81% theoretical efficiency. It was concluded that airfoils of
<3% thickness may be a preferred choice for air vehicles operating in low Reynolds environments
where there is no requirement to operate in large flight envelope. For instance, if the vehicle would
be deployed into its operation environment and thus, there is no need for ground takeoff.
Declaration of Interests
None
Acknowledgement
This work was done in the collaborative research 17UKSG-007330 with Japan Aerospace and
Exploration Agency.
References
[1] Selig, Michael., et al. Summary of Low-Speed Airfoil Data. Virginia: SoarTech, 1995.
[2] The Design of Airfoils at Low Reynolds Numbers. Michael, Selig. Nevada: AiAA, 1985. 85-0074.
[3] Muller, Thomas J. Low Reynolds Number Vehicles. University of Notre Dame. Indiana: Advisory
Group For Aerospace Research And Development, 1985.
[Reuben et. al., Vol.6 (Iss.9): September 2018] ISSN- 2350-0530(O), ISSN- 2394-3629(P)
(Received: August 19, 2018 - Accepted: September 23, 2018) DOI: 10.5281/zenodo.1451872
Http://www.granthaalayah.com ©International Journal of Research - GRANTHAALAYAH [384]
[4] Effects of Acoustic Disturbances on Low Re Airfoil Flows. T.M, Grundy, Keefe G.P and Lowson
M.V. Notre-Dame: AIAA, 2000.
[5] Design, Fabrication, Analysis and Testing of a Micro Vehicle Propeller. Smedresman, Adam, Yeo,
Derrick and Shyy, Wei. Hawaii: AIAA, 2011. AIAA 2011-3817.
[6] Drela, Mark. XFOIL: An Analysis and Design System for Low Reynolds Number Airfoils. [ed.]
T.J Muller. 1989, Vol. 54.
[7] Minimum induced loss windmills and propellers. Larrabee, E.Eugene and French, Susan E. 1-3,
1983, Journal of Wind Engineering and Industrial Aerodynamics, Vol. 15, pp. 317-327.
[8] Non-Linear Effects of Airfoil Force Data on Design Performance of Low-reynolds Number
Propeller. Umunna, Reuben, Koju, Hiraki and Shohei, Miyamoto. s.l.: IJRG, 2018, Vol. 6.
[9] Development of the Black Widow Micro Air Vehicle. Grasmeyer, Joel and Keennon, Matthew.
Reno: AIAA, 2001.
[10] J, Kunz P. Aerodynamics and Design for Ultra-Low Reynolds Number Flight. Stanford University.
2003. Dissertation.
*Corresponding author.
E-mail address: p595109j@ mail.kyutech.jp