Embed Size (px)
Citation preview
By James W. VanGilder, P.E., APC Corporation Roger R. Schmidt, Ph.D., P.E., IBM Corporation
Airflow Uniformity Through Perforated Tiles in a Raised-Floor Data Center
White Paper #121
From the proceedings of IPACK2005 ASME InterPACK '05 July 17-22 San Francisco, California, USA
2005 American Power Conversion. All rights reserved. No part of this publication may be used, reproduced, photocopied, transmitted, or stored in any retrieval system of any nature, without the written permission of the copyright owner. www.apc.com Rev 2005-0 2
Executive Summary Perforated tiles on a raised floor often deliver substantially more or less airflow than
expected, resulting in inefficiencies and even equipment failure due to inadequate cooling.
In this paper, the impact of data center design parameters on perforated tile airflow is
quantified and methods of improving the uniformity are discussed. This paper was written
jointly by APC and IBM for the ASME InterPACK2005 Conference, held July 17-22 in San
Francisco, California, USA. It is taken directly from the conference proceedings in its
original form.
1 Copyright © 2005 by ASME
Proceedings of IPACK2005 ASME InterPACK '05
July 17-22, San Francisco, California, USA
IPACK2005-73375 AIRFLOW UNIFORMITY THROUGH PERFORATED TILES IN A RAISED-FLOOR DATA CENTER
James W. VanGilder, P.E.
American Power Conversion Corporation 85 Rangeway Road
Billerica, Massachusetts 01862 [email protected]
Roger R. Schmidt, Ph.D., P.E. IBM Corporation 522 South Road
Poughkeepsie, New York 12601 [email protected]
ABSTRACT
The maximum equipment power density (e.g. in
power/rack or power/area) that may be deployed in a typical raised-floor data center is limited by perforated tile airflow. In the design of a data center cooling system, a simple estimate of mean airflow per perforated tile is typically made based on the number of CRAC’s and number of perforated tiles (and possibly a leakage airflow estimate). However, in practice, many perforated tiles may deliver substantially more or less than the mean, resulting in, at best, inefficiencies and, at worst, equipment failure due to inadequate cooling. Consequently, the data center designer needs to estimate the magnitude of variations in perforated tile airflow prior to construction or renovation.
In this paper, over 240 CFD models are analyzed to
determine the impact of data-center design parameters on perforated tile airflow uniformity. The CFD models are based on actual data center floor plans and the CFD model is verified by comparison to experimental test data.
Perforated tile type and the presence of plenum
obstructions have the greatest potential influence on airflow uniformity. Floor plan, plenum depth, and airflow leakage rate have modest effect on uniformity and total airflow rate (or average plenum pressure) has virtually no effect. Good uniformity may be realized by using more restrictive (e.g. 25%-open) perforated tiles, minimizing obstructions and leakage airflow, using deeper plenums, and using rectangular floor plans with standard hot aisle/cold aisle arrangements.
INTRODUCTION
Data centers contain servers and other IT equipment, which require precisely conditioned cooling air for predictable performance. For example, ASHRAE’s Thermal Guidelines for Data Processing Environments [1] recommends inlet temperatures in the range of 20-25∞C (68-77∞F) for Class 1 (high-end, mission critical) equipment. The cooling air is typically distributed throughout the data center through a raised-floor plenum. Computer Room Air Conditioners
(CRAC’s) pump conditioned air into the plenum; the air exits the plenum through perforated floor tiles and other openings. Hot equipment exhaust air may be returned to the CRAC’s “through the room” or through an overhead return plenum or ductwork. Emerging standard practice is to arrange the perforated floor tiles in rows forming a “cold aisle” (for example, see [1], [2], or [3]). Equipment racks are then placed in rows along and facing each long side of the cold aisle. Alternating hot and cold aisles are formed as this configuration is repeated across the data center.
The temperature of the cooling air actually available for IT equipment depends on the airflow dynamics between the perforated tile and the equipment inlet. Equipment will draw air as needed and, if sufficient cooling air is unavailable, warm exhaust air will be recirculated over the racks or around the row ends. It is, therefore, essential that perforated tiles located near the equipment provide sufficient cooling air.
In some cases, a non-uniform airflow distribution through the perforated tiles may be desirable. This may be achieved by using varying tile types or dampers. Techniques have been developed to aid the design of such a system ([4] and [5]). The present study is applicable to the majority of data centers, which are designed for uniform airflow through all tiles. Results are equally valid for isolated-plenum zones, which may be present within a larger data center. For such uniform-airflow designs, the mean airflow per tile is usually estimated in the design stage based on total CRAC airflow, the number of perforated tiles, and possibly an estimate of total leakage airflow. In actual facilities, the airflow delivered through any particular perforated tile may vary substantially from the mean resulting in local cooling capacity, which is excessive or insufficient for the design IT load.
Thus, the data center designer needs to understand the
parameters that affect airflow uniformity and the magnitude of influence of each. In this study, uniformity is assessed based on percentage variation from the mean perforated tile airflow. For convenience, plenum geometry, CRAC details and locations, perforated tile locations, and all other attributes related to the basic layout of the facility are lumped into a
2 Copyright © 2005 by ASME
category that will simply be called “floor plan”. With this definition, the parameters investigated here are: 1) floor plan 2) perforated tile type (% open area), 3) airflow leakage rate, and 4) plenum depth.
Ten floor plans are studied; one is a hypothetical layout,
nine are based on actual data centers. Of the nine actual data centers, one is a facility for which measurement data has been taken; this case is used to validate the CFD model. Two perforated tile types are considered: nominally 25%-open and nominally 56%-open tiles. Leakage rate is the airflow rate associated with holes in the raised floor for cable access and other openings generally not intended primarily for air delivery. Three leakage rates are considered in the range of 0% to 40% of total CRAC airflow. Four plenum depths in the range of 0.30 m (12 in) to 0.91 m (36 in) are considered.
Airflow rate (e.g. total from the CRAC’s or mean airflow
per perforated tile) and average plenum pressure are notably absent from the list of parameters studied. Schmidt et al [6] suggested that since all relevant pressure variations scale with the velocity squared, airflow patterns in the plenum would remain independent of airflow rate. Accordingly, if CRAC airflow rate were consistently scaled up or down there would be no change in the percentage airflow variation from tile to tile. The present study affirms this assertion and provides more discussion and examples.
NOMENCLATURE ftile Perforated tile loss coefficient k Airflow path loss coefficient n Total number of perforated tiles in floor plan P(DQi) Probability density as a function of Qi Q, q Airflow rate V Air velocity DP Pressure change DQi Percentage variation from mean airflow rate for
perforated tile i r Density of air s Standard deviation
PLENUM AIRFLOW DYNAMICS Uniform airflow through each perforated tile is achieved
when the resistance to flow experienced by the air moving through the plenum is much less than the resistance to flow imposed by the perforated tiles; in this case, the total flow resistance along any path is fairly constant and no airflow path looks particularly attractive or unattractive. Both the airflow path resistance and the tile resistance scale approximately with the velocity (or flow rate) squared. The perforated tile resistance may then be characterized in terms of a loss coefficient ftile:
DP = ½ ftile r V2 (1)
where DP is the pressure drop across the perforated tile, r is the density of air, and V is the velocity of the air approaching the perforated tile.
Uniformity does not become perfect, as the plenum is made very deep. While this would be true if air were introduced from the bottom of the plenum, in real data centers, CRAC’s supply air from the top of the plenum - just under the raised floor. Consequently, substantial air movement takes place directly under the tiles. Jets and recirculation zones are characterized by regions of rapidly varying air velocity which may sustain pressure variations on the order of ½ r V2. Perforated tiles must offer substantially more resistance (greater pressure drop) than these pressure fluctuations to ensure uniformity. Assuming the velocity of air through the tiles and that in the plenum are of the same scale, we have ftile>>1 as a minimum requirement for uniformity. In practice, these flow-induced pressure variations may not be the dominant resistance in the plenum; bounding walls, obstructions (e.g. cable trays, piping, stanchions, etc.), and pressure loss through leakage through non-perforated-tile openings may dominate and the perforated tiles must be even more restrictive in order for reasonable uniformity to be achieved.
Plenum pressure may drop below room pressure in certain
regions so that “backflow” occurs through perforated tiles. Similarly, “leakage” airflow through cable cutouts, around tile edges, and other openings may actually be directed into the plenum. This leakage airflow may vary considerably over the raised floor but it locally varies approximately with the square root of the pressure difference across the floor like the perforated tile airflow-pressure relationship expressed in Eq. (1).
Though not included in the CFD models of the present
investigation, obstructions such as cable trays and piping may have a significant affect on perforated tile airflow in a particular region.
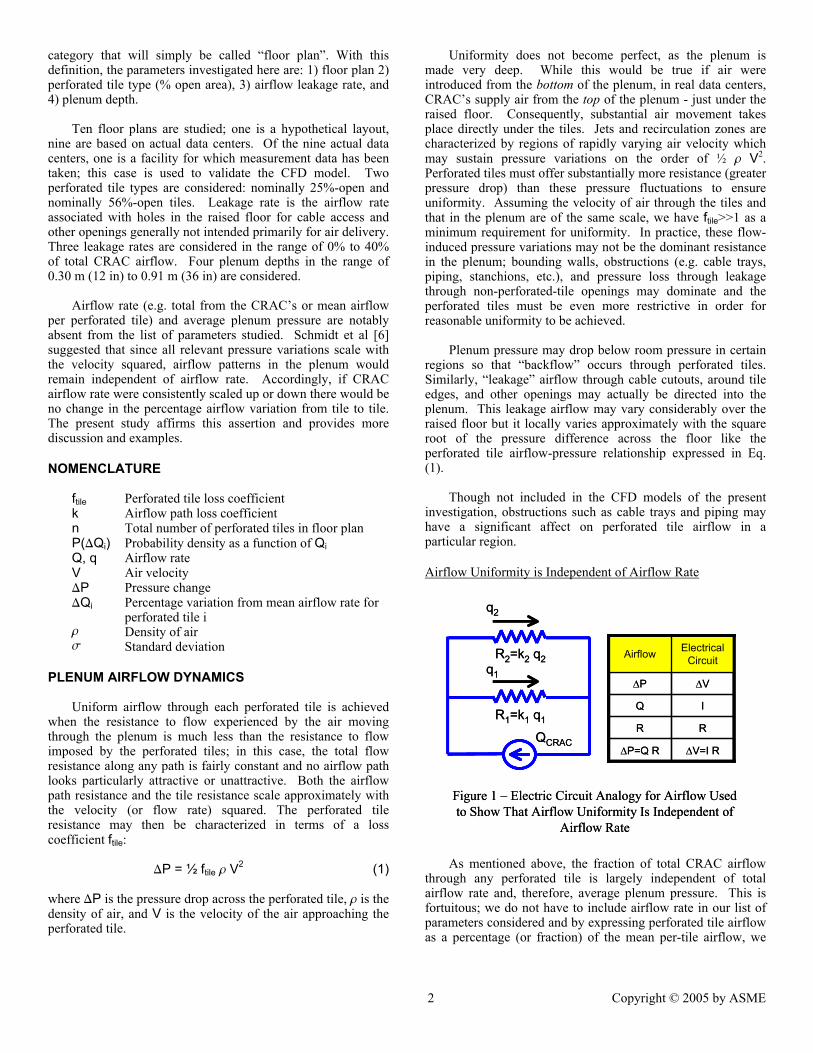
Airflow Uniformity is Independent of Airflow Rate
Figure 1 – Electric Circuit Analogy for Airflow Used to Show That Airflow Uniformity Is Independent of
Airflow Rate
∆V=I R∆P=Q R
RR
IQ
∆V∆P
Electrical CircuitAirflow
R1=k1 q1
QCRAC
q2
q1
R2=k2 q2
Figure 1 – Electric Circuit Analogy for Airflow Used to Show That Airflow Uniformity Is Independent of
Airflow Rate
∆V=I R∆P=Q R
RR
IQ
∆V∆P
Electrical CircuitAirflow
R1=k1 q1
QCRAC
q2
q1
R2=k2 q2
As mentioned above, the fraction of total CRAC airflow
through any perforated tile is largely independent of total airflow rate and, therefore, average plenum pressure. This is fortuitous; we do not have to include airflow rate in our list of parameters considered and by expressing perforated tile airflow as a percentage (or fraction) of the mean per-tile airflow, we
3 Copyright © 2005 by ASME
can readily compare results of scenarios with substantially differing airflow rates in a meaningful way.
For example purposes, consider a simple two-perforated-
tile, single-CRAC floor plan. With reference to Fig. 1, an analogy may be made between airflow and the flow of current in an electrical circuit. Assuming the airflow-path pressure drop and perforated-tile pressure drop each scale with the flow rate (or velocity) squared, both sources of resistance may be lumped into a single resistance. Each combined resistance, R1 or R2, represents the total pressure drop associated with airflow following a closed circuit starting at the CRAC, traveling through the plenum, passing through one of the perforated tiles, and ultimately returning to the CRAC. The total pressure drop across either path is equal to the external pressure drop overcome by the CRAC:
DPCRAC = k1 q1
2 = k2 q22 (2)
where q1 and q2 are the airflow rates along the two paths and k1 and k2 are constants which characterize the combined path and tile resistances. Note that if k1=k2, a uniform distribution of airflow is achieved. It is also evident from Fig. 1 that: q1 + q2 = QCRAC (3)
Solving Eqs. (2) and (3) simultaneously for q1/QCRAC and q2/QCRAC leads to: q1/QCRAC = k2
½/(k1½ + k2
½) (4a)
q2/QCRAC = k1½/(k1
½ + k2½) (4b)
Equations (4a) and (4b) show that the fraction of total airflow along each path is independent of airflow rate. Note that the above argument is also equally valid for floor plans using mixed tile types or tiles with dampers. The only requirement is that all pressure losses along each airflow path scale with the airflow rate (or velocity) squared.
Generalizing, it can be shown that airflow uniformity is independent of airflow rate for any number of perforated tiles. Further, the pressure losses need not scale with airflow rate squared; the only requirement for uniformity is that all pressure losses scale identically (e.g. linearly, to the 1.5 power, etc.) with airflow. In practice, the airflow in a plenum is typically in the turbulent (high Reynolds Number) regime so that all pressure losses will generally scale approximately with the airflow rate squared. Still it is conceivable that in some scenarios, different airflow regimes (laminar, turbulent, mixed) may be present simultaneously. In this case, plenum and perforated tile losses will not scale identically with airflow rate and airflow uniformity will depend to some degree on the magnitude of airflow rate.
CFD models were created to verify and demonstrate that
airflow uniformity is indeed independent of airflow rate for selected practical cases. Results are provided below.
PERFORATED TILE AIRFLOW UNIFORMITY METRICS Airflow uniformity results are presented as percentage
variations from the mean so that they may be readily applied to any airflow rate of interest and scenarios with different airflow rates may be compared on a consistent basis. The specific uniformity metrics presented here are minimum, maximum, and standard deviation of the mean perforated tile airflow. A negative percentage variation implies flow less than the mean. A value less than –100% implies “backflow” from the room down into the plenum. A positive percentage variation implies flow greater than the mean. A value greater than 100% implies flow that is more than twice the mean. As a concrete example, consider a scenario for which the mean tile airflow is 400 cfm with uniformity results reported as –75%, 50%, and 25% for the minimum, maximum, and standard deviation, respectively. In this case, at least one tile has the minimum airflow value of 100 cfm, at least one tile has the maximum airflow rate of 600 cfm, and the standard deviation is 100 cfm.
Since the mean of the percentage variation from the mean
is zero by definition, the standard deviation may be written compactly as:
s = Si=1
n
1/n DQi2
1/2
(5)s = Si=1
n
Si=1
n
1/n DQi2
1/2
(5)
where DQi is the percentage variation in airflow from the mean for tile i, and n is the total number of perforated tiles in the floor plan. The probability density P(Qi) is then (see [7] for example):
P(DQi) = 1
exp[-DQi2/(2s2)] (6)
s (2 p)½P(DQi) = 1
exp[-DQi2/(2s2)] (6)
s (2 p)½
Equation (6) represents the classic bell curve that indicates the spread of variations from the mean. Assuming that this normal distribution implied by Eq. (6) applies adequately, 68% of all perforated tiles will have airflow within ±1s and 96% will be within ±2s.
PARAMETERS CONSIDERED IN CFD MODELS As indicated above, the parameters investigated here are:
1) floor plan 2) tile type (% open area), 3) leakage rate, and 4) plenum depth.
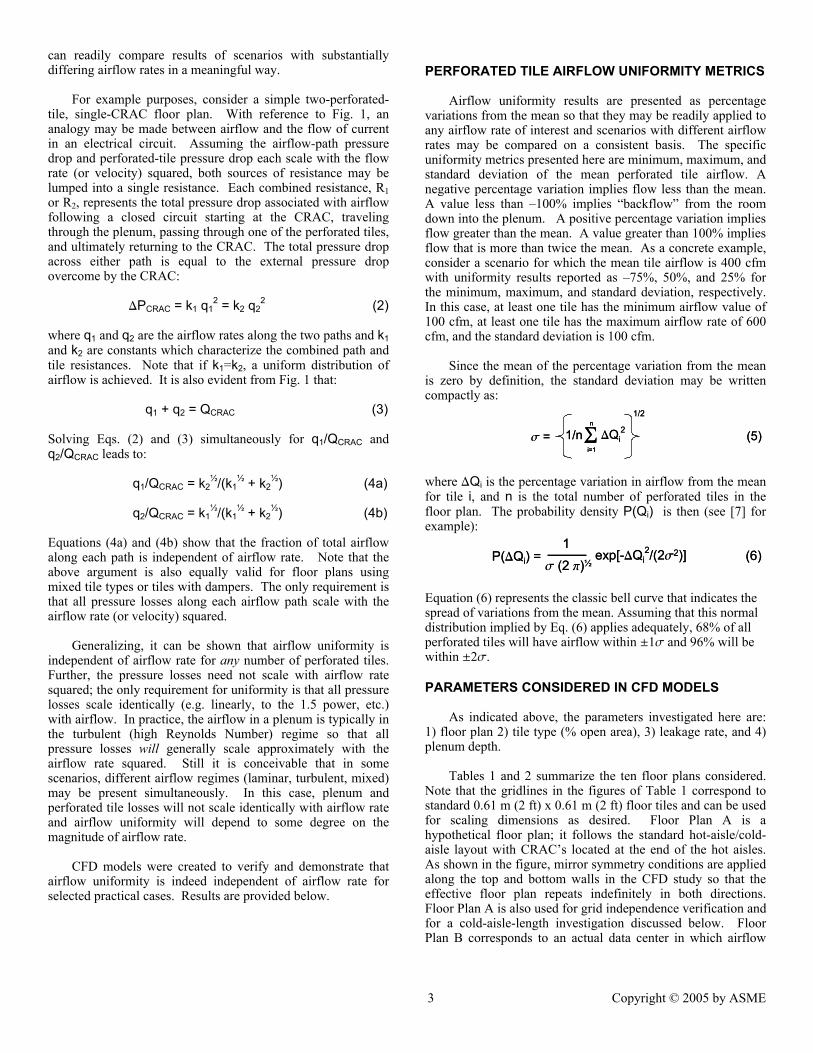
Tables 1 and 2 summarize the ten floor plans considered.
Note that the gridlines in the figures of Table 1 correspond to standard 0.61 m (2 ft) x 0.61 m (2 ft) floor tiles and can be used for scaling dimensions as desired. Floor Plan A is a hypothetical floor plan; it follows the standard hot-aisle/cold-aisle layout with CRAC’s located at the end of the hot aisles. As shown in the figure, mirror symmetry conditions are applied along the top and bottom walls in the CFD study so that the effective floor plan repeats indefinitely in both directions. Floor Plan A is also used for grid independence verification and for a cold-aisle-length investigation discussed below. Floor Plan B corresponds to an actual data center in which airflow
4 Copyright © 2005 by ASME
measurements were made; these results are used to verify the CFD model used for all scenarios. Floor Plans C through J are based on actual data centers, which have been previously modeled with CFD. Only the basic floor plans including CRAC, perforated floor tile, and plenum-ducted IT equipment locations are retained for the present study.
Table 1 – Floor Plans Modeled
Solid Floor Tile
Plenum-Ducted IT Equipment
Perforated Floor Tile
CRAC
A) B)
C) D)
E) F)
G) H)
I) J)
A B
Symmetry
Symmetryx
Table 1 – Floor Plans Modeled
Solid Floor Tile
Plenum-Ducted IT Equipment
Perforated Floor Tile
CRAC
Solid Floor Tile
Plenum-Ducted IT Equipment
Perforated Floor Tile
CRAC
A) B)
C) D)
E) F)
G) H)
I) J)
A B
Symmetry
Symmetryx
Table 2 – Summary Data for Floor Plans Modeled
(m2) (ft2) (m3/s) (cfm) (m3/s) (cfm) (m3/s) (cfm) (m3/s) (cfm) (m3/s) (cfm)A 99 1,064 4 17.0 36,000 0 0 52 0.33 692 0.26 554 0.20 415B 111 1,200 2 4.8 10,184 0 0 60 0.08 170 0.06 136 0.05 102C 333 3,588 8 38.5 81,585 0 0 131 0.29 623 0.24 498 0.18 374D 98 1,052 3 18.1 38,400 0 0 28 0.65 1371 0.52 1097 0.39 823E 160 1,724 4 29.4 62,300 4.7 10,000 44 0.56 1189 0.45 951 0.34 713F 462 4,972 18 68.0 144,000 0 0 193 0.35 746 0.28 597 0.21 448G 278 2,989 17 64.2 136,000 49.8 105,600 23 0.62 1322 0.50 1057 0.37 793H 191 2,059 9 34.0 72,000 14.5 30,800 48 0.41 858 0.32 687 0.24 515I 1,515 16,310 8 44.3 93,768 0 0 162 0.27 579 0.22 463 0.16 347J 112 1,202 2 8.5 18,000 0 0 32 0.27 563 0.21 450 0.16 338
Floor Plan
CRAC'sTotal Floor Area Total Airflow#
# of Perf. Tiles
Total IT Airflow0% leakage 20% leakage 40% leakage
Perforated Tile Mean Airflow
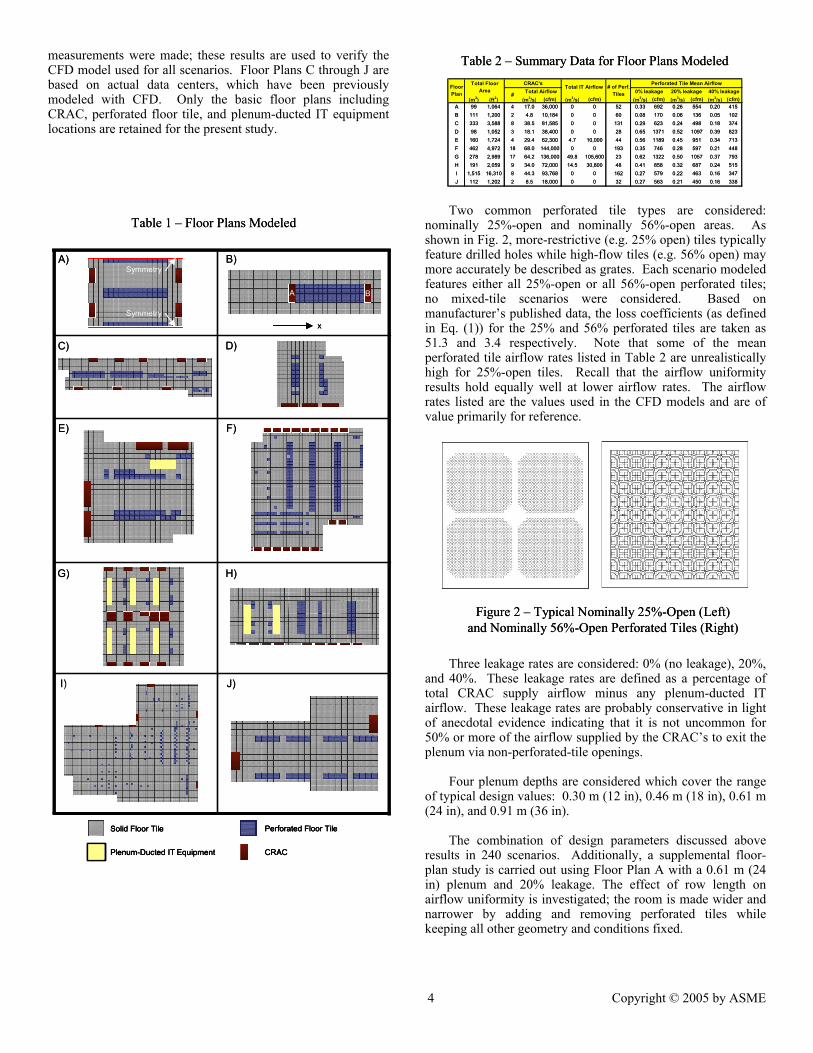
Two common perforated tile types are considered:
nominally 25%-open and nominally 56%-open areas. As shown in Fig. 2, more-restrictive (e.g. 25% open) tiles typically feature drilled holes while high-flow tiles (e.g. 56% open) may more accurately be described as grates. Each scenario modeled features either all 25%-open or all 56%-open perforated tiles; no mixed-tile scenarios were considered. Based on manufacturer’s published data, the loss coefficients (as defined in Eq. (1)) for the 25% and 56% perforated tiles are taken as 51.3 and 3.4 respectively. Note that some of the mean perforated tile airflow rates listed in Table 2 are unrealistically high for 25%-open tiles. Recall that the airflow uniformity results hold equally well at lower airflow rates. The airflow rates listed are the values used in the CFD models and are of value primarily for reference.
Figure 2 – Typical Nominally 25%-Open (Left) and Nominally 56%-Open Perforated Tiles (Right)
Figure 2 – Typical Nominally 25%-Open (Left) and Nominally 56%-Open Perforated Tiles (Right)
Three leakage rates are considered: 0% (no leakage), 20%, and 40%. These leakage rates are defined as a percentage of total CRAC supply airflow minus any plenum-ducted IT airflow. These leakage rates are probably conservative in light of anecdotal evidence indicating that it is not uncommon for 50% or more of the airflow supplied by the CRAC’s to exit the plenum via non-perforated-tile openings.
Four plenum depths are considered which cover the range
of typical design values: 0.30 m (12 in), 0.46 m (18 in), 0.61 m (24 in), and 0.91 m (36 in).
The combination of design parameters discussed above
results in 240 scenarios. Additionally, a supplemental floor-plan study is carried out using Floor Plan A with a 0.61 m (24 in) plenum and 20% leakage. The effect of row length on airflow uniformity is investigated; the room is made wider and narrower by adding and removing perforated tiles while keeping all other geometry and conditions fixed.
5 Copyright © 2005 by ASME
CFD MODELING CONSIDERATIONS Only the plenum airflow is modeled in this investigation
with a zero pressure boundary condition imposed above the raised floor. In practice, the flow in the plenum is fairly decoupled from the room flow for fairly restrictive perforated tiles like the 25%-open type. With less restrictive tiles, like the 56%-open type, the plenum and room (above the raised floor) airflow are somewhat coupled. In this case, room airflow dynamics can affect the perforated tile airflow distribution. Since only the plenum is modeled here, the results are strictly applicable only to the case of uniform room pressure above the tiles.
As mentioned above, obstructions are not included in the
CFD models. While obstructions may significantly impact airflow uniformity, the effects are typically fairly localized. Furthermore, given the fairly random nature of obstructions, it is difficult to quantify the effects of obstructions in any useful manner.
Perforated tiles are modeled with the pressure-airflow
relationship given in Eq. (1) and the loss coefficients indicated above.
As discussed above, leakage airflow is driven by a pressure
difference and may vary widely across the data center floor. One reasonable approach to modeling leakage would be to represent the raised floor as a resistance with a particular loss coefficient, which establishes the local leakage airflow based on local pressure difference across the raised floor. While physically realistic, this model is not ideally suited for present purposes because, following this approach, the total amount of leakage airflow is not known a priori; it is an output from the simulation. Therefore, the approach taken here is to simply remove (via a mass sink located just under the raised floor) the leakage airflow uniformly across the floor plan. This is convenient for defining leakage rates (e.g. 0%, 20%, and 40%) and is deemed adequate in light of the real variations in leakage paths and other assumptions in the models.
CRAC’s are modeled with fixed airflow rates. This is
justifiable as the external (e.g., plenum and perforated tile) resistance is much less than the internal CRAC resistance, which may be 250 to 750 Pa (1 to 3 in H2O) or more. Blower outlets are modeled explicitly with the exception of Floor Plan I for which the airflow is specified uniformly over the entire CRAC footprint. Turning vanes are not included in any cases as the details of which vary from vendor to vendor. Furthermore, as turning vanes generally keep stronger jets in tact farther from the CRAC, they lead to decreased airflow uniformity compared to simply allowing the airflow from the CRAC to diffuse more evenly over the subfloor.
IT equipment which draw air directly from the plenum
(“plenum-ducted” in Table 1) are also modeled with fixed airflow rates and the (outward) flow is specified as leaving the plenum uniformly over the entire IT equipment footprint. Note that most IT equipment does not draw air directly from the plenum and therefore is not included in the plenum-only
models. It is noted that for floor plans including plenum-ducted IT equipment (E, G, and H), airflow uniformity results hold at different flow rates only when IT airflow is scaled up or down in proportion with the total CRAC and leakage airflow.
FLOVENT V5.1 by Flomerics [8] was used for all CFD
modeling. A structured Cartesian grid and the k-ε turbulence model were used for all simulations. Total simulation time for the primary 240 scenarios was approximately 1 week on a 3.4 GHz Pentium 4 computer.
CALIBRATION AND EXPERIMENTAL VERIFICTION OF CFD MODEL
Floor Plan A with 0.23 m (9 in) and 0.61 m (24 in) deep
plenums was used to assure that results were grid-independent. The maximum length of any side of any grid cell was systematically reduced until predicted tile airflow results stabilized. Ultimately, a grid size was selected with the following characteristics: a maximum cell size of 15 cm (6 in), a minimum cell size of 2.5 cm (1 in), and a minimum of 8 cells in the plenum-depth direction. These grid settings were then applied to all cases.
Experimental Verification of CFD Model In order to verify the modeling methodology used in this
paper, the experimental results reported in [6] are used. Specifically, one of the six layouts studied in [6] is used here for this verification and is depicted in Table 1 as Floor Plan B with the results shown in Fig. 3. The case studied is an array of 4 x 15 perforated tiles situated between the 2 CRAC units. The experiments were performed on a portion of a large raised-floor data center located at IBM in Poughkeepsie, New York. This area measured 6.06 (20 ft) x 20 m (66 ft) with a raised floor height of 29.2 cm (11.5 in). The floor tiles were 610 mm (2 ft) on a side with the position of the CRAC units as noted in the plan view shown in the figure. The CRAC units were positioned such that the momentum of the air exhausting from the blowers within the CRAC units were directed toward each other, that is, the air was exhausting such that it collided in a region between the two CRAC units. To accurately measure the flow exhausting from the tiles and to account for all the flow exiting the CRAC units, this testing area of the floor was blocked off around the perimeter of the testing area from the raised floor down to the concrete subfloor. This 29.2 cm (11.5 in) height (as measured from the subfloor to the bottom of the tile) was carefully sealed with cardboard and duct tape. In addition, any electrical or plumbing openings in this area were also sealed.
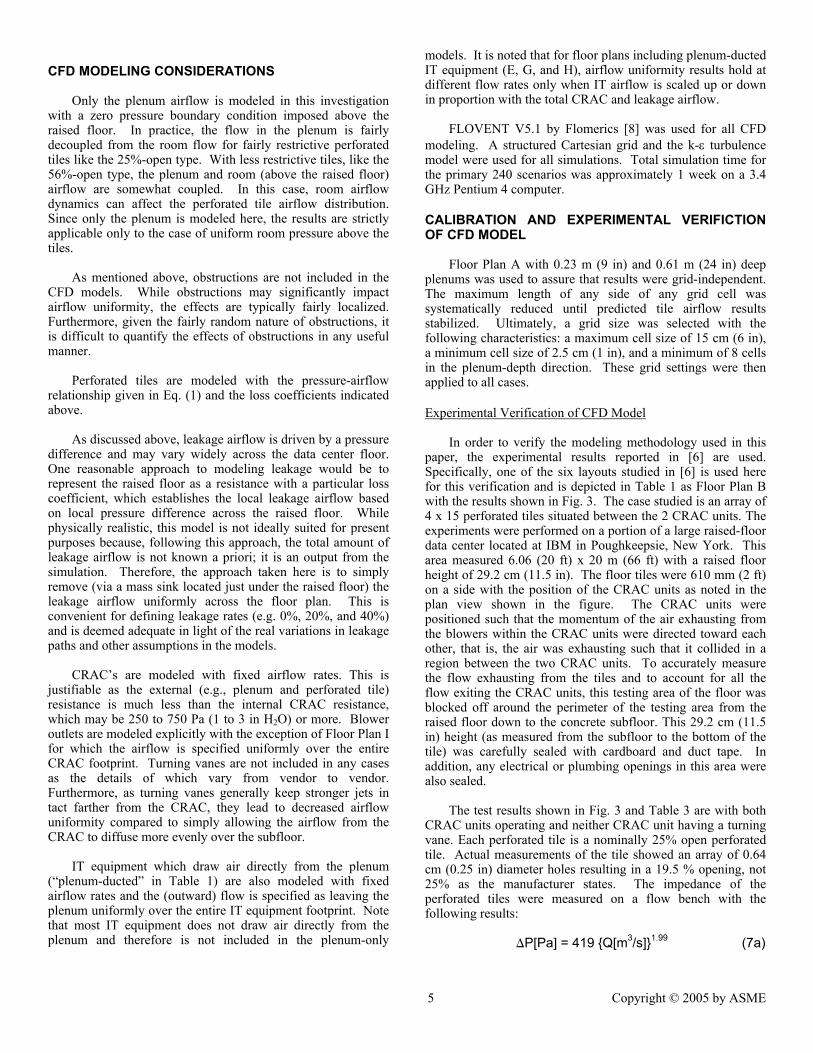
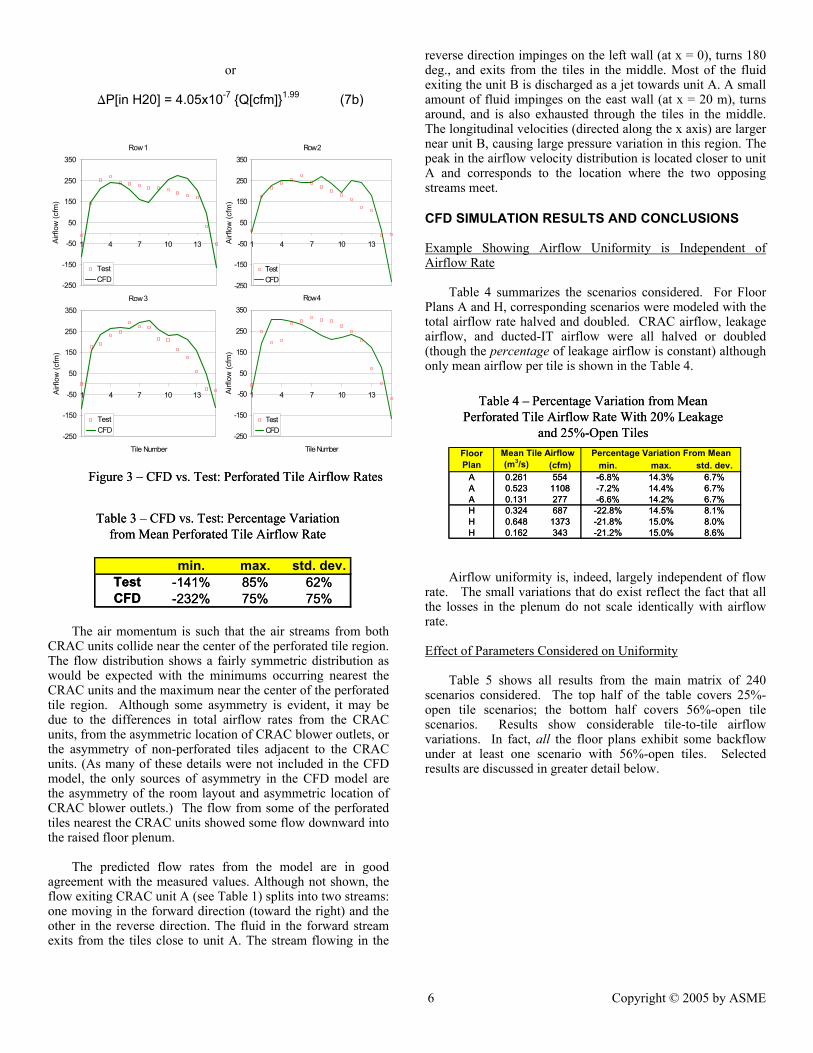
The test results shown in Fig. 3 and Table 3 are with both
CRAC units operating and neither CRAC unit having a turning vane. Each perforated tile is a nominally 25% open perforated tile. Actual measurements of the tile showed an array of 0.64 cm (0.25 in) diameter holes resulting in a 19.5 % opening, not 25% as the manufacturer states. The impedance of the perforated tiles were measured on a flow bench with the following results:
DP[Pa] = 419 {Q[m3/s]}1.99 (7a)
6 Copyright © 2005 by ASME
or
DP[in H20] = 4.05x10⁻⁷ {Q[cfm]}1.99 (7b)
Figure 3 – CFD vs. Test: Perforated Tile Airflow Rates
Row 1
-250
-150
-50
50
150
250
350
1 4 7 10 13
Tile Number
Airf
low
(cfm
)
TestCFD
Row 2
-250
-150
-50
50
150
250
350
1 4 7 10 13
Tile Number
Airf
low
(cfm
)
TestCFD
Row 3
-250
-150
-50
50
150
250
350
1 4 7 10 13
Tile Number
Airf
low
(cfm
)
TestCFD
Row 4
-250
-150
-50
50
150
250
350
1 4 7 10 13
Tile Number
Airf
low
(cfm
)
TestCFD
Table 3 – CFD vs. Test: Percentage Variation from Mean Perforated Tile Airflow Rate
min. max. std. dev.Test -141% 85% 62%CFD -232% 75% 75%
Table 3 – CFD vs. Test: Percentage Variation from Mean Perforated Tile Airflow Rate
min. max. std. dev.Test -141% 85% 62%CFD -232% 75% 75%
The air momentum is such that the air streams from both
CRAC units collide near the center of the perforated tile region. The flow distribution shows a fairly symmetric distribution as would be expected with the minimums occurring nearest the CRAC units and the maximum near the center of the perforated tile region. Although some asymmetry is evident, it may be due to the differences in total airflow rates from the CRAC units, from the asymmetric location of CRAC blower outlets, or the asymmetry of non-perforated tiles adjacent to the CRAC units. (As many of these details were not included in the CFD model, the only sources of asymmetry in the CFD model are the asymmetry of the room layout and asymmetric location of CRAC blower outlets.) The flow from some of the perforated tiles nearest the CRAC units showed some flow downward into the raised floor plenum.
The predicted flow rates from the model are in good
agreement with the measured values. Although not shown, the flow exiting CRAC unit A (see Table 1) splits into two streams: one moving in the forward direction (toward the right) and the other in the reverse direction. The fluid in the forward stream exits from the tiles close to unit A. The stream flowing in the
reverse direction impinges on the left wall (at x = 0), turns 180 deg., and exits from the tiles in the middle. Most of the fluid exiting the unit B is discharged as a jet towards unit A. A small amount of fluid impinges on the east wall (at x = 20 m), turns around, and is also exhausted through the tiles in the middle. The longitudinal velocities (directed along the x axis) are larger near unit B, causing large pressure variation in this region. The peak in the airflow velocity distribution is located closer to unit A and corresponds to the location where the two opposing streams meet.
CFD SIMULATION RESULTS AND CONCLUSIONS
Example Showing Airflow Uniformity is Independent of Airflow Rate
Table 4 summarizes the scenarios considered. For Floor
Plans A and H, corresponding scenarios were modeled with the total airflow rate halved and doubled. CRAC airflow, leakage airflow, and ducted-IT airflow were all halved or doubled (though the percentage of leakage airflow is constant) although only mean airflow per tile is shown in the Table 4.
Table 4 – Percentage Variation from Mean
Perforated Tile Airflow Rate With 20% Leakage and 25%-Open Tiles
(m3/s) (cfm) min. max. std. dev.A 0.261 554 -6.8% 14.3% 6.7%A 0.523 1108 -7.2% 14.4% 6.7%A 0.131 277 -6.6% 14.2% 6.7%H 0.324 687 -22.8% 14.5% 8.1%H 0.648 1373 -21.8% 15.0% 8.0%H 0.162 343 -21.2% 15.0% 8.6%
Mean Tile Airflow Percentage Variation From MeanFloor Plan
Table 4 – Percentage Variation from Mean Perforated Tile Airflow Rate With 20% Leakage
and 25%-Open Tiles
(m3/s) (cfm) min. max. std. dev.A 0.261 554 -6.8% 14.3% 6.7%A 0.523 1108 -7.2% 14.4% 6.7%A 0.131 277 -6.6% 14.2% 6.7%H 0.324 687 -22.8% 14.5% 8.1%H 0.648 1373 -21.8% 15.0% 8.0%H 0.162 343 -21.2% 15.0% 8.6%
Mean Tile Airflow Percentage Variation From MeanFloor Plan
Airflow uniformity is, indeed, largely independent of flow
rate. The small variations that do exist reflect the fact that all the losses in the plenum do not scale identically with airflow rate.
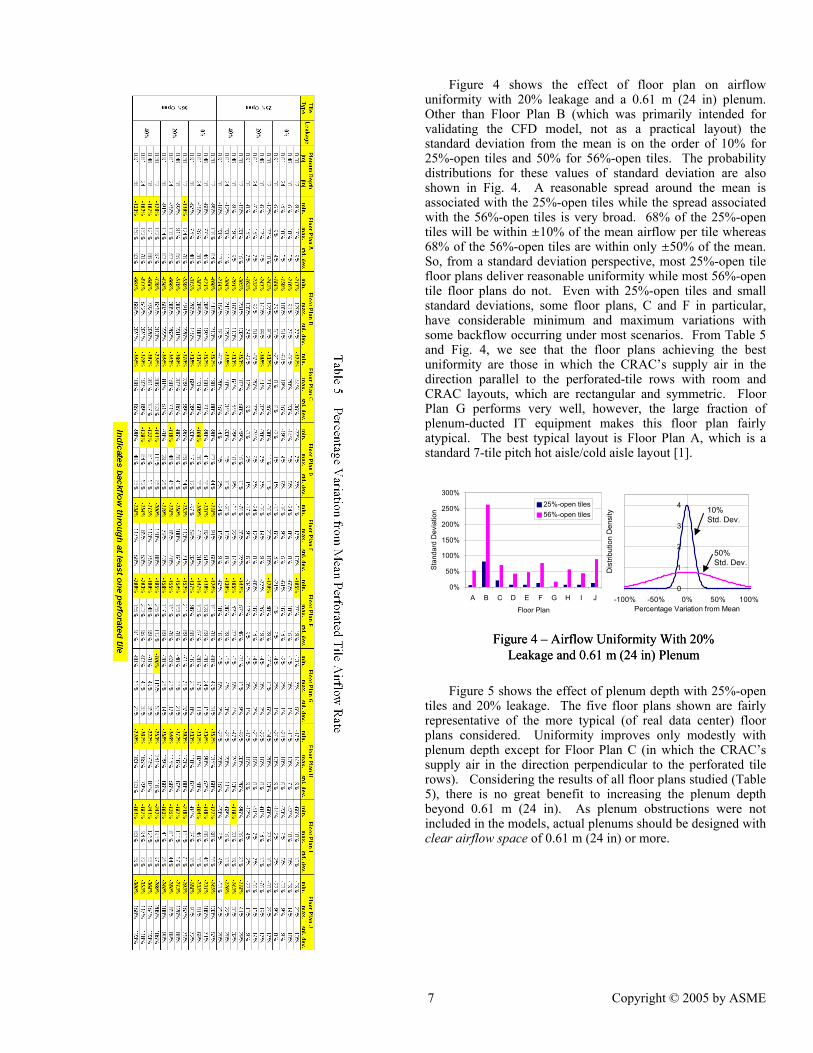
Effect of Parameters Considered on Uniformity
Table 5 shows all results from the main matrix of 240
scenarios considered. The top half of the table covers 25%-open tile scenarios; the bottom half covers 56%-open tile scenarios. Results show considerable tile-to-tile airflow variations. In fact, all the floor plans exhibit some backflow under at least one scenario with 56%-open tiles. Selected results are discussed in greater detail below.
7 Copyright © 2005 by ASME
Figure 4 shows the effect of floor plan on airflow uniformity with 20% leakage and a 0.61 m (24 in) plenum. Other than Floor Plan B (which was primarily intended for validating the CFD model, not as a practical layout) the standard deviation from the mean is on the order of 10% for 25%-open tiles and 50% for 56%-open tiles. The probability distributions for these values of standard deviation are also shown in Fig. 4. A reasonable spread around the mean is associated with the 25%-open tiles while the spread associated with the 56%-open tiles is very broad. 68% of the 25%-open tiles will be within ±10% of the mean airflow per tile whereas 68% of the 56%-open tiles are within only ±50% of the mean. So, from a standard deviation perspective, most 25%-open tile floor plans deliver reasonable uniformity while most 56%-open tile floor plans do not. Even with 25%-open tiles and small standard deviations, some floor plans, C and F in particular, have considerable minimum and maximum variations with some backflow occurring under most scenarios. From Table 5 and Fig. 4, we see that the floor plans achieving the best uniformity are those in which the CRAC’s supply air in the direction parallel to the perforated-tile rows with room and CRAC layouts, which are rectangular and symmetric. Floor Plan G performs very well, however, the large fraction of plenum-ducted IT equipment makes this floor plan fairly atypical. The best typical layout is Floor Plan A, which is a standard 7-tile pitch hot aisle/cold aisle layout [1].
Figure 4 – Airflow Uniformity With 20% Leakage and 0.61 m (24 in) Plenum
0
1
2
3
4
-100% -50% 0% 50% 100%Percentage Variation from Mean
Dis
tribu
tion
Den
sity 10%
Std. Dev.
50%Std. Dev.
0%
50%
100%
150%
200%
250%
300%
A B C D E F G H I J
Floor Plan
Sta
ndar
d D
evia
tion
25%-open tiles56%-open tiles
0
1
2
3
4
-100% -50% 0% 50% 100%Percentage Variation from Mean
Dis
tribu
tion
Den
sity 10%
Std. Dev.
50%Std. Dev.
0%
50%
100%
150%
200%
250%
300%
A B C D E F G H I J
Floor Plan
Sta
ndar
d D
evia
tion
25%-open tiles56%-open tiles
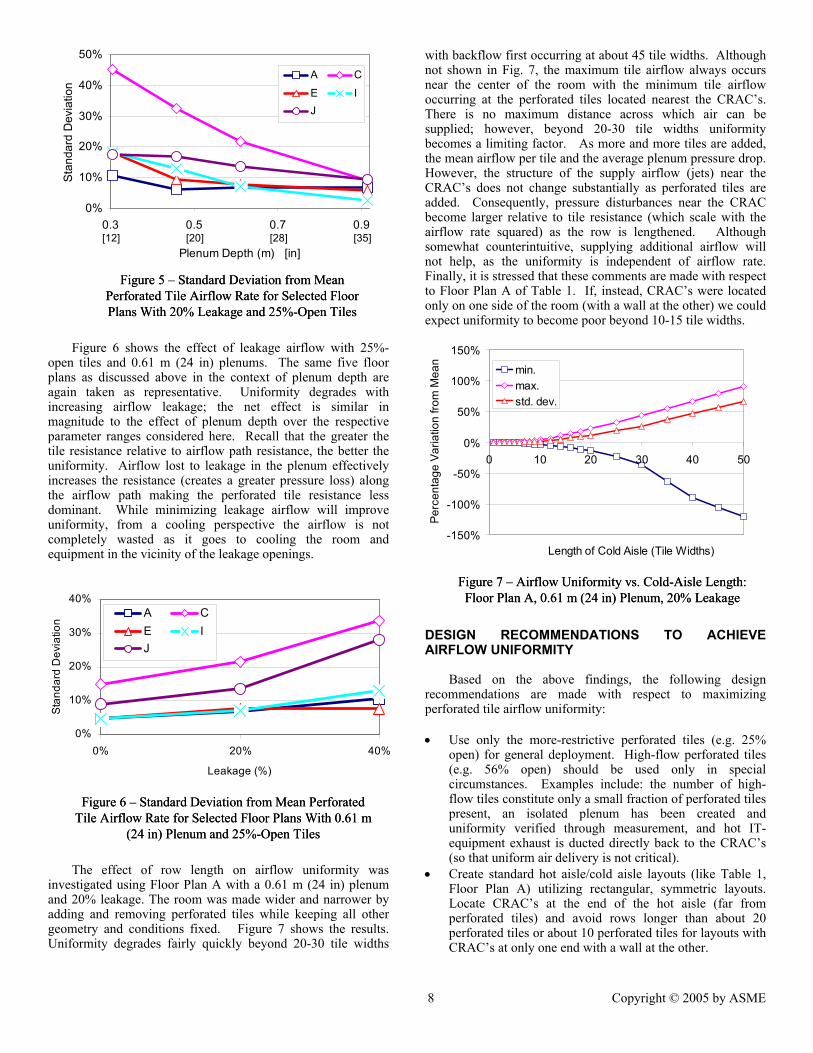
Figure 5 shows the effect of plenum depth with 25%-open
tiles and 20% leakage. The five floor plans shown are fairly representative of the more typical (of real data center) floor plans considered. Uniformity improves only modestly with plenum depth except for Floor Plan C (in which the CRAC’s supply air in the direction perpendicular to the perforated tile rows). Considering the results of all floor plans studied (Table 5), there is no great benefit to increasing the plenum depth beyond 0.61 m (24 in). As plenum obstructions were not included in the models, actual plenums should be designed with clear airflow space of 0.61 m (24 in) or more.
8 Copyright © 2005 by ASME
Figure 5 – Standard Deviation from Mean Perforated Tile Airflow Rate for Selected Floor Plans With 20% Leakage and 25%-Open Tiles
0%
10%
20%
30%
40%
50%
0.3 0.5 0.7 0.9
Plenum Depth (m) [in]
Sta
ndar
d D
evia
tion
A C
E IJ
[12] [20] [28] [35]
Figure 5 – Standard Deviation from Mean Perforated Tile Airflow Rate for Selected Floor Plans With 20% Leakage and 25%-Open Tiles
0%
10%
20%
30%
40%
50%
0.3 0.5 0.7 0.9
Plenum Depth (m) [in]
Sta
ndar
d D
evia
tion
A C
E IJ
[12] [20] [28] [35]
0%
10%
20%
30%
40%
50%
0.3 0.5 0.7 0.9
Plenum Depth (m) [in]
Sta
ndar
d D
evia
tion
A C
E IJ
[12] [20] [28] [35]
Figure 6 shows the effect of leakage airflow with 25%-
open tiles and 0.61 m (24 in) plenums. The same five floor plans as discussed above in the context of plenum depth are again taken as representative. Uniformity degrades with increasing airflow leakage; the net effect is similar in magnitude to the effect of plenum depth over the respective parameter ranges considered here. Recall that the greater the tile resistance relative to airflow path resistance, the better the uniformity. Airflow lost to leakage in the plenum effectively increases the resistance (creates a greater pressure loss) along the airflow path making the perforated tile resistance less dominant. While minimizing leakage airflow will improve uniformity, from a cooling perspective the airflow is not completely wasted as it goes to cooling the room and equipment in the vicinity of the leakage openings.
The effect of row length on airflow uniformity was
investigated using Floor Plan A with a 0.61 m (24 in) plenum and 20% leakage. The room was made wider and narrower by adding and removing perforated tiles while keeping all other geometry and conditions fixed. Figure 7 shows the results. Uniformity degrades fairly quickly beyond 20-30 tile widths
with backflow first occurring at about 45 tile widths. Although not shown in Fig. 7, the maximum tile airflow always occurs near the center of the room with the minimum tile airflow occurring at the perforated tiles located nearest the CRAC’s. There is no maximum distance across which air can be supplied; however, beyond 20-30 tile widths uniformity becomes a limiting factor. As more and more tiles are added, the mean airflow per tile and the average plenum pressure drop. However, the structure of the supply airflow (jets) near the CRAC’s does not change substantially as perforated tiles are added. Consequently, pressure disturbances near the CRAC become larger relative to tile resistance (which scale with the airflow rate squared) as the row is lengthened. Although somewhat counterintuitive, supplying additional airflow will not help, as the uniformity is independent of airflow rate. Finally, it is stressed that these comments are made with respect to Floor Plan A of Table 1. If, instead, CRAC’s were located only on one side of the room (with a wall at the other) we could expect uniformity to become poor beyond 10-15 tile widths.
Figure 7 – Airflow Uniformity vs. Cold-Aisle Length: Floor Plan A, 0.61 m (24 in) Plenum, 20% Leakage
-150%
-100%
-50%
0%
50%
100%
150%
0 10 20 30 40 50
Length of Cold Aisle (Tile Widths)
Perc
enta
ge V
aria
tion
from
Mea
n
min.max.std. dev.
Figure 7 – Airflow Uniformity vs. Cold-Aisle Length: Floor Plan A, 0.61 m (24 in) Plenum, 20% Leakage
-150%
-100%
-50%
0%
50%
100%
150%
0 10 20 30 40 50
Length of Cold Aisle (Tile Widths)
Perc
enta
ge V
aria
tion
from
Mea
n
min.max.std. dev.
DESIGN RECOMMENDATIONS TO ACHIEVE AIRFLOW UNIFORMITY
Based on the above findings, the following design
recommendations are made with respect to maximizing perforated tile airflow uniformity:
• Use only the more-restrictive perforated tiles (e.g. 25%
open) for general deployment. High-flow perforated tiles (e.g. 56% open) should be used only in special circumstances. Examples include: the number of high-flow tiles constitute only a small fraction of perforated tiles present, an isolated plenum has been created and uniformity verified through measurement, and hot IT-equipment exhaust is ducted directly back to the CRAC’s (so that uniform air delivery is not critical).
• Create standard hot aisle/cold aisle layouts (like Table 1, Floor Plan A) utilizing rectangular, symmetric layouts. Locate CRAC’s at the end of the hot aisle (far from perforated tiles) and avoid rows longer than about 20 perforated tiles or about 10 perforated tiles for layouts with CRAC’s at only one end with a wall at the other.
Figure 6 – Standard Deviation from Mean Perforated Tile Airflow Rate for Selected Floor Plans With 0.61 m
(24 in) Plenum and 25%-Open Tiles
0%
10%
20%
30%
40%
0% 20% 40%
Leakage (%)
Sta
ndar
d D
evia
tion
A CE IJ
Figure 6 – Standard Deviation from Mean Perforated Tile Airflow Rate for Selected Floor Plans With 0.61 m
(24 in) Plenum and 25%-Open Tiles
0%
10%
20%
30%
40%
0% 20% 40%
Leakage (%)
Sta
ndar
d D
evia
tion
A CE IJ
9 Copyright © 2005 by ASME
• Design plenums for clear airflow space of 0.61 m (24 in) or more.
• Minimize leakage airflow through non-perforated tile openings in the raised floor.
• Keep chilled water pipes and cables away from the exhaust regions of A/C units and only use turning vanes where the A/C units are used in an inline layout where each is used to boost the static pressure of the next in line [6].
• Do not simply increase airflow rate without addressing the other factors listed above, as this will not improve uniformity.
REFERENCES
[1] “Thermal Guidelines for Data Processing Environments”, American Society of Heating, Refrigerating, and Air-Conditioning Engineers (ASHRAE) 2004
[2] “Optimizing Data Centers for High-Density
Computing”, Hewlett-Packard Technology Brief, http://h200005.www2.hp.com/bc/docs/support/SupportManual/c00064724/c00064724.pdf
[3] The Uptime Institute. “Alternating Cold and Hot Aisles
Provides More Reliable Cooling for Server Farms”. http://www.upsite.com/TUIpages/whitepapers/tuiaisles.html
[4] VanGilder, J. and Lee, T., 2003, “A Hybrid Flow
Network-CFD Method for Achieving Any Desired Flow Partitioning Through Tiles of a Raised-Floor Data Center”, InterPACK 2003, Maui, Hawaii.
[5] Kang, S., Schmidt, R., Kelkar, K., Patankar, S., “A
Methodology for the Design of Perforated Tiles in Raised Floor Data Centers Using Computational Flow Analysis”, IEEE-CPMT Journal, Vol. 24, No. 2, pp. 177-183, June 2001.
[6] Schmidt, R. et al, 2001, “Measurements and Predictions
of the Flow Distribution Through Perforated Floor Tiles In a Raised-Floor Data Center”, InterPACK 2001, Kauai, Hawaii.
[7] Holman, J.P., 1989, Experimental Methods for
Engineers, McGraw-Hill, Inc., New York., pp.49-50, 57. [8] FLOVENT V5.1 Software by Flomerics, Flomerics Ltd.,
81 Bridge Road, Hampton Court, Surrey KT8 9HH, UK, http://www.flomerics.com