Embed Size (px)
Citation preview
Airflow in the Ventilation SpaceBehind a Rain Screen Wall
Therese K. Stovall, P.E. Achilles Karagiozis, Ph.D.Member ASHRAE
ABSTRACT
The inclusion of a ventilated airspace within a wall has been shown to improve the moisture transport of the wall assembly.Experimental data describing the airflow within such a cavity are available for a limited range of weather conditions and geomet-ric configurations, but general relationships between the ventilation within the wall and external weather variables are not. There-fore, a series of steady-state numerical models was constructed to explore the influence of weather variables, including wind speed,insolation, and outdoor air temperature, for brick rain screen wall configurations. These configurations included multiple cavitydepths and vent sizes. All models were based on a single-story building height with wind perpendicular to the wall. The resultswere used to develop a number of correlations intended to supplement the accuracy of transient hygrothermal models.
INTRODUCTION
The inclusion of a ventilated airspace within a wall hasbeen shown to improve the moisture transport of the wallassembly. The purpose of the analysis reported here was toproduce general relationships that describe the airflowthrough a rain screen wall configuration in terms of weathervariables and ventilation cavity geometry. These correlationswere intended to supplement one- and two-dimensional tran-sient hygrothermal models. The effects of increasing thecavity depth and ventilation opening size were of particularinterest.
Vent and ventilation research has primarily focused onpressure equalization analysis, and only limited data are foundthat include the effects of moisture management. Most of thepast work including integrated heat, air, and moisture transferis found in Europe. An excellent summary of work in this fieldhas just been prepared by Straube (2004).
Experimental data describing the airflow within such acavity are available for a limited range of weather conditionsand geometric configurations. Schwarz (1973) measured thevelocity of the airflow in an open-jointed panel claddingsystem in a high-rise building. He found little relationship
between building height and cavity ventilation velocity. Poppet al. (1980) measured the ventilation velocity and airexchange rate behind asbestos cement and wood siding withvarious types of cavities and venting arrangements. It wasclear the drying rate was much faster when the cladding wasventilated, although even simple venting (small openingsthrough the cladding without a clear airflow space behind)improved the drying rate. Another project included fieldmeasurements of ventilation behind large cladding panels ona three-story building (Mayer and Kuenzel 1983; Kuenzel andMayer 1983, 1984 [as quoted by Straube (2004)]). Burnett andStraube (1995) conducted an experimental study of the flowresistance of vents and made detailed field measurements ofwind-driving pressures. Transient pressure measurementswere made for a rain screen façade, capturing the effect of vari-able wind conditions for a relatively tall building (Kumar andWisse 2001; Kumar et al. 2003). Hansen et al. (2002)performed a field study of ventilating cavities in timber-framed wall assemblies, including 12 different wall assem-blies with various types of cladding and wind barriers andventilated/nonventilated spaces and space/no space combina-tions. The authors concluded that ventilation had no signifi-
©2004 ASHRAE.
Therese K. Stovall and Achilles Karagiozis are senior research engineers at Oak Ridge National Laboratory, Oak Ridge, Tenn.
cant moisture control influence on timber-framed wallsystems. Recent experimental work on brick rain screenconfigurations includes that of Straube (1998) and Piñon et al.(2004). These experiments provide an essential foundation forall of the related analyses and simulations. In particular, thework by Mayer, Kuenzel, Straube, Burnett, and Piñon showedthat the most important factors for determining the ventilationflow rate were the wind pressure, thermal buoyancy, presenceof an unobstructed cavity, and vent area.
A number of pertinent analytical works complementthese experimental resources. One study was a theoreticalanalysis of the flow mechanics and drying physics of ventila-tion (Burnett and Straube 1995). Further analysis showed thatair flows through ventilation spaces due to the combinedeffects of wind pressure, thermal buoyancy, and moistureconcentration buoyancy (Straube 1998). Other analysts haveaddressed a number of issues pertinent to this geometry. Theeffect of discrete rough elements, such as could be caused byprotruding mortar joints, has been modeled for an enclosureby Shakerin et al. (1988). A finite element model for a morecompletely ventilated façade has been reported by Balocco(2001). A numerical model and related experiments for a rainscreen façade with a flexible back layer were reported by Choiand Wang (1998). Recent work by Piñon et al. (2004) includesan isothermal CFD model of a brick wall with a vent arrange-ment very similar to the one used here.
Recognizing that it is not feasible to experimentallymeasure the performance for every wall configuration in everypossible climate, one- and two-dimensional hygrothermalanalysis tools have been developed. These tools evaluate thetransient moisture performance of buildings over an extendedperiod using weather data for a variety of climates and phys-ical models of moisture storage and transport within the wallcomponents (Karagiozis 2001). However, these hygrothermalporous models usually employ Darcy’s equation for porousmedia and are thus unable to properly model the critical dryingcapabilities that result from the convective movement of airwithin the ventilation cavity. Therefore, air movements withina wall ventilation cavity caused by thermal buoyancy and windforces were examined in detail using computational fluiddynamics (CFD) tools more suited for such analysis. After theCFD results were benchmarked via comparison to the avail-able empirical data, the results were then correlated to weatherparameters and construction details in order to supplementthese broader hygrothermal analysis tools.
MODEL CONSTRUCTION
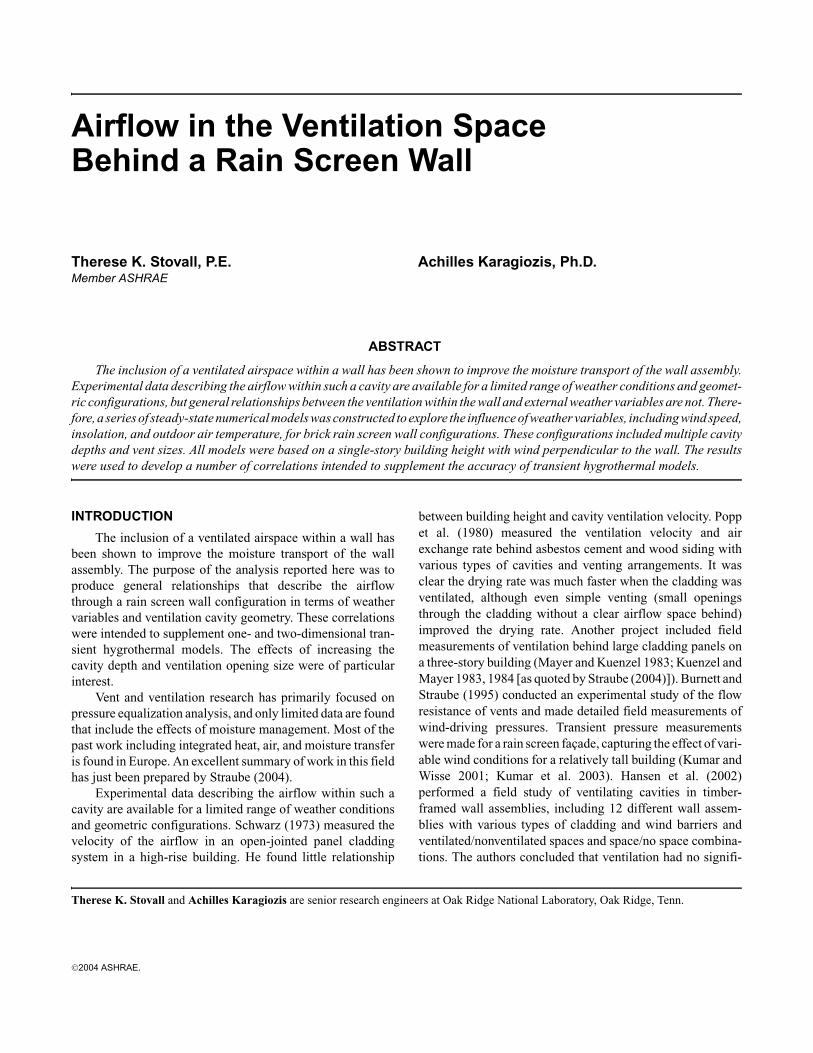
The wall structure considered here was a nominal 2 × 4wood-framed wall with gypsum drywall on the inside, insu-lated with glass fiber batt insulation, sheathed with a layer ofbuilding paper, and finished with a brick veneer on the outside.A ventilated wall cavity was located between the buildingpaper surface and the brick veneer, as shown in Figure 1. Thevents shown in this figure were each the size of a typical verti-cal mortar joint between bricks and were placed in vertical
pairs at a spacing that corresponds to a pair of vents placedafter every third brick.
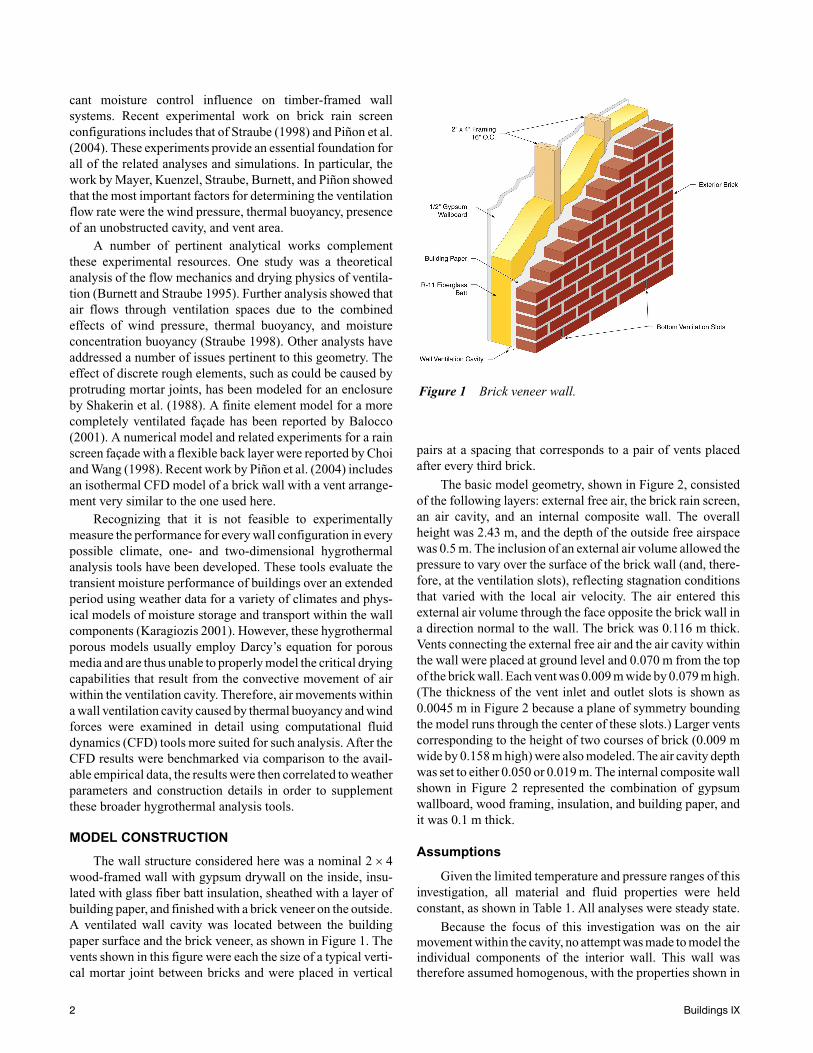
The basic model geometry, shown in Figure 2, consistedof the following layers: external free air, the brick rain screen,an air cavity, and an internal composite wall. The overallheight was 2.43 m, and the depth of the outside free airspacewas 0.5 m. The inclusion of an external air volume allowed thepressure to vary over the surface of the brick wall (and, there-fore, at the ventilation slots), reflecting stagnation conditionsthat varied with the local air velocity. The air entered thisexternal air volume through the face opposite the brick wall ina direction normal to the wall. The brick was 0.116 m thick.Vents connecting the external free air and the air cavity withinthe wall were placed at ground level and 0.070 m from the topof the brick wall. Each vent was 0.009 m wide by 0.079 m high.(The thickness of the vent inlet and outlet slots is shown as0.0045 m in Figure 2 because a plane of symmetry boundingthe model runs through the center of these slots.) Larger ventscorresponding to the height of two courses of brick (0.009 mwide by 0.158 m high) were also modeled. The air cavity depthwas set to either 0.050 or 0.019 m. The internal composite wallshown in Figure 2 represented the combination of gypsumwallboard, wood framing, insulation, and building paper, andit was 0.1 m thick.
Assumptions
Given the limited temperature and pressure ranges of thisinvestigation, all material and fluid properties were heldconstant, as shown in Table 1. All analyses were steady state.
Because the focus of this investigation was on the airmovement within the cavity, no attempt was made to model theindividual components of the interior wall. This wall wastherefore assumed homogenous, with the properties shown in
Figure 1 Brick veneer wall.
2 Buildings IX
Table 1. The surface of this wall opposite the ventilation cavitywas assumed to face a 295 K indoor environment with a natu-ral convection heat transfer coefficient on that surface of8.3 W/m2⋅K.
The nonuniformities of bricks and mortar joints arehighly variable and were not modeled. However, two air cavitydepths were evaluated—0.050 and 0.019 m—to investigatethe impact of flow restrictions.
Planes of symmetry were used at each side within the thincavity and for the sides of the brick and interior walls to repre-sent a relatively narrow section of a longer wall with orderedvent spacing. The top and bottom of the air cavity weremodeled as adiabatic smooth walls. The external air volumewas bounded by a plane of symmetry on one side (which alsopassed through the vent holes in the brick wall), an opening atthe other side with a constant relative pressure of 0 Pa, and anopening at the top with the relative pressure set to either 0 or2 Pa. This arrangement represents a wall section near thecenter of a much longer wall. The bottom of the external airvolume was assumed to be a smooth adiabatic surface.
The thermal buoyancy-driven flows were modeled usingthe Boussinesq approximation with constant density air. Thisapproximation adds a buoyancy momentum term to the equa-tion that is a function of the fluid’s thermal expansivity andtemperature (Kays and Crawford 1980; AEA TechnologyEngineering Software Ltd.).
Examination of local Reynolds numbers, as well as exper-imental data reported by Piñon et al. (2004), showed transi-tional and laminar flows in some portions of the air cavity.Results from the CFD model showed minimum Reynoldsnumbers ranging from 50 to 350 within the main portion of thecavity. Reynolds numbers within the ventilation slots rangedfrom 600 to 5500. However, significant regions of separatedand recirculating flow are also present because of the complexgeometry that includes sharp inlets, outlets, and elbows. Theturbulence approximation selected for this model uses localterms calculated for turbulence kinetic energy and turbulenceeddy dissipation (which varied by a factor of 1000 or morefrom one portion of the cavity to another) to reflect this vari-ability in flow characteristics. That is, in the laminar flowregions, the turbulence energy factors become very small.
Table 1. Material Properties
ThermalConductivity
(W/m⋅K)Density(kg/m3)
Specific Heat(J/kg⋅K)
Dynamic Viscosity (kg/m⋅s)
ThermalExpansivity
(1/K)
Brick wall 0.9 1920.0 790.0
Internal composite wall 0.056 158.0 1300.0
Dry air 0.0243 1.284 1003.8 1.72E-5 0.00367
Figure 2 Geometry of the simulated brick veneer wall, close-up view of the ventilation slots on right.
Buildings IX 3
To simulate the absorption of solar energy, a uniformenergy source was placed within a thin layer of the brick wallalong the surface facing the exterior airspace. This arrange-ment permits the local temperature to be determined by thecombination of three-dimensional heat conduction throughoutthe brick wall and the convective heat transfer conditions oneach surface of the wall.
Organization of the Parametric Evaluation
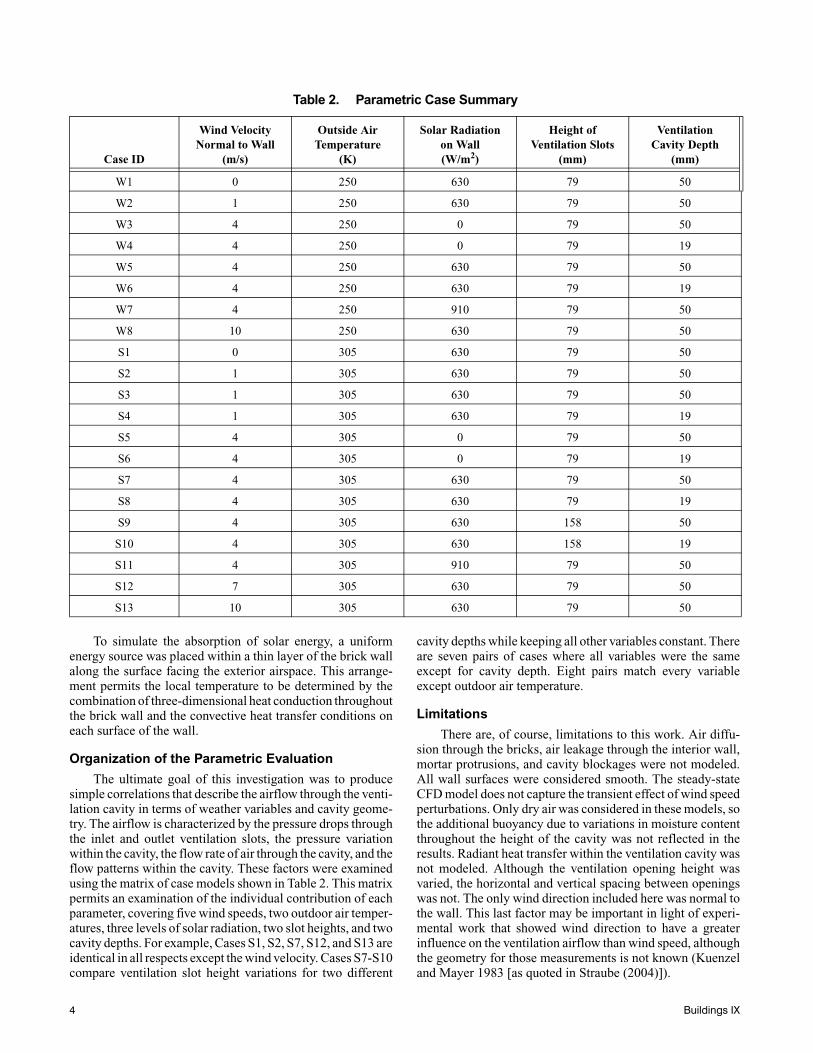
The ultimate goal of this investigation was to producesimple correlations that describe the airflow through the venti-lation cavity in terms of weather variables and cavity geome-try. The airflow is characterized by the pressure drops throughthe inlet and outlet ventilation slots, the pressure variationwithin the cavity, the flow rate of air through the cavity, and theflow patterns within the cavity. These factors were examinedusing the matrix of case models shown in Table 2. This matrixpermits an examination of the individual contribution of eachparameter, covering five wind speeds, two outdoor air temper-atures, three levels of solar radiation, two slot heights, and twocavity depths. For example, Cases S1, S2, S7, S12, and S13 areidentical in all respects except the wind velocity. Cases S7-S10compare ventilation slot height variations for two different
cavity depths while keeping all other variables constant. Thereare seven pairs of cases where all variables were the sameexcept for cavity depth. Eight pairs match every variableexcept outdoor air temperature.
Limitations
There are, of course, limitations to this work. Air diffu-sion through the bricks, air leakage through the interior wall,mortar protrusions, and cavity blockages were not modeled.All wall surfaces were considered smooth. The steady-stateCFD model does not capture the transient effect of wind speedperturbations. Only dry air was considered in these models, sothe additional buoyancy due to variations in moisture contentthroughout the height of the cavity was not reflected in theresults. Radiant heat transfer within the ventilation cavity wasnot modeled. Although the ventilation opening height wasvaried, the horizontal and vertical spacing between openingswas not. The only wind direction included here was normal tothe wall. This last factor may be important in light of experi-mental work that showed wind direction to have a greaterinfluence on the ventilation airflow than wind speed, althoughthe geometry for those measurements is not known (Kuenzeland Mayer 1983 [as quoted in Straube (2004)]).
Table 2. Parametric Case Summary
Case ID
Wind VelocityNormal to Wall
(m/s)
Outside AirTemperature
(K)
Solar Radiationon Wall(W/m2)
Height ofVentilation Slots
(mm)
VentilationCavity Depth
(mm)
W1 0 250 630 79 50
W2 1 250 630 79 50
W3 4 250 0 79 50
W4 4 250 0 79 19
W5 4 250 630 79 50
W6 4 250 630 79 19
W7 4 250 910 79 50
W8 10 250 630 79 50
S1 0 305 630 79 50
S2 1 305 630 79 50
S3 1 305 630 79 50
S4 1 305 630 79 19
S5 4 305 0 79 50
S6 4 305 0 79 19
S7 4 305 630 79 50
S8 4 305 630 79 19
S9 4 305 630 158 50
S10 4 305 630 158 19
S11 4 305 910 79 50
S12 7 305 630 79 50
S13 10 305 630 79 50
4 Buildings IX
MODEL VALIDATION
The CFD model was validated by comparison to experi-mental data. The points of comparison include flow field visu-alization, temperature differences, pressure drops, and airflowrates.
Flow Field Visualization
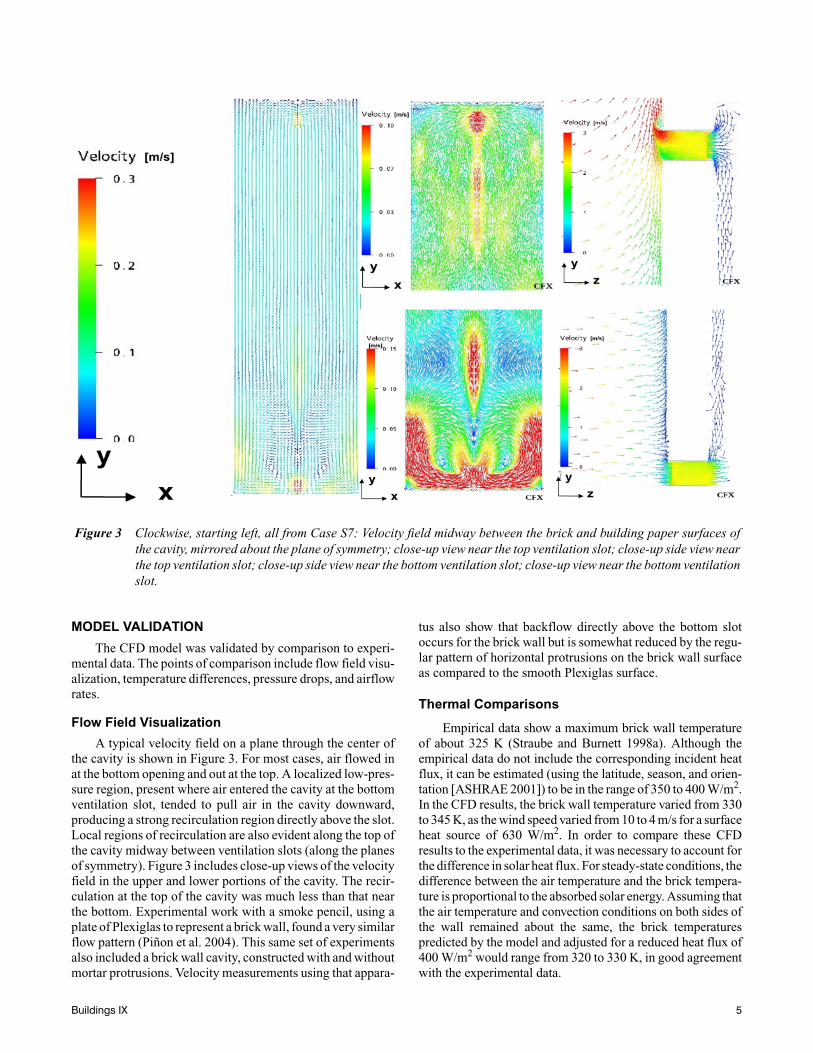
A typical velocity field on a plane through the center ofthe cavity is shown in Figure 3. For most cases, air flowed inat the bottom opening and out at the top. A localized low-pres-sure region, present where air entered the cavity at the bottomventilation slot, tended to pull air in the cavity downward,producing a strong recirculation region directly above the slot.Local regions of recirculation are also evident along the top ofthe cavity midway between ventilation slots (along the planesof symmetry). Figure 3 includes close-up views of the velocityfield in the upper and lower portions of the cavity. The recir-culation at the top of the cavity was much less than that nearthe bottom. Experimental work with a smoke pencil, using aplate of Plexiglas to represent a brick wall, found a very similarflow pattern (Piñon et al. 2004). This same set of experimentsalso included a brick wall cavity, constructed with and withoutmortar protrusions. Velocity measurements using that appara-
tus also show that backflow directly above the bottom slotoccurs for the brick wall but is somewhat reduced by the regu-lar pattern of horizontal protrusions on the brick wall surfaceas compared to the smooth Plexiglas surface.
Thermal Comparisons
Empirical data show a maximum brick wall temperatureof about 325 K (Straube and Burnett 1998a). Although theempirical data do not include the corresponding incident heatflux, it can be estimated (using the latitude, season, and orien-tation [ASHRAE 2001]) to be in the range of 350 to 400 W/m2.In the CFD results, the brick wall temperature varied from 330to 345 K, as the wind speed varied from 10 to 4 m/s for a surfaceheat source of 630 W/m2. In order to compare these CFDresults to the experimental data, it was necessary to account forthe difference in solar heat flux. For steady-state conditions, thedifference between the air temperature and the brick tempera-ture is proportional to the absorbed solar energy. Assuming thatthe air temperature and convection conditions on both sides ofthe wall remained about the same, the brick temperaturespredicted by the model and adjusted for a reduced heat flux of400 W/m2 would range from 320 to 330 K, in good agreementwith the experimental data.
Figure 3 Clockwise, starting left, all from Case S7: Velocity field midway between the brick and building paper surfaces ofthe cavity, mirrored about the plane of symmetry; close-up view near the top ventilation slot; close-up side view nearthe top ventilation slot; close-up side view near the bottom ventilation slot; close-up view near the bottom ventilationslot.
Buildings IX 5
From the same experimental data, the difference betweenoutdoor air temperature and cavity air temperature rangedbetween –5 and 22 K over an April to August period (Straubeand Burnett 1998b). The comparable CFD results ranged from–1 to 26 K for the summer cases with solar heat fluxes up to630 W/m2.
Pressure and Mass Flow Rate Comparisons
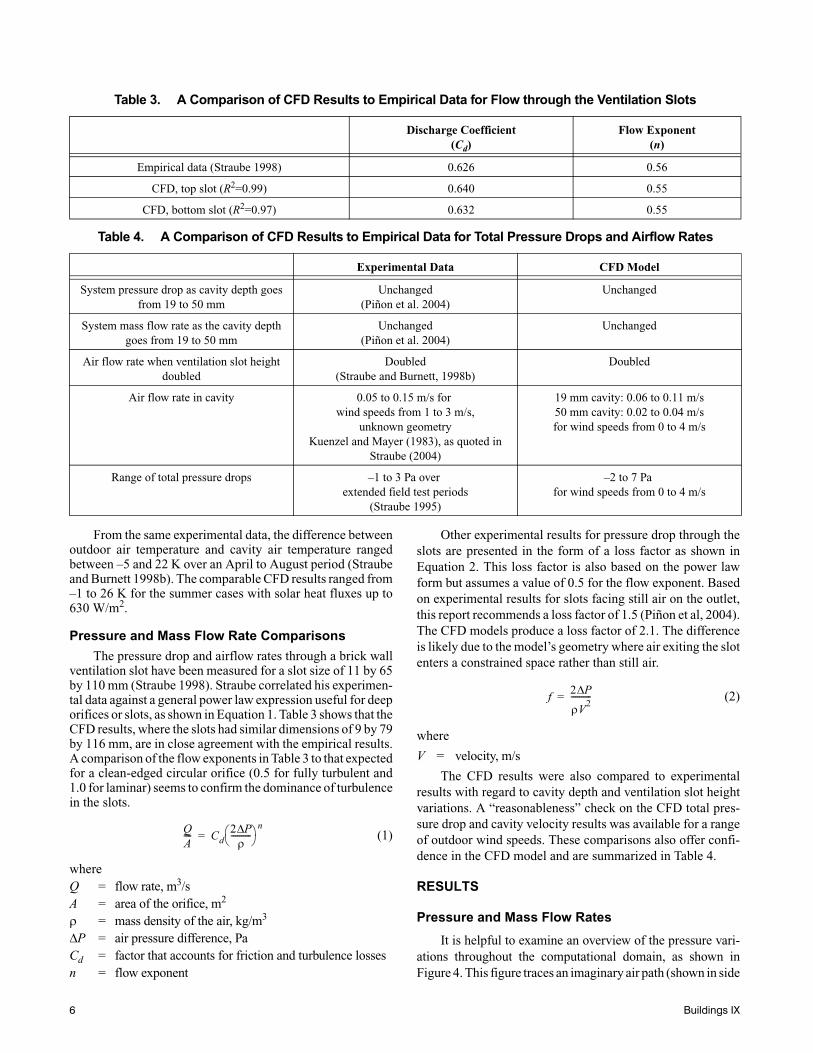
The pressure drop and airflow rates through a brick wallventilation slot have been measured for a slot size of 11 by 65by 110 mm (Straube 1998). Straube correlated his experimen-tal data against a general power law expression useful for deeporifices or slots, as shown in Equation 1. Table 3 shows that theCFD results, where the slots had similar dimensions of 9 by 79by 116 mm, are in close agreement with the empirical results.A comparison of the flow exponents in Table 3 to that expectedfor a clean-edged circular orifice (0.5 for fully turbulent and1.0 for laminar) seems to confirm the dominance of turbulencein the slots.
(1)
whereQ = flow rate, m3/sA = area of the orifice, m2
ρ = mass density of the air, kg/m3
∆P = air pressure difference, PaCd = factor that accounts for friction and turbulence lossesn = flow exponent
Other experimental results for pressure drop through theslots are presented in the form of a loss factor as shown inEquation 2. This loss factor is also based on the power lawform but assumes a value of 0.5 for the flow exponent. Basedon experimental results for slots facing still air on the outlet,this report recommends a loss factor of 1.5 (Piñon et al, 2004).The CFD models produce a loss factor of 2.1. The differenceis likely due to the model’s geometry where air exiting the slotenters a constrained space rather than still air.
(2)
where
V = velocity, m/s
The CFD results were also compared to experimentalresults with regard to cavity depth and ventilation slot heightvariations. A “reasonableness” check on the CFD total pres-sure drop and cavity velocity results was available for a rangeof outdoor wind speeds. These comparisons also offer confi-dence in the CFD model and are summarized in Table 4.
RESULTS
Pressure and Mass Flow Rates
It is helpful to examine an overview of the pressure vari-ations throughout the computational domain, as shown inFigure 4. This figure traces an imaginary air path (shown in side
Table 3. A Comparison of CFD Results to Empirical Data for Flow through the Ventilation Slots
Discharge Coefficient(Cd)
Flow Exponent(n)
Empirical data (Straube 1998) 0.626 0.56
CFD, top slot (R2=0.99) 0.640 0.55
CFD, bottom slot (R2=0.97) 0.632 0.55
Table 4. A Comparison of CFD Results to Empirical Data for Total Pressure Drops and Airflow Rates
Experimental Data CFD Model
System pressure drop as cavity depth goes from 19 to 50 mm
Unchanged(Piñon et al. 2004)
Unchanged
System mass flow rate as the cavity depth goes from 19 to 50 mm
Unchanged(Piñon et al. 2004)
Unchanged
Air flow rate when ventilation slot height doubled
Doubled(Straube and Burnett, 1998b)
Doubled
Air flow rate in cavity 0.05 to 0.15 m/s for wind speeds from 1 to 3 m/s,
unknown geometryKuenzel and Mayer (1983), as quoted in
Straube (2004)
19 mm cavity: 0.06 to 0.11 m/s50 mm cavity: 0.02 to 0.04 m/sfor wind speeds from 0 to 4 m/s
Range of total pressure drops –1 to 3 Pa over extended field test periods
(Straube 1995)
–2 to 7 Pa for wind speeds from 0 to 4 m/s
Q
A---- C
d
2 P∆ρ
----------⎝ ⎠⎛ ⎞ n
=
f2 P∆
ρV2
----------=
6 Buildings IX
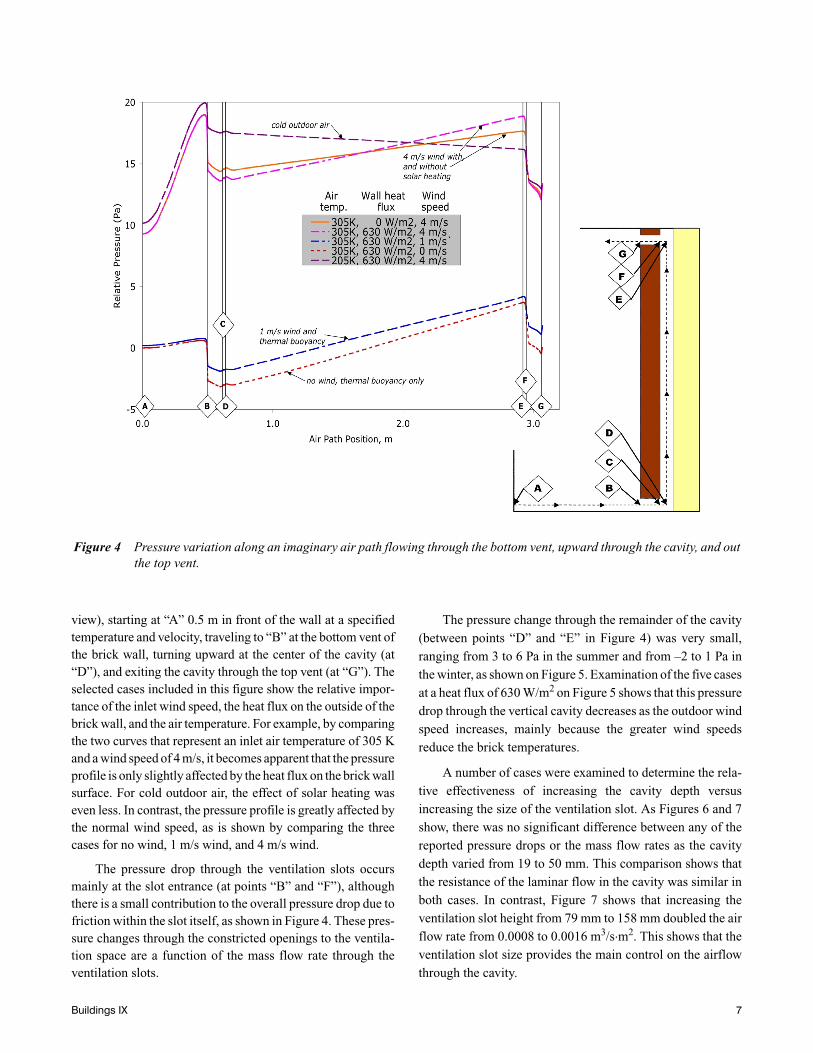
view), starting at “A” 0.5 m in front of the wall at a specifiedtemperature and velocity, traveling to “B” at the bottom vent ofthe brick wall, turning upward at the center of the cavity (at“D”), and exiting the cavity through the top vent (at “G”). Theselected cases included in this figure show the relative impor-tance of the inlet wind speed, the heat flux on the outside of thebrick wall, and the air temperature. For example, by comparingthe two curves that represent an inlet air temperature of 305 Kand a wind speed of 4 m/s, it becomes apparent that the pressureprofile is only slightly affected by the heat flux on the brick wallsurface. For cold outdoor air, the effect of solar heating waseven less. In contrast, the pressure profile is greatly affected bythe normal wind speed, as is shown by comparing the threecases for no wind, 1 m/s wind, and 4 m/s wind.
The pressure drop through the ventilation slots occursmainly at the slot entrance (at points “B” and “F”), althoughthere is a small contribution to the overall pressure drop due tofriction within the slot itself, as shown in Figure 4. These pres-sure changes through the constricted openings to the ventila-tion space are a function of the mass flow rate through theventilation slots.
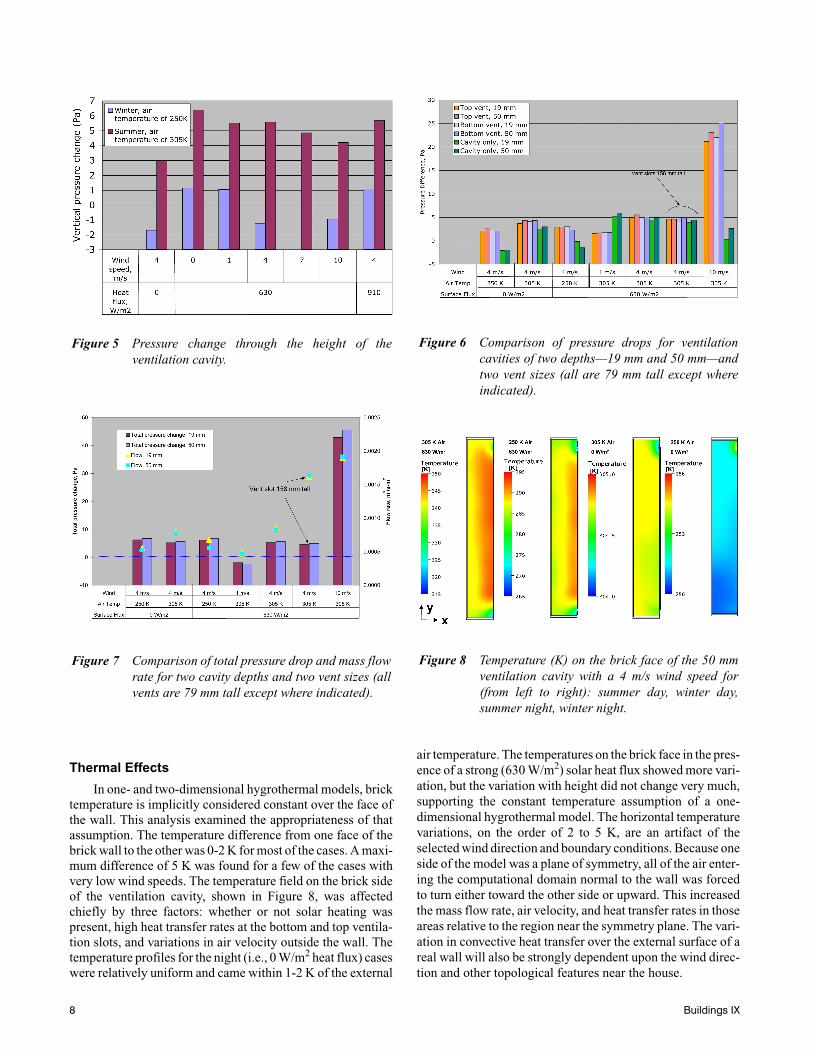
The pressure change through the remainder of the cavity(between points “D” and “E” in Figure 4) was very small,ranging from 3 to 6 Pa in the summer and from –2 to 1 Pa inthe winter, as shown on Figure 5. Examination of the five casesat a heat flux of 630 W/m2 on Figure 5 shows that this pressuredrop through the vertical cavity decreases as the outdoor windspeed increases, mainly because the greater wind speedsreduce the brick temperatures.
A number of cases were examined to determine the rela-tive effectiveness of increasing the cavity depth versusincreasing the size of the ventilation slot. As Figures 6 and 7show, there was no significant difference between any of thereported pressure drops or the mass flow rates as the cavitydepth varied from 19 to 50 mm. This comparison shows thatthe resistance of the laminar flow in the cavity was similar inboth cases. In contrast, Figure 7 shows that increasing theventilation slot height from 79 mm to 158 mm doubled the airflow rate from 0.0008 to 0.0016 m3/s⋅m2. This shows that theventilation slot size provides the main control on the airflowthrough the cavity.
Figure 4 Pressure variation along an imaginary air path flowing through the bottom vent, upward through the cavity, and outthe top vent.
Buildings IX 7
Thermal Effects
In one- and two-dimensional hygrothermal models, bricktemperature is implicitly considered constant over the face ofthe wall. This analysis examined the appropriateness of thatassumption. The temperature difference from one face of thebrick wall to the other was 0-2 K for most of the cases. A maxi-mum difference of 5 K was found for a few of the cases withvery low wind speeds. The temperature field on the brick sideof the ventilation cavity, shown in Figure 8, was affectedchiefly by three factors: whether or not solar heating waspresent, high heat transfer rates at the bottom and top ventila-tion slots, and variations in air velocity outside the wall. Thetemperature profiles for the night (i.e., 0 W/m2 heat flux) caseswere relatively uniform and came within 1-2 K of the external
air temperature. The temperatures on the brick face in the pres-ence of a strong (630 W/m2) solar heat flux showed more vari-ation, but the variation with height did not change very much,supporting the constant temperature assumption of a one-dimensional hygrothermal model. The horizontal temperaturevariations, on the order of 2 to 5 K, are an artifact of theselected wind direction and boundary conditions. Because oneside of the model was a plane of symmetry, all of the air enter-ing the computational domain normal to the wall was forcedto turn either toward the other side or upward. This increasedthe mass flow rate, air velocity, and heat transfer rates in thoseareas relative to the region near the symmetry plane. The vari-ation in convective heat transfer over the external surface of areal wall will also be strongly dependent upon the wind direc-tion and other topological features near the house.
Figure 5 Pressure change through the height of theventilation cavity.
Figure 7 Comparison of total pressure drop and mass flowrate for two cavity depths and two vent sizes (allvents are 79 mm tall except where indicated).
Figure 6 Comparison of pressure drops for ventilationcavities of two depths—19 mm and 50 mm—andtwo vent sizes (all are 79 mm tall except whereindicated).
Figure 8 Temperature (K) on the brick face of the 50 mmventilation cavity with a 4 m/s wind speed for(from left to right): summer day, winter day,summer night, winter night.
8 Buildings IX
Correlations with Weather Variables
Multivariate regression techniques were used to explorethe relationships between external weather and wall geometricvariables and the airflow and pressure changes in the ventila-tion cavity. The multivariate models were defined consideringthe physics underlying this complex problem. For example,buoyancy forces will be a function of the inverse of the temper-atures. The brick temperature will be a function of the airtemperature and the square root of the velocity, as well as thesurface heat flux. The stagnation pressure (or wind drivingforce) at the wall will be a function of the square of the veloc-ity.
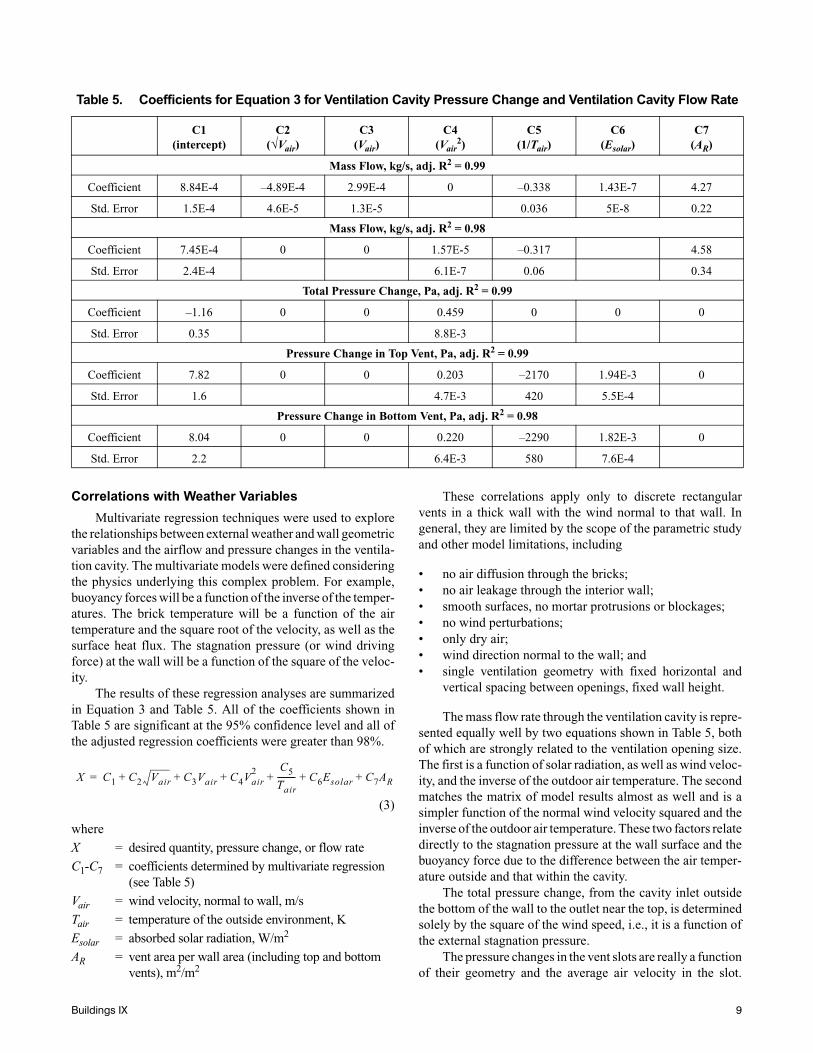
The results of these regression analyses are summarizedin Equation 3 and Table 5. All of the coefficients shown inTable 5 are significant at the 95% confidence level and all ofthe adjusted regression coefficients were greater than 98%.
(3)
whereX = desired quantity, pressure change, or flow rateC1-C7 = coefficients determined by multivariate regression
(see Table 5)Vair = wind velocity, normal to wall, m/sTair = temperature of the outside environment, KEsolar = absorbed solar radiation, W/m2
AR = vent area per wall area (including top and bottom vents), m2/m2
These correlations apply only to discrete rectangularvents in a thick wall with the wind normal to that wall. Ingeneral, they are limited by the scope of the parametric studyand other model limitations, including
• no air diffusion through the bricks;• no air leakage through the interior wall;• smooth surfaces, no mortar protrusions or blockages;• no wind perturbations;• only dry air;• wind direction normal to the wall; and• single ventilation geometry with fixed horizontal and
vertical spacing between openings, fixed wall height.
The mass flow rate through the ventilation cavity is repre-sented equally well by two equations shown in Table 5, bothof which are strongly related to the ventilation opening size.The first is a function of solar radiation, as well as wind veloc-ity, and the inverse of the outdoor air temperature. The secondmatches the matrix of model results almost as well and is asimpler function of the normal wind velocity squared and theinverse of the outdoor air temperature. These two factors relatedirectly to the stagnation pressure at the wall surface and thebuoyancy force due to the difference between the air temper-ature outside and that within the cavity.
The total pressure change, from the cavity inlet outsidethe bottom of the wall to the outlet near the top, is determinedsolely by the square of the wind speed, i.e., it is a function ofthe external stagnation pressure.
The pressure changes in the vent slots are really a functionof their geometry and the average air velocity in the slot.
Table 5. Coefficients for Equation 3 for Ventilation Cavity Pressure Change and Ventilation Cavity Flow Rate
C1(intercept)
C2(√Vair)
C3(Vair)
C4(Vair
2)C5
(1/Tair)C6
(Esolar)C7
(AR)
Mass Flow, kg/s, adj. R2 = 0.99
Coefficient 8.84E-4 –4.89E-4 2.99E-4 0 –0.338 1.43E-7 4.27
Std. Error 1.5E-4 4.6E-5 1.3E-5 0.036 5E-8 0.22
Mass Flow, kg/s, adj. R2 = 0.98
Coefficient 7.45E-4 0 0 1.57E-5 –0.317 4.58
Std. Error 2.4E-4 6.1E-7 0.06 0.34
Total Pressure Change, Pa, adj. R2 = 0.99
Coefficient –1.16 0 0 0.459 0 0 0
Std. Error 0.35 8.8E-3
Pressure Change in Top Vent, Pa, adj. R2 = 0.99
Coefficient 7.82 0 0 0.203 –2170 1.94E-3 0
Std. Error 1.6 4.7E-3 420 5.5E-4
Pressure Change in Bottom Vent, Pa, adj. R2 = 0.98
Coefficient 8.04 0 0 0.220 –2290 1.82E-3 0
Std. Error 2.2 6.4E-3 580 7.6E-4
X C1
C2
Vair
C3Vair
C4Vair
2 C5
Tair
--------- C6Esolar
C7AR
+ + + + + +=
Buildings IX 9
Although these pressure changes are given as functions ofweather and geometry in Equation 3 and Table 5, it is alsopossible to use the mass flow rate derived from Equation 3with the pressure drop relationships shown in Equations 1 or 2.
SUMMARY AND DISCUSSION
A CFD model of a brick rain screen wall was developedto determine useful relationships between weather and wallgeometry and the resulting airflow within the ventilationcavity. The model was benchmarked by comparing its resultsto experimental data for factors, including
• flow field patterns,• total pressure drop through the cavity,• pressure drop through the ventilation slots,• total mass flow through the cavity, and• thermal conditions at the brick wall.
The parametric study was designed to examine variationsin wind speed, solar radiation, cavity depth, vent slot size, andoutdoor air temperature. One of the main objectives was todetermine whether an increase in cavity depth would increasethe airflow through the space. The results of this study foundno significant difference in the mass flow rates between cavitydepths of 19 and 50 mm. In contrast, doubling the ventilationslot height doubled the airflow rate, showing the ventilationslot size is the controlling factor for the range of cases consid-ered here. (Of course, the greater depth may still be desired toavoid any localized airflow blockages due to protrudingmortar.) The effects of natural convection within the air cavi-ties, driven by the temperature difference between the cavitywalls and the outside air, also affected the ventilation flow.
Using the CFD results, correlations were produced to esti-mate the mass flow and pressure drops in the cavity for use inmore general transient hygrothermal models, using variablesavailable in typical weather data files. The correlations givenhere are limited by the scope of the parametric study and theother model limitations, most significantly
• effects of wind direction and perturbation were not mod-eled,
• a single vent spacing arrangement with discrete pairs ofrectangular openings was modeled, and
• additional buoyancy effect of variations in moisture con-tent was not modeled.
More work is needed to explore the effect of varying thehorizontal distribution of the ventilation slots in addition to theconsideration of increased slot height used here. Future workshould also explore the effects of environmental factorsoutside the wall, such as variations due to wind direction andair blockages (e.g., shrubbery). It would also be helpful toexpand the external air volume to include a typical soffitarrangement, which could significantly change the pressureconditions at the exit of the top vent.
REFERENCES
AEA Technology Engineering Software Ltd, Didcot Oxford-shire, United Kingdom.
ASHRAE. 2001. 2001 ASHRAE Handbook—Fundamen-tals. Atlanta: American Society of Heating, Refrigerat-ing and Air-Conditioning Engineers, Inc.
Balocco, C. 2001. A simple model to study ventilatedfacades energy performance. Energy and Buildings, Vol.34, pp. 469-475.
Burnett, E.F.P., and J.F. Straube. 1995, Vents, ventilationdrying, and pressure moderation, Research Report. Can-ada Mortgage and Housing Corporation.
Choi, E.C.C., and Z. Wang. 1998. Study on pressure-equal-ization of curtain wall systems. Journal of Wind Engi-neering and Industrial Aerodynamics, Vol. 73, pp. 251-266.
Hansen, M., A. Nicolajsen, and B. Stang. 2002. On the influ-ence of ventilation on moisture content in timber framedwalls. Building Physics 2002 6th Nordic Symposium.
Karagiozis, A. 2001. Introduction to MOISTURE-EXPERTSoftware. Oak Ridge National Laboratory, Oak Ridge,Tenn.
Kays, W.M., and M.E. Crawford. 1980. Convective Heat andMass Transfer. New York: McGraw-Hill.
Kumar, K.S., T. Stathopoulos, and J.A. Wisse. 2003. Fieldmeasurement data of wind loads on rainscreen walls.Journal of Wind Engineering and Industrial Aerody-namics, Vol. 91, pp. 1401-1417.
Kumar, K.S., and J.A. Wisse. 2001. Pressure equalization ofrainscreen facades: Analysis of the field data in the fre-quency domain. Wind and Structures 4(2):101-118.
Künzel, H., and E. Mayer. 1983. Untersuchung über die not-wendige Hinterlüftung an Außenwandbekeidung ausgroßformatigen Bauteilen, Schriftenreihe Bundesminis-ter für Raumordnung, Bauwesen, und Städtebau, 3/1983.
Künzel, H., and E. Mayer. 1984. Wärme- und Regenschutzbei zweischaligem Sichtmauerwerk mit Kerndämmung.BMFT-Forschungbericht T84-191.
Mayer, E., and H. Künzel. 1983. Untersuchungen über dienotwendige Hinterlüftung an Außenwandbekeidung ausgroßformatigen Bauteilen,” Fraunhofer Institut für Bau-physik, Forschungsbericht B Ho 1/83, March, 1983.
Piñon, J., D. Davidovic, E. Burnett, and J. Srebic. 2004.Characterization of ventilation airflow in screened wallsystems, ASHRAE 1091 Report #5.
Popp, W., E. Mayer, and H. Künzel. 1980. Untersuchungenüber die Belüftung des Luftraumes hinter vorgesetztenFassadenbekleidung aus kleinformatigen Elementen,Fraunhofer Institut für Bauphysik, Forschungsbericht BHo 22/80, April, 1980.
Schwarz, B. 1973. Witterungsbeansphruchung von Hoch-hausfassaden, HLH Bd. 24(12):376-384.
Shakerin, S., M. Bohn, and R.I. Loehrke. 1988. Natural con-vection in an enclosure with discreet roughness ele-
10 Buildings IX
ments on a vertical heated wall. Int. J. Heat MassTransfer 31(7):1423-1430.
Straube, J.F. 2004. Ventilated wall systems: Review of litera-ture and theory, ASHRAE 1091 Report # 1.
Straube, J.F., and E.F.P. Burnett. 1998a. Vents, ventilationand masonry veneer wall systems. Proceedings of theEighth Canadian Masonry Symposium. Jasper, Alta.,Canada, pp. 194-207.
Straube, J.F., and E.F.P. Burnett. 1998b. Drainage, ventila-tion drying, and enclosure performance. ConferenceProceedings, Thermal Performance of The ExteriorEnvelopes of Buildings VII. Clearwater Beach, Florida,pp. 189-198.
Straube, J.F. 1998. Moisture control and enclosure wall sys-tems, Ph.D. dissertation, Civil Engineering Dept., Uni-versity of Waterloo, UMI Dissertation Services.
Buildings IX 11