Embed Size (px)
Citation preview
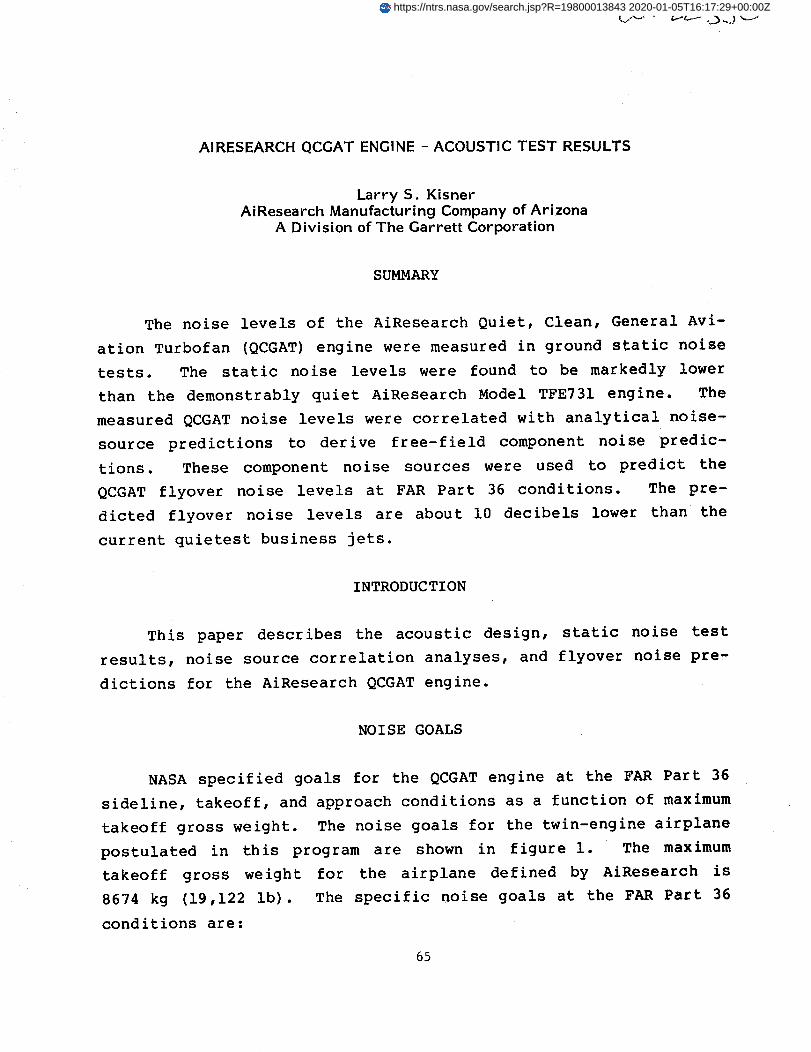
AIRESEARCH QCGAT ENGINE - ACOUSTIC TEST RESULTS
Larry S. KisnerAiResearch Manufacturing Company of Arizona
A Division of The Garrett Corporation
SUMMARY
The noise levels of the AiResearch Quiet, Clean, General Avi-
ation Turbofan (QCGAT) engine were measured in ground static noise
tests. The static noise levels were found to be markedly lower
than the demonstrably quiet AiResearch Model TFE731 engine. The
measured QCGAT noise levels were correlated with analytical noise-
source predictions to derive free-field component noise predic-
tions. These component noise sources were used to predict the
QCGAT flyover noise levels at FAR Part 36 conditions. The pre-
dicted flyover noise levels are about I0 decibels lower than the
current quietest business jets.
INTRODUC TI ON
This paper describes the acoustic design, static noise test
results, noise source correlation analyses, and flyover noise pre-
dictions for the AiResearch QCGAT engine.
NOISE GOALS
NASA specified goals for the QCGAT engine at the FAR Part 36
sideline, takeoff, and approach conditions as a function of maximum
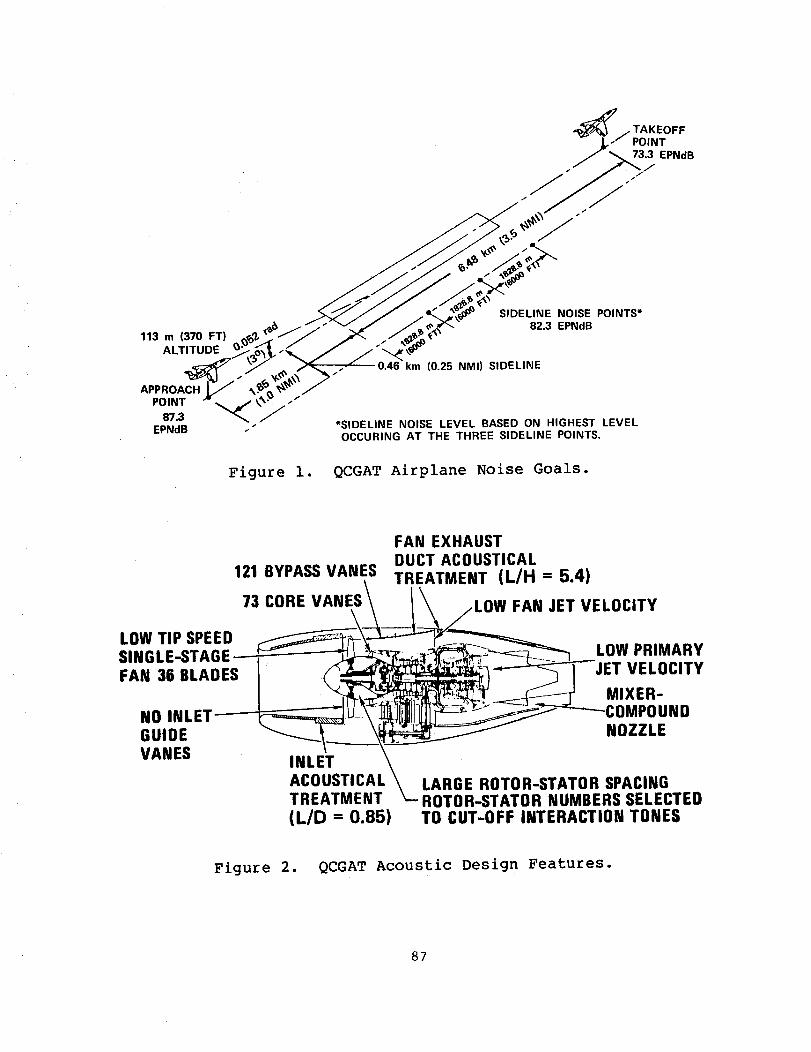
takeoff gross weight. The noise goals for the twin-engine airplane
postulated in this program are shown in figure I. The maximum
takeoff gross weight for the airplane defined by AiResearch is
8674 kg (19,122 Ib). The specific noise goals at the FAR Part 36
conditions are:
65
https://ntrs.nasa.gov/search.jsp?R=19800013843 2020-01-05T16:17:29+00:00Z
Takeoff (without cutback) :
Sideline (1500 ft) :
Approach :
73.3 EPNdB
82.3 EPNdB
87.3 EPNdB
These levels are significantly below the existing FAR Part 36 Stage
3 noise limits.
NOISE OBJECTIVES
To achieve the program noise objectives, large turbofan engine
noise-reduction technology was applied to the smaller AiResearch
general aviation engine. The objectives accomplished during the
program were as follows:
o The engine was defined, and the cycle conditions were
determined to provide low noise-generation features.
o An acoustically treated nacelle was designed and fabri-
cated.
o The ground static engine noise levels were measured for
several configurations, establishing an engine baseline
and demonstrating the effectiveness of the acoustical
design features.
o Static noise-source correlations were developed, and
component noise spectra with adjustments for flight
effects were used to estimate flyover noise levels in
compliance with QCGAT noise goals.
ACOUSTIC DESIGN FEATURES
The acoustic design effort emphasized minimizing noise genera-
tion at the source and maximizing noise reduction achieved through
66
judicious application of nacelle acoustic treatment in the fan
inlet and exhaust ducts. Acoustic duct liner configurations were
designed to balance the noise suppression at takeoff, sideline, and
approach condition, providing the broadest possible attenuation
bandwidth without sacrificing significant attenuation from optimum
at any one of the three operating conditions.
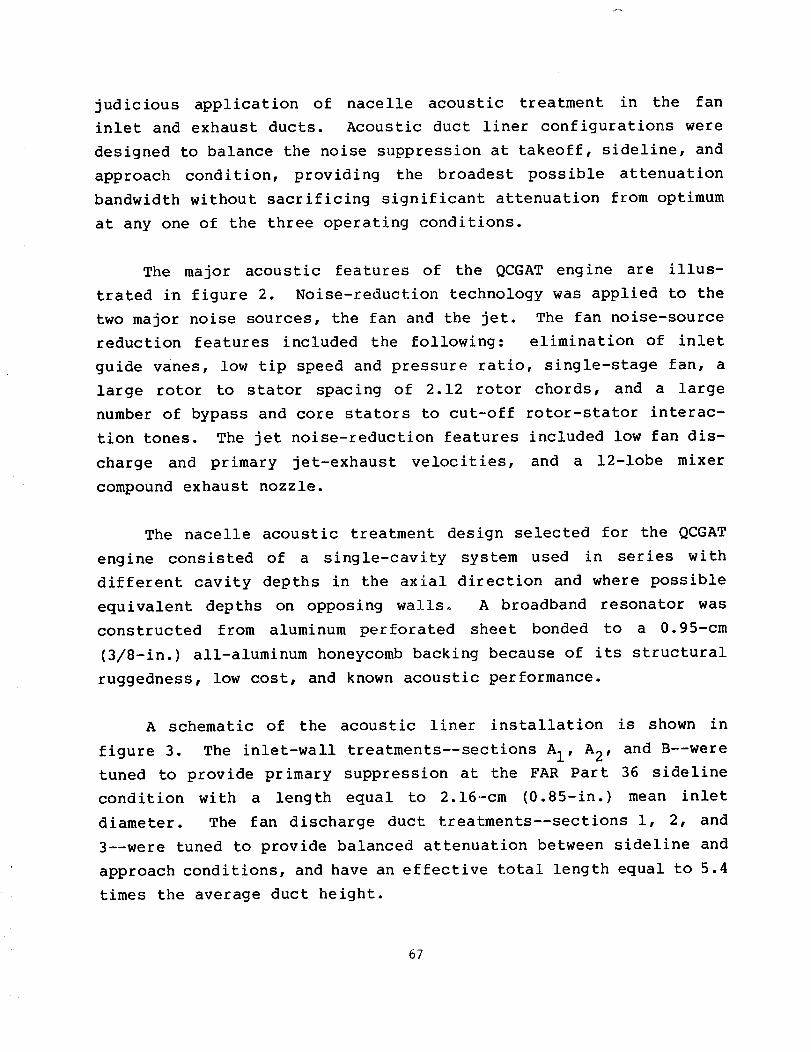
The major acoustic features of the QCGAT engine are illus-
trated in figure 2. Noise-reduction technology was applied to the
two major noise sources, the fan and the jet. The fan noise-source
reduction features included the following: elimination of inlet
guide vanes, low tip speed and pressure ratio, single-stage fan, a
large rotor to stator spacing of 2.12 rotor chords, and a large
number of bypass and core stators to cut-off rotor-stator interac-
tion tones. The jet noise-reduction features included low fan dis-
charge and primary jet-exhaust velocities, and a 12-1obe mixer
compound exhaust nozzle.
The nacelle acoustic treatment design selected for the QCGAT
engine consisted of a single-cavity system used in series with
different cavity depths in the axial direction and where possible
equivalent depths on opposing walls. A broadband resonator was
constructed from aluminum perforated sheet bonded to a 0.95-cm
(3/8-in.) all-aluminum honeycomb backing because of its structural
ruggedness, low cost, and known acoustic performance.
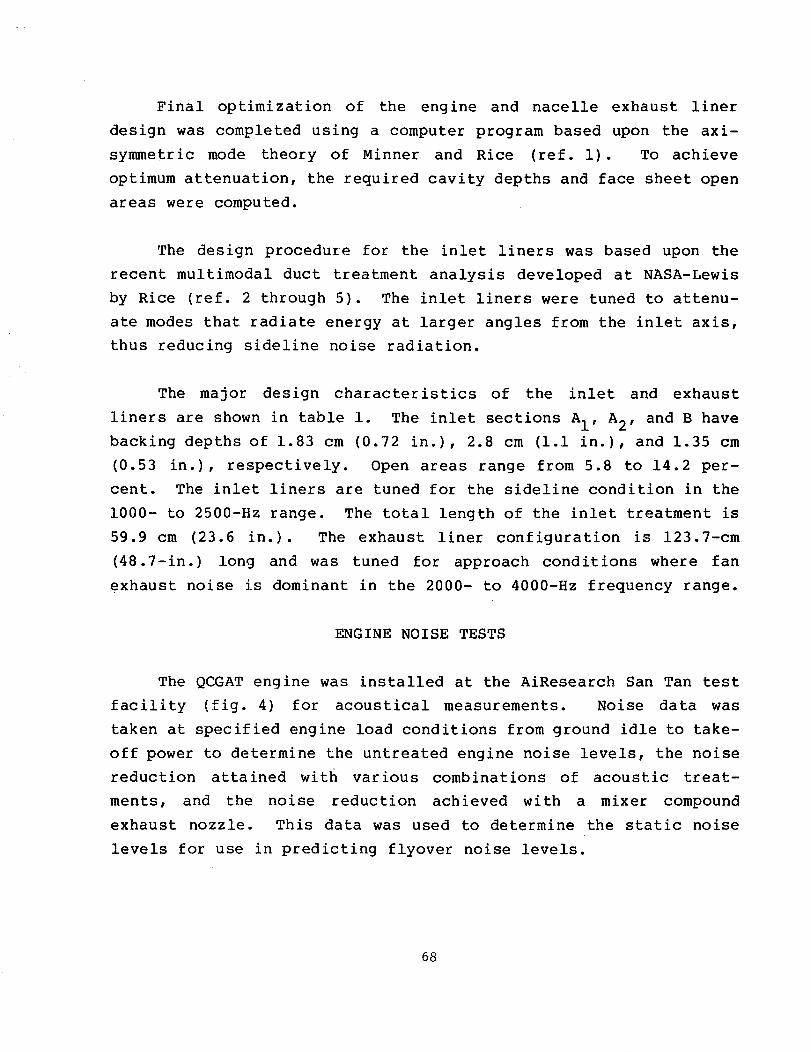
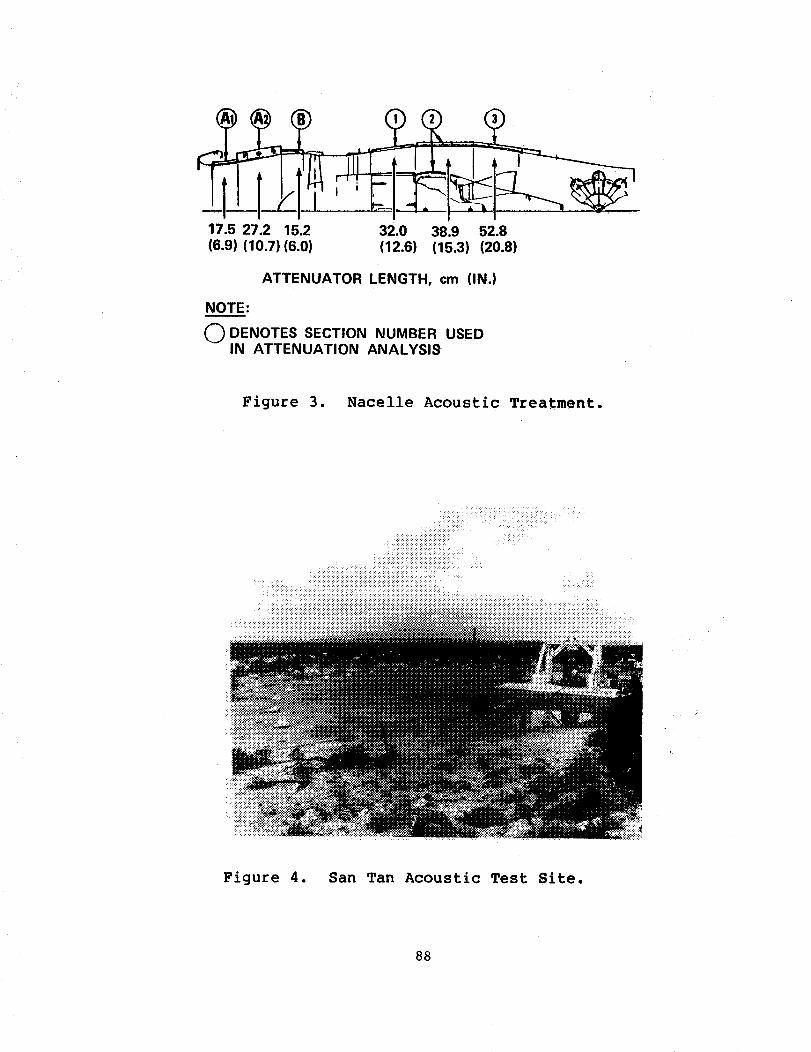
A schematic of the acoustic liner installation is shown in
figure 3. The inlet-wall treatments--sections A I, A 2, and B--were
tuned to provide primary suppression at the FAR Part 36 sideline
condition with a length equal to 2.16-cm (0.85-in.) mean inlet
diameter. The fan discharge duct treatments--sections I, 2, and
3--were tuned to provide balanced attenuation between sideline and
approach conditions, and have an effective total length equal to 5.4
times the average duct height.
67
Final optimization of the engine and nacelle exhaust liner
design was completed using a computer program based upon the axi-
symmetric mode theory of Minner and Rice (ref. i). To achieve
optimum attenuation, the required cavity depths and face sheet open
areas were computed.
The design procedure for the inlet liners was based upon the
recent multimodal duct treatment analysis developed at NASA-Lewis
by Rice (ref. 2 through 5). The inlet liners were tuned to attenu-
ate modes that radiate energy at larger angles from the inlet axis,thus reducing sideline noise radiation.
The major design characteristics of the inlet and exhaust
liners are shown in table i. The inlet sections AI, A2, and B havebacking depths of 1.83 cm (0.72 in.), 2.8 cm (I.i in.), and 1.35 cm
(0.53 in.), respectively. Open areas range from 5.8 to 14.2 per-cent. The inlet liners are tuned for the sideline condition in the
1000- to 2500-Hz range. The total length of the inlet treatment is
59.9 cm (23.6 in.). The exhaust liner configuration is 123.7-cm
(48.7-in.) long and was tuned for approach conditions where fan
exhaust noise is dominant in the 2000- to 4000-Hz frequency range.
ENGINE NOISE TESTS
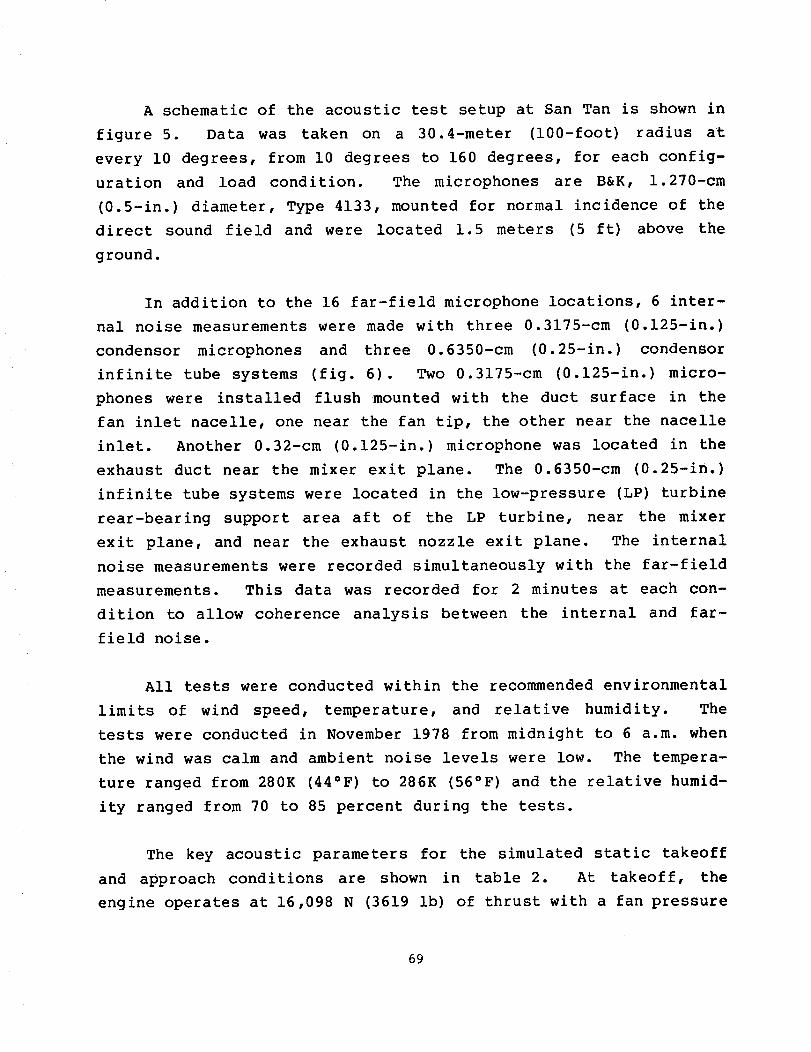
The QCGATengine was installed at the AiResearch San Tan test
facility (fig. 4) for acoustical measurements. Noise data was
taken at specified engine load conditions from ground idle to take-
off power to determine the untreated engine noise levels, the noisereduction attained with various combinations of acoustic treat-
ments, and the noise reduction achieved with a mixer compoundexhaust nozzle. This data was used to determine the static noise
levels for use in predicting flyover noise levels.
68
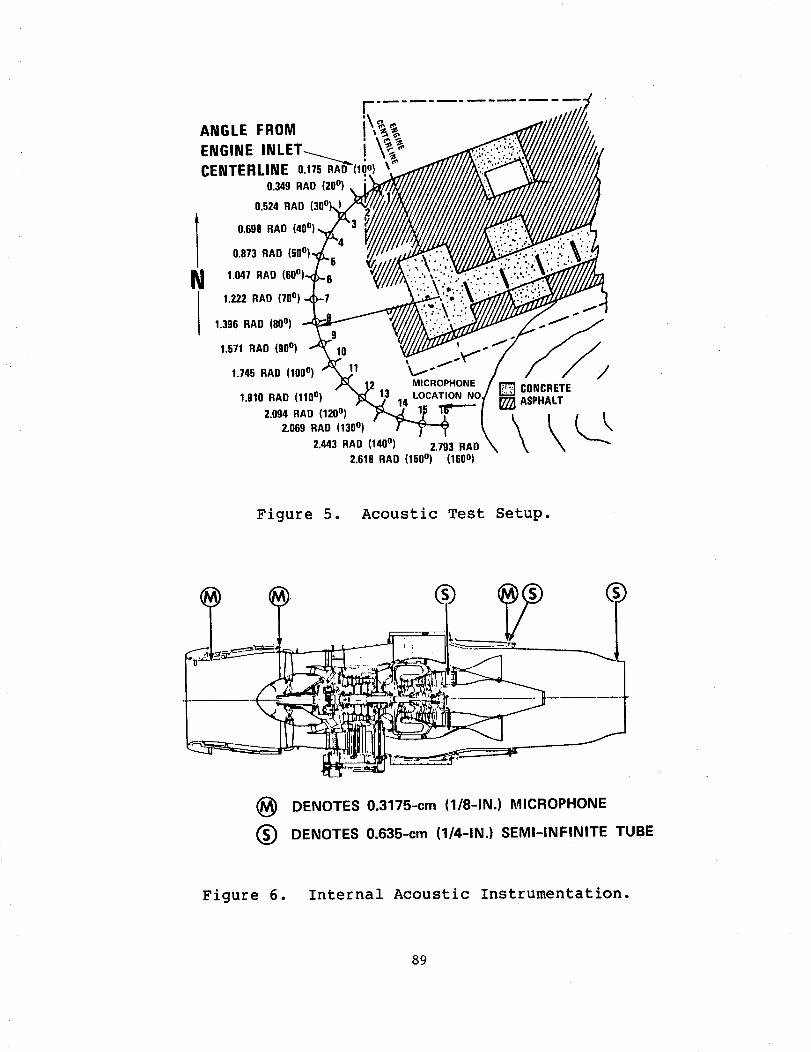
A schematic of the acoustic test setup at San Tan is shown in
figure 5. Data was taken on a 30.4-meter (100-foot) radius at
every i0 degrees, from i0 degrees to 160 degrees, for each config-uration and load condition. The microphones are B&K, 1.270-cm
(0.5-in.) diameter, Type 4133, mounted for normal incidence of thedirect sound field and were located 1.5 meters (5 ft) above the
ground.
In addition to the 16 far-field microphone locations, 6 inter-
nal noise measurements were made with three 0.3175-cm (0.125-in.)
condensor microphones and three 0.6350-cm (0.25-in.) condensor
infinite tube systems (fig. 6). Two 0.3175-cm (0.125-in.) micro-
phones were installed flush mounted with the duct surface in the
fan inlet nacelle, one near the fan tip, the other near the nacelleinlet. Another 0.32-cm (0.125-in.) microphone was located in the
exhaust duct near the mixer exit plane. The 0.6350-cm (0.25-in.)
infinite tube systems were located in the low-pressure (LP) turbine
rear-bearing support area aft of the LP turbine, near the mixer
exit plane, and near the exhaust nozzle exit plane. The internalnoise measurements were recorded simultaneously with the far-field
measurements. This data was recorded for 2 minutes at each con-
dition to allow coherence analysis between the internal and far-field noise.
All tests were conducted within the recommended environmental
limits of wind speed, temperature, and relative humidity. The
tests were conducted in November 1978 from midnight to 6 a.m. when
the wind was calm and ambient noise levels were low. The tempera-
ture ranged from 280K (44°F) to 286K (56°F) and the relative humid-
ity ranged from 70 to 85 percent during the tests.
The key acoustic parameters for the simulated static takeoff
and approach conditions are shown in table 2. At takeoff, the
engine operates at 16,098 N (3619 ib) of thrust with a fan pressure
69
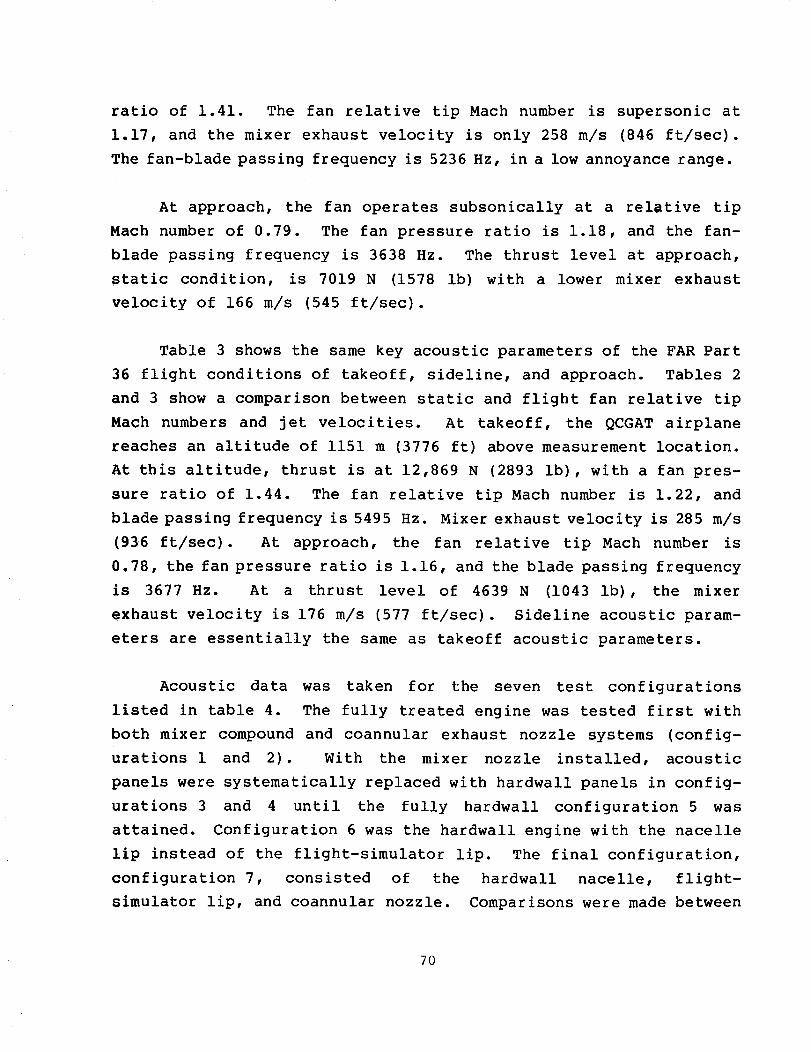
ratio of 1.41. The fan relative tip Mach number is supersonic at
1.17, and the mixer exhaust velocity is only 258 m/s (846 ft/sec).
The fan-blade passing frequency is 5236 Hz, in a low annoyance range.
At approach, the fan operates subsonically at a relative tip
Mach number of 0.79. The fan pressure ratio is 1.18, and the fan-blade passing frequency is 3638 Hz. The thrust level at approach,
static condition, is 7019 N (1578 Ib) with a lower mixer exhaust
velocity of 166 m/s (545 ft/sec).
Table 3 shows the same key acoustic parameters of the FAR Part36 flight conditions of takeoff, sideline, and approach. Tables 2
and 3 show a comparison between static and flight fan relative tip
Mach numbers and jet velocities. At takeoff, the QCGAT airplanereaches an altitude of 1151 m (3776 ft) above measurement location.
At this altitude, thrust is at 12,869 N (2893 ib), with a fan pres-
sure ratio of 1.44. The fan relative tip Mach number is 1.22, and
blade passing frequency is 5495 Hz. Mixer exhaust velocity is 285 m/s
(936 ft/sec). At approach, the fan relative tip Mach number is
0.78, the fan pressure ratio is 1.16, and the blade passing frequency
is 3677 Hz. At a thrust level of 4639 N (1043 ib), the mixer
exhaust velocity is 176 m/s (577 ft/sec). Sideline acoustic param-
eters are essentially the same as takeoff acoustic parameters.
Acoustic data was taken for the seven test configurations
listed in table 4. The fully treated engine was tested first with
both mixer compound and coannular exhaust nozzle systems (config-
urations 1 and 2). With the mixer nozzle installed, acoustic
panels were systematically replaced with hardwall panels in config-
urations 3 and 4 until the fully hardwall configuration 5 was
attained. Configuration 6 was the hardwall engine with the nacelle
lip instead of the flight-simulator lip. The final configuration,
configuration 7, consisted of the hardwall nacelle, flight-
simulator lip, and coannular nozzle. Comparisons were made between
70
the treated and hardwall with mixer compound nozzle (con-
figuration 1 versus 5), treated and hardwall with coannular
nozzle (configuration 2 versus 7), mixer compound versus coannular
nozzle with treated nacelle (configuration 1 versus 2), and mixer
compound versus coannular nozzle with hardwall nacelle (config-
uration 5 versus 7).
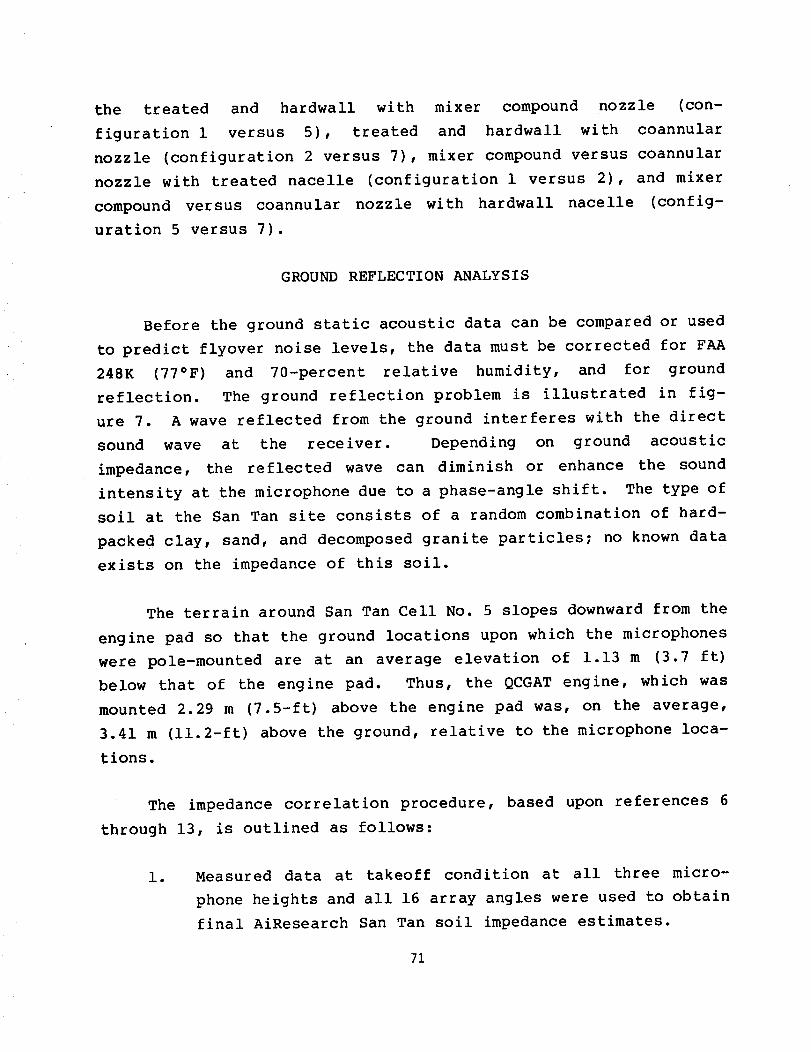
GROUND REFLECTION ANALYSIS
Before the ground static acoustic data can be compared or used
to predict flyover noise levels, the data must be corrected for FAA
248K (77°F) and 70-percent relative humidity, and for ground
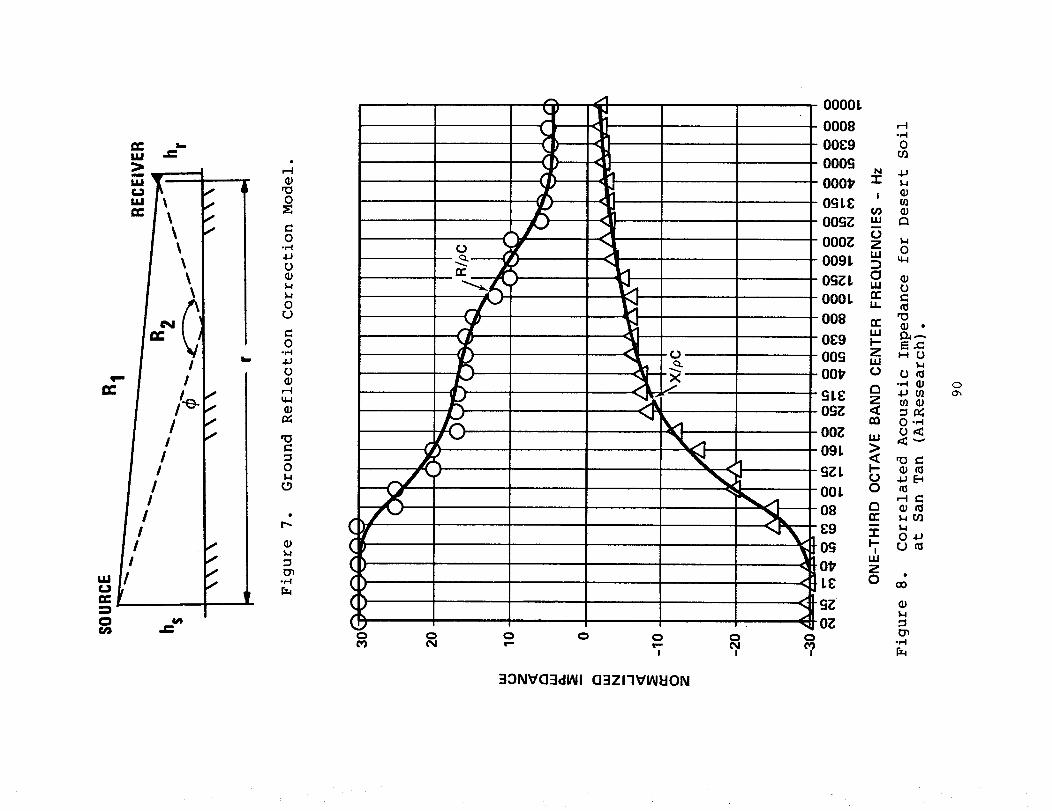
reflection. The ground reflection problem is illustrated in fig-
ure 7. A wave reflected from the ground interferes with the direct
sound wave at the receiver. Depending on ground acoustic
impedance, the reflected wave can diminish or enhance the sound
intensity at the microphone due to a phase-angle shift. The type of
soil at the San Tan site consists of a random combination of hard-
packed clay, sand, and decomposed granite particles; no known data
exists on the impedance of this soil.
The terrain around San Tan Cell No. 5 slopes downward from the
engine pad so that the ground locations upon which the microphones
were pole-mounted are at an average elevation of 1.13 m (3.7 ft)
below that of the engine pad. Thus, the QCGAT engine, which was
mounted 2.29 m (7.5-ft) above the engine pad was, on the average,
3.41 m (ll.2-ft) above the ground, relative to the microphone loca-
tions.
The impedance correlation procedure, based upon references 6
through 13, is outlined as follows:
l.Measured data at takeoff condition at all three micro-
phone heights and all 16 array angles were used to obtain
final AiResearch San Tan soil impedance estimates.
71
o Using previously published data, an initial normalized
impedance array was assumed (R/pc and X/pc versus fre-
quency).
o
The excess attenuation, Ae, was computed for each micro-
phone height, and corrected Sound pressure level (SPLc)
spectra was determined.
. A 3-way difference scheme was used to calculate the dif-
ferences between the three corrected spectra at each !/3-
octave band.
o Iterations were performed on the values of R/pc and X/pc
until all differences approached zero (steps 3 and 4,
above). The convergence criteria was based upon the
values of average differences at each i/3-octave band.
When reasonable values of impedance failed to provide
convergence at a i/3-octave band, the two microphone
heights having a frequency furthest away from a null fre-
quency were used and convergence was obtained.
o Inasmuch as convergence criteria was based on aver-
age differences, observations of individual differences
were then made, and minor adjustments to the normalized
impedance were performed, thus establishing the final
impedance values given in figure 8.
• Excess attenuation i/3-octave band spectra was computed
for the three microphone heights, based on final ground
impedance estimates.
. Ae spectra was then applied to the measured data for all
three microphone heights. Comparison plots were prepared
at representative array angles.
72
•Acoustic measurements were also made at the three micro-
phone heights for approach. To check the relative
validity of the ground-reflection correction procedure,
the A e spectra was applied to the approach data and com-
parisons of the corrected data again were made. The cor-
relation of the approach corrected data was consistent
with that of the takeoff corrected data.
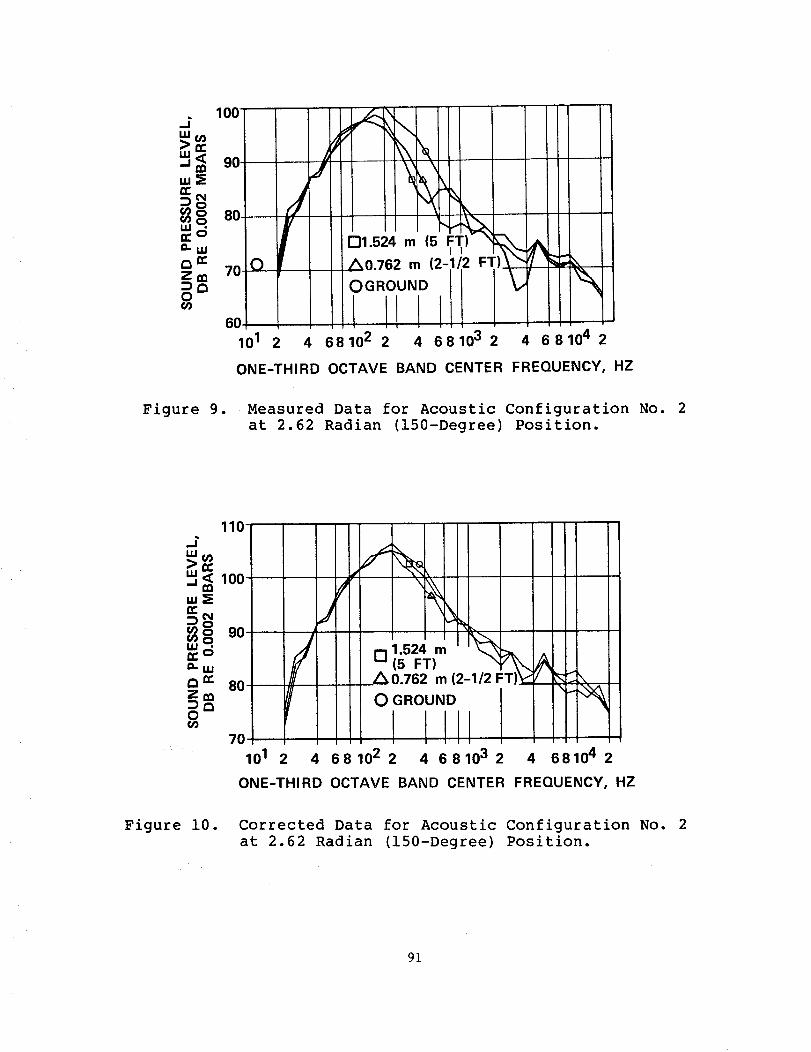
An example of the 'as measured' spectra from each microphone
is shown in figure 9. Large differences between the pole-mounted
and ground microphones were observed from 200 to 4000 Hz. Fig-
ure 10 shows the same data with the excess attenuation corrections
applied. Overall, good agreement was obtained for all microphones
and all i/3-octave band frequencies.
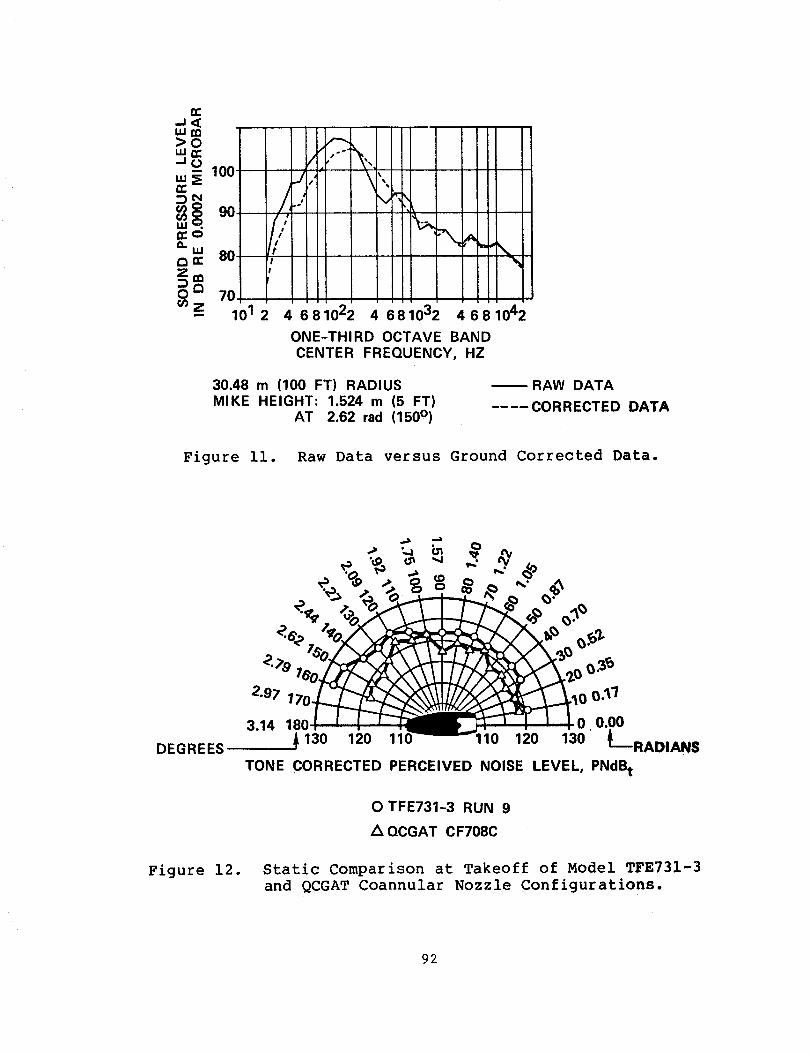
An example of the final result of applying the ground correc-
tion is shown in figure ii. The free-field levels were reduced in
the low frequency range, and the ground dip in the 400- through
500-Hz range was decreased, resulting in a smooth spectral curve.
Little or no change occurred at the high frequencies.
ACOUSTIC COMPARISONS OF STATIC DATA
The corrected data for each acoustic configuration tested was
compared to establish trends and illustrate the level comparisons
with the equivalent Model TFE731-3 takeoff and approach static
data. A comparison between the hardwall coannular configuration--
the loudest QCGAT configuration--with the Model TFE731-3 at takeoff
condition is shown in figure 12. The QCGAT tone-corrected per-
ceived noise levels (PNLT) are considerably lower than the Model
TFE731-3 primarily because of the lower exhaust velocity' even
though the QCGAT engine produces 8-percent more thrust. This dif-
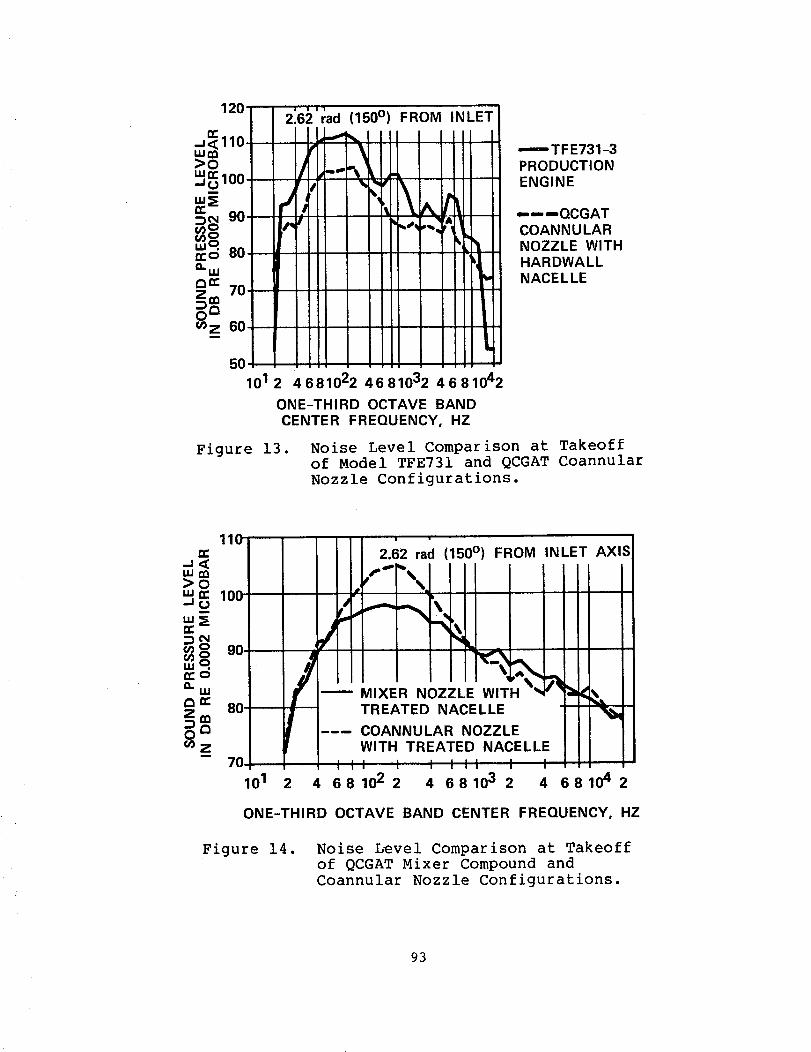
ference is shown more vividly in the i/3-octave spectral plot at
150 degrees from the inlet axis (fig. 13). This shows clearly a
73
reduction in jet noise, as well as in the high frequency fan tone.
Similar reductions were achieved at approach.
Further reductions in noise were achieved with the QCGATmixer
compound nozzle as shown in figure 14. At the same 150-degree
angle, the QCGATcoannular and mixer compound nozzle configurationsare compared at takeoff static condition. At 200 Hz, the mixer is
about 7 dB quieter than the coannular nozzle. Note, however, that
there are peaks at 1600 and 2500 Hz with the mixer being 2- to 3-dBhigher at these frequencies. The source of these tones were inves-
tigated in detail, including some cross-correlation analysis at
NASA. The results revealed a high correlation between internalcore noise and the far-field noise levels at certain discrete fre-
quencies, primarily centered about 200 Hz and 2500 Hz. This led to
the development of a new noise-source correlation attributing thisexcess noise to core noise.
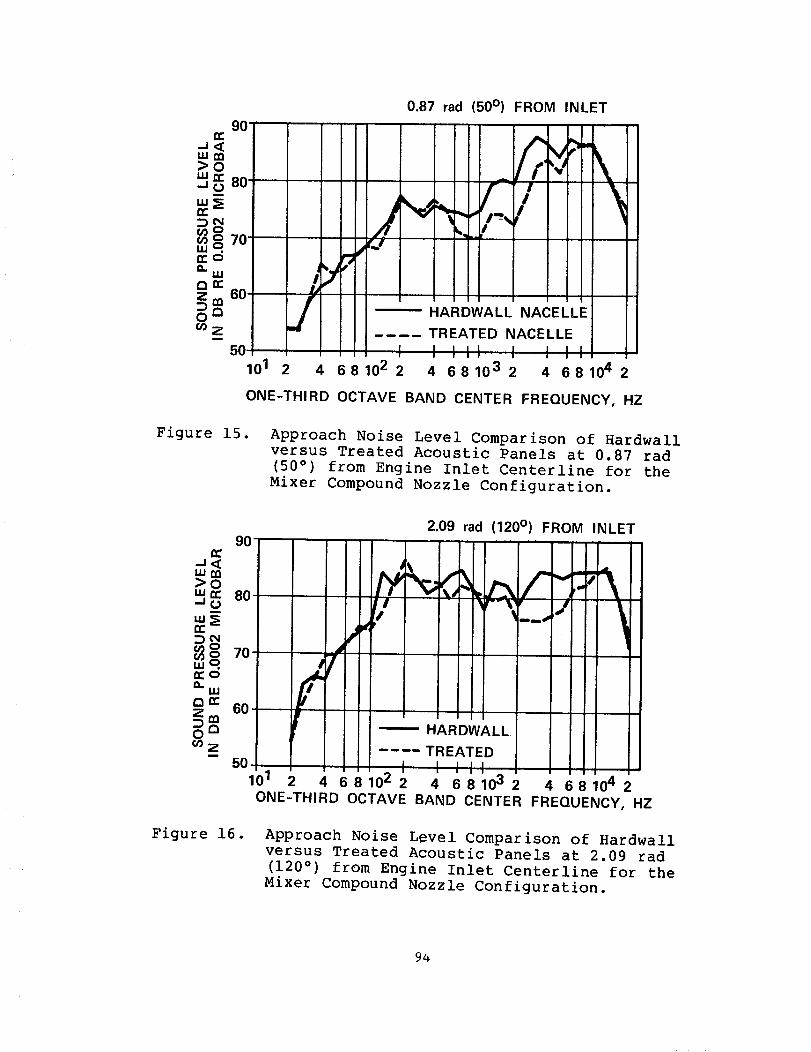
Final reductions in noise were attained with the acoustically
treated mixer configuration as shown in figure 15. Also shown in
figure 15 is the treated versus hardwall mixer data at approach
condition and at 50 degrees from the fan inlet. A broad range offrequencies from 630 Hz to 6300 Hz are attenuated due to the inlet
treatment. The same configurations are compared at 120 degrees in
the aft quadrant in figure 16. Here, larger attenuations approach-
ing 10 dB are observed, but in a narrower frequency band. Theactual attenuations in the lower frequencies cannot be observed
because of the masking by jet and core noise sources.
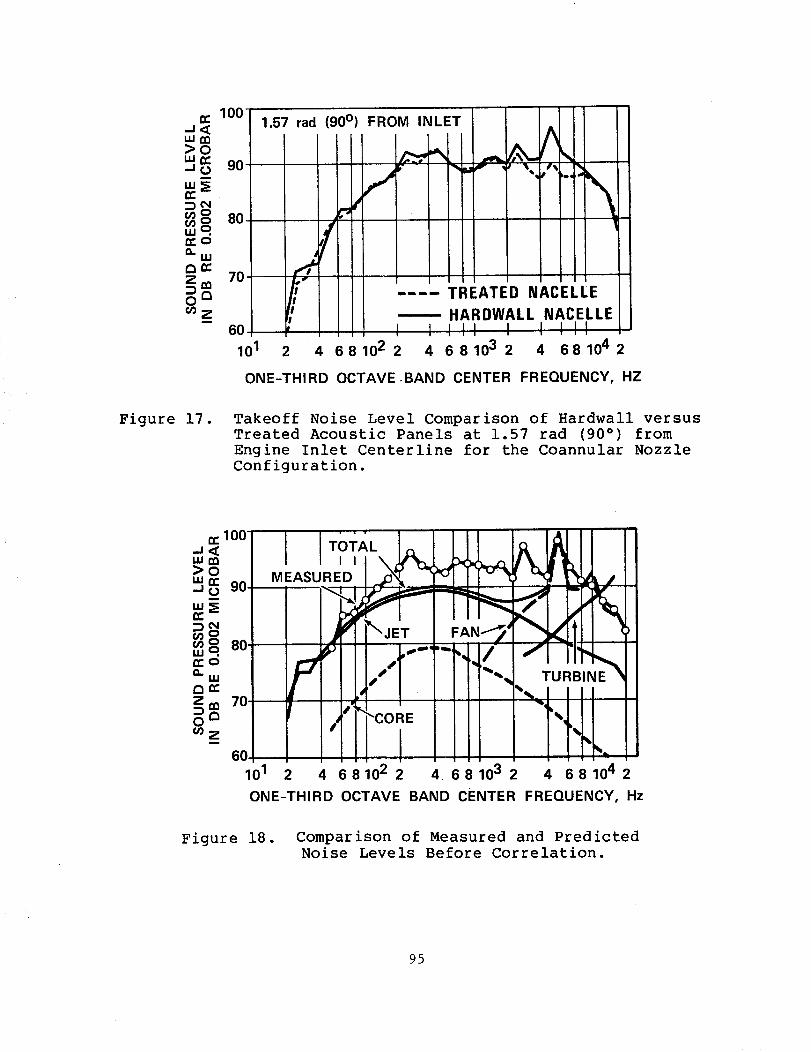
The treatment was effective in reducing the sideline noiselevels as shown in figure 17. The treated versus hardwall coan-
nular configurations at 90 degrees and at approach condition are
shown. The blade passing tone at 4000 Hz is attenuated nearly 7 dB.
74
In summarizing ground static data comparisons, the AiResearch
QCGAT engine demonstrated significantly quieter noise levels than
the currently quiet Model TFE731 business-jet engine, and showed
that application of noise reduction technology, such as a mixer
compound exhaust system and acoustically treated fan inlet and
exhaust nacelles, achieved even lower noise levels.
NOISE SOURCE CORRELATIONS
A primary objective of the QCGAT acoustic program was to
determine flyover noise levels based on static engine data, and to
demonstrate that these noise levels meet the program goals, which
are set well below current technology airplane. To accomplish this
objective, a methodology was derived to predict the major component
noise sources, adjust the individual sources from static to flight
conditions, and predict the noise source flyover levels.
The analytical tools used by AiResearch to predict QCGAT
engine noise sources are presented in table 5. The prediction pro-
cedures for fan noise, jet noise, and core noise were based upon
the NASA Aircraft Noise Prediction Program (ANOPP) recommended pro-
cedures with empirical modifications based upon previous AiResearch
experience.
A comparison of predicted noise sources based upon these pre-
diction procedures and measured data is shown in figure 18. The
fan noise prediction agrees well with the measured data with a
slight overprediction of the blade passing harmonic. However, the
measured low-frequency noise, particularly from 160 Hz to 2500 Hz,
is higher than predicted jet and core noise. In order to account
for this, it is necessary to make assumptions for the apportionment
of the jet and core to the total noise signature. Two approaches
were used and are shown in table 6: The first model attributed the
difference between predicted and measured noise in the 50- to
75
2500-Hz frequency range to the jet. Jet noise was adjusted accord-
ingly on an average delta basis. The second model assumed jet
noise predictions were valid, and adjusted the core noise to exactly
match the measured data. Both models adjusted the fan and turbine
noise to exactly match the measured levels in the appropriate
frequency range.
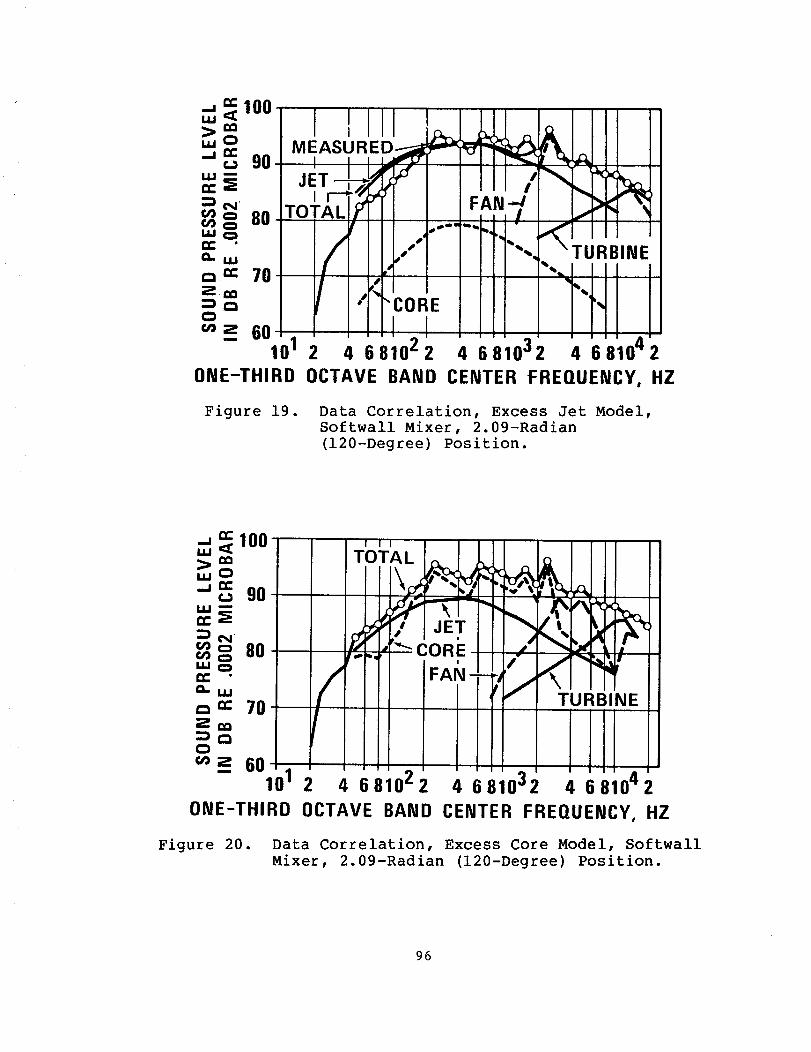
Figure 19 shows an example of the jet-noise-dominated correla-
tion for the softwall mixer at 120 degrees and at takeoff condi-
tion. The average difference from 50 to 2000 Hz is applied at each
frequency to produce a modified jet noise prediction that fairs
through the data. In this model, core noise is predicted to be well
below the jet noise at the takeoff condition. Above 2000 Hz, the
fan noise is adjusted to fit the data. Turbine noise contributions
were unimportant except at frequencies above 12,500 Hz, which was
out of the range of interest for flyover noise calculations.
Similar correlations were made for each far-field angle from 10
to 160 degrees.
The same set of acoustic data is shown in figure 20, with the
core-noise-dominated model predictions. The jet noise prediction
is considerably below the measured data. The fan noise was deter-
mined to be the difference between the measured total and the pre-
dicted sum of jet, core, and turbine noise in the 3150- to
10,000-Hz bands. The total of all the noise sources exactly
matched the measured data.
FLYOVER PREDICTION PROCEDURE
Calculated flyover noise levels for the QCGAT engine were
based upon the adjusted noise sources obtained from correlating the
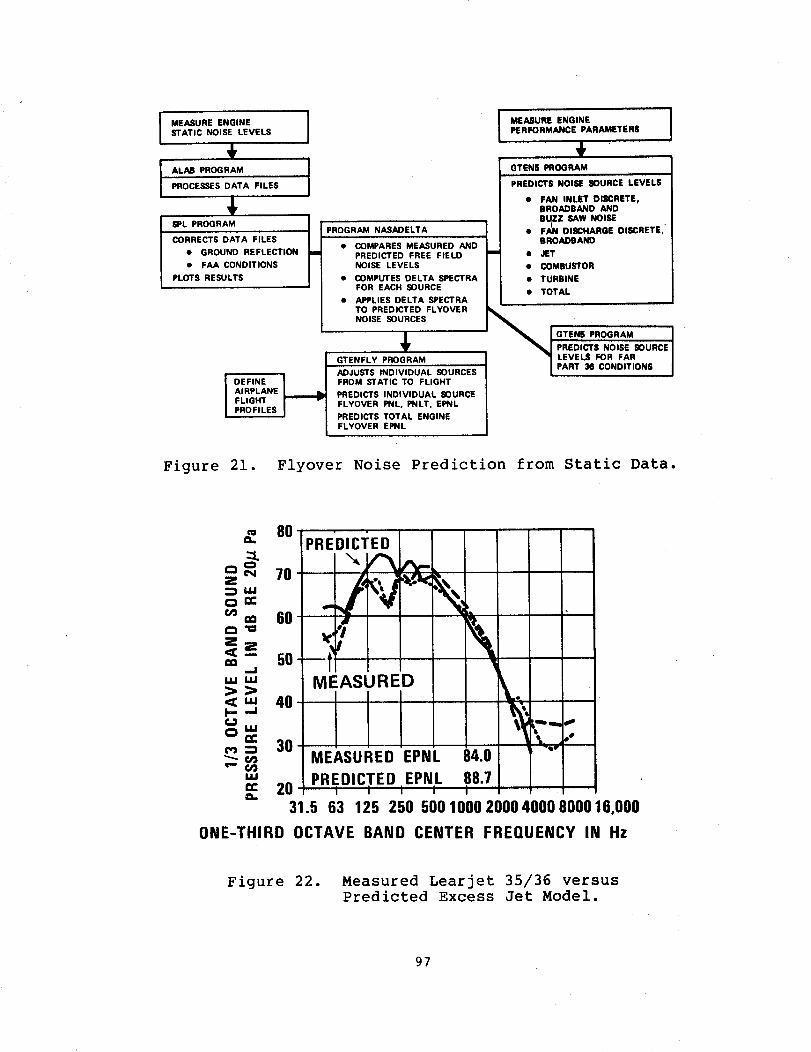
predicted and measured static noise data. A block diagram of this
procedure is given in figure 21. The measured corrected static
noise data and the predicted noise sources are fed into a program
76
called NASADELTA. The program compares and computes difference
spectra for each noise source at each engine operating condition.
The noise source prediction program is again used to predict the
noise levels at the FAR Part 36 flyover conditions. These predic-
tions are adjusted by applying the appropriate correction spectra
determined from the static data.
The adjusted noise sources are taken to flight conditions with
corrections for distance, atmospheric attenuation, jet relative
velocity and dynamic amplification effects, fan inlet cleanup, dop-
pler effects, wing shielding, and ground effects. The adjusted
sources are "flown" along a prescribed flight path using the
GTENFLY program.
For each flyover condition -- takeoff, sideline, and approach--
the SPL, PNL, and PNLT were calculated for each 1/2 second of the
flight trajectory. The duration time, duration correction,
effective perceived noise level (EPNL) for each source, and the
total EPNL were calculated in accordance to FAR Part 36 procedures.
FLYOVER NOISE CALIBRATION WITH MEASURED LEARJET DATA
Based upon static data comparisons, the QCGAT engine demon-
strated substantial reductions in noise levels compared to the
quiet AiResearch Model TFE731-2 engine that powers the Learjet
35/36 airplane. This airplane is certified to be 5 EPNdB below the
FAR Part 36 Stage 3 noise limits. However, the initial flyover
predictions, based upon the previously described methodology, yielded
QCGAT noise levels comparable to measured Learjet flyover noise
levels. This methodology was thus used to predict the Learjet fly-
over noise levels to determine its validity.
A comparison of the predicted and measured in-flight spectra
for the Learjet 35/36 based upon the excess jet noise model, is
77
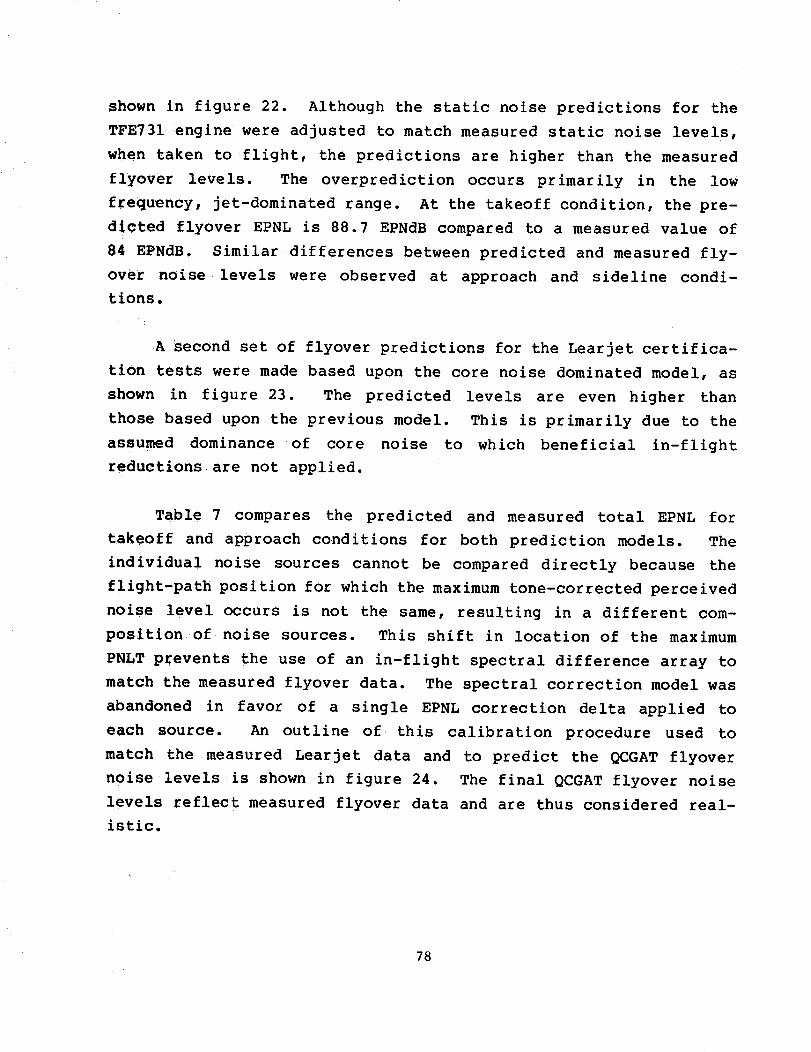
shown in figure 22. Although the static noise predictions for the
TFE731 engine were adjusted to match measured static noise levels,
when taken to flight, the predictions are higher than the measured
flyover levels. The overprediction occurs primarily in the low
frequency, jet-dominated range. At the takeoff condition, the pre-
dicted flyover EPNL is 88.7 EPNdB compared to a measured value of
84 EPNdB. Similar differences between predicted and measured fly-over noise levels were observed at approach and sideline condi-tions.
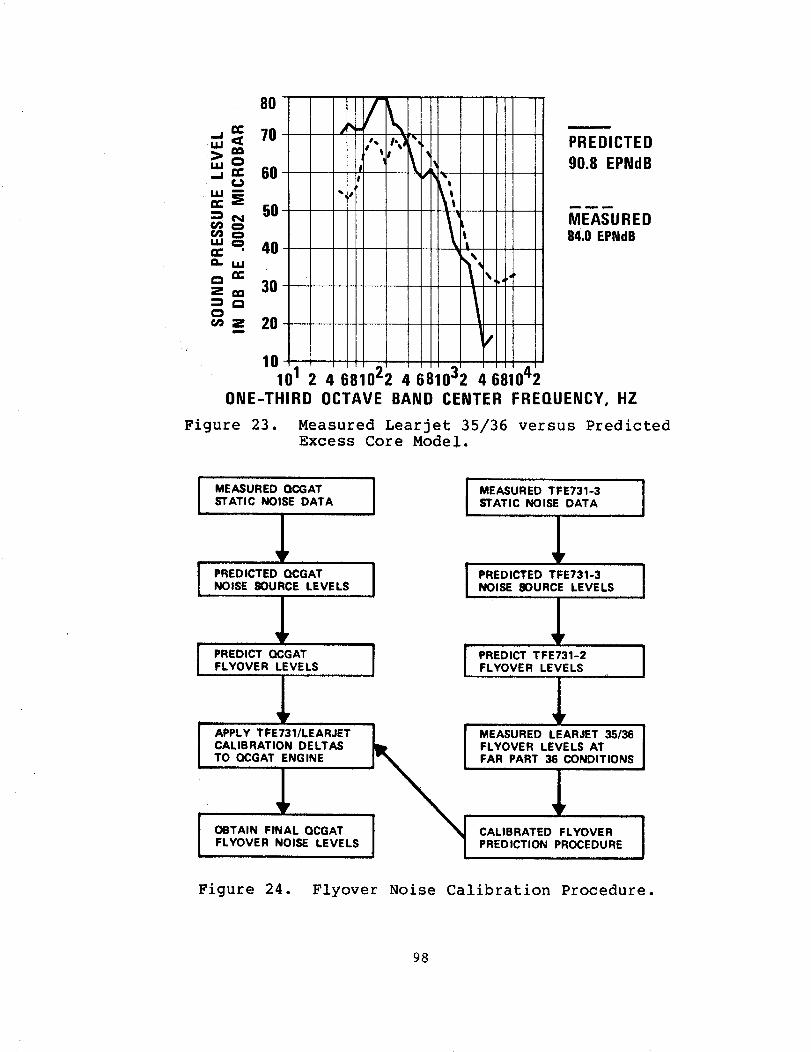
A Second set of flyover predictions for the Learjet certifica-
tion tests were made based upon the core noise dominated model, as
shown in figure 23. The predicted levels are even higher than
those based upon the previous model. This is primarily due to the
assumed dominance of core noise to which beneficial in-flightreductions are not applied.
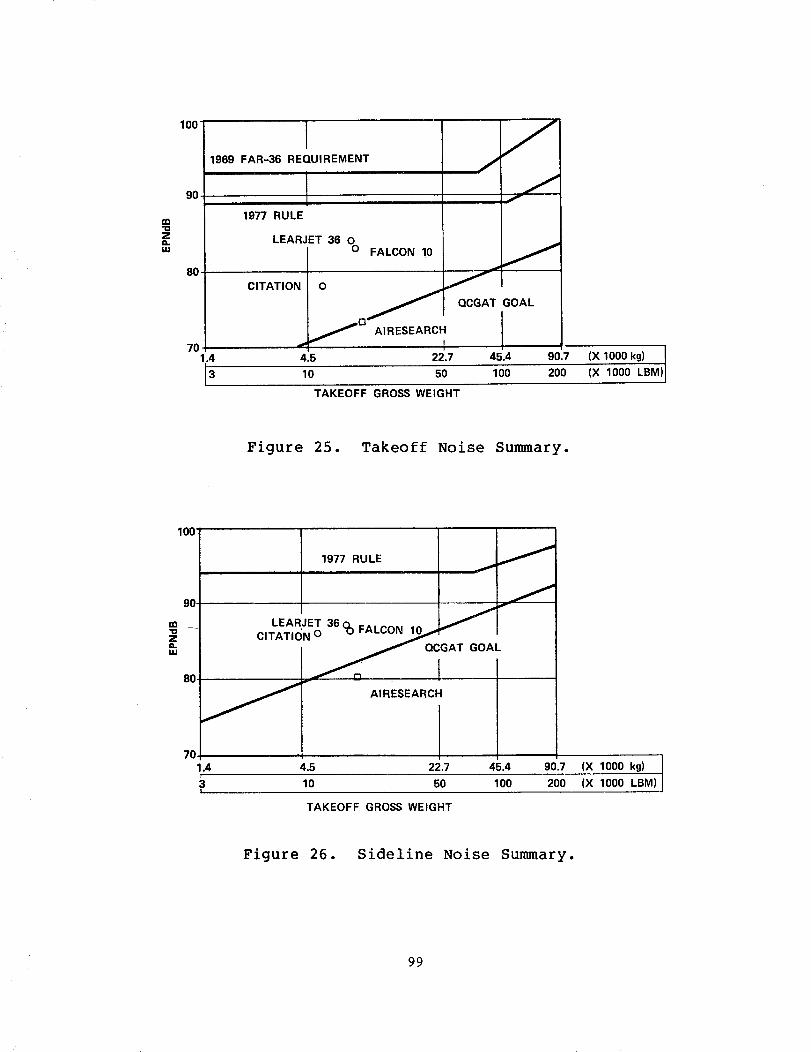
Table 7 compares the predicted and measured total EPNL for
takeoff and approach conditions for both prediction models. The
individual noise sources cannot be compared directly because the
flight-path position for which the maximum tone-corrected perceived
noise level occurs is not the same, resulting in a different com-position of noise sources. This shift in location of the maximum
PNLT prevents the use of an in-flight spectral difference array tomatch the measured flyover data. The spectral correction model was
abandoned in favor of a single EPNL correction delta applied to
each source. An outline of _ this calibration procedure used to
match the measured Learjet data and to predict the QCGAT flyovernoise levels is shown in figure 24. The final QCGATflyover noiselevels reflect measured flyover data and are thus considered real-istic.
78
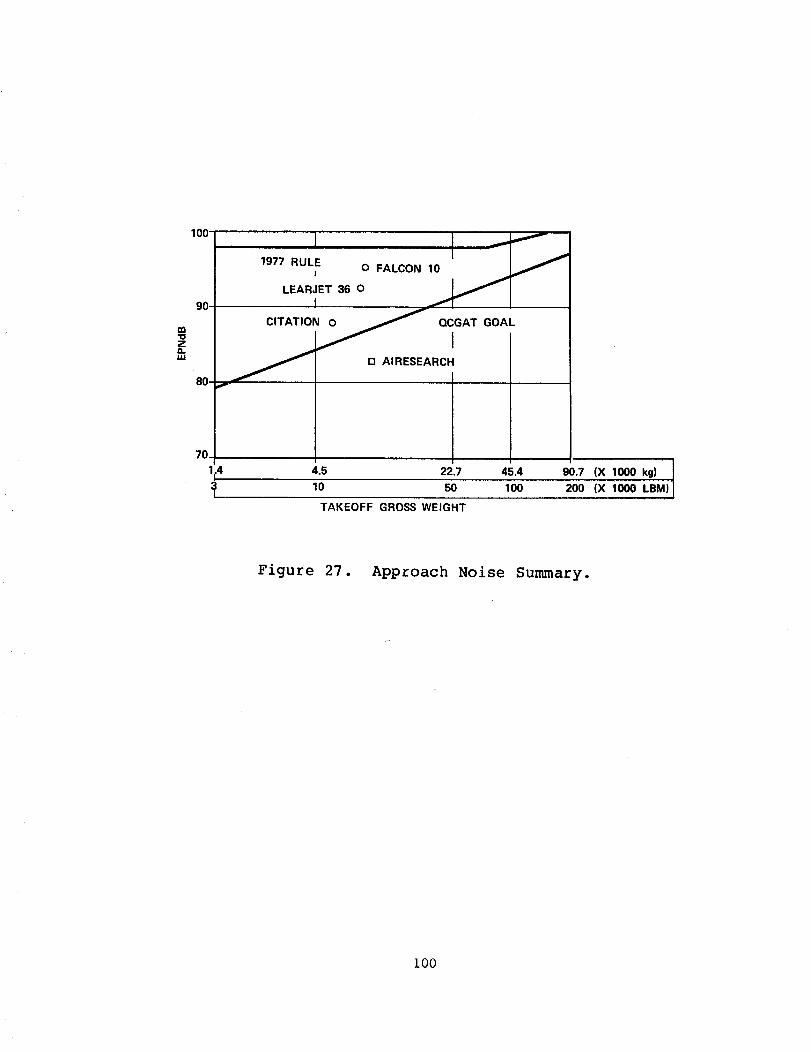
QCGAT FLYOVER NOISE PREDICTIONS
The unadjusted and adjusted flyover noise predictions for the
QCGAT engine are given in table 8. Each method, with appropriate
adjustments for differences between predicted and measured Learjet
levels yielded similar results, indicating that the QCGAT engine is
2.0 EPNdB below the sideline noise goal, 4.6 to 5.4 EPNdB below
the approach noise goal, and from 0.2 EPNdB below to 1.4 EPNdB
above the takeoff noise goal.
ACOUSTIC ANALYSIS SUMMARY
A summary of the acoustic analysis performed in the QCGAT pro-
gram is outlined below:
O A ground reflection analysis was developed to correct the
measured static noise levels to free-field.
o Flyover noise predictions were made based upon two sepa-
rate noise source correlation models: One assumed jet
noise to be the dominant generating mechanism; the other
assumed core noise to be responsible for excess noise
above the known jet noise levels.
o Both prediction models were applied to the TFE731-2-
powered Learjet and were found to overpredict the mea-
sured in-flight levels, although the ground static data
was used to calibrate the predictions.
o The overpredictions occurred primarily in the low-
frequency range where both jet and core noise are
expected to be important.
79
o Final flyover predictions were made with adjustments for
the differences between predicted and measured Learjet
noise levels.
SUMMARY OF ACOUSTIC RESULTS
The noise reduction technology demonstrated in the QCGAT Pro-
gram is summarized below:
o The QCGAT softwall nacelle/mixer configuration demon-
strated a 9.3 EPNdB reduction in flyover noise at takeoff
condition, a 10.3 EPNdB reduction at approach, and a 7,7
EPNdB reduction at sideline condition compared to the
TFE731-2-powered Learjet.
o The QCGAT hardwall nacelle coannular nozzle configura-
tion was shown to be 4.2 EPNdB quieter than the Learjet
at takeoff condition, although the QCGAT airplane takeoff
gross weight is 963 kg (2122 ib) greater than the
Learjet.
o The QCGAT hardwall nacelle/mixer was 3.5 EPNdB quieter at
takeoff and 4.3 EPNdB quieter at approach than the QCGAT
hardwall nacelle/coannular nozzle.
o The QCGAT softwall nacelle/mixer was quieter than the
QCGAT hardwall nacelle/mixer by 2.6 EPNdB and 1.3 EPNdB
at approach and takeoff conditions, respectively.
The final QCGAT flyover noise levels based upon the excess
core noise model are shown in figures 25 through 27, compared with
the FAR Part 36 noise limits, the QCGAT noise goals, and the mea-
sured Learjet flyover levels.
8O
CONCLUSIONS
The measured static noise levels of the AiResearch QCGAT
engine were markedly lower than the demonstrably quiet TFE731engine. The following conclusions were made:
o Based on the excess jet noise correlation model, the
QCGATengine met or bettered the program noise goals.
o Based on the excess core noise correlation, the QCGAT
engine met or bettered the program noise goals both forhardwall and softwall nacelle configurations at sideline
and approach conditions, and was slightly above the take-
off noise goal.
The AiResearch QCGATprogram has demonstrated that it is pos-
sible to design quiet engines for general aviation aircraft.
81
REFERENCES
i• Minner, G.L. and Rice, E.J., "Computer Method for Design of
" NASA TM X-3317, 1976Acoustic Liners for Turbofan Engines,
2. Rice, E.J., "Acoustic Liner Optimum Impedance for SpinningModes with Mode Cut-Off Ratio as the Design Criterion," AIAA
Paper 76-516, Pal. Alto, CA., 1976.
• Rice, E.J., "Inlet Noise Suppressor Design Method Based Upon
the Distribution of Acoustic Power with Mode Cut-Off Ratio,"
Paper Presented at the Thirteenth Annual Meeting of the Soci-
ety of Engineering Science, Inc., George Washington Uni-versity, 1976.
• Rice, E.J., "Multimodal Far-Field Acoustic Radiation Pat-
tern -An Approximate Equation," AIAA Paper 77-1281, presentedin Atlanta Georgia, October, 1977.
• Rice, E.J., "Attenuation of Sound in Ducts with Acoustic
Treatment - A Generalized Approximate Equation," NASA TMX-71830.
• Pao, S.P., A.R. Wenzel, and P.B. Oncely, "Prediction of GroundEffects on Aircraft Noise," NASA-TP-II04, 1978.
• Zorumski, W.E., "Prediction of Aircraft Sideline Noise Attenu-
ation," NASA-TM-78717, 1978.
• Chessell, C.I., "Propagation of Noise Along a Finite ImpedanceBoundary," J. Acoust. S.c. America, Vol. 62, No. 4, October1977, pp. 825-834•
• Chessell, C.I., "Meteorological and Ground Effects on the
Propagation of Aircraft Noise Close to the Earth's Surface,"
Jl. of Sound and Vib., Vol. 60, No. 2, 1978, pp. 251-266•
i0. Embleton, T.F.W., J.E. Piercy, and N. Olson, "Outdoor Sound
Propagation Over Ground of Finite Impedance," J. Acoust. S.c.
Am., Vol. 59, No. 2, February 1976, pp. 267-277•
ii. Daigle, G.A., Effects of Atmospheric Turbulence on the Inter-
face of Sound Waves Above a Finite Impedance Boundary," J.
Acoust. S.c. Am., Vol. 65, No. i, January 1979, pp. 45-49•
12. Putnam, T.W., "Review of Aircraft
NASA-TMX-56033, September, 1975.
Noise Propagat ion, "
13. Oncely, P.B., "Propagation of Jet Engine Noise Near a Porous
" J Sound Vib., Vol 13, No. I, 1970, pp. 27-35•Surface, .
82
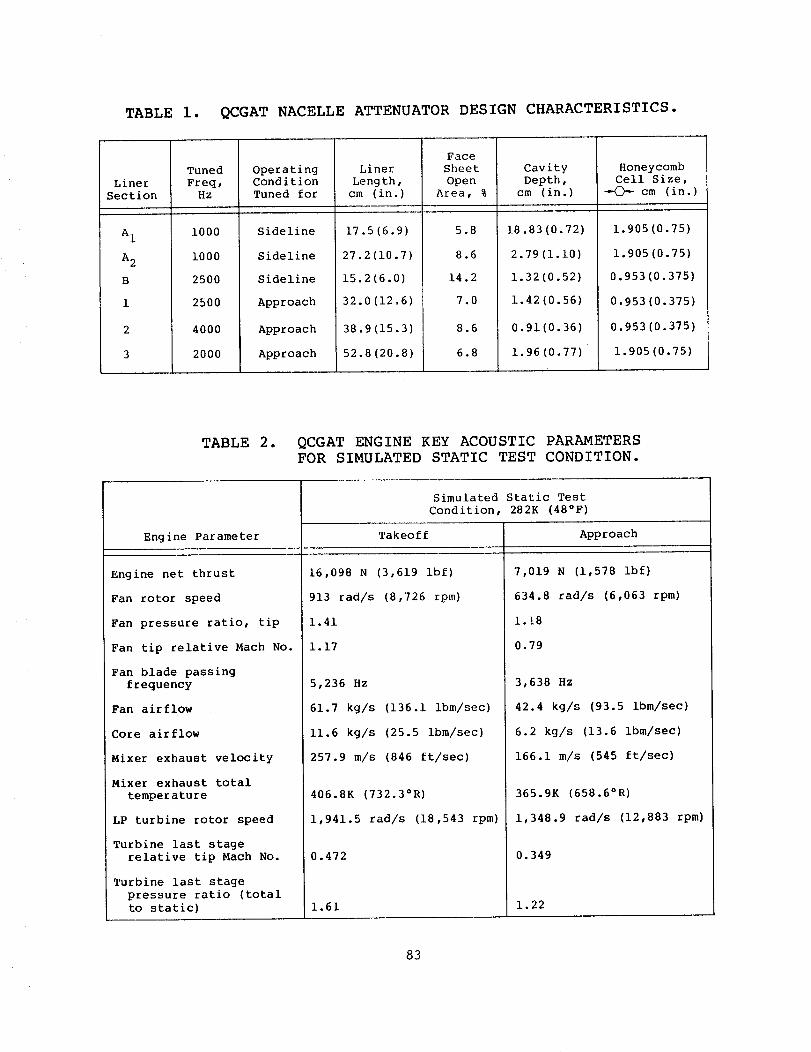
TABLE i. QCGAT NACELLE ATTENUATOR DESIGN CHARACTERISTICS.
Liner
Section
A 1
A 2
B
1
Tuned
Freq,
Hz
i000
i000
2500
2500
4000
2000
OperatingCondition
Tuned for
Sideline
Sideline
Sideline
Approach
Approach
Approach
Liner
Length,
cm (in.)
17.5(6.9)
27.2(10.7)
15.2(6.0)
32.0(12.6)
38.9(15.3)
52.8(20.8)
Face
Sheet
Open
Area, %
5.8
8.6
14.2
7.0
8.6
6.8
Cavity
Depth,
cm (in.)
18.83(0.72)
2.79(1.10)
1.32(0.52)
1.42(0.56)
0.91(0.36)
1.96(0.77)
Honeycomb
Cell Size,
cm (in.)
1.905(0.75)
1.905(0.75)
0.953(0.375)
0.953(0.375)
0.953 (0.375)
1.905 (0.75)
TABLE 2. QCGAT ENGINE KEY ACOUSTIC PARAMETERS
FOR SIMULATED STATIC TEST CONDITION.
Engine Parameter
Engine net thrust
Fan rotor speed
Fan pressure ratio, tip
Fan tip relative Mach No.
Fan blade passing
frequency
Fan airflow
Core airflow
Mixer exhaust velocity
Mixer exhaust total
temperature
LP turbine rotor speed
Turbine last stage
relative tip Mach No.
Turbine last stage
pressure ratio (total
to static)
Simulated Static Test
Condition, 282K (48°F)
Takeoff
16,098 N (3,619 ibf)
913 rad/s (8,726 rpm)
1.41
1.17
5,236 Hz
61.7 kg/s (136.1 ibm/sec)
11.6 kg/s (25.5 ibm/sec)
257.9 m/s (846 ft/sec)
406.8K (732.3°R)
1,941.5 rad/s (18,543 rpm)
Approach
7,019 N (1,578 ibf)
634.8 rad/s (6,063 rpm)
1.18
0.79
3,638 Hz
42.4 kg/s (93.5 ibm/sec)
6.2 kg/s (13.6 ibm/sec)
166.1 m/s (545 ft/sec)
365.9K (658.6°R)
1,348.9 rad/s (12,883 rpm)
0.472
1.61
0.349
1.22
83
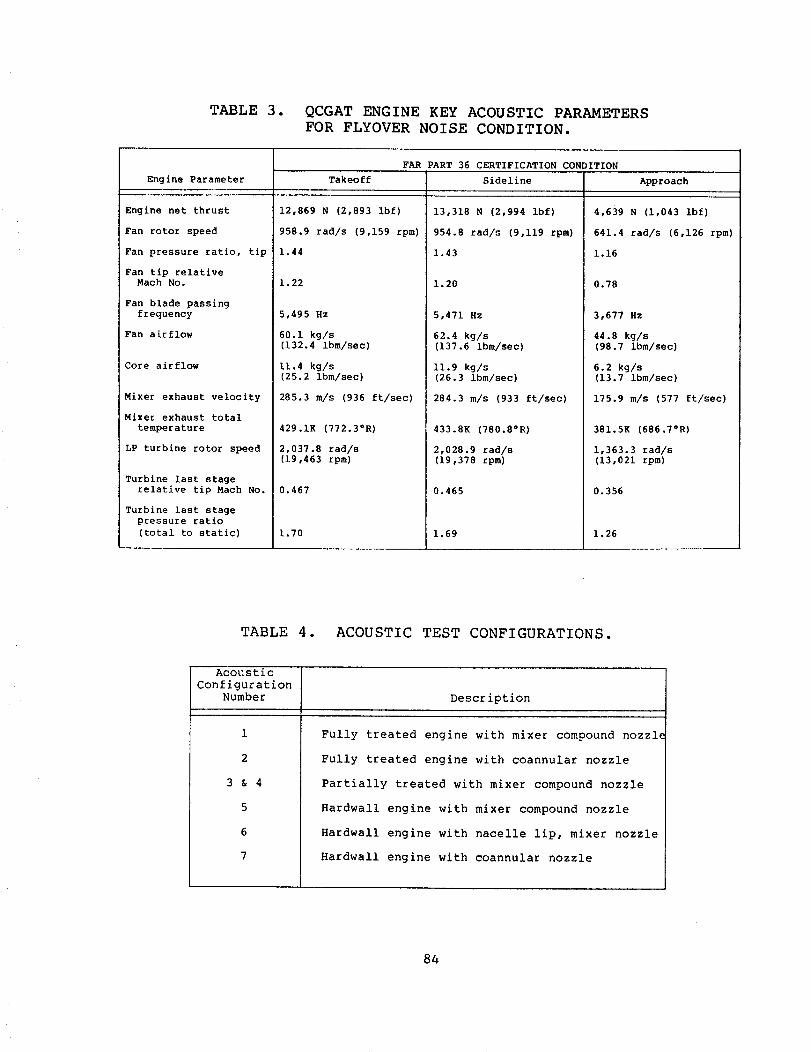
TABLE 3. QCGATENGINE KEY ACOUSTIC PARAMETERSFOR FLYOVERNOISE CONDITION.
Engine Parameter
Engine net thrust
Fan rotor speed
Fan pressure ratio, tip
Fan tip relative
Mach No.
Fan blade passing
frequency
Fan airflow
Core airflow
Mixer exhaust velocity
Mixer exhaust total
temperature
LP turbine rotor speed
Turbine last stage
relative tip Mach No.
Turbine last stage
pressure ratio
(total to static)
FAR PART 36 CERTIFICATION CONDITION
Takeoff
12,869 N (2,893 Ibf)
958.9 rad/s (9,159 rpm)
1.44
1.22
5,495 Hz
60.1 kg/s
(132.4 ibm/sec)
11.4 kg/s
(25.2 ibm/sec)
285.3 m/s (936 ft/sec)
429.1K (772.3OR)
2,037.8 rad/s
(19,463 rpm)
0.467
1.70
Sideline Approach
13,318 N (2,994 ibf)
954.8 rad/s (9,119 rpm)
1.43
1.20
5,471 Hz
62.4 kg/s
(137.6 ibm/sec)
11.9 kg/s
(26.3 ibm/see)
284.3 m/s (933 ft/sec)
4,639 N (1,043 ibf)
641.4 rad/s (6,126 rpm)
1.16
0.78
3,677 HZ
44.8 kg/s
(98.7 lbm/sec)
6.2 kg/s
(13.7 lbm/sec)
175.9 m/s (577 ft/sec)
433.8K (780.8"R)
2,028.9 rad/s
(19,378 rpm)
0.465
1.69
381.5K (686.7°R)
1,363.3 rad/s
(13,021 rpm)
0.356
1.26
TABLE 4. ACOUSTIC TEST CONFIGURATIONS.
Acoustic
Configuration
Number
1
2
3 & 4
5
6
7
Description
Fully treated engine with mixer compound nozzle
Fully treated engine with coannular nozzle
Partially treated with mixer compound nozzle
Hardwall engine with mixer compound nozzle
Hardwall engine with nacelle lip, mixer nozzle
Hardwall engine with coannular nozzle
84
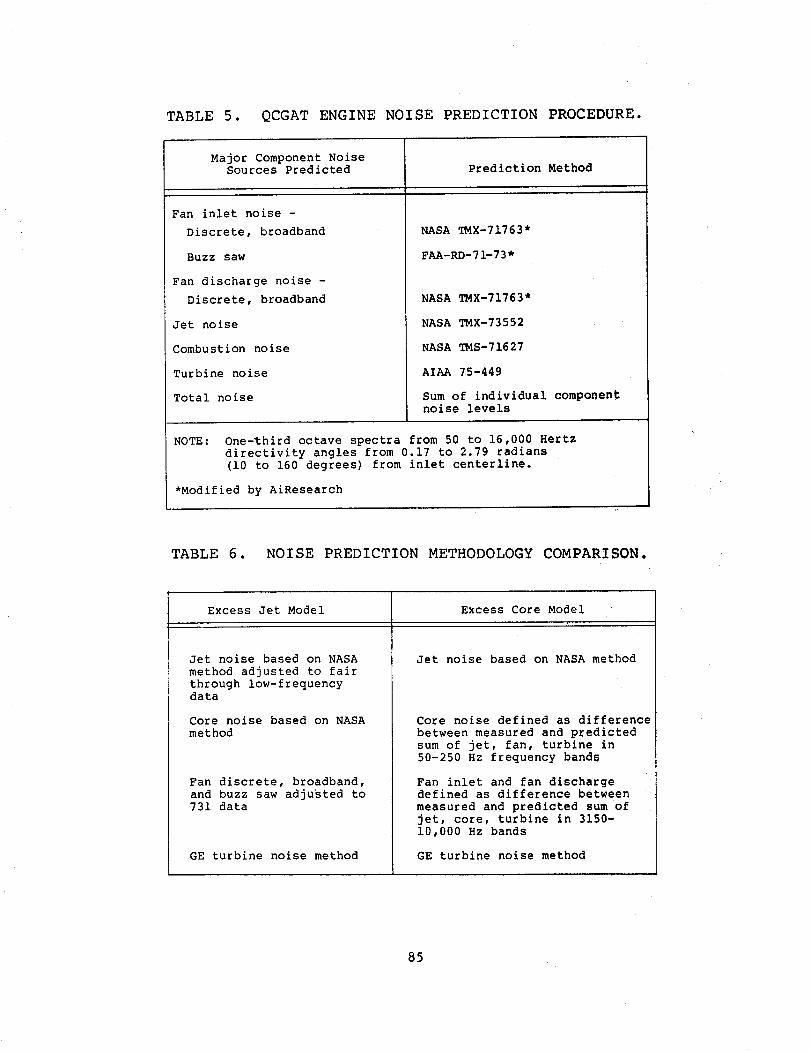
TABLE 5. QCGAT ENGINE NOISE PREDICTION PROCEDURE.
Major Component Noise
Sources Predicted Prediction Method
Fan inlet noise -
Discrete, broadband
Buzz saw
Fan discharge noise -
Discrete, broadband
NASA TMX-71763*
FAA-RD-71-73*
NASA TMX-71763*
Jet noise
Combustion noise
Turbine noise
Total noise
NASA TMX-73552
NASA TMS-71627
AIAA 75-449
Sum of individual component
noise levels
NOTE: One-_hird octave spectra from 50 to 16,000 Hertz
directivity angles from 0.17 to 2.79 radians
(i0 to 160 degrees) from inlet centerline.
*Modified by AiResearch
TABLE 6. NOISE PREDICTION METHODOLOGY COMPARISON.
Excess Jet Model Excess Core Model
Jet noise based on NASA
method adjusted to fair
through low-frequency
data
Core noise based on NASA
method
Fan discrete, broadband,
and buzz saw adjusted to
731 data
GE turbine noise method
Jet noise based on NASA method
Core noise defined as difference
between measured and predicted
sum of jet, fan, turbine in
50-250 Hz frequency bands
Fan inlet and fan discharge
defined as difference between
measured and predicted sum of
jet, core, turbine in 3150-
10,000 Hz bands
GE turbine noise method
85
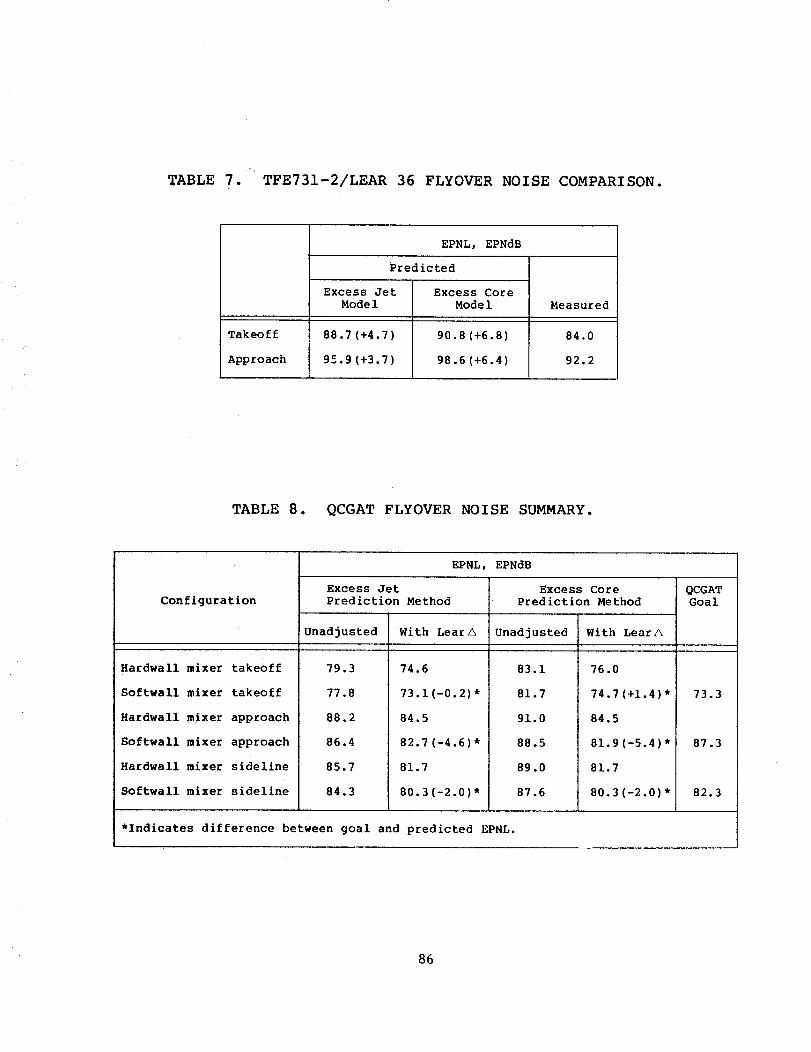
TABLE 7. TFE731-2/LEAR 36 FLYOVER NOISE COMPARISON.
EPNL, EPNdB
Predicted
Excess Jet
Model
Excess Core
Model Measured
Takeoff 88.7 (+4.7) 90.8 (+6.8) 84.0
Approach 9_=.9 (+3.7) 98.6 (+6.4) 92.2
TABLE 8. QCGAT FLYOVER NOISE SUMMARY.
Configuration
Hardwall mixer takeoff
Softwall mixer takeoff
Hardwall mixer approach
Softwall mixer approach
Hardwall mixer sideline
Softwall mixer sideline
EPNL, EPNdB
Excess Jet Excess Core QCGAT
Prediction Method Prediction Method Goal
Unadjusted With LearA Unadjusted With LearA
79.3
77.8
88.2
86.4
85.7
84.3
74.6
73.1(-0.2)*
84.5
82.7 (-4.6)*
81.7
80.3 (-2.0)*
83.1
81.7
91.0
88.5
89.0
87.6
76.0
74.7 (+1.4) *
84.5
81.9(-5.4)*
81.7
80.3 (-2.0) *
73.3
87.3
82.3
*Indicates difference between goal and predicted EPNL.
86
_._73 TAKEOFF
POINT
.3 EPNdB
.. "_..,,_}of:P" SIDELINE NOISE POINTS*
m (370 FT) _ / " , _ '_
413 _ _ . _ALTITUDE - _0.46 km (0.25 NMI) SIDELINE
APPROACHPOINT
87.3EPNdB _" *SIDELINE NOISE LEVEL BASED ON HIGHEST LEVEL
OCCURING AT THE THREE SIDELINE POINTS.
Figure i. QCGAT Airplane Noise Goals.
FAN EXHAUSTDUCT ACOUSTICAL
121 BYPASS VANES TREATMENT (L/H = 5.4)
73 CORE VANES \_ /_ / LOW FAN JET VELOCITY
SINGLE-STAGELOWTIP SPEED_ _I_LO W PRIMARY
-_.__,_;_ _ MIXER-
6u,..: _\_£__ pjf_:__--J Nozz,.,_VANES INLET \
ACOUSTICAL\ LARGE ROTOR-STATOR SPACINGTREATMENT _ ROTOR-STATOR NUMBERS SELECTED(L/D = 0.85) TO CUT-OFF INTERACTION TONES
Figure 2. QCGAT Acoustic Design Features.
87
17.5 27.2 15.2(6.9) (10.7) (6.0)
32.0 38.9 52.8(12.6) (15.3)(20.8)
ATTENUATOR LENGTH, cm (IN.)
NOTE:
O DENOTES SECTION NUMBER USEDIN ATTENUATION ANALYSI9
>
Figure 3. Nacelle Acoustic Treatment.
::_ii?iiiilJ::
:.:,:.:,:,:,:.:,:.:,:,:.:+:,...............
.:•••$i::ii_:_:_:_i_i_iiii_i_i_ii:i:i:iii:i:iii:iiiii:i:i:iiiiiiiii:i_iii:i:i:iii:i:i:i:i:i:i:iii:iii:iiiiiiiiiiii_iiiii_i_i_:_i_i_i_i_i_i_i_i_i:iiiiii_iiiiiii_:_•_:_•__._ .•....••.••.:.:..••..••.••.:...
:!_::!::::::::ii::_!_!::!::_::ii!!!_!_!::!!;!!i!i:;Jii!ii;iiii!_::!_i_;_iii;ii!ilill_:::_:ii::::i::_:ii;iiil;i_i_i_i_iliiiiiiiiiiiiiii::::i::i_::_:_::::::::ii::i:_i::iiiii::iiiiiiiii::::ii::iii::ii_i::_i::::_:::::i::;:_::::::i_::::::;:;;i.............
i _:_:_:_:_:_:_:_:_:_:_:i:_:!:!:i_ii_ii_i_iii_ii_[i_i!i[i_iiiiiiiii_i_ii_._i_{_:{::::::::::_:*:.:.:_:,*" " × " .'._{{{_{{{_{_{_{_{!{i_i{iiiiiiiiiiiiiiiiii[iii_i:_:_:_:_:_:_:_:_:_:_:_:_:_._:_:_:_:_._:!:._:;_:_::.`:.._i?_i[_
i::":" ii i_i:_i"
Figure 4. San Tan Acoustic Test Site.
88
IANGLE FROM
ENGINE INLET_ IRAOCENTERLINE 0.175 ""_(1
0.349 RAD (20°)
0.524 RAD
0.898 RAD (40°
N0.873 RAD (500
1.047 RAD
1.222 RAD (70°)
1.396 RAD (80°)
1.571 RAD (90°)
1.745 RAD (100°)
1.910 RAD (110°)
2.094 RAD (120°)
2.069 RAD (130 °)
2.443 HAD (140°)
2.618 RAD (150°)2.793 RAD
(1600)
/
p._ CONCRETEASPHALT
Figure 5. Acoustic Test Setup.
®
]
DENOTES 0.3175-cm (1/8-1N.) MICROPHONE
DENOTES 0.635-cm (1/4-1N.) SEMI-INFINITE TUBE
Figure 6. Internal Acoustic Instrumentation.
89
,=,, .=_
\
,"//
0 r,_
u
f
' ((
0
_ _ j 0000 L
0008-,-I
< 00£9 o
(! _1 ooos
,_, oool, £OqL£ , =¢
oogz _
L_ oooz P. _0091. _
oszL,,o,ooo1.,,=008 ,,=,__0£9 _ EOOS
/X 0017 o•,-I _I
• gL£ Za ._ ¢nu] _J
OSZ _ u0-,-I
ooz 2:
ogL- oo1. _ _,--It
08 _ (u
£9 _ o
os ,, u._ol,
l L£ oo" O_
0 0 0 0 0 0
o
::IONV(]3dlNI Q:IZI'IVINI:ION
• 100_,o
_ 70
6
101 2 4 68102 2 4 68103 2 4 68104 2
ONE-THIRD OCTAVE BAND CENTER FREQUENCY, HZ
Figure 9. Measured Data for Acoustic Configuration No. 2
at 2.62 Radian (150-Degree) Position.
110-
_ 100-=Z
_ 90-
80-
70"
101 2 4 68 102 2 4 68103 2 4 68104 2
ONE-THIRD OCTAVE BAND CENTER FREQUENCY, HZ
Figure i0. Corrected Data for Acoustic Configuration No. 2
at 2.62 Radian (150-Degree) Position.
91
.J
>O.J
m
tu_ 100
et-oo..
_ 80
O_Z
/,"iI t
I,'t/ "I i
r _
/u i ,
1012 4 681022 4 681032 468
ONE-THIRD OCTAVE BAND
CENTER FREQUENCY, HZ
042
30.48 m (100 FT) RADIUSMIKE HEIGHT: 1.524 m (5 FT)
AT 2.62 rad (150 ° )
RAW DATA
.... CORRECTED DATA
Figure ii. Raw Data versus Ground Corrected Data.
DEGREES
Figure 12.
TONE CORRECTED PERCEIVED NOISE LEVEL, PNdB t
O TFE731-3 RUN 9
Z_ QCGAT CF708C
Static Comparison at Takeoff of Model TFW.731-3
and QCGAT Coannular Nozzle Configurations.
92
120' 216:2'rad (150 °) FROM INLE]
.J,_110, I IU--_i =ll = =ll=>0._oloo. "k_,,
=_ 90 - ; ^,
¢z:o 80_" I,LI bl=
70¢nZ 60
501012 4681022 4681032 4681042
ONE-THIRD OCTAVE BANDCENTER FREQUENCY, HZ
Figure 13.
---=-TFE731-3PRODUCTIONENGINE
------QCGATCOANNULARNOZZLE WITHHARDWALLNACELLE
Noise Level Comparison at Takeoffof Model TFE731 and QCGAT Coannular
Nozzle Configurations.
110"
w_>O_mo 100"
_d_: 80.
_zi
70,
101
|
2.62 rad (150 °) FROM INLET AXIS
;'[",] Ill I t I!1 I"" %'%A
/_ MIXER NOZZLE WITH -',_1""_
TREATED NACELLE "--- _-
I ---- COANNULAR NOZZLEWITH TREATED NACELLE
I II I I I II I I2 4 68 102 2 4 68103 2 4 68104 2
ONE-THIRD OCTAVE BAND CENTER FREQUENCY, HZ
Figure 14. Noise Level Comparison at Takeoff
of QCGAT Mixer Compound and
Coannular Nozzle Configurations.
93
9On-
.J_<>O
m_ 70
_°
_ 6o_Z
0.87 rad (50 ° ) FROM INLET
-IJill liI _.
m
50 I
101 2 4 68 102 2 4 68 103 2
I I I I
HARDWALL NACELLE
TREATED NACELLEI I i I I I I i
I I I l
4 681042
ONE-THIRD OCTAVE BAND CENTER FREQUENCY, HZ
Figure 15. Approach Noise Level Comparison of Hardwall
versus Treated Acoustic Panels at 0.87 rad(50 ° ) from Engine Inlet Centerline for the
Mixer Compound Nozzle Configuration.
9O
,,,rn>Omm 80
_ 7o,wq
a. W
_Z
50.
2.09 rad (120 ° ) FROM INLET, i, i |
f-- . RowA,L.... TREATED
I I I Ii I !
10 2 4 6 8 102 2 4 6 8 103 2 4 68 104 2
ONE-THIRD OCTAVE BAND CENTER FREQUENCY, HZ
Figure 16. Approach Noise L_vel Comparison of Hardwall
versus Treated Acoustic Panels at 2.09 rad(120 °) from Engine Inlet Centerline for the
Mixer Compound Nozzle Configuration.
94
¢z: 100.J<i.ua3>OLU..=_ 90
w_
_g 80uaO._oa.
IJJ
7OZIXI
0m Z
60
101
1.57 rad (90 ° ) FROM INLET
/
2
/
468
I I t.... TREATED NACELLE
HARDWALL NACELLEI i i II I I I II
02 2 4 6 8103 2 4 68104 2
ONE-THIRD OCTAVE.BAND CENTER FREQUENCY, HZ
Figure 17. Takeoff Noise Level Comparison of Hardwall versus
Treated Acoustic Panels at 1.57 rad (90 ° ) from
Engine Inlet Centerline for the Coannular Nozzle
Configuration.
..,_ 90- _
_g 8o-=.=d
_ 70-
60.
101 2 4 681022 4. 68103 2 4 681042
ONE-THIRD OCTAVE BAND CENTER FREQUENCY, Hz
Figure 18. Comparison of Measured and PredictedNoise Levels Before Correlation.
95
,_ 100 _1-1-[--['-'--'T- [--"
,o L__-_ JE,T___I--7_,_¢"l I III /I_,..F
. 11--I" ..../
_, I J I II .4-"'I""I-I.J_ _ Io..=,.,., I/I II L/'I I II ["-,[ \TURBINE
,-,-" 7o , i+---l-__t-_--i-i=_= I/ I.'P't','CO_EI III I I"I,II II
10' 2 4 6810"2 4 6810'2 4 6810 2
ONE-THIRD OCTAVE BAND CENTER FREQUENCY, HZ
Figure 19. Data Correlation, Excess Jet Model,
Softwall Mixer, 2.09-Radian
(120-Degree) Position.
o I"t IJ i__ III _"A_J P_A,-, II II I _ ',,I "5 ,.1,,4" ",_"'tL_,I
_: JET '',_ I_ I__o._ r_'-:_._._
80 ° . _. ,,
_:: ,,r F11i,=ANL,,"J,,<_ 70 .
vi_z 60 1 2 I ' ' 3' ' '" 4'10 2 4 6810 2 4 6810 2 4 6810 2
ONE-THIRD OCTAVE BAND CENTER FREQUENCY, HZ
Figure 20. Data Correlation, Excess Core Model, Softwall
Mixer, 2.09-Radian (120-Degree) Position.
96
MEASURE ENGINESTATIC NOISE LEVELS
,i,ALAB PROGRAM
PROCESSES DATA FILES
SPL PROGRAM
CORRECTS DATA FILES
• GROUND REFLECTION
• FAA CONDITIONS
PLOTS RESULTS
DEFINEAIRPLANEFLIGHTPROFILES
]I
FPROGRAM NASADELTA
• COMPARES MEASURED ANDPREDICTED FREE FIELDNOISE LEVELS
• COMPUTES DELTA SPECTRAFOR EACH SOURCE
• APPLIES DELTA SPECTRA
TO PREDICTED FLYOVERNOISE SOURCES
GTENFLY PROGRAM
ADJUSTS INDIVIDUAL SOURCESFROM STATIC TO FLIGHT
PREDICTS INDIVIDUAL SOURCEFLYOVER PNL, PNLT. EI_L
PREDICTS TOTAL ENGINEFLYOVER EPNL
I MEASURE ENGINE '1PERFORMANCE PARAMETERS
_ "
GTENE PROGRAM
PREDICTS NOISE SOURCE LEVELS
• FAN INLET DISCRETE,BROADBAND ANDBUZZ SAW NOISE
• FA_N DISCHARGE DISCRETE,:
BROADBAND
• JET
• COMBUSTOR
• TURBINE
• TOTAL
GTEN5 PROGRAM
PREDICTS NOISE SOURCELEVEIJ FOR FARPART SE CONDITIONS
Figure 21. Flyover Noise Prediction from Static Data.
_.. 80
" _ 70Z
,_ 60
Z Z
,_ 50,.J
ul ul
_u.], 40r_lou,J
re,,
e- ooI,,U
30
20
31.5 63
PREDIc'I:E D
I
MEASURED
MEASURED EPNI. 84.0
PREDICTED EPNL 88.7I I I I I
125
o,
250 500 1000 2000 4000 800016,000
ONE-THIRD OCTAVE BAND CENTER FREQUENCY IN Hz
Figure 22. Measured Learjet 35/36 versusPredicted Excess Jet Model.
97
80
_ 70
_,_ 60
l
j "%
• %
, \
_._ . \',= _ 56 ,-
o L
_= 40 _
z _o 30 iO
_z 201 --- /
10' ,101 2 4 681022 4 681032 4 68 2
m
PREDICTED
90.8 EPNdB
MEASURED84.0 EPNdB
ONE-THIRD OCTAVE BAND CENTER FREQUENCY, HZ
Figure 23. Measured Learjet 35/36 versus PredictedExcess Core Model.
[ MEASURED OCGAT J i MEASURED TFE731.3 iSTATIC NOISE DATA STATIC NOISE DATAi
I PREDICTED QCGAT [ PREDICTED TFE731-3 iNOISE SOURCE LEVELS NOISE SOURCE LEVELS
1 1! I IFLYOVER LEVELS FLYOVER LEVELS ,. ,
APPLY TFE731/LEARJETCALIBRATION DELTASTO QCGAT ENGINE _]_ MEASURED LEAR JET 35/36 i
FLYOVER LEVELS ATFAR PART 36 CONDITIONS
FLYOVER NOISE LEVELS PREDICTION PROCEDURE
Figure 24. Flyover Noise Calibration Procedure.
98
¢¢1"OzLI,LI
100
90
8O
1969 FAR-36 REQUIREMENT
1977 RULE
LEAR JET
CITATION
J
//
/J
36 OO FALCON 10
GOAL
,o ]14 45 227 454 907 Ix1000kglI3 10 60 100 200 (x1_ _'BM_t
TAKEOFF GROSS WEIGHT
Figure 25. Takeoff Noise Summary.
m-ozo.UU
100
9O
80
701.4
1977 RULEI
J
LEARJET 36 OO FALCON /CITATION O 1_,,,.,
QCGAT GOAL
AI RESEARCH
4.5 22.7 45.4 90.7 (X 1000 kg)
10 50 100 200 (X 1000 LBM)
TAKEOFF GROSS WEIGHT
Figure 26. Sideline Noise Summary.
99
..lozo,.I.M
100
90
80
70
11.4
f
1977 RULEO FALCON 10 _.r
LEAR JET 36 O._'-- I
ClTATION_ QCGATI GOAL
D AIRESEARCH
4.5 22.7 45.4 90.7 (X 1000 kg)
10 50 100 200 (X 1000 LBM)
TAKEOFF GROSS WEIGHT
Figure 27. Approach Noise Summary.
i00