Embed Size (px)
Citation preview
FinancialStatements 2020

Financial Statements
2 Airbus / Financial Statements 2020
3 Airbus / Financial Statements 2020
1Airbus SE IFRS Consolidated Financial Statements
2Notes to the IFRS Consolidated Financial Statements
3Airbus SE IFRS Company Financial Statements
4Notes to the IFRS Company Financial Statements
5Other Supplementary Information
Including the Independent Auditor’s Report

Chapter
14 Airbus / Financial Statements 2020
5 Airbus / Financial Statements 2020
Airbus SE – IFRS Consolidated Income Statement
for the years ended 31 December 2020 and 2019 6
Airbus SE – IFRS Consolidated Statement
of Comprehensive Income for the years ended
31 December 2020 and 2019 7
Airbus SE – IFRS Consolidated Statement
of Financial Position for the years ended
31 December 2020 and 2019 8
Airbus SE – IFRS Consolidated Statement
of Cash Flows for the years ended
31 December 2020 and 2019 10
Airbus SE – IFRS Consolidated Statement
of Changes in Equity for the years ended
31 December 2020 and 2019 11
1Airbus SE IFRS Consolidated Financial Statements
1. Airbus SE – IFRS Consolidated Financial Statements /
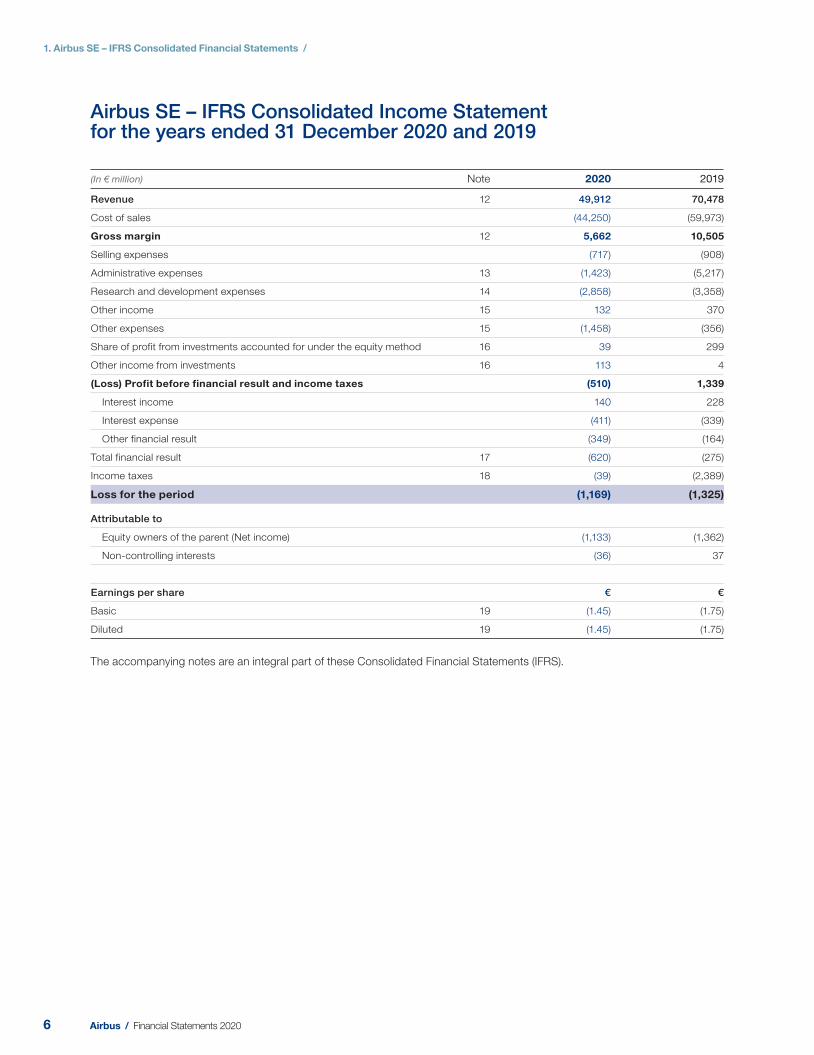
Airbus SE – IFRS Consolidated Income Statement for the years ended 31 December 2020 and 201 9
(In € million) Note 2020 2019
Revenue 12 49,912 70,478
Cost of sales (44,250) (59,973)
Gross margin 12 5,662 10,505
Selling expenses (717) (908)
Administrative expenses 13 (1,423) (5,217)
Research and development expenses 14 (2,858) (3,358)
Other income 15 132 370
Other expenses 15 (1,458) (356)
Share of profit from investments accounted for under the equity method 16 39 299
Other income from investments 16 113 4
(Loss) Profit before financial result and income taxes (510) 1,339
Interest income 140 228
Interest expense (411) (339)
Other financial result (349) (164)
Total financial result 17 (620) (275)
Income taxes 18 (39) (2,389)
Loss for the period (1,169) (1,325)
Attributable to
Equity owners of the parent (Net income) (1,133) (1,362)
Non-controlling interests (36) 37
Earnings per share € €
Basic 19 (1.45) (1.75)
Diluted 19 (1.45) (1.75)
The accompanying notes are an integral part of these Consolidated Financial Statements (IFRS).
6 Airbus / Financial Statements 2020
1. Airbus SE – IFRS Consolidated Financial Statements /
1
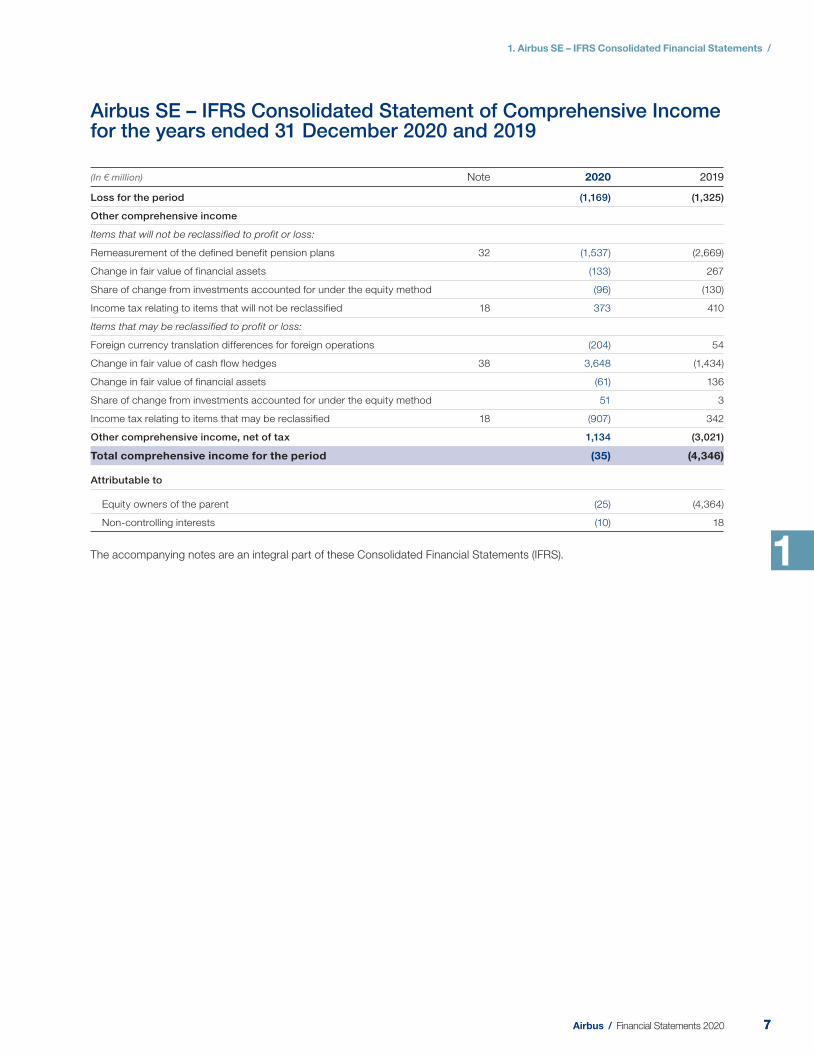
Airbus SE – IFRS Consolidated Statement of Comprehensive Income for the years ended 3 1 December 2020 and 2 019
(In € million) Note 2020 2019
Loss for the period (1,169) (1,325)
Other comprehensive income
Items that will not be reclassified to profit or loss:
Remeasurement of the defined benefit pension plans 32 (1,537) (2,669)
Change in fair value of financial assets (133) 267
Share of change from investments accounted for under the equity method (96) (130)
Income tax relating to items that will not be reclassified 18 373 410
Items that may be reclassified to profit or loss:
Foreign currency translation differences for foreign operations (204) 54
Change in fair value of cash flow hedges 38 3,648 (1,434)
Change in fair value of financial assets (61) 136
Share of change from investments accounted for under the equity method 51 3
Income tax relating to items that may be reclassified 18 (907) 342
Other comprehensive income, net of tax 1,134 (3,021)
Total comprehensive income for the period (35) (4,346)
Attributable to
Equity owners of the parent (25) (4,364)
Non-controlling interests (10) 18
The accompanying notes are an integral part of these Consolidated Financial Statements (IFRS).
77Airbus / Financial Statements 2020
1. Airbus SE – IFRS Consolidated Financial Statements /
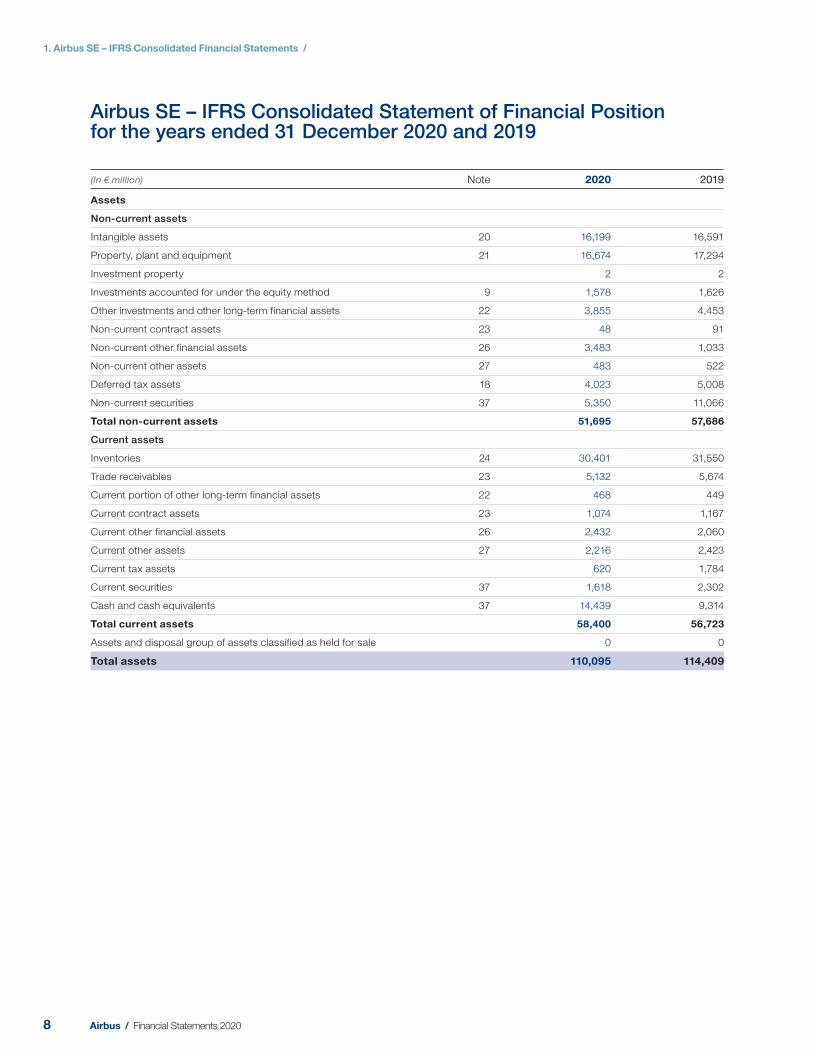
Airbus SE – IFRS Consolidated Statement of Financial Positionfor the years ended 31 December 2020 and 2019
(In € million) Note 2020 2019
Assets
Non-current assets
Intangible assets 20 16,199 16,591
Property, plant and equipment 21 16,674 17,294
Investment property 2 2
Investments accounted for under the equity method 9 1,578 1,626
Other investments and other long-term financial assets 22 3,855 4,453
Non-current contract assets 23 48 91
Non-current other financial assets 26 3,483 1,033
Non-current other assets 27 483 522
Deferred tax assets 18 4,023 5,008
Non-current securities 37 5,350 11,066
Total non-current assets 51,695 57,686
Current assets
Inventories 24 30,401 31,550
Trade receivables 23 5,132 5,674
Current portion of other long-term financial assets 22 468 449
Current contract assets 23 1,074 1,167
Current other financial assets 26 2,432 2,060
Current other assets 27 2,216 2,423
Current tax assets 620 1,784
Current securities 37 1,618 2,302
Cash and cash equivalents 37 14,439 9,314
Total current assets 58,400 56,723
Assets and disposal group of assets classified as held for sale 0 0
Total assets 110,095 114,409
8 Airbus / Financial Statements 2020
1. Airbus SE – IFRS Consolidated Financial Statements /
1
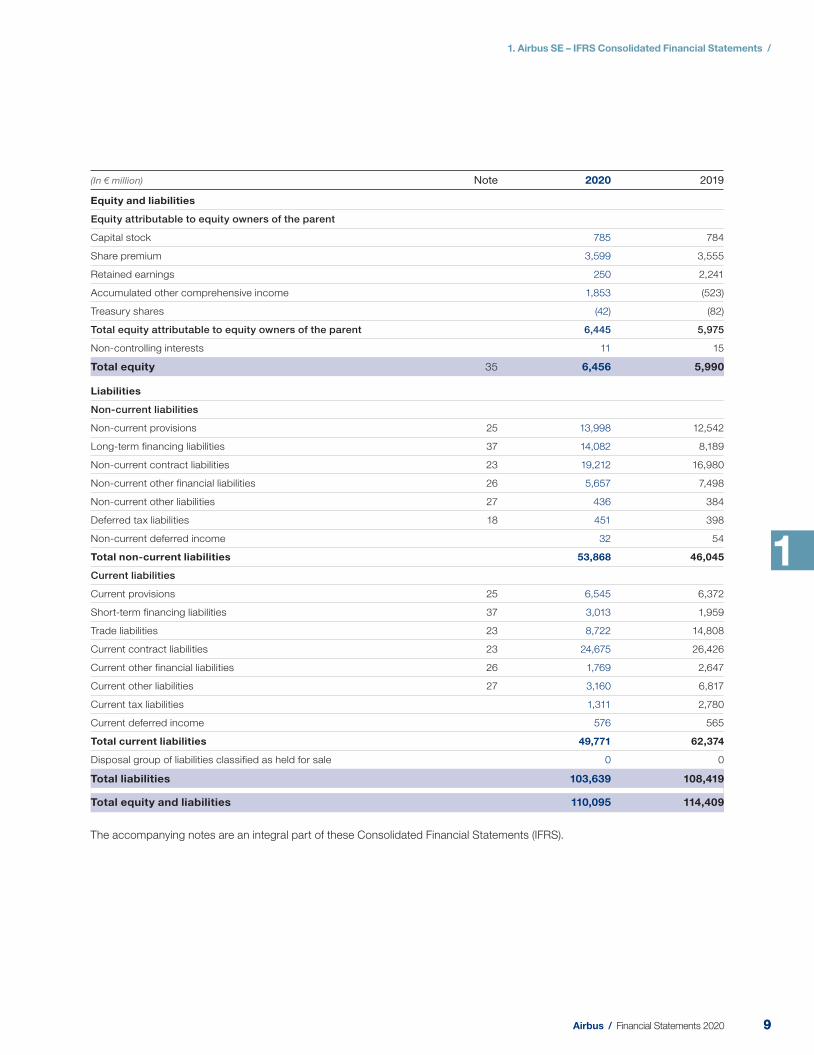
(In € million) Note 2020 2019
Equity and liabilities
Equity attributable to equity owners of the parent
Capital stock 785 784
Share premium 3,599 3,555
Retained earnings 250 2,241
Accumulated other comprehensive income 1,853 (523)
Treasury shares (42) (82)
Total equity attributable to equity owners of the parent 6,445 5,975
Non-controlling interests 11 15
Total equity 35 6,456 5,990
Liabilities
Non-current liabilities
Non-current provisions 25 13,998 12,542
Long-term financing liabilities 37 14,082 8,189
Non-current contract liabilities 23 19,212 16,980
Non-current other financial liabilities 26 5,657 7,498
Non-current other liabilities 27 436 384
Deferred tax liabilities 18 451 398
Non-current deferred income 32 54
Total non-current liabilities 53,868 46,045
Current liabilities
Current provisions 25 6,545 6,372
Short-term financing liabilities 37 3,013 1,959
Trade liabilities 23 8,722 14,808
Current contract liabilities 23 24,675 26,426
Current other financial liabilities 26 1,769 2,647
Current other liabilities 27 3,160 6,817
Current tax liabilities 1,311 2,780
Current deferred income 576 565
Total current liabilities 49,771 62,374
Disposal group of liabilities classified as held for sale 0 0
Total liabilities 103,639 108,419
Total equity and liabilities 110,095 114,409
The accompanying notes are an integral part of these Consolidated Financial Statements (IFRS).
99Airbus / Financial Statements 2020
1. Airbus SE – IFRS Consolidated Financial Statements /
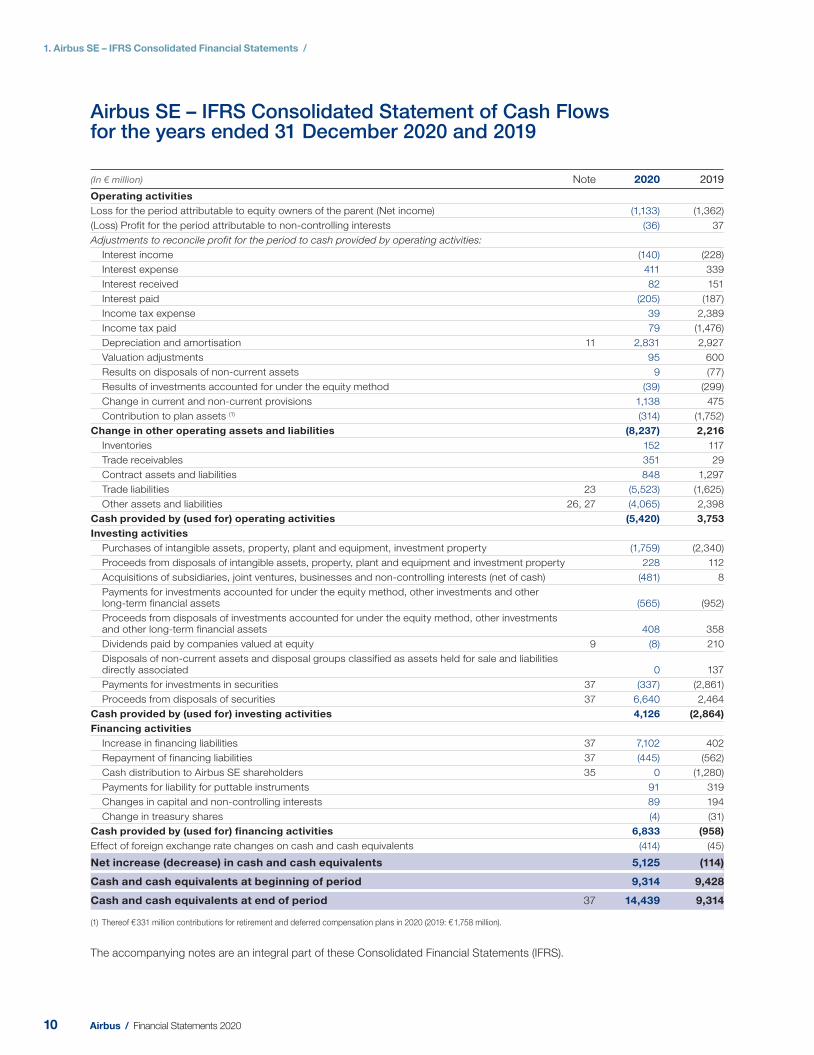
Airbus SE – IFRS Consolidated Statement of Cash Flowsfor the years ended 31 December 2020 and 2019
(In € million) Note 2020 2019
Operating activities
Loss for the period attributable to equity owners of the parent (Net income) (1,133) (1,362)
(Loss) Profit for the period attributable to non-controlling interests (36) 37
Adjustments to reconcile profit for the period to cash provided by operating activities:
Interest income (140) (228)
Interest expense 411 339
Interest received 82 151
Interest paid (205) (187)
Income tax expense 39 2,389
Income tax paid 79 (1,476)
Depreciation and amortisation 11 2,831 2,927
Valuation adjustments 95 600
Results on disposals of non-current assets 9 (77)
Results of investments accounted for under the equity method (39) (299)
Change in current and non-current provisions 1,138 475
Contribution to plan assets (1) (314) (1,752)
Change in other operating assets and liabilities (8,237) 2,216
Inventories 152 117
Trade receivables 351 29
Contract assets and liabilities 848 1,297
Trade liabilities 23 (5,523) (1,625)
Other assets and liabilities 26, 27 (4,065) 2,398
Cash provided by (used for) operating activities (5,420) 3,753
Investing activities
Purchases of intangible assets, property, plant and equipment, investment property (1,759) (2,340)
Proceeds from disposals of intangible assets, property, plant and equipment and investment property 228 112
Acquisitions of subsidiaries, joint ventures, businesses and non-controlling interests (net of cash) (481) 8
Payments for investments accounted for under the equity method, other investments and other long-term financial assets (565) (952)
Proceeds from disposals of investments accounted for under the equity method, other investments and other long-term financial assets 408 358
Dividends paid by companies valued at equity 9 (8) 210
Disposals of non-current assets and disposal groups classified as assets held for sale and liabilities directly associated 0 137
Payments for investments in securities 37 (337) (2,861)
Proceeds from disposals of securities 37 6,640 2,464
Cash provided by (used for) investing activities 4,126 (2,864)
Financing activities
Increase in financing liabilities 37 7,102 402
Repayment of financing liabilities 37 (445) (562)
Cash distribution to Airbus SE shareholders 35 0 (1,280)
Payments for liability for puttable instruments 91 319
Changes in capital and non-controlling interests 89 194
Change in treasury shares (4) (31)
Cash provided by (used for) financing activities 6,833 (958)
Effect of foreign exchange rate changes on cash and cash equivalents (414) (45)
Net increase (decrease) in cash and cash equivalents 5,125 (114)
Cash and cash equivalents at beginning of period 9,314 9,428
Cash and cash equivalents at end of period 37 14,439 9,314
(1) Thereof € 331 million contributions for retirement and deferred compensation plans in 2020 (2019: € 1,758 million).
The accompanying notes are an integral part of these Consolidated Financial Statements (IFRS).
10 Airbus / Financial Statements 2020
1. Airbus SE – IFRS Consolidated Financial Statements /
1
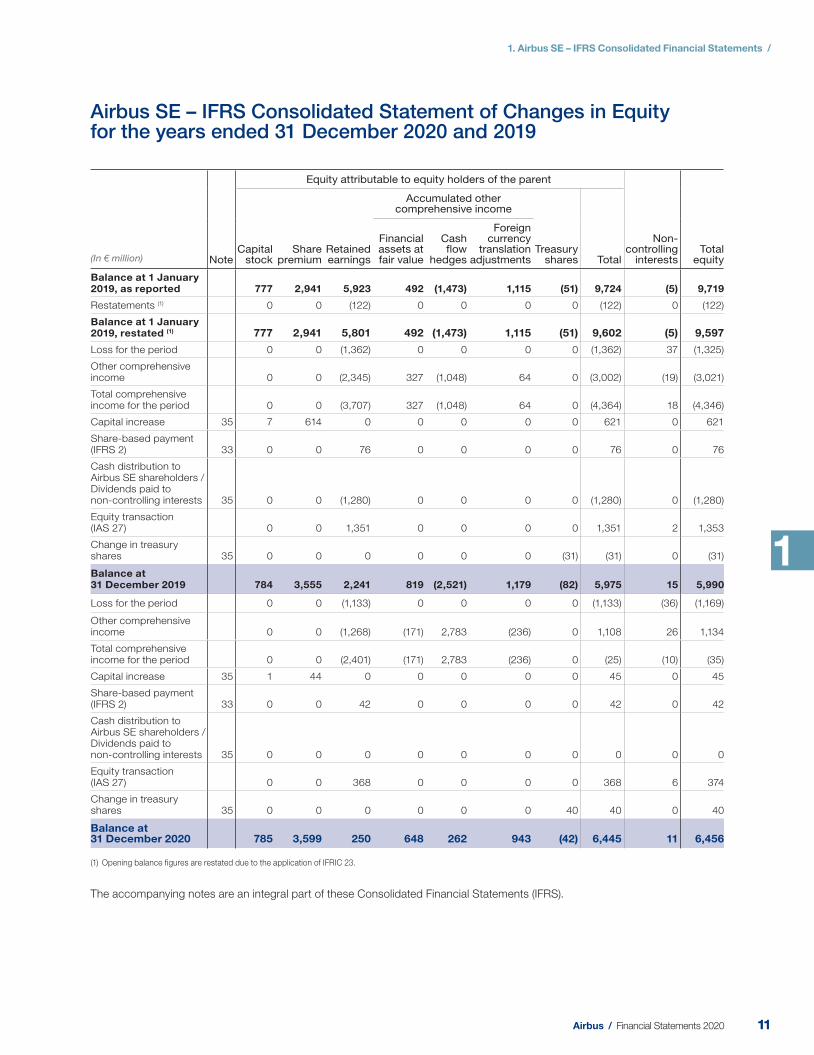
Airbus SE – IFRS Consolidated Statement of Changes in Equityfor the years ended 3 1 December 2020 and 2 019
(In € million) Note
Equity attributable to equity holders of the parent
Non-controlling
interests Total
equity Capital
stock Share
premium Retained earnings
Accumulated other comprehensive income
Treasury shares Total
Financial assets at fair value
Cash flow
hedges
Foreign currency
translation adjustments
Balance at 1 January 2019, as reported 777 2,941 5,923 492 (1,473) 1,115 (51) 9,724 (5) 9,719
Restatements (1) 0 0 (122) 0 0 0 0 (122) 0 (122)
Balance at 1 January 2019, restated (1) 777 2,941 5,801 492 (1,473) 1,115 (51) 9,602 (5) 9,597
Loss for the period 0 0 (1,362) 0 0 0 0 (1,362) 37 (1,325)
Other comprehensive income 0 0 (2,345) 327 (1,048) 64 0 (3,002) (19) (3,021)
Total comprehensive income for the period 0 0 (3,707) 327 (1,048) 64 0 (4,364) 18 (4,346)
Capital increase 35 7 614 0 0 0 0 0 621 0 621
Share-based payment (IFRS 2) 33 0 0 76 0 0 0 0 76 0 76
Cash distribution to Airbus SE shareholders / Dividends paid to non- controlling interests 35 0 0 (1,280) 0 0 0 0 (1,280) 0 (1,280)
Equity transaction (IAS 27) 0 0 1,351 0 0 0 0 1,351 2 1,353
Change in treasury shares 35 0 0 0 0 0 0 (31) (31) 0 (31)
Balance at 31 December 2019 784 3,555 2,241 819 (2,521) 1,179 (82) 5,975 15 5,990
Loss for the period 0 0 (1,133) 0 0 0 0 (1,133) (36) (1,169)
Other comprehensive income 0 0 (1,268) (171) 2,783 (236) 0 1,108 26 1,134
Total comprehensive income for the period 0 0 (2,401) (171) 2,783 (236) 0 (25) (10) (35)
Capital increase 35 1 44 0 0 0 0 0 45 0 45
Share-based payment (IFRS 2) 33 0 0 42 0 0 0 0 42 0 42
Cash distribution to Airbus SE shareholders / Dividends paid to non- controlling interests 35 0 0 0 0 0 0 0 0 0 0
Equity transaction (IAS 27) 0 0 368 0 0 0 0 368 6 374
Change in treasury shares 35 0 0 0 0 0 0 40 40 0 40
Balance at 31 December 2020 785 3,599 250 648 262 943 (42) 6,445 11 6,456
(1) Opening balance figures are restated due to the application of IFRIC 23.
The accompanying notes are an integral part of these Consolidated Financial Statements (IFRS).
1111Airbus / Financial Statements 2020

2
Chapter
12 Airbus / Financial Statements 2020
13 Airbus / Financial Statements 2020
2.1 Basis of Preparation 15
2.2 Airbus Structure 21
2.3 Segment Information 26
2.4 Airbus Performance 28
2.5 Operational Assets and Liabilities 34
2.6 Employees Costs and Benefits 47
2.7 Capital Structure and Financial Instruments 60
2.8 Other Notes 79
2.9 Appendix “Simplified Airbus Structure” 82
2Notes to the IFRS Consolidated Financial Statements
2. Notes to the IFRS Consolidated Financial Statements /
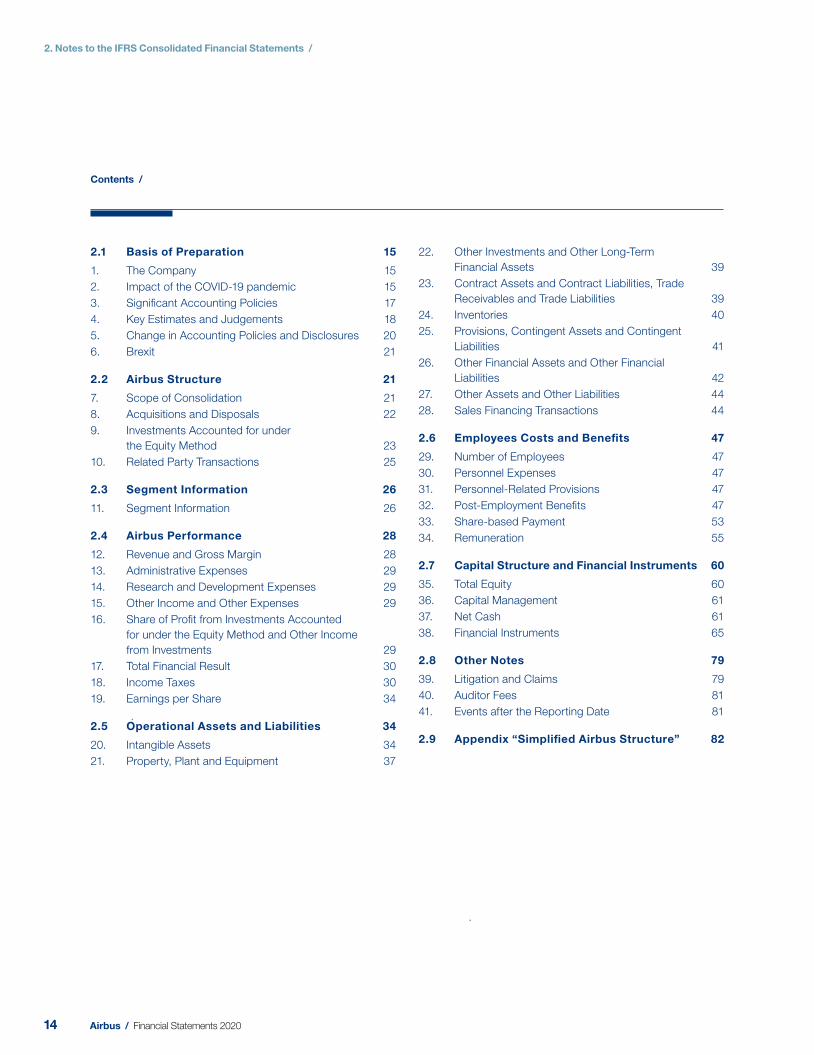
2.1 Basis of Preparation 15
1. The Company 15
2. Impact of the COVID-19 pandemic 15
3. Signifi cant Accounting Policies 17
4. Key Estimates and Judgements 18
5. Change in Accounting Policies and Disclosures 20
6. Brexit 21
2.2 Airbus Structure 21
7. Scope of Consolidation 21
8. Acquisitions and Disposals 22
9. Investments Accounted for under
the Equity Method 23
10. Related Party Transactions 25
2.3 Segment Information 26
11. Segment Information 26
2.4 Airbus Performance 28
12. Revenue and Gross Margin 28
13. Administrative Expenses 29
14. Research and Development Expenses 29
15. Other Income and Other Expenses 29
16. Share of Profi t from Investments Accounted
for under the Equity Method and Other Income
from Investments 29
17. Total Financial Result 30
18. Income Taxes 30
19. Earnings per Share 34
2.5 Operational Assets and Liabilities 34
20. Intangible Assets 34
21. Property, Plant and Equipment 37
22. Other Investments and Other Long-Term
Financial Assets 39
23. Contract Assets and Contract Liabilities, Trade
Receivables and Trade Liabilities 39
24. Inventories 40
25. Provisions, Contingent Assets and Contingent
Liabilities 41
26. Other Financial Assets and Other Financial
Liabilities 42
27. Other Assets and Other Liabilities 44
28. Sales Financing Transactions 44
2.6 Employees Costs and Benefi ts 47
29. Number of Employees 47
30. Personnel Expenses 47
31. Personnel-Related Provisions 47
32. Post-Employment Benefi ts 47
33. Share-based Payment 53
34. Remuneration 55
2.7 Capital Structure and Financial Instruments 60
35. Total Equity 60
36. Capital Management 61
37. Net Cash 61
38. Financial Instruments 65
2.8 Other Notes 79
39. Litigation and Claims 79
40. Auditor Fees 81
41. Events after the Reporting Date 81
2.9 Appendix “Simplifi ed Airbus Structure” 82
Contents /
14 Airbus / Financial Statements 2020
2.1 Basis of Preparation
2. Notes to the IFRS Consolidated Financial Statements /
2
2.1 Basis of Preparation
1. The Company
T he accompanying IFRS Consolidated Financial Statements present the fi nancial position and the results of operations of Airbus SE together with its subsidiaries referred to as “the Company”, a European public limited-liability company (Societas Europaea) with its seat (statutaire zetel) in Amsterdam, The Netherlands, its registered address at Mendelweg 30, 2333 CS Leiden, The Netherlands, and registered with the Dutch Commercial Register (Handelsregister) under number 24288945.
The Company’s reportable segments are Airbus, Airbus Helicopters and Airbus Defence and Space (see “– Note 11: Segment Information”). The Company is listed on the European stock exchanges in Paris, Frankfurt am Main, Madrid, Barcelona, Valencia and Bilbao. The IFRS Consolidated Financial Statements were authorised for issue by the Company’s Board of Directors on 17 February 2021.
2. Impact of the COVID-19 pandemic
The COVID-19 pandemic, the resulting health and economic crisis and actions taken in response to the spread of the pandemic, including government measures and travel limitations and restrictions, have resulted in signifi cant disruption to the Company’s business operations and supply chain. A number of measures have been taken by the Company to implement stringent health and safety procedures while taking account of stock levels and production lead-times.
The aerospace industry including the financial health of operators, airlines, lessors and suppliers, commercial aircraft market, demand for air travel and commercial air traffi c have been severely impacted by the COVID-19 pandemic. As a result, airlines have reduced capacity, grounded large portions of their fl eets temporarily, sought to implement measures to reduce cash spending and secure liquidity. Some airlines are also seeking arrangements with creditors, restructuring or applying for bankruptcy or insolvency protection, which may have further consequences for the Company and its order book as well as other consequences resulting from the related proceedings.
On 8 April 2020, the Company announced its decision to adapt commercial aircraft production rates to 40 per month for the A320 Family, two per month for A330 and six per month for A350 in response to the new COVID-19 market environment. Subsequently, the rate for A350 was further reduced to fi ve per month. This represented a reduction of the March 2020 pre-COVID-19 average rates of roughly one third. With these new rates, the Company intends to preserve its ability to meet customer demand while protecting its ability to further adapt as the global market evolves.
The Company is monitoring the evolution of the COVID-19 pandemic and will continue to assess further impacts going forward. The main elements related to the Consolidated Financial Statements considered as of 31 December 2020 are detailed in the following sections. A consistent set of assumptions has been applied for each of the below elements.
The Company’s business, results of operations and fi nancial condition have been and will continue to be materially affected by the COVID-19 pandemic, and the Company continues to face signifi cant risks and uncertainties related to the COVID-19 pandemic and its resulting health and economic crisis.
2.1 Going concern and associated liquidity measures
On 23 March 2020, the Company has announced measures to bolster its liquidity and balance sheet in response to the COVID-19 pandemic, including a new € 15 billion credit facility partially termed out by bond and USPP issuances, the withdrawal of 2019 dividend proposal with cash value of € 1.4 billion, the suspension of voluntary top up pension funding and strong focus on support to customers and delivery. In parallel, governmental partners have supported the aerospace sector since the beginning of the crisis either through direct support to airlines and suppliers, or through partial unemployment schemes. With these decisions, the Company has available liquidity to cope with additional cash requirements, including the amended production rates as described above.
On 21 October 2020, the Company signed a new € 6 billion Revolving Syndicated Credit Facility also partially terming out the € 15 billion credit facility by € 3 billion in order to refi nance its existing € 3 billion Revolving Syndicated Facility (see “– Note 37: Net Cash”).
As of 31 December 2020, the Company has a net cash position of € 4.3 billion with a total liquidity of € 33.6 billion, before deducting short-term fi nancing liabilities.
Based on the above, management considers the Company has suffi cient resources to continue operating for at least 12 months and that there are no material uncertainties about the Company’s ability to continue as a going concern.
2.2 Goodwill impairment
As a result of the deterioration in the economic environment and the uncertainty in the business outlook, the Company has performed impairment tests of goodwill throughout the year and also as at 31 December 2020, which leads to no impairment being necessary (see “– Note 20: Intangible Assets”).
These tests have been performed in line with existing methodology for each of the Company’s cash generating units (CGUs). Cash fl ow projections are based on latest operative planning and expected cash fl ows beyond the planning horizon
1515Airbus / Financial Statements 2020
2. Notes to the IFRS Consolidated Financial Statements /
2.1 Basis of Preparation
through a terminal value. The latest operative planning includes management’s best assessment of future production rates, aircraft deliveries and order in-take, together with any mitigating actions that the Company may implement. These have been used to derive cash fl ow projections for the years 2021 until 2025, and thereafter for the terminal value.
In addition, the Company performed a comparison with the fair value of each CGU derived from the market capitalisation. The market capitalisation as of 31 December 2020 amounts to € 70.4 billion and signifi cantly exceeds the equity of the Company.
2.3 Other Investments and Other Long-Term Financial Assets / Joint Ventures
The Company’s main investments have been impacted by the high volatility in fi nancial markets in 2020 with the variation recorded either through fi nancial result or OCI. The impact in fi nancial result amounts to € -136 million for a loan to OneWeb Communications and € -226 million for the investment in Dassault Aviation. The impact in OCI for € -206 million includes the investment in OneWeb Communications and other investments.
For further information on Dassault and OneWeb investments, please see “– Note 22: Other Investments and Other Long-Term Financial Assets”.
2.4 Workforce adaptation
In June 2020, Airbus announced plans to adapt its global workforce, principally in France, Germany, Spain and the UK, and resize its commercial aircraft activity in response to the COVID-19 crisis. This adaptation was expected to result in a reduction of around 15,000 positions no later than summer 2021.
Working time adaptation and mitigation measures supported by the governments have reduced the number of positions subject to the restructuring plan. Taking into consideration the actual departures since the initial announcement, the remaining number of positions subject to the restructuring plan amounts to approximately 6,100 as of 31 December 2020, including pre-retirement headcount under German Altersteilzeit (“ATZ”).
In addition, Airbus Defence and Space completed the consultation process with the Company’s European works council on the d ivision’s planned restructuring. The plan presented to the employee representatives initially foresaw the reduction of around 1,900 positions including pre-retirement headcount under German Altersteilzeit (“ATZ”) until the end of 2021. However this number was also subsequently reduced to approximately 1,400 positions refl ecting departures which occurred after the initial announcement.
I n November 2020, a reconciliation of Interest Agreement involving approximately 100 positions has been signed in Germany within Airbus Helicopters and hence, a provision has been recorded accordingly.
As of 30 September 2020, a restructuring provision was recognised for an amount of € 1.2 billion including mainly the cost of voluntary and compulsory measures taking into account management’s best estimate of the impact of the working time
adaptation and government support measures. Total payments to employees affected by the plan would amount to approximately € 1.5 billion, including the settlement of other accrued employee benefi ts.
As of 31 December 2020, the provision amounts to € 1.0 billion, reduced mainly by the costs incurred in the fourth quarter.
2.5 Operational assets
The Company has performed a comprehensive review of its operational assets and liabilities taking into account the amended production rates and expected future deliveries. This review has resulted in charges being recorded in 2020 for an amount of € 1.3 billion, including an impairment of inventories considered at risk of € 355 million, additional provisions relating to A380 programme of € 279 million, a write-off of capitalised development costs of € 101 million, provisions for supplier commitments of € 157 million and provisions covering various commercial risks of approximately € 401 million.
2.6 Deferred tax
As of 31 December 2020, the recoverability of deferred tax assets has been assessed based on the latest operating planning and resulting from the COVID-19 pandemic. This has led to deferred tax asset impairments amounting to € 356 million in 2020 including tax losses carried forward (see “– Note 18: Income Taxes”).
2.7 Hedge accounting
The Company has maintained its hedge accounting policies as defi ned in the 2019 year-end Financial Statements. In the Company’s assessment the risk of future cancellations that are not yet materialised has been included. When transactions are no longer expected to occur in accordance with the hedge designation, the accumulated gains or losses on the hedging instrument have been reclassifi ed to fi nancial result. The impact in fi nancial result amounts to € -48 million as of 31 December 2020, mainly relating to the widebody programmes.
The increase of the counterparty credit risk and credit spread is included in the determination of the fair value of the hedges and had limited impact on the measurement of hedge ineffectiveness.
The Company performed a material roll-over campaign for a nominal amount of US$ 31 billion in the third quarter to re-align the hedging portfolio to the last available long term delivery plan, including roll-overs at historical rates for a nominal amount of US$ 8 billion in July 2020 as part of the liquidity measures. In this way, the Company mitigates the cash fl ow impacts occurring when the gains or losses on the forward hedges do not coincide with the currency gains or losses on the underlying commercial transactions (see “– Note 38: Financial Instruments”).
In the Company’s assessment the risk of aircraft rescheduling beyond the risk management and the risk of future cancellations, notably due to potential airlines default, have been included. The Company will continue to review this position going forward to identify any potential trigger for hedge disqualifi cation.
16 Airbus / Financial Statements 2020
2. Notes to the IFRS Consolidated Financial Statements /
2.1 Basis of Preparation
2
3. Signifi cant Accounting Policies
Basis of preparation — The Company’s Consolidated Financial Statements are prepared in accordance with International Financial Reporting Standards (“IFRS”), issued by the International Accounting Standards Board (“IASB”) as endorsed by the European Union (“EU”) and Part 9 of Book 2 of the Netherlands Civil Code. When reference is made to IFRS, this intends to be EU-IFRS.
The Consolidated Financial Statements have been prepared on a historical cost basis, unless otherwise indicated. They are prepared and reported in euro (“€”) and all values are rounded to the nearest million appropriately. Due to rounding, numbers presented may not add up precisely to the totals provided and percentages may not precisely refl ect the absolute fi gures.
The Company describes the accounting policies applied in each of the individual notes to the Financial Statements and avoids repeating the text of the standard, unless this is considered relevant to the understanding of the note’s content. The Company’s accounting policies and methods are unchanged compared to 31 December 2019. The implementation of other amended standards has no material impact on the Company’s Consolidated Financial Statements as of 31 December 2020. The most signifi cant accounting policies are described below, and have been updated accordingly.
Revenue recognition — Revenue is recognised when the Company transfers control of the promised goods or services to the customer. The Company measures revenue, for the consideration to which the Company is expected to be entitled in exchange for transferring promised goods or services. Variable considerations are included in the transaction price when it is highly probable that there will be no signifi cant reversal of the revenue in the future. The Company identifi es the various performance obligations of the contract and allocates the transaction price to these performance obligations. Advances and pre-delivery payments (contract liabilities) are received in the normal course of business and are not considered to be a signifi cant fi nancing component as they are intended to protect the Company from the customer failing to complete its contractual obligations.
Incurred inefficiency cost such as the unexpected cost of materials, labour hours expended or other resources consumed do not generate revenue as they do not contribute to the Company’s progress in satisfying the performance obligations.
Revenue from the sale of commercial aircraft is recognised at a point in time (i.e. at delivery of the aircraft). The Company estimates the amount of price concession granted by the Company’s engine suppliers to their customers as a reduction of both revenue and cost of sales.
An aircraft can remain in storage under a bill-and-hold arrangement. In such cases, revenue is recognised when the requirements for the transfer of control under a bill-and-hold arrangement are fulfi lled.
Revenue from the sale of military aircraft, space systems and services — When control of produced goods or rendered services is transferred over time to the customer, revenue is recognised over time, i.e. under the percentage of completion method (“PoC” method).
The Company transfers control over time when:
– it produces a good with no alternative use and the Company has an irrevocable right to payment (including a reasonable margin) for the work completed to date, in the event of contract termination at the convenience of customers (e.g. Tiger contract); or
– it creates a good which is controlled by the customer as the good is created or enhanced (e.g. Eurofi ghter contracts, some border security contracts, A400M development); or
– the customer simultaneously receives and consumes the benefi ts provided by the Company (e.g. maintenance contracts).
For the application of the over time method (PoC method), the measurement of progress towards complete satisfaction of a performance obligation is based on inputs (i.e. cost incurred).
When none of the criteria stated above have been met, revenue is recognised at a point in time. Revenue is recognised at the delivery of aircraft under IFRS 15 from the sale of military transport aircraft, from the A400M launch contract and most of NH90 serial helicopters’ contracts.
Provisions for onerous contracts — The Company records provisions for onerous contracts when it becomes probable that the total contract costs will exceed total contract revenue. Before a provision for onerous contracts is recorded, the related assets under construction are measured at their net realisable value and written-off if necessary. Onerous contracts are identifi ed by monitoring the progress of the contract together with the underlying programme status. An estimate of the related contract costs is made, which requires signifi cant and complex assumptions, judgements and estimates related to achieving certain performance standards (see “– Note 4: Key Estimates and Judgements”, “– Note 12: Revenue and Gross Margin” and “– Note 25: Provisions, Contingent Assets and Contingent Liabilities”).
2.8 Expected credit loss
The Company has also considered the impact of COVID-19 pandemic on the expected credit loss of its fi nancial instruments (mainly loans, trade and lease receivables). The amount and timing of the expected credit losses, as well as the probability assigned thereto, has been based on the available information at the end of 2020. As a result of this review no signifi cant credit losses have been recorded in 2020 (see “– Note 22: Other Investments and Other Long-Term Financial Assets”).
2.9 Pensions
The COVID-19 pandemic has a signifi cant impact on market fl uctuations (mainly impacting the interest rates and asset market values). The increase on the net pension liability for 2020 amounting to € 1.6 billion is recognised mainly in other comprehensive income and is subject to future volatility (see “– Note 25: Provisions, Contingent Assets and Contingent Liabilities”).
1717Airbus / Financial Statements 2020
2. Notes to the IFRS Consolidated Financial Statements /
2.1 Basis of Preparation
4. Key Estimates and Judgements
The preparation of the Company’s Consolidated Financial Statements requires the use of estimates and assumptions. In preparing these Financial Statements, management exercises its best judgement based upon its experience and the circumstances prevailing at that time. The estimates and assumptions are based on available information and conditions at the end of the fi nancial period presented and are reviewed on an ongoing basis. Key estimates and judgements that have a signifi cant influence on the amounts recognised in the Company’s Consolidated Financial Statements are mentioned below:
Impairment of long-life assets, work in progress and fi nished aircraft — In testing long-life assets such as jigs and tools and capitalised development costs for impairment, the Company makes estimates on the number and timing of aircraft units to be delivered in the future, the margin of these aircraft, and the discount rate associated with the aircraft programme. For aircraft that may need to be remarketed, the impairment of working progress and fi nished aircraft is assessed based on an estimation of the future selling price and associated remarketing costs.
Research and development expenses — The costs for internally generated research are expensed when incurred. The costs for internally generated development are capitalised when:
– the product or process is technically feasible and clearly defi ned (i.e. the critical design review is fi nalised);
– adequate resources are available to successfully complete the development;
– the benefi ts from the assets are demonstrated (a market exists or the internal usefulness is demonstrated) and the costs attributable to the projects are reliably measured;
– the Company intends to produce and market or use the developed product or process and can demonstrate its profi tability.
Income tax credits granted for research and development activities are deducted from corresponding expenses or from capitalised amounts when earned.
Capitalised development costs, are recognised either as intangible assets or when the related development activities lead to the construction of specialised tooling for production (“jigs and tools”), or involve the design, construction and testing of prototypes and models, as property, plant and equipment. Capitalised development costs are generally amortised over the estimated number of units produced. If the number of units produced cannot be estimated reliably, they are amortised over the estimated useful life of the internally generated intangible asset. Amortisation of capitalised development costs is recognised in cost of sales.
Inventories are measured at the lower of acquisition cost (generally the average cost) or manufacturing cost and net realisable value. Manufacturing costs comprise all costs that are directly attributable to the manufacturing process, such as direct material and labour, and production related overheads (based on normal operating capacity and normal consumption of material, labour and other production costs), including depreciation charges. Net realisable value is the estimated selling price in the ordinary course of the business less the estimated costs to complete the sale.
Transactions in foreign currency, i.e. transactions in currencies other than the functional currency of an entity of the Company, are translated into the functional currency at the foreign exchange rate prevailing at the transaction date. Monetary assets and liabilities denominated in foreign currencies at the end of the reporting period are remeasured into the functional currency at the exchange rate in effect at that date. Except when deferred in
equity as qualifying cash fl ow hedges (see “– Note 38: Financial Instruments”), these foreign exchange remeasurement gains and losses are recognised, in line with the underlying item:
– in profi t before fi nance costs and income taxes if the substance of the transaction is commercial (including sales fi nancing transactions); and
– in fi nance costs for fi nancial transactions.
Non-monetary assets and liabilities denominated in foreign currencies that are stated at historical cost are translated into functional currency at the foreign exchange rate in effect at the date of the transaction. Translation differences on non-monetary fi nancial assets and liabilities that are measured at fair value are reported as part of the fair value gain or loss. However, translation differences of non-monetary fi nancial assets measured at fair value and classifi ed as fair value through other comprehensive income (“OCI”) are included in accumulated other comprehensive income (“AOCI”).
Hedge accounting — Most of the Company’s revenue is denominated in US dollar (“US$”), while a major portion of its costs are incurred in euro. The Company is signifi cantly exposed to the risk of currency changes, mainly resulting from US$/€ exchange rates. Furthermore, the Company is exposed, though to a much lesser extent, to foreign exchange risk arising from costs incurred in currencies other than the euro and to other market risks such as interest rate risk, commodity price and equity price risk.
In order to manage and mitigate those risks, the Company enters into derivative contracts. The Company applies hedge accounting to its derivative contracts whenever the relevant IFRS criteria can be met. Hedge accounting ensures that derivative gains or losses are recognised in profi t or loss (mainly in revenue) in the same period that the hedged items or transactions affect profi t or loss.
The major portion of the Company’s derivative contracts is accounted for under the cash fl ow hedge model. The fair value hedge model is used only for certain interest rate derivatives. Derivative contracts which do not qualify for hedge accounting are accounted for at fair value through profi t and loss; any related gains or losses being recognised in fi nancial result.
The Company’s hedging strategies and hedge accounting policies are described in more detail in “– Note 38: Financial Instruments”.
18 Airbus / Financial Statements 2020
2. Notes to the IFRS Consolidated Financial Statements /
2.1 Basis of Preparation
2
Revenue recognition for performance obligations transferred over time — The PoC method is used to recognise revenue for performance obligations transferred over time. This method places considerable importance on accurate estimates at completion as well as on the extent of progress towards completion. For the determination of the progress of the performance obligations, signifi cant estimates include total contract costs, remaining costs to completion, total contract revenue, contract risks and other judgements. The management of the operating division s continually review all estimates involved in such performance obligations and adjusts them as necessary (see “– Note 23: Contract Assets and Contract Liabilities, Trade Receivables and Trade Liabilities”).
Provisions — The evaluation of provisions, such as onerous contracts and restructuring measures are based on best available estimates. Onerous contracts are identified by monitoring the progress of the contract and the underlying programme performance. The associated estimates of the relevant contract costs require signifi cant judgement related to performance achievements. Depending on the size and nature of the Company’s contracts and related programmes, the extent of assumptions, judgements and estimates in these monitoring processes differs. In particular, the introduction of commercial or military aircraft programmes (e.g. A400M) or major derivative aircraft programmes involves an increased level of estimates and judgements associated with the expected development, production and certification schedules and expected cost components (see “– Note 25: Provisions, Contingent Assets and Contingent Liabilities”).
In view of overall commercial relationships, contract adjustments may occur, and must be considered on a case by case basis.
Estimates and judgements are subject to change based on new information as contracts and related programmes progress. Furthermore, the complex design and manufacturing processes of the Company’s industry require challenging integration and coordination along the supply chain including an ongoing assessment of suppliers’ assertions which may additionally impact the outcome of these monitoring processes.
A restructuring provision is recognised when the Company has developed a detailed formal plan for the restructuring and has raised a valid expectation in those affected that it will carry out the restructuring by starting to implement the plan or announcing its main features to those affected by it. The measurement of a restructuring provision is at the best estimate of the anticipated costs and includes only the direct expenditures arising from the restructuring, which are those amounts that are both necessarily entailed by the restructuring and not associated with the ongoing activities of the Company.
Hedge accounting — The hedge portfolio covers a large portion of the Company’s highly probable forecasted transactions derived from its commercial activities. The Company makes estimates and judgement in assessing the highly probable criteria of the forecasted transactions, in order to anticipate future events, as risk of future cancellations of orders (see “– Note 38: Financial Instruments”).
Employee benefi ts — The Company accounts for pension and other post-retirement benefi ts in accordance with actuarial valuations. These valuations rely on statistical and other factors in
order to anticipate future events. The actuarial assumptions may differ materially from actual developments due to changing market and economic conditions and therefore result in a signifi cant change in post-retirement employee benefi t obligations and the related future expenses (see “– Note 32: Post-Employment Benefi ts”).
Legal contingencies — Airbus companies are parties to litigations related to a number of matters as described in “– Note 39: Litigation and Claims”. The outcome of these matters may have a material effect on the fi nancial position, results of operations or cash fl ows of the Company. Management regularly analyses current information concerning these matters and provides provisions for probable cash outfl ows, including the estimate of legal expenses to resolve the matters. Internal and external lawyers are used for these assessments. In making the decision regarding the need for provisions, management considers the degree of probability of an unfavourable outcome and the ability to make a suffi ciently reliable estimate of the amount of loss. The fi ling of a suit or formal assertion of a claim against the Airbus companies or the disclosure of any such suit or assertion, does not automatically indicate that a provision may be appropriate.
Income taxes — The Company operates and earns income in numerous countries and is subject to changing tax laws in multiple jurisdictions within these countries. Signifi cant judgements are necessary in determining the worldwide income tax liabilities. Although management believes that it has made reasonable estimates about the fi nal outcome of tax uncertainties, no assurance can be given that the fi nal tax outcome of these matters will be consistent with what is refl ected in the historical income tax provisions. At each end of the reporting period, the Company assesses whether the realisation of future tax benefi ts is probable to recognise deferred tax assets. This assessment requires the exercise of judgement on the part of management with respect to, among other things, benefi ts that could be realised from available tax strategies and future taxable income, as well as other positive and negative factors.
The recorded amount of total deferred tax assets could be reduced, through valuation allowances recognition, if estimates of projected future taxable income and benefi ts from available tax strategies are lowered, or if changes in current tax regulations are enacted that impose restrictions on the timing or extent of the Company’s ability to utilise future tax benefi ts. The basis for the recoverability test of deferred tax assets is the same as the Company’s latest operative planning also taking into account certain qualitative aspects regarding the nature of the temporary differences. Qualitative factors include but are not limited to an entity’s history of planning accuracy, performance records, business model, backlog, existence of long-term contracts as well as the nature of temporary differences (see “– Note 18: Income Taxes”).
Other subjects that involve assumptions and estimates are further described in the respective notes (see “– Note 8: Acquisitions and Disposals”, “– Note 20: Intangible Assets” and “– Note 23: Contract Assets, Contract Liabilities and Trade Receivables, and Trade Liabilities”).
1919Airbus / Financial Statements 2020
2. Notes to the IFRS Consolidated Financial Statements /
2.1 Basis of Preparation
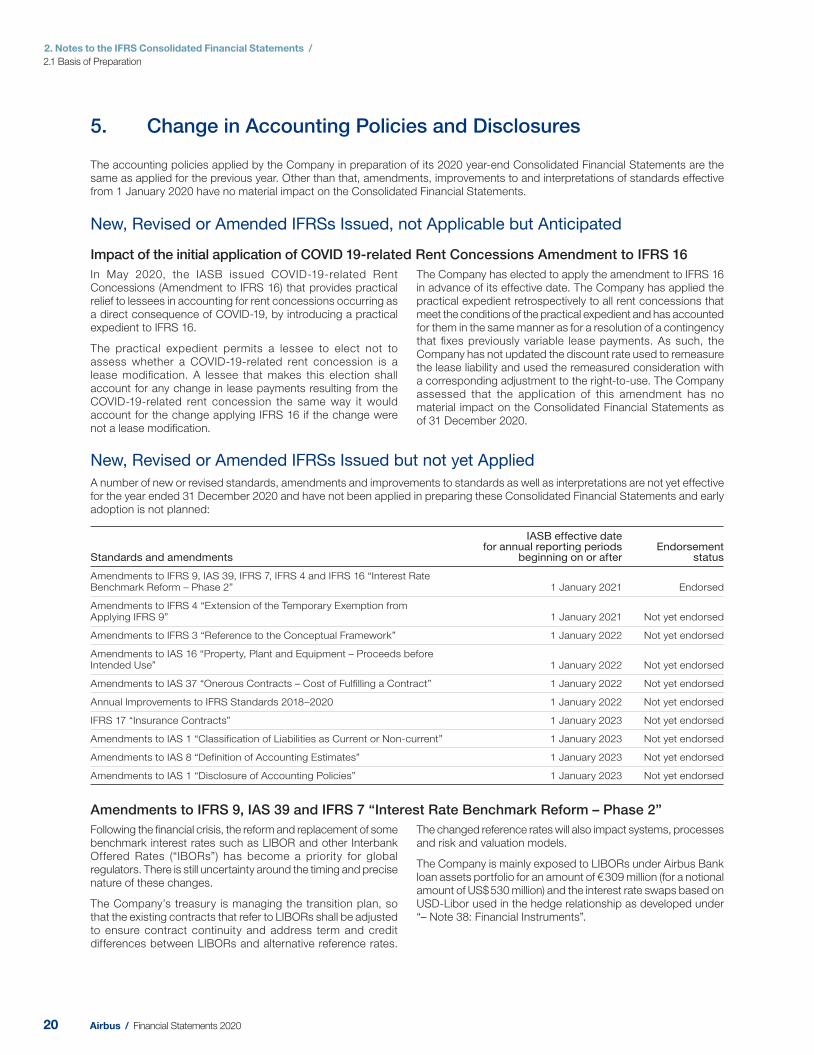
New, Revised or Amended IFRSs Issued but not yet Applied
A number of new or revised standards, amendments and improvements to standards as well as interpretations are not yet effective for the year ended 31 December 2020 and have not been applied in preparing these Consolidated Financial Statements and early adoption is not planned:
Standards and amendments
IASB effective date for annual reporting periods
beginning on or afterEndorsement
status
Amendments to IFRS 9, IAS 39, IFRS 7, IFRS 4 and IFRS 16 “Interest Rate Benchmark Reform – Phase 2” 1 January 2021 Endorsed
Amendments to IFRS 4 “Extension of the Temporary Exemption from Applying IFRS 9” 1 January 2021 Not yet endorsed
Amendments to IFRS 3 “Reference to the Conceptual Framework” 1 January 2022 Not yet endorsed
Amendments to IAS 16 “Property, Plant and Equipment – Proceeds before Intended Use” 1 January 2022 Not yet endorsed
Amendments to IAS 37 “Onerous Contracts – Cost of Fulfilling a Contract” 1 January 2022 Not yet endorsed
Annual Improvements to IFRS Standards 2018–2020 1 January 2022 Not yet endorsed
IFRS 17 “Insurance Contracts” 1 January 2023 Not yet endorsed
Amendments to IAS 1 “Classification of Liabilities as Current or Non-current” 1 January 2023 Not yet endorsed
Amendments to IAS 8 “Definition of Accounting Estimates” 1 January 2023 Not yet endorsed
Amendments to IAS 1 “Disclosure of Accounting Policies” 1 January 2023 Not yet endorsed
5. C hange in Accounting Policies and Disclosures
The accounting policies applied by the Company in preparation of its 2020 year-end Consolidated Financial Statements are the same as applied for the previous year. Other than that, amendments, improvements to and interpretations of standards effective from 1 Jan uary 2020 have no material impact on the Consolidated Financial Statements.
New, Revised or Amended IFRSs Issued, not Applicable but Anticipated
Impact of the initial application of COVID 19-related Rent Concessions Amendment to IFRS 16
In May 2020, the IASB issued COVID-19-related Rent Concessions (Amendment to IFRS 16) that provides practical relief to lessees in accounting for rent concessions occurring as a direct consequence of COVID-19, by introducing a practical expedient to IFRS 16.
The practical expedient permits a lessee to elect not to assess whether a COVID-19-related rent concession is a lease modifi cation. A lessee that makes this election shall account for any change in lease payments resulting from the COVID-19-related rent concession the same way it would account for the change applying IFRS 16 if the change were not a lease modifi cation.
The Company has elected to apply the amendment to IFRS 16 in advance of its effective date. The Company has applied the practical expedient retrospectively to all rent concessions that meet the conditions of the practical expedient and has accounted for them in the same manner as for a resolution of a contingency that fi xes previously variable lease payments. As such, the Company has not updated the discount rate used to remeasure the lease liability and used the remeasured consideration with a corresponding adjustment to the right-to-use. The Company assessed that the application of this amendment has no material impact on the Consolidated Financial Statements as of 31 December 2020.
Amendments to IFRS 9, IAS 39 and IFRS 7 “Interest Rate Benchmark Reform – Phase 2”
Following the fi nancial crisis, the reform and replacement of some benchmark interest rates such as LIBOR and other Interbank Offered Rates (“IBORs”) has become a priority for global regulators. There is still uncertainty around the timing and precise nature of these changes.
The Company’s treasury is managing the transition plan, so that the existing contracts that refer to LIBORs shall be adjusted to ensure contract continuity and address term and credit differences between LIBORs and alternative reference rates.
The changed reference rates will also impact systems, processes and risk and valuation models.
The Company is mainly exposed to LIBORs under Airbus Bank loan assets portfolio for an amount of € 309 million (for a notional amount of US$ 530 million) and the interest rate swaps based on USD-Libor used in the hedge relationship as developed under “– Note 38: Financial Instruments”.
20 Airbus / Financial Statements 2020
2. Notes to the IFRS Consolidated Financial Statements /
2.2 Airbus Structure
2
6. Brexit
On 29 March 2017, the UK triggered Article 50 of the Lisbon Treaty, the mechanism to leave the European Union (“Brexit”). In June 2018, the Company published its Brexit Risk Assessment outlining its expectations regarding the material consequences and risks for the Company arising from the UK leaving the European Union without a deal. In September 2018, the Company launched a project to mitigate the risks and anticipate possible consequences associated with Brexit and its impact on the Company’s business and production activities. Signifi cant progress was made in mitigating the identifi ed risks through for example the modifi cation of the Company’s customs and IT systems, and the stockpiling of parts associated with transportation and logistics.
The UK left the European Union in an orderly manner on 31 January 2020 under the terms of the Withdrawal Agreement, opening a transition period until 31 December 2020.
On 30 December 2020, the UK Parliament ratifi ed the EU-UK Trade and Cooperation Agreement (“TCA”) but it still awaits ratifi cation by the European Parliament and the Council of the European Union before fi nal conclusion and entry into force.
The TCA is expected to prevent the disruption a no-deal scenario would have created. Preliminary analysis confi rms that although Brexit will result in a requirement for increased areas of vigilance, additional administrative work and reduced industrial fl exibility, the continuity of the Company’s business operations and supply chain in particular are not materially threatened.
2.2 Airbus Structure
7. Sco pe of Consolidation
Consolidation — The Company’s Consolidated Financial Statements include the Financial Statements of Airbus SE and all material subsidiaries controlled by the Company. The Company’s subsidiaries prepare their Financial Statements at the same reporting date as the Company’s Consolidated Financial Statements (see Appendix “Simplifi ed Airbus Structure” chart).
Subsidiaries are entities controlled by the Company including so-called structured entities, which are created to accomplish a narrow and well-defi ned objective. They are fully consolidated from the date control commences to the date control ceases.
The assessment of control of a structured entity is performed in three steps. In a fi rst step, the Company identifi es the relevant activities of the structured entities (which may include managing lease receivables, managing the sale or re-lease at the end of
the lease and managing the sale or re-lease on default) and in a second step, the Company assesses which activity is expected to have the most signifi cant impact on the structured entities’ return. Finally, the Company determines which party or parties control this activity.
The Company’s interests in equity-accounted investees comprise investments in associates and joint ventures. Such investments are accounted for under the equity method and are initially recognised at cost.
The Financial Statements of the Company’s investments in associates and joint ventures are generally prepared for the same reporting period as for the parent company. Adjustments are made where necessary to bring the accounting policies and accounting periods in line with those of the Company.
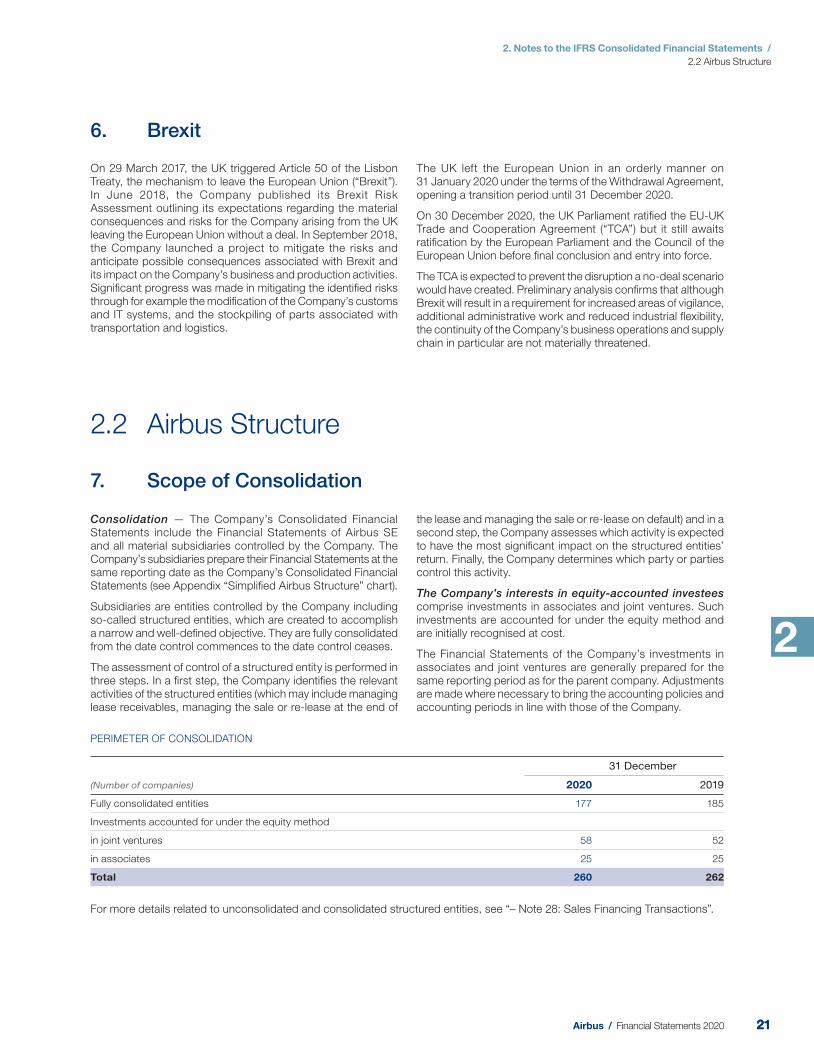
PERIMETER OF CONSOLIDATION
(Number of companies)
31 December
2020 2019
Fully consolidated entities 177 185
Investments accounted for under the equity method
in joint ventures 58 52
in associates 25 25
Total 260 262
For more details related to unconsolidated and consolidated structured entities, see “– Note 28: Sales Financing Transactions”.
2121Airbus / Financial Statements 2020
2. Notes to the IFRS Consolidated Financial Statements /
2.2 Airbus Structure
8. Acquisitions and Disposals
8.1 Acquisitions
Business combinations are accounted for using the acquisition method, as at the acquisition date, which is the date on which control is transferred to the Company.
The determination of the fair value of the acquired assets and the assumed liabilities which are the basis for the measurement of goodwill requires signifi cant estimates. Land, buildings and equipment are usually independently appraised while marketable securities are valued at market prices. If intangible assets are identifi ed, depending on the type of intangible asset and the complexity of determining its fair value, the Company either consults with an independent external valuation expert or develops the fair value internally, using appropriate valuation techniques which are generally based on a forecast of the total expected future net cash fl ows.
These evaluations are linked closely to the assumptions made by management regarding the future performance of the assets concerned and the discount rate applied.
Loss of control, loss of joint control, loss of signifi cant infl uence — Upon loss of control of a subsidiary, the assets and liabilities and any components of the Company’s equity
related to the subsidiary are derecognised. Any gain or loss arising from the loss of control is recognised within other income or other expenses in the Consolidated Income Statement. If the Company retains any interest in the previous subsidiary, such interest is measured at fair value at the date the control is lost.
Assets and liabilities of a material subsidiary for which a loss of control is highly probable are classifi ed as assets and liabilities held for sale when the Company has received suffi cient evidence that the loss of control will occur in the 12 months after the classifi cation. These assets and liabilities are presented after elimination of intercompany transactions.
When the loss of signifi cant infl uence or the loss of joint control of an investment accounted under for the equity method is highly probable and is expected to occur in the coming 12 months, this associate or joint venture is classifi ed as an asset held for sale.
Sale of investment in an associate or joint venture — Any gain or loss arising from the disposal of investment accounted for under the equity method is recognised within share of profi t from investments.
On 12 February 2020, Bombardier transferred its remaining shares in Airbus Canada Limited Partnership (“ACLP”) to Airbus and Investissement Québec (“IQ”). As per the agreement, Airbus acquired an additional 29.64% of the issued shares in ACLP. This agreement brings the shareholdings in ACLP for Airbus and IQ to 75% and 25%, respectively.
Airbus paid to Bombardier a consideration of US$ 591 million of which US$ 531 million was received at closing and US$ 60 million to be paid over the 2020-22 period under certain conditions. The agreement also provides for the cancellation of Bombardier warrants owned by Airbus, as well as releasing Bombardier of its future funding capital requirement to ACLP, previously performed through the non-voting participation Class B common units in ACLP.
The call rights of Airbus in respect of all IQ’s interests in ACLP at fair market value have been extended by an additional three years to January 2026.
The effect of this equity transaction on the equity attributable to the owners of ACLP amounts to € -53 million.
As part of this transaction, Airbus, via its wholly owned subsidiary Stelia Aerospace, has also acquired the A220 and A330 work package production capabilities from Bombardier in Saint Laurent, Québec. Under this non-material transaction, the fair value of the net assets acquired amount to US$ -4 million.
8.2 Disposals
On 23 December 2019, the Company fi nalised the sale of PFW Aerospace GmbH to Hutchinson Holding GmbH. Since 2011, Airbus held 74.9% in PFW Aerospace GmbH, a key supplier in the aerospace industry, while Safeguard held the remaining 25.1%. Airbus received a consideration of € 103 million and recognised a gain of € 57 million, reported in other income. Assets and liabilities of the disposed company were previously classifi ed as held for sale.
On 30 July 2019, the Company sold its shares in Alestis Aerospace S.L. to Aciturri Aeronáutica S.L., a company headquartered in Miranda de Ebro, Spain. The Company recognised a gain for an amount of € 45 million in Airbus. Assets and liabilities of the disposed company were previously classifi ed as held for sale.
22 Airbus / Financial Statements 2020
2. Notes to the IFRS Consolidated Financial Statements /
2.2 Airbus Structure
2
The Company’s individually material joint ventures are ArianeGroup, Paris (France), MBDA S.A.S., Paris (France), and ATR GIE, Blagnac (France), as parent companies of their respective groups. These joint venture companies are not publicly listed.
ArianeGroup is a 50% joint venture between the Company and Safran. ArianeGroup is the head company in a group comprising several subsidiaries and affiliates, all leading companies in their fi elds, such as: APP, Arianespace, Cilas, Eurockot, Eurocryospace, Europropulsion, Nuclétudes, Pyroalliance,
Regulus, Sodern and Starsem. ArianeGroup inherits a rich portfolio of products and services, enabling it to deliver innovative and competitive solutions to numerous customers around the world.
The Company holds a 37.5% stake in MBDA at 3 1 December 2020, which is a joint venture between the Company, BAE Systems and Leonardo. MBDA offers missile systems capabilities that cover the whole range of solutions for air dominance, ground-based air defence and maritime superiority, as well as advanced technological solutions for battlefi eld engagement.
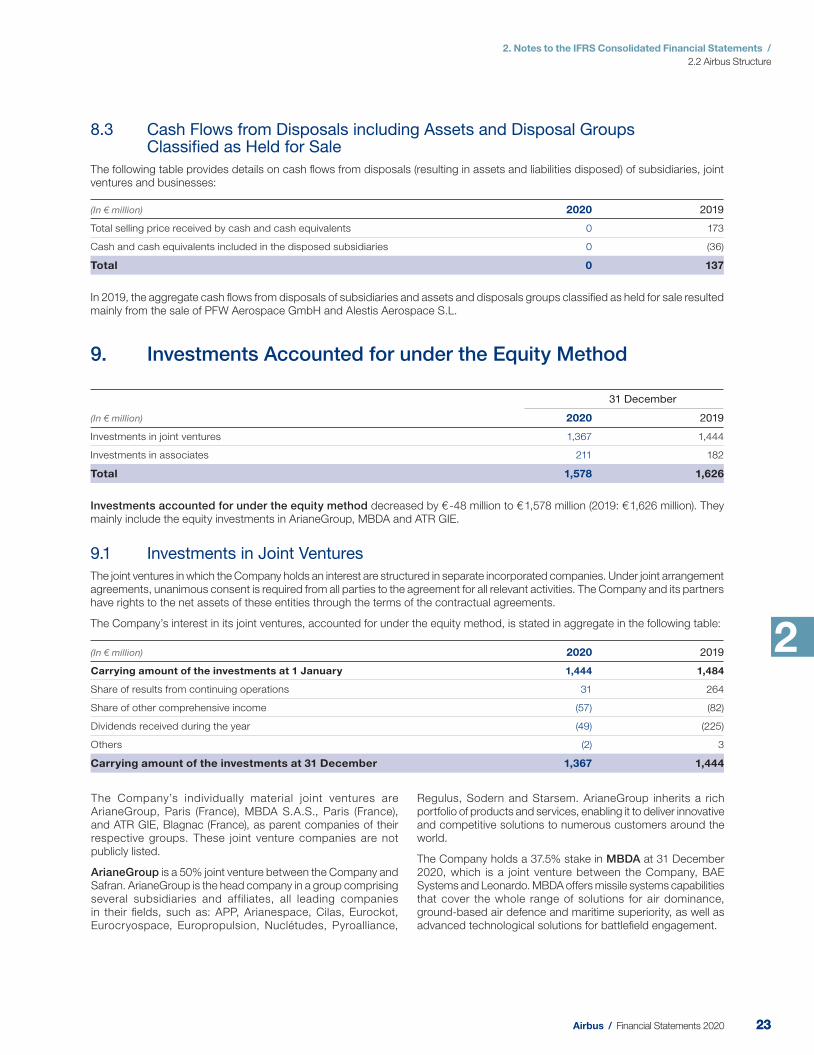
8.3 Cash Flows from Disposals including Assets and Disposal Groups Classifi ed as Held for Sale
The following table provides details on cash fl ows from disposals (resulting in assets and liabilities disposed) of subsidiaries, joint ventures and businesses:
(In € million) 2020 2019
Total selling price received by cash and cash equivalents 0 173
Cash and cash equivalents included in the disposed subsidiaries 0 (36)
Total 0 137
In 2019, the aggregate cash fl ows from disposals of subsidiaries and assets and disposals groups classifi ed as held for sale resulted mainly from the sale of PFW Aerospace GmbH and Alestis Aerospace S.L.
9. Investments Accounted for under the Equity Method
(In € million)
31 December
2020 2019
Investments in joint ventures 1,367 1,444
Investments in associates 211 182
Total 1,578 1,626
Investments accounted for under the equity method decreased by € -48 million to € 1,578 million (2019: € 1,626 million). They mainly include the equity investments in ArianeGroup, MBDA and ATR GIE.
9.1 Investments in Joint Ventures
The joint ventures in which the Company holds an interest are structured in separate incorporated companies. Under joint arrangement agreements, unanimous consent is required from all parties to the agreement for all relevant activities. The Company and its partners have rights to the net assets of these entities through the terms of the contractual agreements.
The Company’s interest in its joint ventures, accounted for under the equity method, is stated in aggregate in the following table:
(In € million) 2020 2019
Carrying amount of the investments at 1 January 1,444 1,484
Share of results from continuing operations 31 264
Share of other comprehensive income (57) (82)
Dividends received during the year (49) (225)
Others (2) 3
Carrying amount of the investments at 31 December 1,367 1,444
2323Airbus / Financial Statements 2020
2. Notes to the IFRS Consolidated Financial Statements /
2.2 Airbus Structure
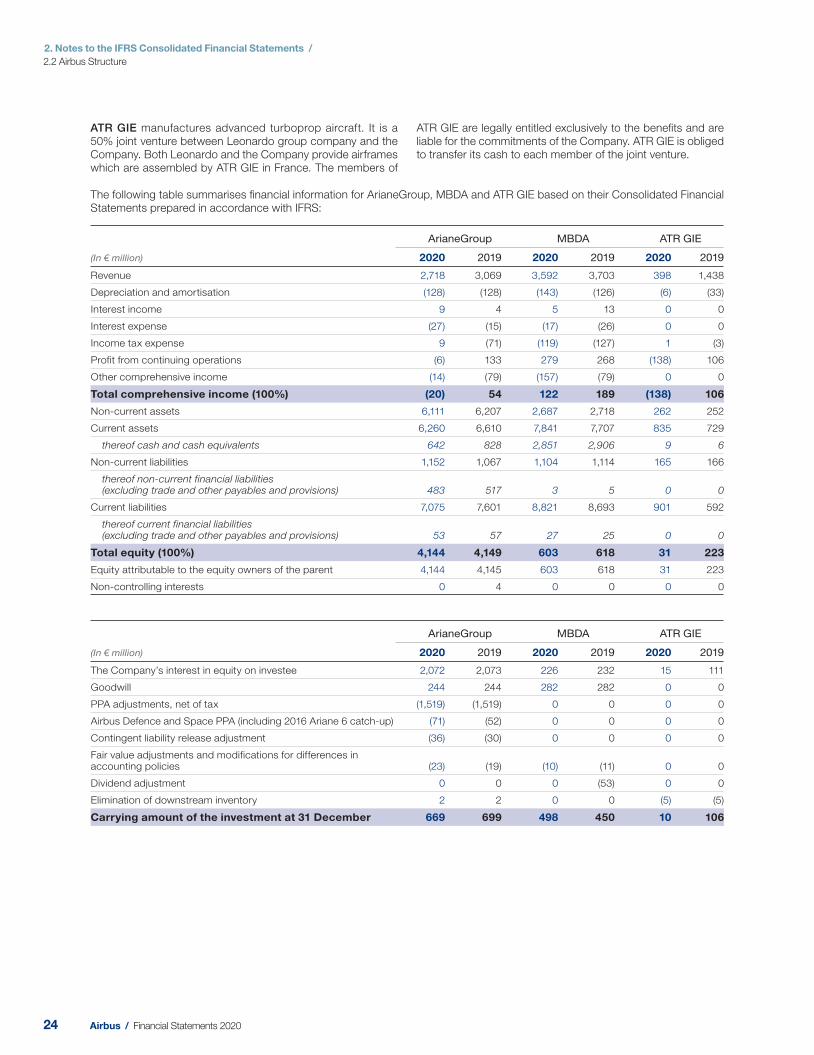
The following table summarises fi nancial information for ArianeGroup, MBDA and ATR GIE based on their Consolidated Financial Statements prepared in accordance with IFRS:
(In € million)
ArianeGroup MBDA ATR GIE
2020 2019 2020 2019 2020 2019
Revenue 2,718 3,069 3,592 3,703 398 1,438
Depreciation and amortisation (128) (128) (143) (126) (6) (33)
Interest income 9 4 5 13 0 0
Interest expense (27) (15) (17) (26) 0 0
Income tax expense 9 (71) (119) (127) 1 (3)
Profit from continuing operations (6) 133 279 268 (138) 106
Other comprehensive income (14) (79) (157) (79) 0 0
Total comprehensive income (100%) (20) 54 122 189 (138) 106
Non-current assets 6,111 6,207 2,687 2,718 262 252
Current assets 6,260 6,610 7,841 7,707 835 729
thereof cash and cash equivalents 642 828 2,851 2,906 9 6
Non-current liabilities 1,152 1,067 1,104 1,114 165 166
thereof non-current financial liabilities (excluding trade and other payables and provisions) 483 517 3 5 0 0
Current liabilities 7,075 7,601 8,821 8,693 901 592
thereof current financial liabilities (excluding trade and other payables and provisions) 53 57 27 25 0 0
Total equity (100%) 4,144 4,149 603 618 31 223
Equity attributable to the equity owners of the parent 4,144 4,145 603 618 31 223
Non-controlling interests 0 4 0 0 0 0
(In € million)
ArianeGroup MBDA ATR GIE
2020 2019 2020 2019 2020 2019
The Company’s interest in equity on investee 2,072 2,073 226 232 15 111
Goodwill 244 244 282 282 0 0
PPA adjustments, net of tax (1,519) (1,519) 0 0 0 0
Airbus Defence and Space PPA (including 2016 Ariane 6 catch-up) (71) (52) 0 0 0 0
Contingent liability release adjustment (36) (30) 0 0 0 0
Fair value adjustments and modifications for differences in accounting policies (23) (19) (10) (11) 0 0
Dividend adjustment 0 0 0 (53) 0 0
Elimination of downstream inventory 2 2 0 0 (5) (5)
Carrying amount of the investment at 31 December 669 699 498 450 10 106
ATR GIE manufactures advanced turboprop aircraft. It is a 50% joint venture between Leonardo group company and the Company. Both Leonardo and the Company provide airframes which are assembled by ATR GIE in France. The members of
ATR GIE are legally entitled exclusively to the benefi ts and are liable for the commitments of the Company. ATR GIE is obliged to transfer its cash to each member of the joint venture.
24 Airbus / Financial Statements 2020
2. Notes to the IFRS Consolidated Financial Statements /
2.2 Airbus Structure
2
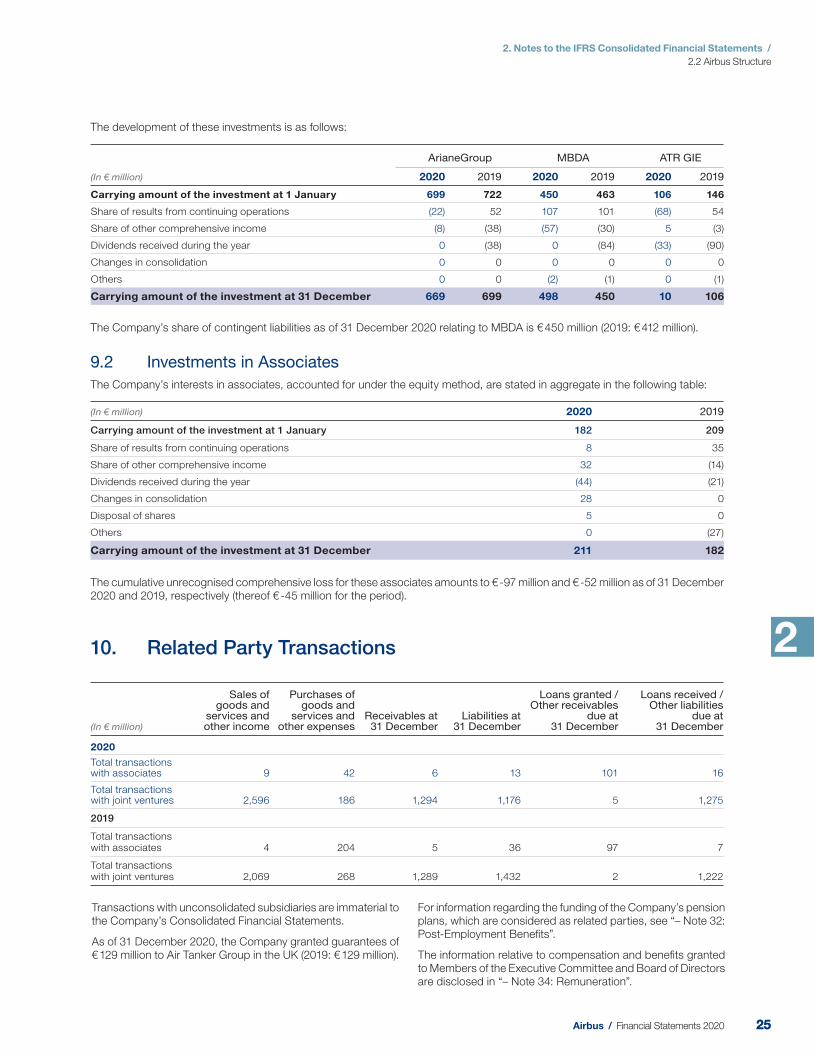
The development of these investments is as follows:
(In € million)
ArianeGroup MBDA ATR GIE
2020 2019 2020 2019 2020 2019
Carrying amount of the investment at 1 January 699 722 450 463 106 146
Share of results from continuing operations (22) 52 107 101 (68) 54
Share of other comprehensive income (8) (38) (57) (30) 5 (3)
Dividends received during the year 0 (38) 0 (84) (33) (90)
Changes in consolidation 0 0 0 0 0 0
Others 0 0 (2) (1) 0 (1)
Carrying amount of the investment at 31 December 669 699 498 450 10 106
The Company’s share of contingent liabilities as of 31 December 2020 relating to MBDA is € 450 million (20 19: € 412 million).
9.2 Investments in Associates
The Company’s interests in associates, accounted for under the equity method, are stated in aggregate in the following table:
(In € million) 2020 2019
Carrying amount of the investment at 1 January 182 209
Share of results from continuing operations 8 35
Share of other comprehensive income 32 (14)
Dividends received during the year (44) (21)
Changes in consolidation 28 0
Disposal of shares 5 0
Others 0 (27)
Carrying amount of the investment at 31 December 211 182
The cumulative unrecognised comprehensive loss for these associates amounts to € -97 million and € -52 million as of 31 D ecember 2020 and 2019 , respectively (thereof € -45 million for the period).
10. Re lated Party Transactions
(In € million)
Sales of goods and
services and other income
Purchases of goods and
services and other expenses
Receivables at 31 December
Liabilities at 31 December
Loans granted / Other receivables
due at 31 December
Loans received / Other liabilities
due at 31 December
2020
Total transactions with associates 9 42 6 13 101 16
Total transactions with joint ventures 2,596 186 1,294 1,176 5 1,275
2019
Total transactions with associates 4 204 5 36 97 7
Total transactions with joint ventures 2,069 268 1,289 1,432 2 1,222
Transactions with unconsolidated subsidiaries are immaterial to the Company’s Consolidated Financial Statements.
As of 3 1 December 2020, the Company granted guarantees of € 129 million to Air Tanker Group in the UK (201 9: € 129 million).
For information regarding the funding of the Company’s pension plans, which are considered as related parties, see “– Note 32: Post-Employment Benefi ts”.
The information relative to compensation and benefi ts granted to Members of the Executive Committee and Board of Directors are disclosed in “– Note 34: Remuneration”.
2525Airbus / Financial Statements 2020
2. Notes to the IFRS Consolidated Financial Statements /
2.3 Segment Information
2.3 S egment Information
The Company operates in three reportable segments which refl ect the internal organisational and management structure according to the nature of the products and services provided.
– Airbus — Development, manufacturing, marketing and sale of commercial jet aircraft of more than 100 seats, aircraft conversion and related services; development, manufacturing, marketing and sale of regional turboprop aircraft and aircraft components. It also includes the holding function of the Company and its bank activities.
– Airbus Helicopters — Development, manufacturing, marketing and sale of civil and military helicopters; provision of helicopter related services.
– Airbus Defence and Space — Military Aircraft design, development, delivery, and support of military aircraft such as combat, mission, transport and tanker aircraft and their associated services. Space Systems design, development, delivery, and support of full range of civil and defence space systems for telecommunications, earth observations, navigation, science and orbital systems. Connected Intelligence provision of services around data processing from platforms, secure communication and cyber security. In addition, the main joint ventures design, develop, deliver, and support missile systems as well as space launcher systems. Unmanned Aerial Systems design, development, delivery and service support.
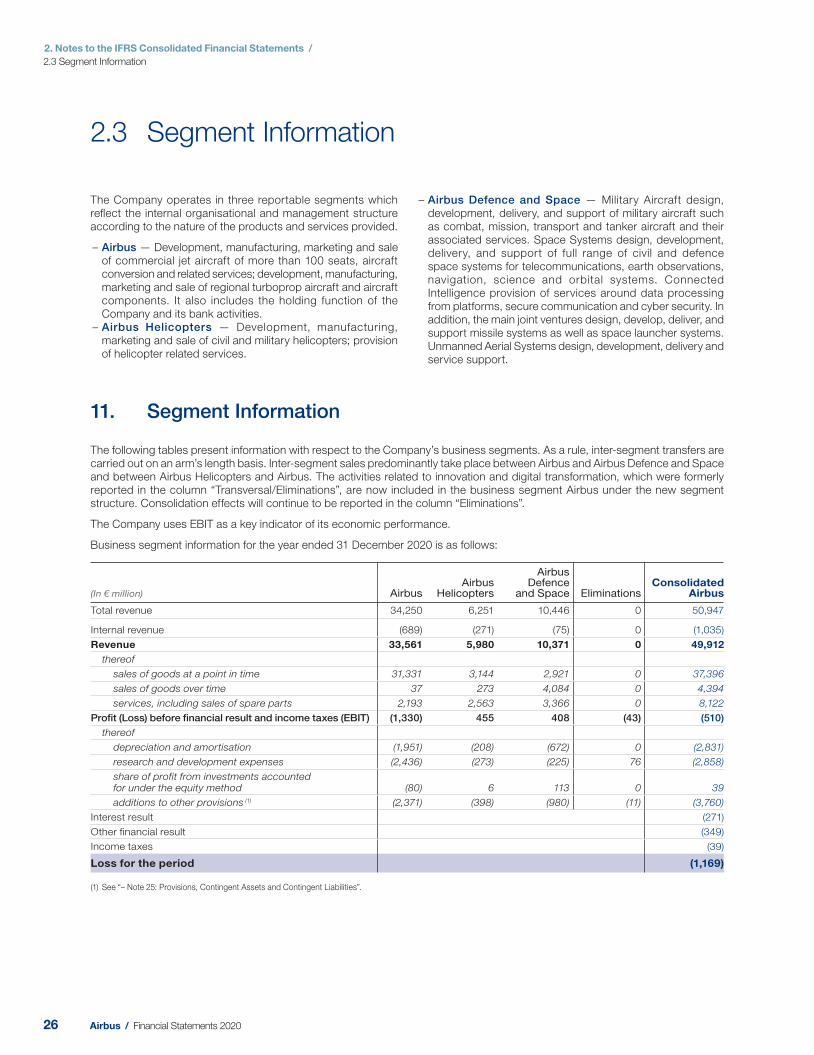
11. Segment Information
The following tables present information with respect to the Company’s business segments. As a rule, inter-segment transfers are carried out on an arm’s length basis. Inter-segment sales predominantly take place between Airbus and Airbus Defence and Space and between Airbus Helicopters and Airbus. The activities related to innovation and digital transformation, which were formerly reported in the column “Transversal/Eliminations”, are now included in the business segment Airbus under the new segment structure. Consolidation effects will continue to be reported in the column “Eliminations”.
The Company uses EBIT as a key indicator of its economic performance.
Business segment information for the year ended 31 De cember 2020 is as follows:
(In € million) AirbusAirbus
Helicopters
Airbus Defence
and Space Eliminations Consolidated
Airbus
Total revenue 34,250 6,251 10,446 0 50,947
Internal revenue (689) (271) (75) 0 (1,035)
Revenue 33,561 5,980 10,371 0 49,912
thereof
sales of goods at a point in time 31,331 3,144 2,921 0 37,396
sales of goods over time 37 273 4,084 0 4,394
services, including sales of spare parts 2,193 2,563 3,366 0 8,122
Profit (Loss) before financial result and income taxes (EBIT) (1,330) 455 408 (43) (510)
thereof
depreciation and amortisation (1,951) (208) (672) 0 (2,831)
research and development expenses (2,436) (273) (225) 76 (2,858)
share of profit from investments accounted for under the equity method (80) 6 113 0 39
additions to other provisions (1) (2,371) (398) (980) (11) (3,760)
Interest result (271)
Other financial result (349)
Income taxes (39)
Loss for the period (1,169)
(1) See “– Note 25: Provisions, Contingent Assets and Contingent Liabilities”.
26 Airbus / Financial Statements 2020
2. Notes to the IFRS Consolidated Financial Statements /
2.3 Segment Information
2
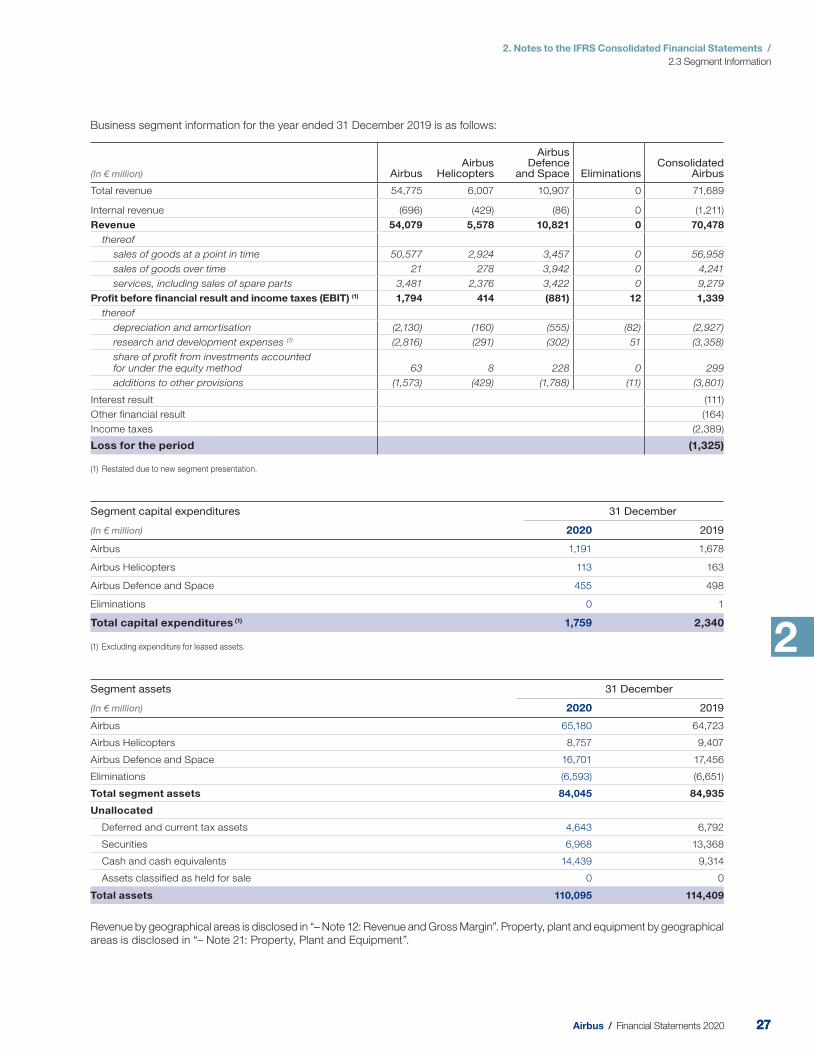
Business segment information for the year ended 31 December 2019 is as follows:
(In € million) Airbus Airbus
Helicopters
Airbus Defence
and Space Eliminations Consolidated
Airbus
Total revenue 54,775 6,007 10,907 0 71,689
Internal revenue (696) (429) (86) 0 (1,211)
Revenue 54,079 5,578 10,821 0 70,478
thereof
sales of goods at a point in time 50,577 2,924 3,457 0 56,958
sales of goods over time 21 278 3,942 0 4,241
services, including sales of spare parts 3,481 2,376 3,422 0 9,279
Profit before financial result and income taxes (EBIT) (1) 1,794 414 (881) 12 1,339
thereof
depreciation and amortisation (2,130) (160) (555) (82) (2,927)
research and development expenses (1) (2,816) (291) (302) 51 (3,358)
share of profit from investments accounted for under the equity method 63 8 228 0 299
additions to other provisions (1,573) (429) (1,788) (11) (3,801)
Interest result (111)
Other financial result (164)
Income taxes (2,389)
Loss for the period (1,325)
(1) Restated due to new segment presentation.
Segment capital expenditures 31 December
(In € million) 2020 2019
Airbus 1,191 1,678
Airbus Helicopters 113 163
Airbus Defence and Space 455 498
Eliminations 0 1
Total capital expenditures (1) 1,759 2,340
(1) Excluding expenditure for leased assets.
Segment assets 31 December
(In € million) 2020 2019
Airbus 65,180 64,723
Airbus Helicopters 8,757 9,407
Airbus Defence and Space 16,701 17,456
Eliminations (6,593) (6,651)
Total segment assets 84,045 84,935
Unallocated
Deferred and current tax assets 4,643 6,792
Securities 6,968 13,368
Cash and cash equivalents 14,439 9,314
Assets classified as held for sale 0 0
Total assets 110,095 114,409
Revenue by geographical areas is disclosed in “– Note 12: Revenue and Gross Margin”. Property, plant and equipment by geographical areas is disclosed in “– Note 21: Property, Plant and Equipment”.
2727Airbus / Financial Statements 2020
2. Notes to the IFRS Consolidated Financial Statements /
2.4 Airbus Performance
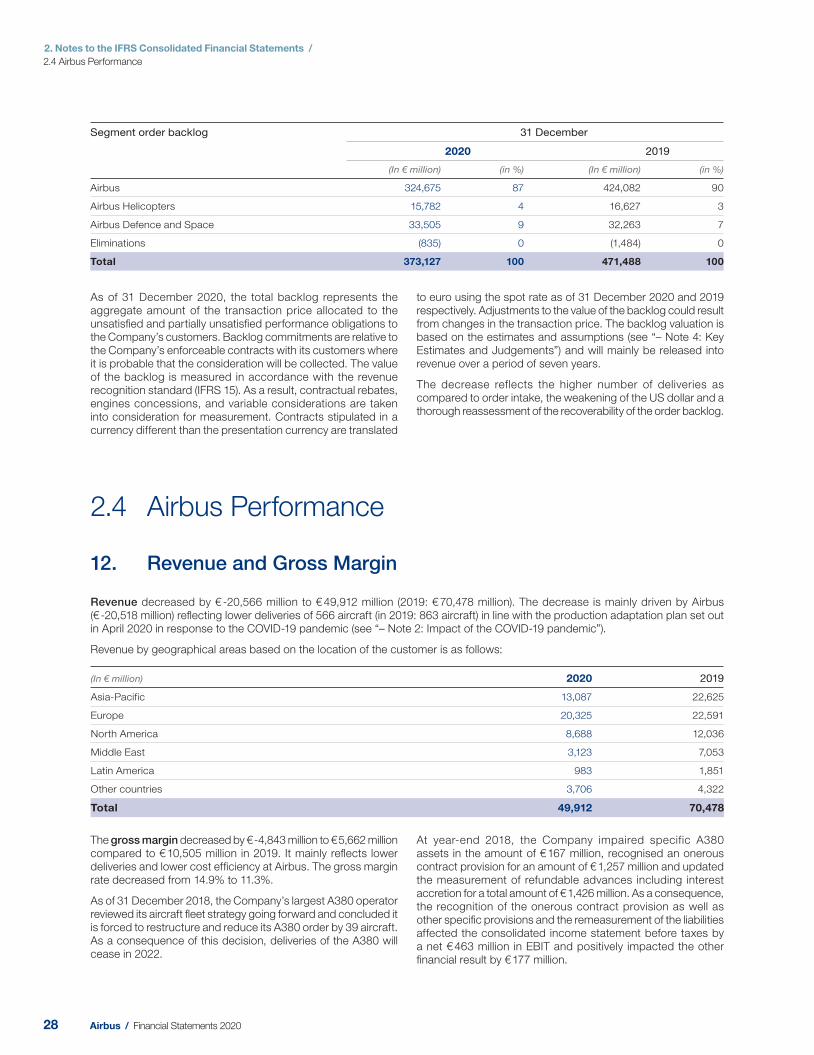
Segment order backlog 31 December
2020 2019
(In € million) (in %) (In € million) (in %)
Airbus 324,675 87 424,082 90
Airbus Helicopters 15,782 4 16,627 3
Airbus Defence and Space 33,505 9 32,263 7
Eliminations (835) 0 (1,484) 0
Total 373,127 100 471,488 100
As of 31 December 2020, the total backlog represents the aggregate amount of the transaction price allocated to the unsatisfi ed and partially unsatisfi ed performance obligations to the Company’s customers. Backlog commitments are relative to the Company’s enforceable contracts with its customers where it is probable that the consideration will be collected. The value of the backlog is measured in accordance with the revenue recognition standard (IFRS 15). As a result, contractual rebates, engines concessions, and variable considerations are taken into consideration for measurement. Contracts stipulated in a currency different than the presentation currency are translated
to euro using the spot rate as of 31 December 2020 and 2019 respectively. Adjustments to the value of the backlog could result from changes in the transaction price. The backlog valuation is based on the estimates and assumptions (see “– Note 4: Key Estimates and Judgements”) and will mainly be released into revenue over a period of seven years.
The decrease reflects the higher number of deliveries as compared to order intake, the weakening of the US dollar and a thorough reassessment of the recoverability of the order backlog.
2.4 Airbus Performance
12. Revenue and Gross Margin
Revenue decreased by € -20,566 million to € 49,912 million (2019: € 70,478 million). The decrease is mainly driven by Airbus (€ -20,518 million) refl ecting lower deliveries of 566 aircraft (in 2019: 863 aircraft) in line with the production adaptation plan set out in April 2020 in response to the COVID-19 pandemic (see “– Note 2: Impact of the COVID-19 pandemic”).
Revenue by geographical areas based on the location of the customer is as follows:
(In € million) 2020 2019
Asia-Pacific 13,087 22,625
Europe 20,325 22,591
North America 8,688 12,036
Middle East 3,123 7,053
Latin America 983 1,851
Other countries 3,706 4,322
Total 49,912 70,478
The gross margin decreased by € -4,843 million to € 5,662 million compared to € 10,505 million in 2019. It mainly refl ects lower deliveries and lower cost effi ciency at Airbus. The gross margin rate decreased from 14.9% to 11.3%.
As of 31 December 2018, the Company’s largest A380 operator reviewed its aircraft fl eet strategy going forward and concluded it is forced to restructure and reduce its A380 order by 39 aircraft. As a consequence of this decision, deliveries of the A380 will cease in 2022.
At year-end 2018, the Company impaired specific A380 assets in the amount of € 167 million, recognised an onerous contract provision for an amount of € 1,257 million and updated the measurement of refundable advances including interest accretion for a total amount of € 1,426 million. As a consequence, the recognition of the onerous contract provision as well as other specifi c provisions and the remeasurement of the liabilities affected the consolidated income statement before taxes by a net € 463 million in EBIT and positively impacted the other fi nancial result by € 177 million.
28 Airbus / Financial Statements 2020
2. Notes to the IFRS Consolidated Financial Statements /
2.4 Airbus Performance
2
13. Administrative Expenses
Administrative expenses decreased by € -3,794 million to € 1,423 million (2019: € 5,217 million), mainly due to the fi nal agreements reached in 2019 with the French Parquet National Financier (PNF), the U.K. Serious Fraud Offi ce (SFO) and the US Department of State (DoS).
14. Research and Development Expenses
Research and development expenses decreased by € -500 million to € 2,858 million compared to € 3,358 million in 2019.
15. Other Income and Other Expenses
Other income decreased by € -238 million to € 132 million compared to € 370 million in 2019.
Other expenses increased by € +1,102 million to € -1,458 million compared to € -356 million in 2019, mainly due to the restructuring provision recorded in 2020 in response to the COVID-19 pandemic. For more details, see “– Note 2: Impact of the COVID-19 pandemic”.
16. Share of Profi t from Investments Accounted for under the Equity Method and Other Income from Investments
(In € million) 2020 2019
Share of profit from investments in joint ventures 31 265
Share of profit from investments in associates 8 34
Share of profit from investments accounted for under the equity method 39 299
Other income from investments 113 4
Share of profit from investments under the equity method and other income from investments decreased by € -151 million to € 152 million compared to € 303 million in 2019.
In 2019, the Company recorded an additional net charge of € 99 million in EBIT as part of its continuous assessment of assets recoverability and quarterly review of onerous contract provision assumptions. In 2020, the Company recorded an additional net charge of € 320 million in EBIT.
As of 31 December 2020, the Company has delivered a total of 97 A400M aircraft including nine aircraft in 2020.
The COVID-19 pandemic is weighing on the performance of development, production, fl ight testing, aircraft delivery and retrofi t activities. The Company continued with development activities toward achieving the revised capability roadmap. Retrofi t activities are progressing in close alignment with the customer.
In the fourth quarter 2019, an update of the contract estimate at completion was performed and an additional charge of € 1,212 million recorded. This refl ected mainly the updated estimates on the export scenario during the launch contract phase as well as some cost increases in particular for retrofi t and an updated view on applicable escalation. In 2020, an update of the contract estimate at completion confi rmed the
2019 position. A charge of € 63 million has been recorded in 2020 refl ecting mainly the variation of price escalation indexes.
Risks remain on the development of technical capabilities and associated costs, on aircraft operational reliability in particular with regard to power plant, on cost reductions and on securing export orders in time as per the revised baseline.
Due to the suspension of defence export licences to Saudi Arabia by the German Government until 31 March 2020, and the consequential inability of the Company to execute a customer contract, a revised Estimate at Completion (EAC) was performed as of 31 December 2019. As a result, a € 221 million impairment charge mainly on inventories on top of a € 112 million fi nancial expense related to hedge ineffectiveness has been recognised in 2019. In the fourth quarter 2020 the Company updated its contract estimate at completion which confi rms the 2019 assessment. The Company continues to engage with its customer to agree a way forward on this contract. The outcome of these negotiations is presently unclear but could result in further signifi cant fi nancial impacts.
2929Airbus / Financial Statements 2020
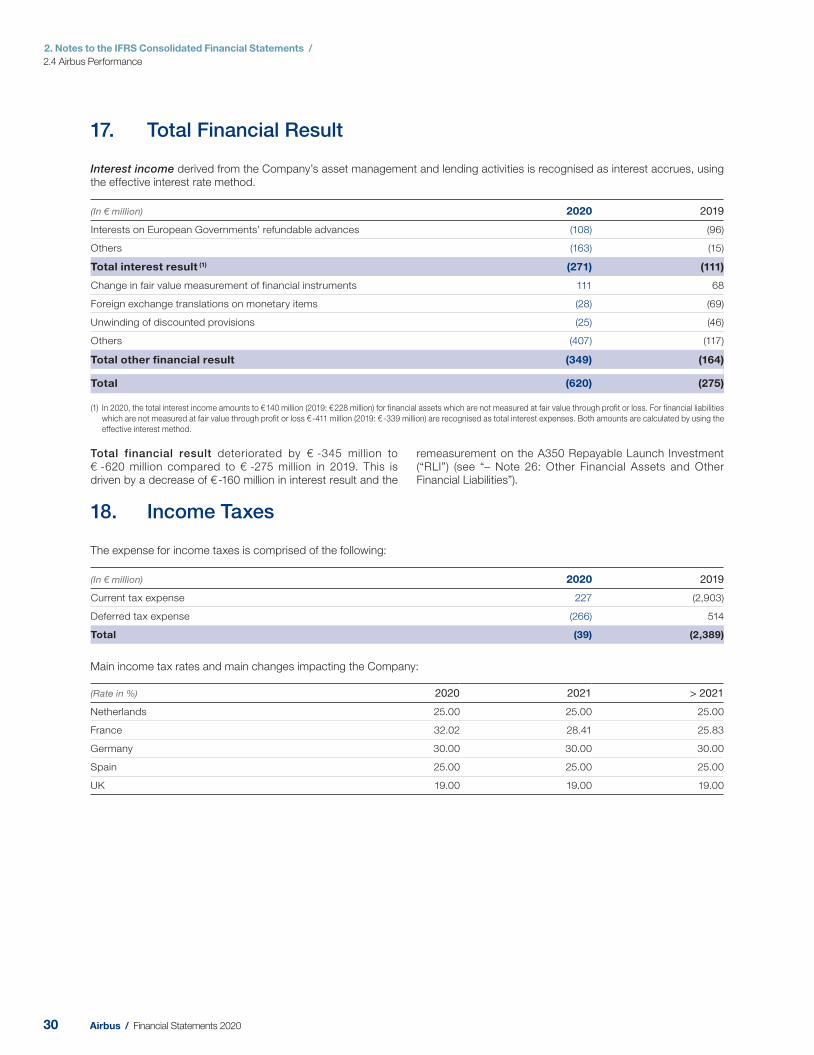
2. Notes to the IFRS Consolidated Financial Statements /
2.4 Airbus Performance
Total financial result deteriorated by € -345 million to € -620 million compared to € -275 million in 2019. This is driven by a decrease of € -160 million in interest result and the
remeasurement on the A350 Repayable Launch Investment (“RLI”) (see “– Note 26: Other Financial Assets and Other Financial Liabilities”).
17. Total Financial Result
Interest income derived from the Company’s asset management and lending activities is recognised as interest accrues, using the effective interest rate method.
(In € million) 2020 2019
Interests on European G overnments’ refundable advances (108) (96)
Others (163) (15)
Total interest result (1) (271) (111)
Change in fair value measurement of financial instruments 111 68
Foreign exchange translations on monetary items (28) (69)
Unwinding of discounted provisions (25) (46)
Others (407) (117)
Total other financial result (349) (164)
Total (620) (275)
(1) In 2020, the total interest income amounts to € 140 million (20 19: € 228 million) for financial assets which are not measured at fair value through profit or loss. For financial liabilities
which are not measured at fair value through profit or loss € -411 million (2019: € -339 million) are recognised as total interest expenses. Both amounts are calculated by using the
effective interest method.
18. Income Taxes
The expense for income taxes is comprised of the following:
(In € million) 2020 2019
Current tax expense 227 (2,903)
Deferred tax expense (266) 514
Total (39) (2,389)
Main income tax rates and main changes impacting the Company:
(Rate in %) 2020 2021 > 2021
Netherlands 25.00 25.00 25.00
France 32.02 28.41 25.83
Germany 30.00 30.00 30.00
Spain 25.00 25.00 25.00
UK 19.00 19.00 19.00
30 Airbus / Financial Statements 2020
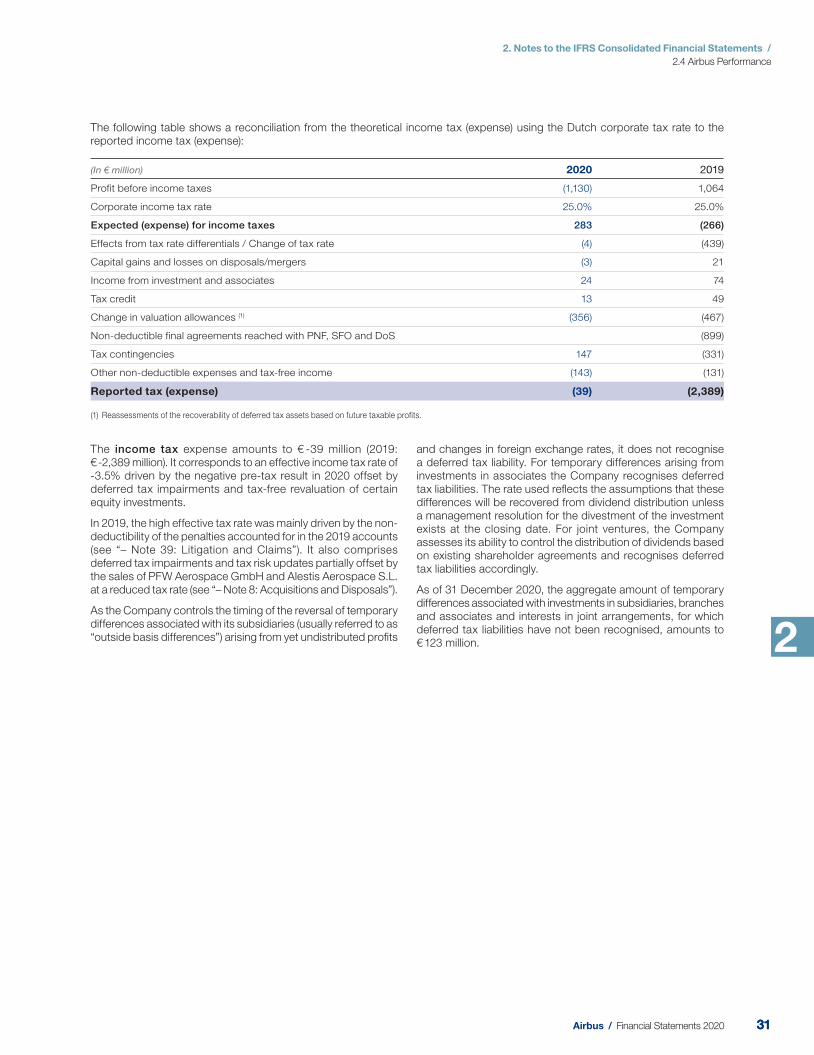
2. Notes to the IFRS Consolidated Financial Statements /
2.4 Airbus Performance
2
The following table shows a reconciliation from the theoretical income tax (expense) using the Dutch corporate tax rate to the reported income tax (expense):
(In € million) 2020 2019
Profit before income taxes (1,130) 1,064
Corporate income tax rate 25.0% 25.0%
Expected (expense) for income taxes 283 (266)
Effects from tax rate differentials / Change of tax rate (4) (439)
Capital gains and losses on disposals/mergers (3) 21
Income from investment and associates 24 74
Tax credit 13 49
Change in valuation allowances (1) (356) (467)
Non-deductible final agreements reached with PNF, SFO and DoS (899)
Tax contingencies 147 (331)
Other non-deductible expenses and tax-free income (143) (131)
Reported tax (expense) (39) (2,389)
(1) Reassessments of the recoverability of deferred tax assets based on future taxable profits.
The income tax expense amounts to € -39 million (20 19: € -2,389 million). It corresponds to an effective income tax rate of -3.5% driven by the negative pre-tax result in 2020 offset by deferred tax impairments and tax-free revaluation of certain equity investments.
In 2019, the high effective tax rate was mainly driven by the non-deductibility of the penalties accounted for in the 2019 accounts (see “– Note 39: Litigation and Claims”). It also comprises deferred tax impairments and tax risk updates partially offset by the sales of PFW Aerospace GmbH and Alestis Aerospace S.L. at a reduced tax rate (see “– Note 8: Acquisitions and Disposals”).
As the Company controls the timing of the reversal of temporary differences associated with its subsidiaries (usually referred to as “outside basis differences”) arising from yet undistributed profi ts
and changes in foreign exchange rates, it does not recognise a deferred tax liability. For temporary differences arising from investments in associates the Company recognises deferred tax liabilities. The rate used refl ects the assumptions that these differences will be recovered from dividend distribution unless a management resolution for the divestment of the investment exists at the closing date. For joint ventures, the Company assesses its ability to control the distribution of dividends based on existing shareholder agreements and recognises deferred tax liabilities accordingly.
As of 31 December 2020, the aggregate amount of temporary differences associated with investments in subsidiaries, branches and associates and interests in joint arrangements, for which deferred tax liabilities have not been recognised, amounts to € 123 million.
3131Airbus / Financial Statements 2020
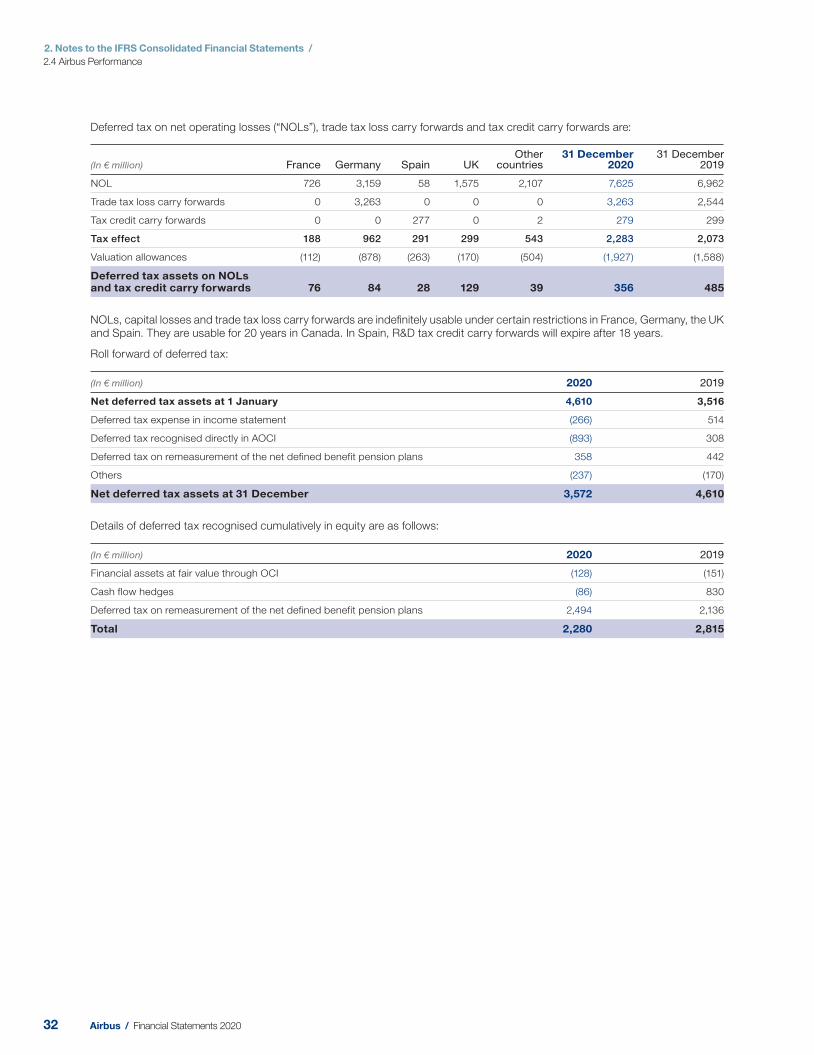
2. Notes to the IFRS Consolidated Financial Statements /
2.4 Airbus Performance
Deferred tax on net operating losses (“NOLs”), trade tax loss carry forwards and tax credit carry forwards are:
(In € million) France Germany Spain UK Other
countries31 December
202031 December
2019
NOL 726 3,159 58 1,575 2,107 7,625 6,962
Trade tax loss carry forwards 0 3,263 0 0 0 3,263 2,544
Tax credit carry forwards 0 0 277 0 2 279 299
Tax effect 188 962 291 299 543 2,283 2,073
Valuation allowances (112) (878) (263) (170) (504) (1,927) (1,588)
Deferred tax assets on NOLs and tax credit carry forwards 76 84 28 129 39 356 485
NOLs, capital losses and trade tax loss carry forwards are indefi nitely usable under certain restrictions in France, Germany, the UK and Spain. They are usable for 20 years in Canada. In Spain, R&D tax credit carry forwards will expire after 18 years.
Roll forward of deferred tax:
(In € million) 2020 2019
Net deferred tax assets at 1 January 4,610 3,516
Deferred tax expense in income statement (266) 514
Deferred tax recognised directly in AOCI (893) 308
Deferred tax on remeasurement of the net defined benefit pension plans 358 442
Others (237) (170)
Net deferred tax assets at 31 December 3,572 4,610
Details of deferred tax recognised cumulatively in equity are as follows:
(In € million) 2020 2019
Financial assets at fair value through OCI (128) (151)
Cash flow hedges (86) 830
Deferred tax on remeasurement of the net defined benefit pension plans 2,494 2,136
Total 2,280 2,815
32 Airbus / Financial Statements 2020
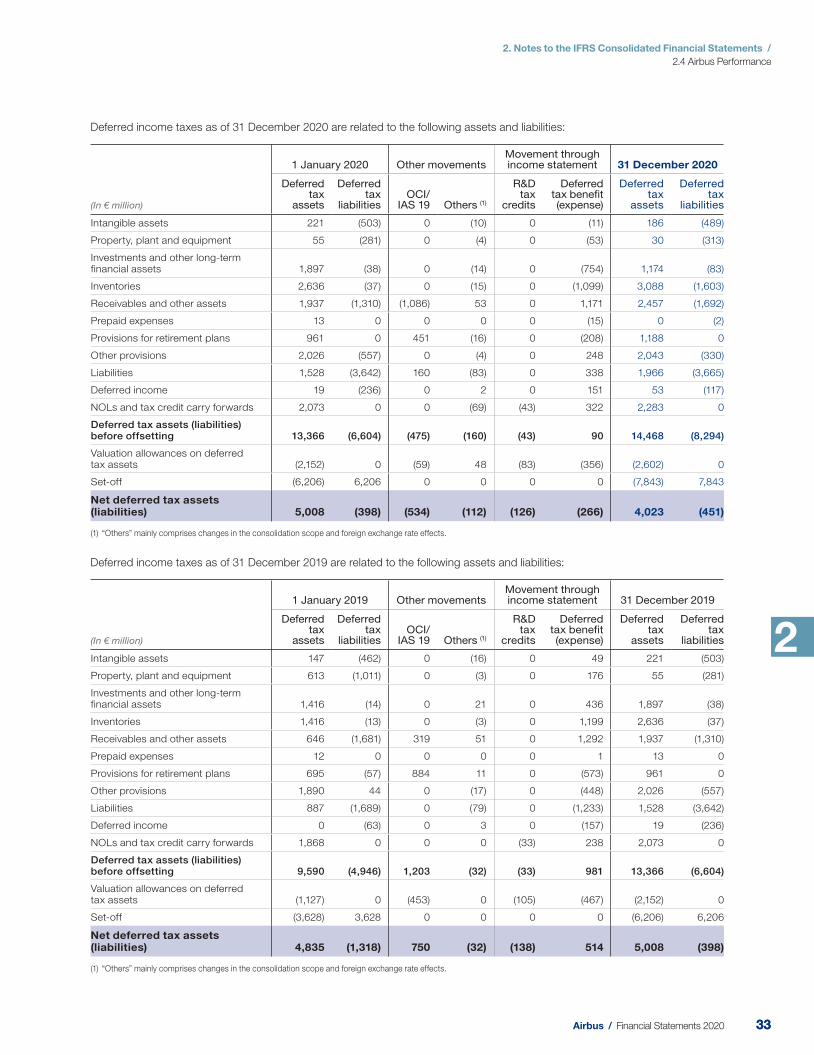
2. Notes to the IFRS Consolidated Financial Statements /
2.4 Airbus Performance
2
Deferred income taxes as of 31 December 2020 are related to the following assets and liabilities:
(In € million)
1 January 2020 Other movements Movement through income statement 31 December 2020
Deferred tax
assets
Deferred tax
liabilities OCI/
IAS 19 Others (1)
R&D tax
credits
Deferredtax benefit (expense)
Deferred tax
assets
Deferred tax
liabilities
Intangible assets 221 (503) 0 (10) 0 (11) 186 (489)
Property, plant and equipment 55 (281) 0 (4) 0 (53) 30 (313)
Investments and other long-term financial assets 1,897 (38) 0 (14) 0 (754) 1,174 (83)
Inventories 2,636 (37) 0 (15) 0 (1,099) 3,088 (1,603)
Receivables and other assets 1,937 (1,310) (1,086) 53 0 1,171 2,457 (1,692)
Prepaid expenses 13 0 0 0 0 (15) 0 (2)
Provisions for retirement plans 961 0 451 (16) 0 (208) 1,188 0
Other provisions 2,026 (557) 0 (4) 0 248 2,043 (330)
Liabilities 1,528 (3,642) 160 (83) 0 338 1,966 (3,665)
Deferred income 19 (236) 0 2 0 151 53 (117)
NOLs and tax credit carry forwards 2,073 0 0 (69) (43) 322 2,283 0
Deferred tax assets (liabilities) before offsetting 13,366 (6,604) (475) (160) (43) 90 14,468 (8,294)
Valuation allowances on deferred tax assets (2,152) 0 (59) 48 (83) (356) (2,602) 0
Set-off (6,206) 6,206 0 0 0 0 (7,843) 7,843
Net deferred tax assets (liabilities) 5,008 (398) (534) (112) (126) (266) 4,023 (451)
(1) “Others” mainly comprises changes in the consolidation scope and foreign exchange rate effects.
Deferred income taxes as of 31 December 2019 are related to the following assets and liabilities:
(In € million)
1 January 2019 Other movementsMovement through income statement 31 December 2019
Deferred tax
assets
Deferred tax
liabilitiesOCI/
IAS 19 Others (1)
R&Dtax
credits
Deferredtax benefit (expense)
Deferred tax
assets
Deferred tax
liabilities
Intangible assets 147 (462) 0 (16) 0 49 221 (503)
Property, plant and equipment 613 (1,011) 0 (3) 0 176 55 (281)
Investments and other long-term financial assets 1,416 (14) 0 21 0 436 1,897 (38)
Inventories 1,416 (13) 0 (3) 0 1,199 2,636 (37)
Receivables and other assets 646 (1,681) 319 51 0 1,292 1,937 (1,310)
Prepaid expenses 12 0 0 0 0 1 13 0
Provisions for retirement plans 695 (57) 884 11 0 (573) 961 0
Other provisions 1,890 44 0 (17) 0 (448) 2,026 (557)
Liabilities 887 (1,689) 0 (79) 0 (1,233) 1,528 (3,642)
Deferred income 0 (63) 0 3 0 (157) 19 (236)
NOLs and tax credit carry forwards 1,868 0 0 0 (33) 238 2,073 0
Deferred tax assets (liabilities) before offsetting 9,590 (4,946) 1,203 (32) (33) 981 13,366 (6,604)
Valuation allowances on deferred tax assets (1,127) 0 (453) 0 (105) (467) (2,152) 0
Set-off (3,628) 3,628 0 0 0 0 (6,206) 6,206
Net deferred tax assets (liabilities) 4,835 (1,318) 750 (32) (138) 514 5,008 (398)
(1) “Others” mainly comprises changes in the consolidation scope and foreign exchange rate effects.
3333Airbus / Financial Statements 2020
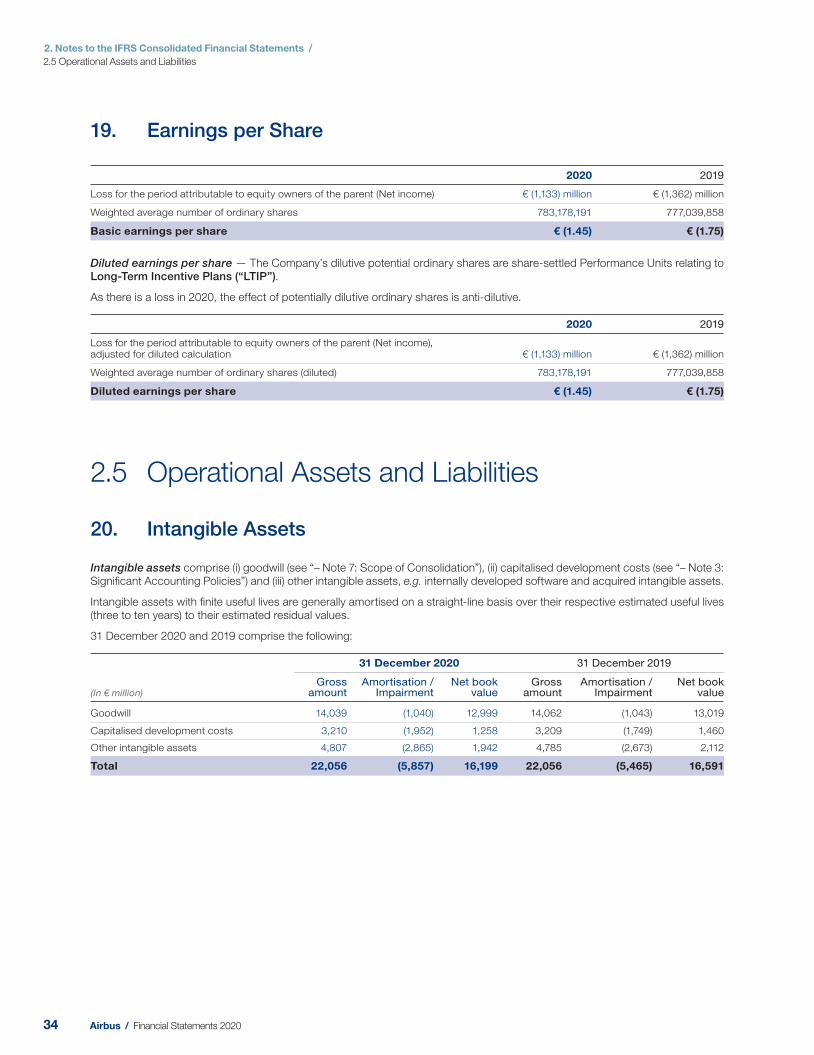
2. Notes to the IFRS Consolidated Financial Statements /
2.5 Operational Assets and Liabilities
19. Earnings per Share
2020 2019
Loss for the period attributable to equity owners of the parent (Net income) € (1,133) million € (1,362) million
Weighted average number of ordinary shares 783,178,191 777,039,858
Basic earnings per share € (1.45) € (1.75)
Diluted earnings per share — The Company’s dilutive potential ordinary shares are share-settled Performance Units relating to Long-Term Incentive Plans (“LTIP”).
As there is a loss in 2020, the effect of potentially dilutive ordinary shares is anti-dilutive.
2020 2019
Loss for the period attributable to equity owners of the parent (Net income),adjusted for diluted calculation € (1,133) million € (1,362) million
Weighted average number of ordinary shares (diluted) 783,178,191 777,039,858
Diluted earnings per share € (1.45) € (1.75)
2.5 Operational Assets and Liabilities
20. Intangible Assets
Intangible assets comprise (i) goodwill (see “– Note 7: Scope of Consolidation”), (ii) capitalised development costs (see “– Note 3: Signifi cant Accounting Policies”) and (iii) other intangible assets, e.g. internally developed software and acquired intangible assets.
Intangible assets with fi nite useful lives are generally amortised on a straight-line basis over their respective estimated useful lives (three to ten years) to their estimated residual values.
31 December 2020 and 2019 comprise the following:
(In € million)
31 December 2020 31 December 2019
Gross amount
Amortisation / Impairment
Net book value
Gross amount
Amortisation / Impairment
Net book value
Goodwill 14,039 (1,040) 12,999 14,062 (1,043) 13,019
Capitalised development costs 3,210 (1,952) 1,258 3,209 (1,749) 1,460
Other intangible assets 4,807 (2,865) 1,942 4,785 (2,673) 2,112
Total 22,056 (5,857) 16,199 22,056 (5,465) 16,591
34 Airbus / Financial Statements 2020
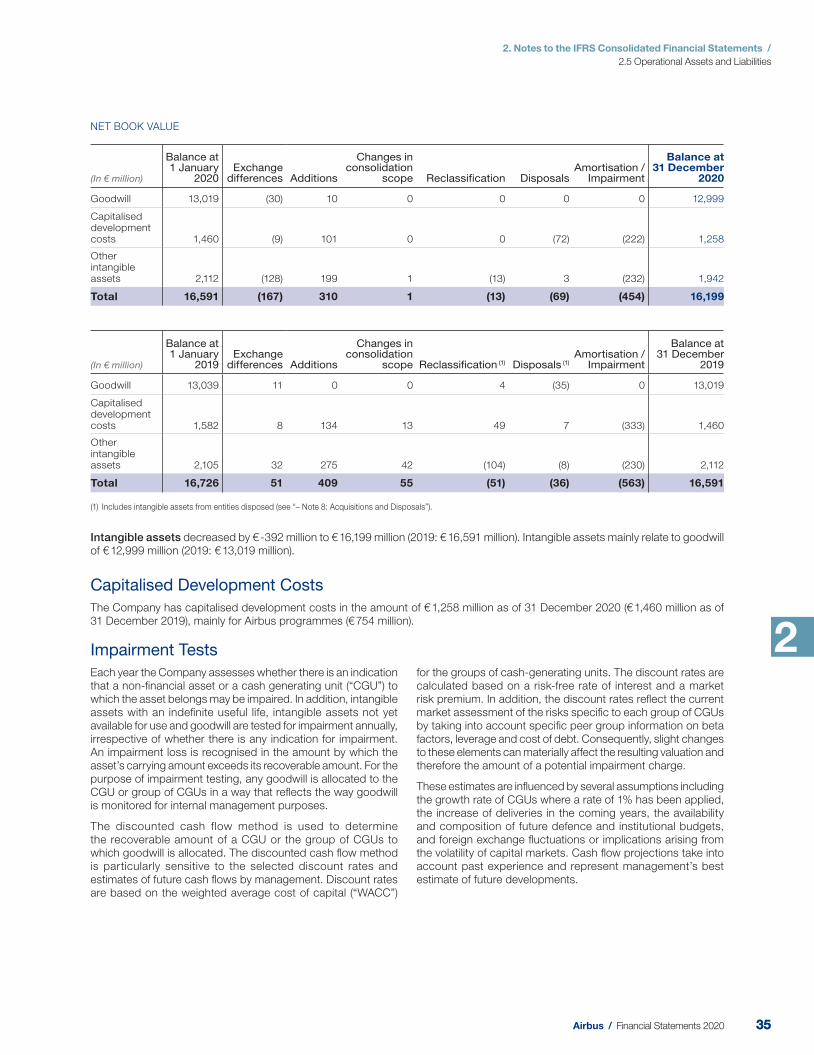
2. Notes to the IFRS Consolidated Financial Statements /
2.5 Operational Assets and Liabilities
2
NET BOOK VALUE
(In € million)
Balance at 1 January
2020 Exchange
differences Additions
Changes in consolidation
scope Reclassification Disposals Amortisation /
Impairment
Balance at 31 December
2020
Goodwill 13,019 (30) 10 0 0 0 0 12,999
Capitalised development costs 1,460 (9) 101 0 0 (72) (222) 1,258
Other intangible assets 2,112 (128) 199 1 (13) 3 (232) 1,942
Total 16,591 (167) 310 1 (13) (69) (454) 16,199
(In € million)
Balance at 1 January
2019 Exchange
differences Additions
Changes in consolidation
scope Reclassification (1) Disposals (1) Amortisation /
Impairment
Balance at 31 December
2019
Goodwill 13,039 11 0 0 4 (35) 0 13,019
Capitalised development costs 1,582 8 134 13 49 7 (333) 1,460
Other intangible assets 2,105 32 275 42 (104) (8) (230) 2,112
Total 16,726 51 409 55 (51) (36) (563) 16,591
(1) Includes intangible assets from entities disposed (see “– Note 8: Acquisitions and Disposals”).
Intangible assets decreased by € -392 million to € 16,199 million (2019: € 16,591 million). Intangible assets mainly relate to goodwill of € 12,999 million (2019: € 13,019 million).
Capitalised Development Costs
The Company has capitalised development costs in the amount of € 1,258 million as of 31 December 2020 (€ 1,460 million as of 31 December 20 19), mainly for Airbus programmes (€ 754 million).
Impairment Tests
Each year the Company assesses whether there is an indication that a non-fi nancial asset or a cash generating unit (“CGU”) to which the asset belongs may be impaired. In addition, intangible assets with an indefi nite useful life, intangible assets not yet available for use and goodwill are tested for impairment annually, irrespective of whether there is any indication for impairment. An impairment loss is recognised in the amount by which the asset’s carrying amount exceeds its recoverable amount. For the purpose of impairment testing, any goodwill is allocated to the CGU or group of CGUs in a way that refl ects the way goodwill is monitored for internal management purposes.
The discounted cash flow method is used to determine the recoverable amount of a CGU or the group of CGUs to which goodwill is allocated. The discounted cash fl ow method is particularly sensitive to the selected discount rates and estimates of future cash fl ows by management. Discount rates are based on the weighted average cost of capital (“WACC”)
for the groups of cash-generating units. The discount rates are calculated based on a risk-free rate of interest and a market risk premium. In addition, the discount rates refl ect the current market assessment of the risks specifi c to each group of CGUs by taking into account specifi c peer group information on beta factors, leverage and cost of debt. Consequently, slight changes to these elements can materially affect the resulting valuation and therefore the amount of a potential impairment charge.
These estimates are infl uenced by several assumptions including the growth rate of CGUs where a rate of 1% has been applied, the increase of deliveries in the coming years, the availability and composition of future defence and institutional budgets, and foreign exchange fl uctuations or implications arising from the volatility of capital markets. Cash fl ow projections take into account past experience and represent management’s best estimate of future developments.
3535Airbus / Financial Statements 2020
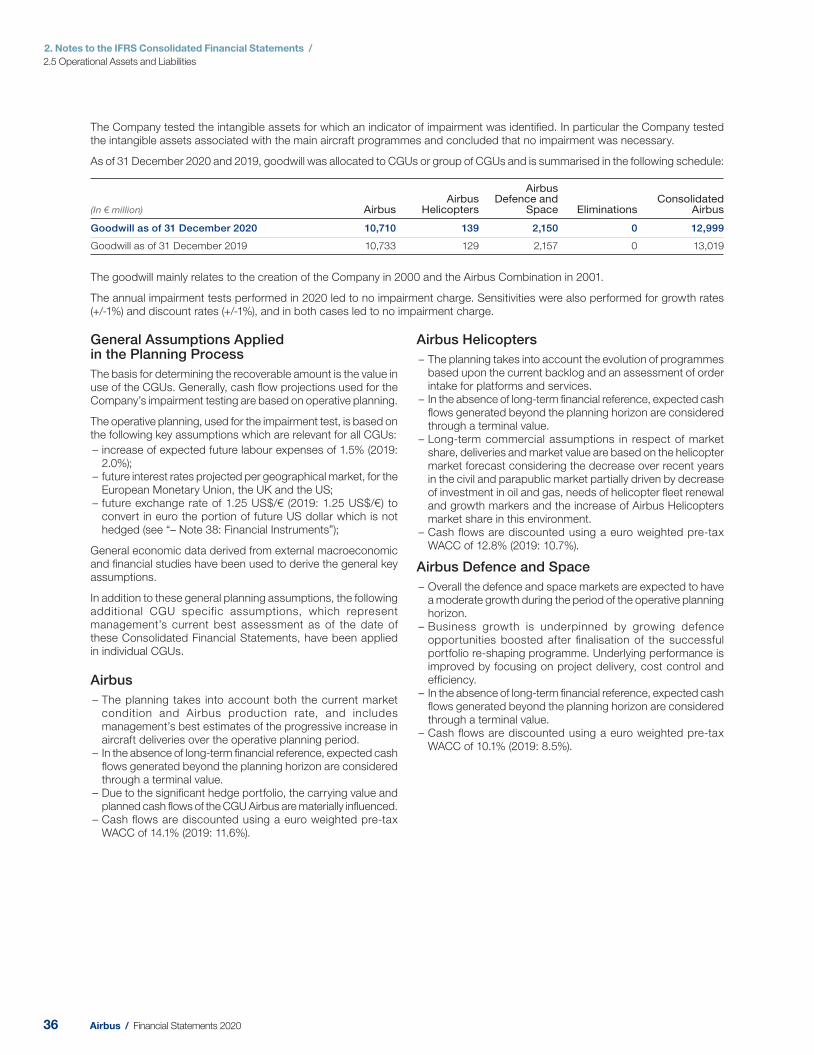
2. Notes to the IFRS Consolidated Financial Statements /
2.5 Operational Assets and Liabilities
The Company tested the intangible assets for which an indicator of impairment was identifi ed. In particular the Company tested the intangible assets associated with the main aircraft programmes and concluded that no impairment was necessary.
As of 31 December 2020 a nd 2019, goodwill was allocated to CGUs or group of CGUs and is summarised in the following schedule:
(In € million) Airbus Airbus
Helicopters
Airbus Defence and
Space Eliminations Consolidated
Airbus
Goodwill as of 31 December 2020 10,710 139 2,150 0 12,999
Goodwill as of 31 December 2019 10,733 129 2,157 0 13,019
The goodwill mainly relates to the creation of the Company in 2000 and the Airbus Combination in 2001.
The annual impairment tests performed in 2020 led to no impairment charge. Sensitivities were also performed for growth rates (+/-1%) and discount rates (+/-1%), and in both cases led to no impairment charge.
General Assumptions Applied in the Planning Process
The basis for determining the recoverable amount is the value in use of the CGUs. Generally, cash fl ow projections used for the Company’s impairment testing are based on operative planning.
The operative planning, used for the impairment test, is based on the following key assumptions which are relevant for all CGUs:
– increase of expected future labour expenses of 1.5% ( 2019: 2.0%);
– future interest rates projected per geographical market, for the European Monetary Union, the UK and the US;
– future exchange rate of 1.25 US$/€ (20 19: 1.25 US$/€) to convert in euro the portion of future US dollar which is not hedged (see “– Note 38: Financial Instruments”);
General economic data derived from external macroeconomic and fi nancial studies have been used to derive the general key assumptions.
In addition to these general planning assumptions, the following additional CGU specific assumptions, which represent management’s current best assessment as of the date of these Consolidated Financial Statements, have been applied in individual CGUs.
Airbus
– The planning takes into account both the current market condition and Airbus production rate, and includes management’s best estimates of the progressive increase in aircraft deliveries over the operative planning period.
– In the absence of long-term fi nancial reference, expected cash fl ows generated beyond the planning horizon are considered through a terminal value.
– Due to the signifi cant hedge portfolio, the carrying value and planned cash fl ows of the CGU Airbus are materially infl uenced.
– Cash fl ows are discounted using a euro weighted pre-tax WACC of 14.1% (2019: 11.6%).
Airbus Helicopters
– The planning takes into account the evolution of programmes based upon the current backlog and an assessment of order intake for platforms and services.
– In the absence of long-term fi nancial reference, expected cash fl ows generated beyond the planning horizon are considered through a terminal value.
– Long-term commercial assumptions in respect of market share, deliveries and market value are based on the helicopter market forecast considering the decrease over recent years in the civil and parapublic market partially driven by decrease of investment in oil and gas, needs of helicopter fl eet renewal and growth markers and the increase of Airbus Helicopters market share in this environment.
– Cash fl ows are discounted using a euro weighted pre-tax WACC of 12.8% (2019: 10.7%).
Airbus Defence and Space
– Overall the defence and space markets are expected to have a moderate growth during the period of the operative planning horizon.
– Business growth is underpinned by growing defence opportunities boosted after fi nalisation of the successful portfolio re-shaping programme. Underlying performance is improved by focusing on project delivery, cost control and effi ciency.
– In the absence of long-term fi nancial reference, expected cash fl ows generated beyond the planning horizon are considered through a terminal value.
– Cash fl ows are discounted using a euro weighted pre-tax WACC of 10.1% (2019: 8.5%).
36 Airbus / Financial Statements 2020
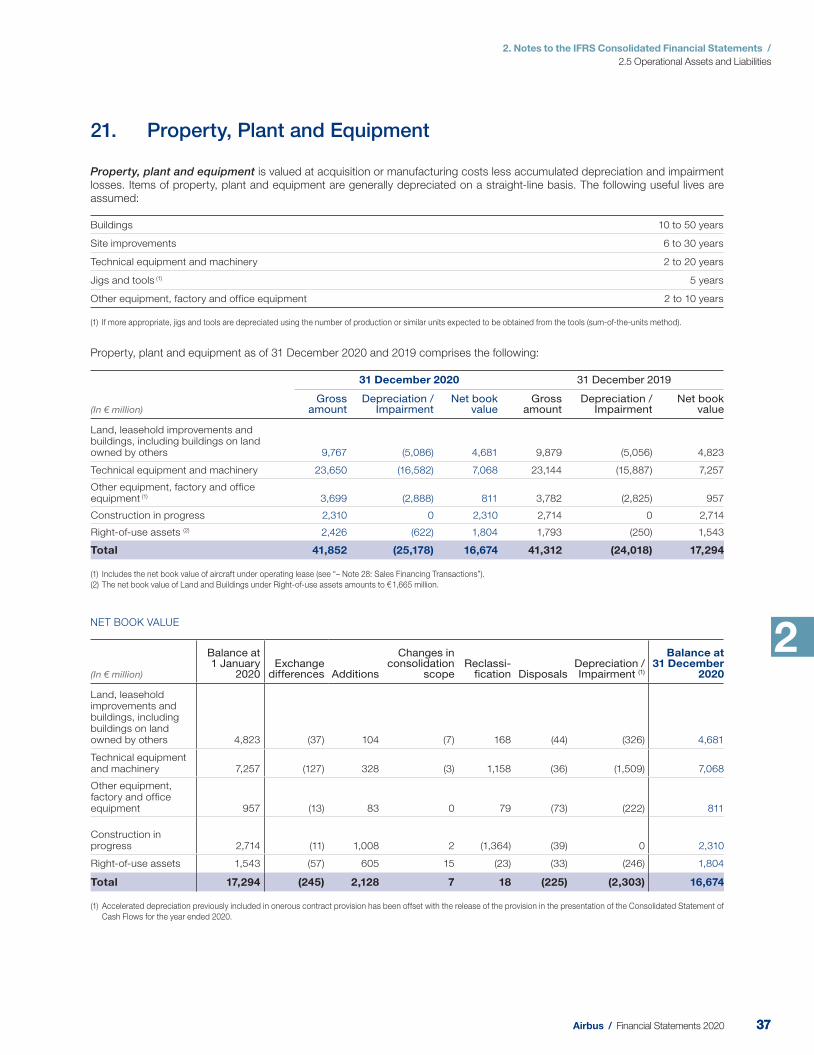
2. Notes to the IFRS Consolidated Financial Statements /
2.5 Operational Assets and Liabilities
2
21. Property, Plant and Equipment
Property, plant and equipment is valued at acquisition or manufacturing costs less accumulated depreciation and impairment losses. Items of property, plant and equipment are generally depreciated on a straight-line basis. The following useful lives are assumed:
Buildings 10 to 50 years
Site improvements 6 to 30 years
Technical equipment and machinery 2 to 20 years
Jigs and tools (1) 5 years
Other equipment, factory and office equipment 2 to 10 years
(1) If more appropriate, jigs and tools are depreciated using the number of production or similar units expected to be obtained from the tools (sum-of-the-units method).
Property, plant and equipment as of 31 December 2020 and 2019 comprises the following:
(In € million)
31 December 2020 31 December 2019
Gross amount
Depreciation / Impairment
Net book value
Gross amount
Depreciation / Impairment
Net book value
Land, leasehold improvements and buildings, including buildings on land owned by others 9,767 (5,086) 4,681 9,879 (5,056) 4,823
Technical equipment and machinery 23,650 (16,582) 7,068 23,144 (15,887) 7,257
Other equipment, factory and office equipment (1) 3,699 (2,888) 811 3,782 (2,825) 957
Construction in progress 2,310 0 2,310 2,714 0 2,714
Right-of-use assets (2) 2,426 (622) 1,804 1,793 (250) 1,543
Total 41,852 (25,178) 16,674 41,312 (24,018) 17,294
(1) Includes the net book value of aircraft under operating lease (see “– Note 28: Sales Financing Transactions”).
(2) The net book value of Land and Buildings under Right-of-use assets amounts to € 1,665 million.
NET BOOK VALUE
(In € million)
Balance at 1 January
2020 Exchange
differences Additions
Changes in consolidation
scope Reclassi-
fication Disposals Depreciation / Impairment (1)
Balance at 31 December
2020
Land, leasehold improvements and buildings, including buildings on land owned by others 4,823 (37) 104 (7) 168 (44) (326) 4,681
Technical equipment and machinery 7,257 (127) 328 (3) 1,158 (36) (1,509) 7,068
Other equipment, factory and office equipment 957 (13) 83 0 79 (73) (222) 811
Construction in progress 2,714 (11) 1,008 2 (1,364) (39) 0 2,310
Right-of-use assets 1,543 (57) 605 15 (23) (33) (246) 1,804
Total 17,294 (245) 2,128 7 18 (225) (2,303) 16,674
(1) Accelerated depreciation previously included in onerous contract provision has been offset with the release of the provision in the presentation of the Consolidated Statement of
Cash Flows for the year ended 2020.
3737Airbus / Financial Statements 2020
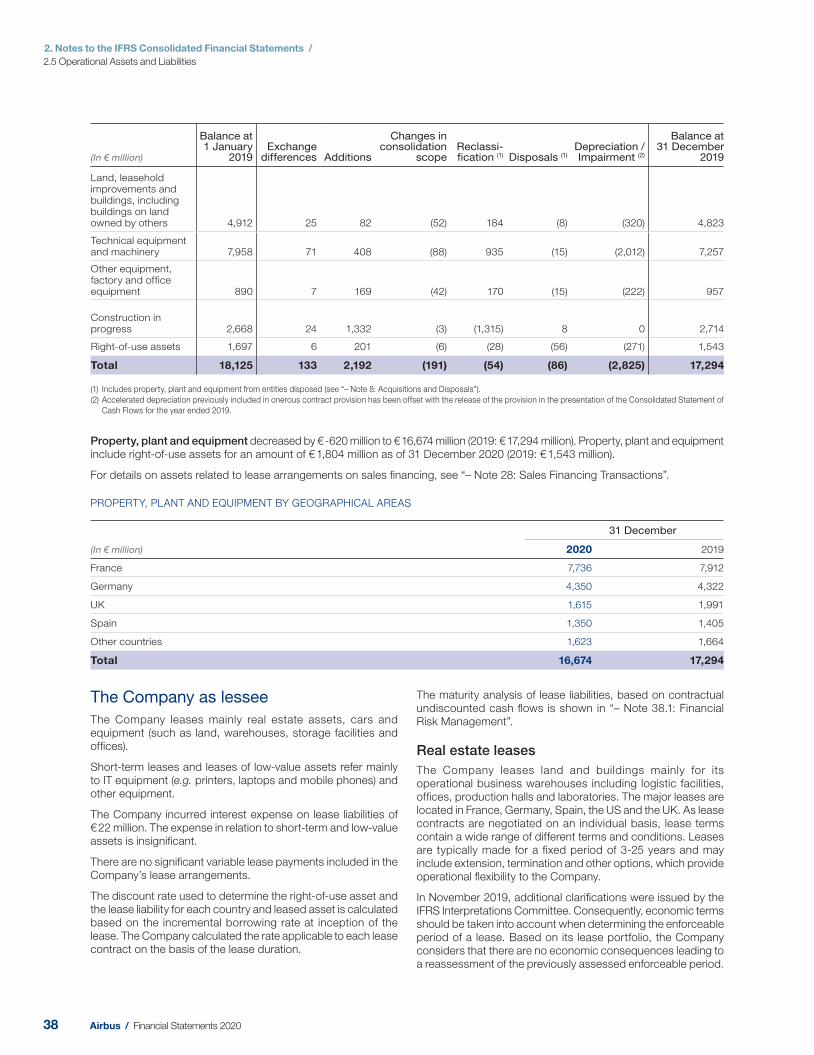
2. Notes to the IFRS Consolidated Financial Statements /
2.5 Operational Assets and Liabilities
(In € million)
Balance at 1 January
2019Exchange
differences Additions
Changes in consolidation
scope Reclassi-fication (1) Disposals (1)
Depreciation / Impairment (2)
Balance at 31 December
2019
Land, leasehold improvements and buildings, including buildings on land owned by others 4,912 25 82 (52) 184 (8) (320) 4,823
Technical equipment and machinery 7,958 71 408 (88) 935 (15) (2,012) 7,257
Other equipment, factory and office equipment 890 7 169 (42) 170 (15) (222) 957
Construction in progress 2,668 24 1,332 (3) (1,315) 8 0 2,714
Right-of-use assets 1,697 6 201 (6) (28) (56) (271) 1,543
Total 18,125 133 2,192 (191) (54) (86) (2,825) 17,294
(1) Includes property, plant and equipment from entities disposed (see “– Note 8: Acquisitions and Disposals”).
(2) Accelerated depreciation previously included in onerous contract provision has been offset with the release of the provision in the presentation of the Consolidated Statement of
Cash Flows for the year ended 2019.
Property, plant and equipment decreased by € -620 million to € 16,674 million (2019: € 17,294 million). Property, plant and equipment include right-of-use assets for an amount of € 1,804 million as of 31 December 2020 (2019: € 1,543 million).
For details on assets related to lease arrangements on sales fi nancing, see “– Note 28: Sales Financing Transactions”.
PROPERTY, PLANT AND EQUIPMENT BY GEOGRAPHICAL AREAS
(In € million)
31 December
2020 2019
France 7,736 7,912
Germany 4,350 4,322
UK 1,615 1,991
Spain 1,350 1,405
Other countries 1,623 1,664
Total 16,674 17,294
The Company as lessee
The Company leases mainly real estate assets, cars and equipment (such as land, warehouses, storage facilities and offi ces).
Short-term leases and leases of low-value assets refer mainly to IT equipment (e.g. printers, laptops and mobile phones) and other equipment.
The Company incurred interest expense on lease liabilities of € 22 million. The expense in relation to short-term and low-value assets is insignifi cant.
There are no signifi cant variable lease payments included in the Company’s lease arrangements.
The discount rate used to determine the right-of-use asset and the lease liability for each country and leased asset is calculated based on the incremental borrowing rate at inception of the lease. The Company calculated the rate applicable to each lease contract on the basis of the lease duration.
The maturity analysis of lease liabilities, based on contractual undiscounted cash fl ows is shown in “– Note 38.1: Financial Risk Management”.
Real estate leases
The Company leases land and buildings mainly for its operational business warehouses including logistic facilities, offi ces, production halls and laboratories. The major leases are located in France, Germany, Spain, the US and the UK. As lease contracts are negotiated on an individual basis, lease terms contain a wide range of different terms and conditions. Leases are typically made for a fi xed period of 3-25 years and may include extension, termination and other options, which provide operational fl exibility to the Company.
In November 2019, additional clarifi cations were issued by the IFRS Interpretations Committee. Consequently, economic terms should be taken into account when determining the enforceable period of a lease. Based on its lease portfolio, the Company considers that there are no economic consequences leading to a reassessment of the previously assessed enforceable period.
38 Airbus / Financial Statements 2020
2. Notes to the IFRS Consolidated Financial Statements /
2.5 Operational Assets and Liabilities
2
Vehicle leases
The Company leases cars for management and other functions. Vehicle leases typically run for an average period of three years and do not provide renewal options.
Other leases
The Company also leases IT equipment, machinery and other equipment that combined are insignifi cant to the total leased asset portfolio.
Of f-Balance Sheet Commitments
Commitments related to property, plant and equipment comprise contractual commitments for future capital expenditures and contractual commitments for purchases of “Land, leasehold improvements and buildings including buildings on land owned by others” (€ 335 million as of 31 Dece mber 2020, 2019: € 429 million).
Other investments mainly comprise the Company’s participations and include the remaining investment in Dassault Aviation (9.90%, 2019: 9.90%) amounting to € 742 million at 31 December 2020 (2019: € 968 million).
In December 2019, a reassessment of the OneWeb fi nancial assets was performed leading to a decrease in the fair value of the equity investment by € 45 million recorded through OCI, and a depreciation of a loan by € 31 million recorded through fi nancial result.
In March 2020, OneWeb Communications filed under Chapter 11 of the US Bankruptcy Code. Consequently, the related fi nancial assets were fully impaired, leading to a decrease in the fair value of the equity investment by € -137 million recorded through OCI and a depreciation of a loan by € -136 million recorded through fi nancial result.
On 3 July 2020, OneWeb entered into an agreement with a consortium led by Her Majesty’s Government HMG and Bharti Global Limited for the acquisition of the OneWeb business in connection with its court-supervised sale process. On 20 November 2020, OneWeb announced the achievement of all regulatory approvals together with its emergence from Chapter 11 of the US Bankruptcy Code.
The completion of the transaction has no material impact on the Consolidated Financial Statements as of 31 December 2020.
Other long-term financial assets and the current portion of other long-term financial assets include other loans in the amount of € 1,841 million as of 31 December 202 0 (2019: € 2,036 million), and the sales fi nancing activities in the form of fi nance lease receivables and loans from aircraft fi nancing.
22. Other Investments and Other Long-Term Financial Assets
(In € million)
31 December
2020 2019
Other investments 2,245 2,516
Other long-term financial assets 1,610 1,937
Total non-current other investments and other long-term financial assets 3,855 4,453
Current portion of other long-term financial assets 468 449
Total 4,323 4,902
23. Contract Assets and Contract Liabilities, Trade Receivables and Trade Liabilities
Contract assets represent the Company’s right to consideration in exchange for goods or services that the Company has transferred to a customer when that right is conditioned by something other than the passage of time (e.g. revenue recognised from the application of the PoC method before the Company has a right to invoice).
Contract liabilities represent the Company’s obligation to transfer goods or services to a customer for which the Company has received consideration, or for which an amount of consideration is due from the customer (e.g. advance payments received).
Net contract assets and contract liabilities are determined for each contract separately. For serial contracts, contract liabilities are presented in current contract liabilities, if revenues are expected within the next twelve months or material expenses for the manufacturing process have already occurred. For long-term production contracts (e.g. governmental contracts such as A400M, Tiger, NH90), contract liabilities are classifi ed as current when the relating inventories or receivables are expected to be recognised within the normal operating cycle of the long-term contract.
3939Airbus / Financial Statements 2020
2. Notes to the IFRS Consolidated Financial Statements /
2.5 Operational Assets and Liabilities
Trade receivables arise when the Company provides goods or services directly to a customer with no intention of trading the receivable. Trade receivables include claims arising from revenue recognition that are not yet settled by the debtor. Trade receivables are initially recognised at their transaction prices and are subsequently measured at amortised cost less any allowances for impairment. Gains and losses are recognised in
the Consolidated Income Statement when the receivables are derecognised, impaired or amortised.
Impairment and allowances of trade receivables and contract assets are measured at an amount equal to the life-time expected loss as described in “– Note 38: Financial Instruments”.
Contract Assets, Contract Liabilities and Trade Receivables
Signifi cant changes in contract assets and contract liabilities during the period are as follows:
(In € million)
2020 2019
Contract assets
Contract liabilities
Contract assets
Contract liabilities
Revenue recognised that was included in the contract liability balance at 1 January - (20,327) - (37,303)
Increases due to cash received, excluding amounts recognised as revenue - 20,915 (1) - 38,312
Transfers from contract assets recognised at 1 January (4,353) - (3,436) -
Increase as a result of changes in the measure of progress 4,188 - 3,941 -
(1) Including final payments received from customers and others parties in anticipation.
As of 31 December 2020, trade receivables amounting to € 189 million (2019: € 203 million) will mature after more than one year.
The respective movement in the allowance for doubtful accounts in respect of trade receivables and contract assets during the period was as follows:
(In € million) 2020 2019
Allowance balance at 1 January (397) (269)
Utilisations/disposals and business combinations 162 39
Additions (71) (167)
Allowance balance at 31 December (306) (397)
Trade Liabilities
Trade liabilities of € 8,722 million (20 19: € 14,808 million) decreased by € -6,086 million, mainly in Airbus. This is in line with the production adaptation plan set out in April 2020 in response to the COVID-19 pandemic (see “– Note 2: Impact of the COVID-19 pandemic”) and includes payments made to suppliers in anticipation.
As of 31 Decemb er 2020, trade liabilities amounting to € 67 million (2019: € 107 million) will mature after more than one year.
24. Inventories
(In € million)
31 December 20 20 31 December 201 9
Gross amount
Write-down
Net book value
Gross amount
Write-down
Net book value
Raw materials and manufacturing supplies 3,934 (606) 3,328 3,860 (581) 3,279
Work in progress 21,225 (2,495) 18,730 22,553 (2,034) 20,519
Finished goods and parts for resale 5,919 (691) 5,228 4,729 (617) 4,112
Advance payments to suppliers 3,173 (58) 3,115 3,704 (64) 3,640
Total 34,251 (3,850) 30,401 34,846 (3,296) 31,550
40 Airbus / Financial Statements 2020
2. Notes to the IFRS Consolidated Financial Statements /
2.5 Operational Assets and Liabilities
2
Provisions for pensions — As of 31 December 2020, the change in actuarial assumptions resulted overall in a total net increase in pension liability of € 1,627 million, principally refl ecting the weakening of interest rates in Germany, France, Canada and the UK partly compensated by the performance of the asset market values, resulting from market volatility related to the ongoing COVID-19 pandemic (see “– Note 2: Impact of the COVID-19 pandemic”).
Other provisions increased mainly due to the restructuring provision recorded in 2020 in response to the COVID-19 pandemic (see “– Note 2: Impact of the COVID-19 pandemic”), partly offset by a decrease in provisions for onerous contracts due to the utilisation and net presentation of the A380, A400M and A220 programme losses against inventories.
25. Provisions, Contingent Assets and Contingent Liabilities
Provisions — The determination of provisions, e.g. for onerous contracts, warranty costs, restructuring measures and legal proceedings is based on best available estimates.
In general, in the aerospace sector, the contractual and technical parameters considered for provision calculations are complex.
Hence uncertainty exists with regard to the timing and amounts of expenses to be taken into account.
The majority of other provisions are generally expected to result in cash outfl ows during the next 1 to 12 years.
(In € million)
31 December
2020 2019
Provisions for pensions 9,980 8,353
Other provisions 10,563 10,561
Total 20,543 18,914
thereof non-current portion 13,998 12,542
thereof current portion 6,545 6,372
Inventories of € 30,401 million (2019: € 31,550 million) decreased by € -1,149 million. This is driven by Airbus (€ -746 million), and mainly refl ects a decrease in work in progress in line with the production adaptation plan as well as A380 ramp down, partly offset by an increase in stored aircraft refl ecting customer requests to defer deliveries, as well as other factors related to the ongoing COVID-19 pandemic (see “– Note 2: Impact of the COVID-19 pandemic”).
In 2020, write -downs of inventories in the amount of € -950 million (2019: € -1,07 1 million) are recognised in cost of sales, whereas reversal of write-downs amounts to € 24 million (2019: € 55 millio n). At 31 December 2020, € 17,777 million of work in progress and € 5,046 million of fi nished goods and parts for resale were carried at net realisable value.
Inventories recognised as an expense during the period amount to € 32,985 million (2019: € 50,888 million).
4141Airbus / Financial Statements 2020
2. Notes to the IFRS Consolidated Financial Statements /
2.5 Operational Assets and Liabilities
Movements in other provisions during the year were as follows:
(In € million)
Balance at 1 January
2020 Exchange
differences
Increase from
passage of time Additions
Reclassification / Change in
consolidated group Used Released
Balance at 31 December
2020
Onerous contracts 3,955 (124) 0 547 (266) (1,058) (28) 3,026
Outstanding costs 1,214 (6) 0 434 3 (281) (44) 1,320
Aircraft financing risks (1) 5 0 0 0 0 0 2 7
Obligation from services and maintenance agreements 571 10 3 36 0 (57) (10) 553
Warranties 323 (5) (1) 82 (4) (54) (16) 325
Personnel-related provisions (2) 983 (3) 1 1,507 (11) (483) (89) 1,905
Litigation and claims (3) 911 (3) 0 255 0 (93) (176) 894
Asset retirement 203 (2) 1 1 0 0 (18) 185
Other risks and charges 2,396 (11) (2) 898 (70) (753) (110) 2,348
Total 10,561 (144) 2 3,760 (348) (2,779) (489) 10,563
(1) See “– Note 28: Sales Financing Transactions”.
(2) See “– Note 31: Personnel-Related Provisions”.
(3) See “– Note 39: Litigation and Claims”.
Provisions for onerous contracts in 2020 mainly include the utilisation and net presentation of the A380, A400M and A220 programme losses against inventories.
Personnel-related provisions include restructuring provisions and other personnel charges. For more details, see “– Note 31: Personnel-Related Provisions”.
Contingent assets and contingent liabilities — The Company is exposed to technical and commercial contingent obligations due to the nature of its businesses. To mitigate this exposure, the Company has subscribed a Global Aviation Insurance Programme (“GAP”). Information required under IAS 37
“Provisions, Contingent Assets and Contingent Liabilities” is not disclosed if the Company concludes that disclosure can be expected to prejudice seriously its position in a dispute with other parties.
For other contingent liabilities, see “– Note 39: Litigation and Claims” and “– Note 12: Revenue and Gross Margin” (mainly A400M programme).
Other commitments include contractual guarantees and performance bonds to certain customers as well as commitments for future capital expenditures and amounts which may be payable to commercial intermediaries if future sales materialise.
26. Other Financial Assets and Other Financial Liabilities
Other Financial Assets
(In € million)
31 December
2020 2019
Positive fair values of derivative financial instruments (1) 3,451 996
Others 32 37
Total non-current other financial assets 3,483 1,033
Receivables from related companies 1,158 1,148
Positive fair values of derivative financial instruments (1) 973 444
Others 301 468
Total current other financial assets 2,432 2,060
Total 5,915 3,093
(1) See “– Note 38: Financial Instruments”.
42 Airbus / Financial Statements 2020
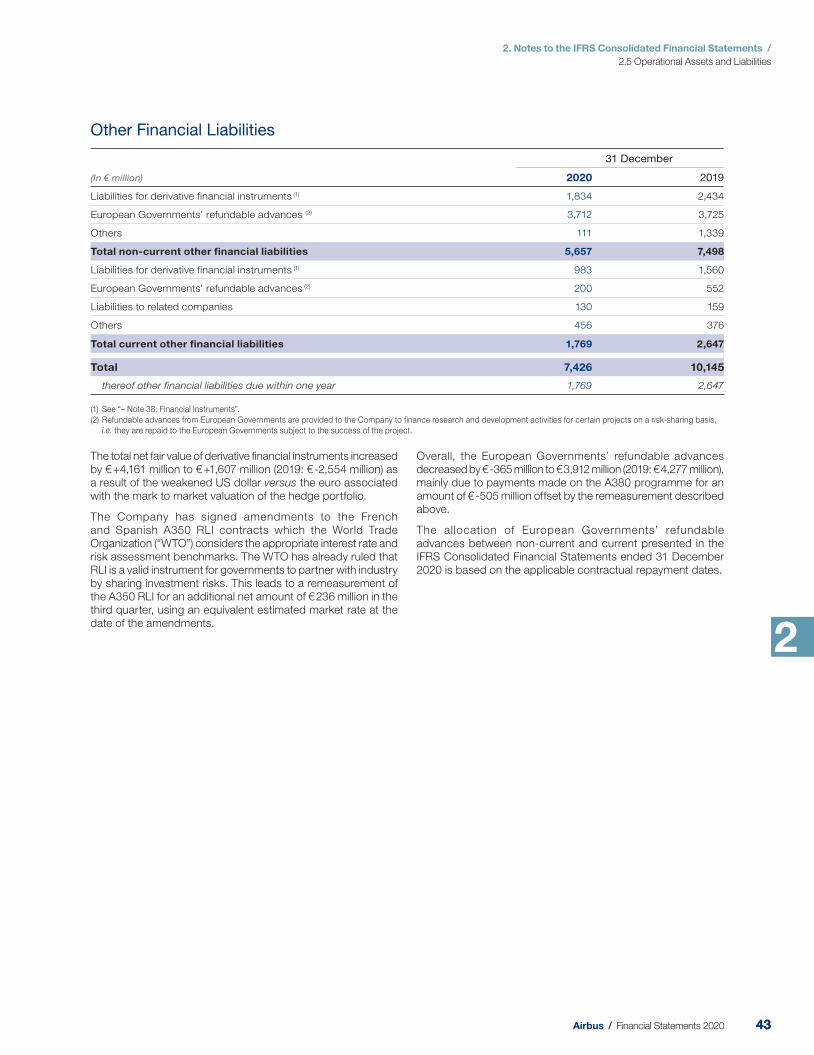
2. Notes to the IFRS Consolidated Financial Statements /
2.5 Operational Assets and Liabilities
2
Other Financial Liabilities
(In € million)
31 December
2020 2019
Liabilities for derivative financial instruments (1) 1,834 2,434
European G overnments’ refundable advances (2) 3,712 3,725
Others 111 1,339
Total non-current other financial liabilities 5,657 7,498
Liabilities for derivative financial instruments (1) 983 1,560
European G overnments’ refundable advances (2) 200 552
Liabilities to related companies 130 159
Others 456 376
Total current other financial liabilities 1,769 2,647
Total 7,426 10,145
thereof other financial liabilities due within one year 1,769 2,647
(1) See “– Note 38: Financial Instruments”.
(2) Refundable advances from European G overnments are provided to the Company to finance research and development activities for certain projects on a risk-sharing basis,
i.e. they are repaid to the European G overnments subject to the success of the project.
The total net fair value of derivative fi nancial instruments increased by € +4,161 million to € +1,607 million (2019 : € -2,554 million) as a result of the weakened US dollar versus the euro associated with the mark to market valuation of the hedge portfolio.
The Company has signed amendments to the French and Spanish A350 RLI contracts which the World Trade Organization (“WTO”) considers the appropriate interest rate and risk assessment benchmarks. The WTO has already ruled that RLI is a valid instrument for governments to partner with industry by sharing investment risks. This leads to a remeasurement of the A350 RLI for an additional net amount of € 236 million in the third quarter, using an equivalent estimated market rate at the date of the amendments.
Overall, the European G overnments’ refundable advances decreased by € -365 million to € 3,912 million (2019: € 4,277 million), mainly due to payments made on the A380 programme for an amount of € -505 million offset by the remeasurement described above.
The allocation of European G overnments’ refundable advances between non-current and current presented in the IFRS Consolidated Financial Statements ended 31 December 2020 is based on the applicable contractual repayment dates.
4343Airbus / Financial Statements 2020
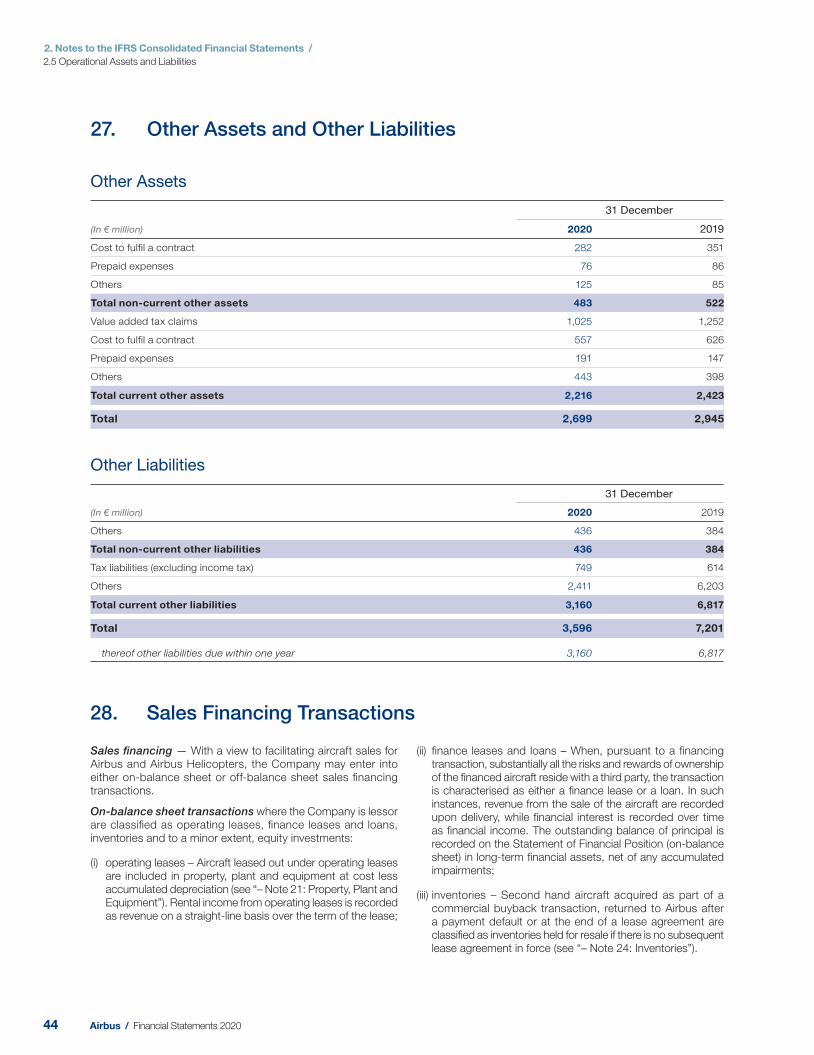
2. Notes to the IFRS Consolidated Financial Statements /
2.5 Operational Assets and Liabilities
27. Other Assets and Other Liabilities
Other Assets
(In € million)
31 December
2020 2019
Cost to fulfil a contract 282 351
Prepaid expenses 76 86
Others 125 85
Total non-current other assets 483 522
Value added tax claims 1,025 1,252
Cost to fulfil a contract 557 626
Prepaid expenses 191 147
Others 443 398
Total current other assets 2,216 2,423
Total 2,699 2,945
Other Liabilities
(In € million)
31 December
2020 2019
Others 436 384
Total non-current other liabilities 436 384
Tax liabilities (excluding income tax) 749 614
Others 2,411 6,203
Total current other liabilities 3,160 6,817
Total 3,596 7,201
thereof other liabilities due within one year 3,160 6,817
28. Sales Financing Transactions
Sales fi nancing — With a view to facilitating aircraft sales for Airbus and Airbus Helicopters, the Company may enter into either on-balance sheet or off-balance sheet sales fi nancing transactions.
On-balance sheet transactions where the Company is lessor are classifi ed as operating leases, fi nance leases and loans, inventories and to a minor extent, equity investments:
(i) operating leases – Aircraft leased out under operating leases are included in property, plant and equipment at cost less accumulated depreciation (see “– Note 21: Property, Plant and Equipment”). Rental income from operating leases is recorded as revenue on a straight-line basis over the term of the lease;
(ii) finance leases and loans – When, pursuant to a financing transaction, substantially all the risks and rewards of ownership of the financed aircraft reside with a third party, the transaction is characterised as either a finance lease or a loan. In such instances, revenue from the sale of the aircraft are recorded upon delivery, while financial interest is recorded over time as financial income. The outstanding balance of principal is recorded on the Statement of Financial Position (on-balance sheet) in long-term financial assets, net of any accumulated impairments;
(iii) inventories – Second hand aircraft acquired as part of a commercial buyback transaction, returned to Airbus after a payment default or at the end of a lease agreement are classified as inventories held for resale if there is no subsequent lease agreement in force (see “– Note 24: Inventories”).
44 Airbus / Financial Statements 2020
2. Notes to the IFRS Consolidated Financial Statements /
2.5 Operational Assets and Liabilities
2
Off-balance sheet commitments — Financing commitments are provided to the customer either as backstop commitments before delivery, asset value guarantees at delivery or counter guarantees:
(i) backstop commitments are guarantees by Airbus, made when a customer-order is placed, to provide financing to the customer in the event that the customer fails to secure sufficient funding when payment becomes due under the order. Such commitments are not considered to be part of Gross Customer Financing Exposure as (i) the financing is not in place, (ii) commitments may be transferred in full or part to third parties prior to delivery, (iii) past experience suggests it is unlikely that all such proposed financings actually will be implemented and (iv) Airbus retains the asset until the aircraft is delivered and does not incur an unusual risk in relation thereto. In order to mitigate customer credit risks for Airbus, such commitments typically contain financial conditions, such as condition precedents, which guaranteed parties must satisfy in order to benefit therefrom;
(ii) asset value guarantees are guarantees whereby Airbus guarantees a portion of the value of an aircraft at a specific date after its delivery. Airbus considers the financial risks associated with such guarantees to be acceptable, because (i) the guarantee only covers a tranche of the estimated future value of the aircraft, and its level is considered prudent in comparison to the estimated future value of each aircraft, and (ii) the exercise dates of outstanding asset value guarantees are distributed through 2031.
As of 31 December 2020, the nominal value of asset value guarantees considered as variable considerations under IFRS 15 provided to benefi ciaries amounts to € 461 million (2019: € 656 million), excluding € 8 million (2019: € 9 million) where the risk is considered to be remote. The present value of the risk inherent in asset value guarantees where a settlement is being considered probable is fully provided for and included in the total of contract liabilities for an amount of € 403 million (2019: € 551 million) (see “– Note 23: Contract Assets, Contract Liabilities and Trade Receivables, and Trade Liabilities”).
Exposure — In terms of risk management, the Company manages its gross exposure arising from its sales fi nancing activities (“Gross Customer Financing Exposure”) separately for (i) customer’s credit risk and (ii) asset value risk.
Gross Customer Financing Exposure is the sum of (i) the book value of operating leases before impairment, (ii) the outstanding principal amount of fi nance leases or loans due before impairment, (iii) the guaranteed amounts under fi nancial guarantees (iv) the book value of second hand aircraft for resale before impairment, and (v) the outstanding value of any other investment in sales fi nancing structured entities before impairment. This Gross Customer Financing Exposure may differ from the value of related assets on the Company’s Statement of Financial Position and related off-balance sheet contingent commitments, mainly because (i) assets are recorded in
compliance with IFRS, but may relate to transactions that are fi nanced on a limited recourse basis and (ii) the carrying amount of the assets on the Consolidated Statement of Financial Position may have been adjusted for impairment losses.
Gross Customer Financing Exposure amounts to US$ 0.6 billion (€ 0.5 billion) (2019: US$ 0.9 billion (€ 0.8 billion)).
Net exposure is the difference between Gross Customer Financing Exposure and the collateral value. Collateral value is assessed using a dynamic model based on the net present value of expected future receivables, expected proceeds from resale and potential cost of default. This valuation model yields results that are typically lower than residual value estimates by independent sources in order to allow for what management believes is its conservative assessment of market conditions and for repossession and transformation costs. The net exposure is provided for by way of impairment losses and other provisions.
Impairment losses and provisions — For the purpose of measuring an impairment loss, each transaction is tested individually. Impairment losses relating to aircraft under operating lease and second hand aircraft for resale (included in inventory) are recognised for any excess of the aircraft’s carrying amount over the higher of the aircraft’s value in use and its fair value less cost to sell. Finance leases and loans are measured at fair value, based on the present value of estimated future cash fl ows (including cash fl ows expected to be derived from a sale of the aircraft). Under its provisioning policy for sales fi nancing risk, Airbus and Airbus Helicopters record provisions as liabilities for estimated risk relating to off-balance sheet commitments.
Security — Sales fi nancing transactions, including those that are structured through structured entities, are generally collateralised by the underlying aircraft. Additionally, the Company benefi ts from protective covenants and from security packages tailored according to the perceived risk and the legal environment.
The Company endeavours to limit its sales fi nancing exposure by sharing its risk with third parties usually involving the creation of a structured entity. Apart from investor interest protection, interposing a structured entity offers advantages such as fl exibility, bankruptcy remoteness, liability containment and facilitating sell-downs of the aircraft fi nanced. An aircraft fi nancing structured entity is typically funded on a non-recourse basis by a senior lender and one or more providers of subordinated fi nancing. When the Company acts as a lender to such structured entities, it may take the role of the senior lender or the provider of subordinated loan. The Company consolidates an aircraft fi nancing structured entity if it is exposed to the structured entity’s variable returns and has the ability to direct the relevant remarketing activities. Otherwise, it recognises only its loan to the structured entity under other long-term fi nancial assets. At 31 December 2020 the carrying amount of its loans from aircraft fi nancing amounts to € 224 million (2019: € 349 million). This amount also represents the Company’s maximum exposure to loss from its interest in unconsolidated aircraft fi nancing structured entities.
4545Airbus / Financial Statements 2020
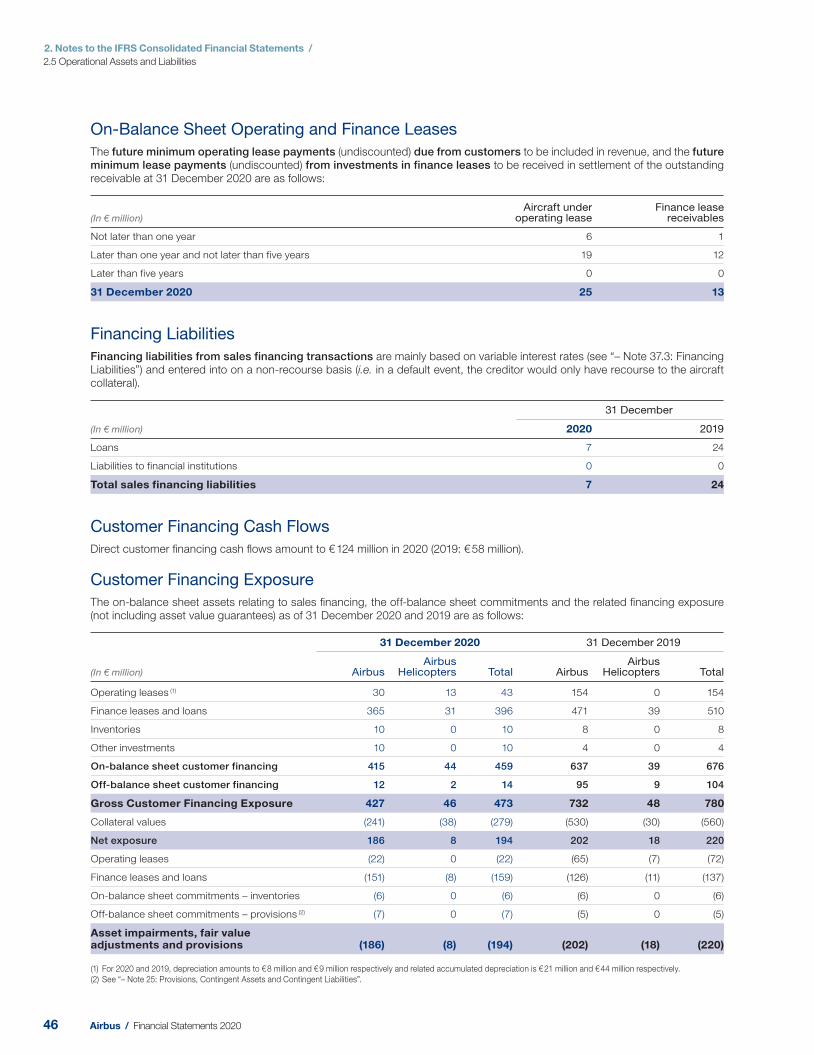
2. Notes to the IFRS Consolidated Financial Statements /
2.5 Operational Assets and Liabilities
On-Balance Sheet Operating and Finance Leases
The future minimum operating lease payments (undiscounted) due from customers to be included in revenue, and the future minimum lease payments (undiscounted) from investments in finance leases to be received in settlement of the outstanding receivable at 31 December 2020 are as fol lows:
(In € million) Aircraft under
operating lease Finance lease
receivables
Not later than one year 6 1
Later than one year and not later than five years 19 12
Later than five years 0 0
31 December 2020 25 13
Financing Liabilities
Financing liabilities from sales financing transactions are mainly based on variable interest rates (see “– Note 37.3: Financing Liabilities”) and entered into on a non-recourse basis (i.e. in a default event, the creditor would only have recourse to the aircraft collateral).
(In € million)
31 December
2020 2019
Loans 7 24
Liabilities to financial institutions 0 0
Total sales financing liabilities 7 24
Customer Financing Cash Flows
Direct customer fi nancing cash fl ows amount to € 124 million in 2020 (20 19: € 58 million).
Customer Financing Exposure
The on-balance sheet assets relating to sales fi nancing, the off-balance sheet commitments and the related fi nancing exposure (not including asset value guarantees) as of 31 D ecember 2020 and 2019 are as follows:
(In € million)
31 December 2020 31 December 2019
AirbusAirbus
Helicopters Total Airbus Airbus
Helicopters Total
Operating leases (1) 30 13 43 154 0 154
Finance leases and loans 365 31 396 471 39 510
Inventories 10 0 10 8 0 8
Other investments 10 0 10 4 0 4
On-balance sheet customer financing 415 44 459 637 39 676
Off-balance sheet customer financing 12 2 14 95 9 104
Gross Customer Financing Exposure 427 46 473 732 48 780
Collateral values (241) (38) (279) (530) (30) (560)
Net exposure 186 8 194 202 18 220
Operating leases (22) 0 (22) (65) (7) (72)
Finance leases and loans (151) (8) (159) (126) (11) (137)
On-balance sheet commitments – inventories (6) 0 (6) (6) 0 (6)
Off-balance sheet commitments – provisions (2) (7) 0 (7) (5) 0 (5)
Asset impairments, fair value adjustments and provisions (186) (8) (194) (202) (18) (220)
(1) For 2020 and 2019, depreciation amounts to € 8 million and € 9 million respectively and related accumulated depreciation is € 21 million and € 44 million respectively.
(2) See “– Note 25: Provisions, Contingent Assets and Contingent Liabilities”.
46 Airbus / Financial Statements 2020
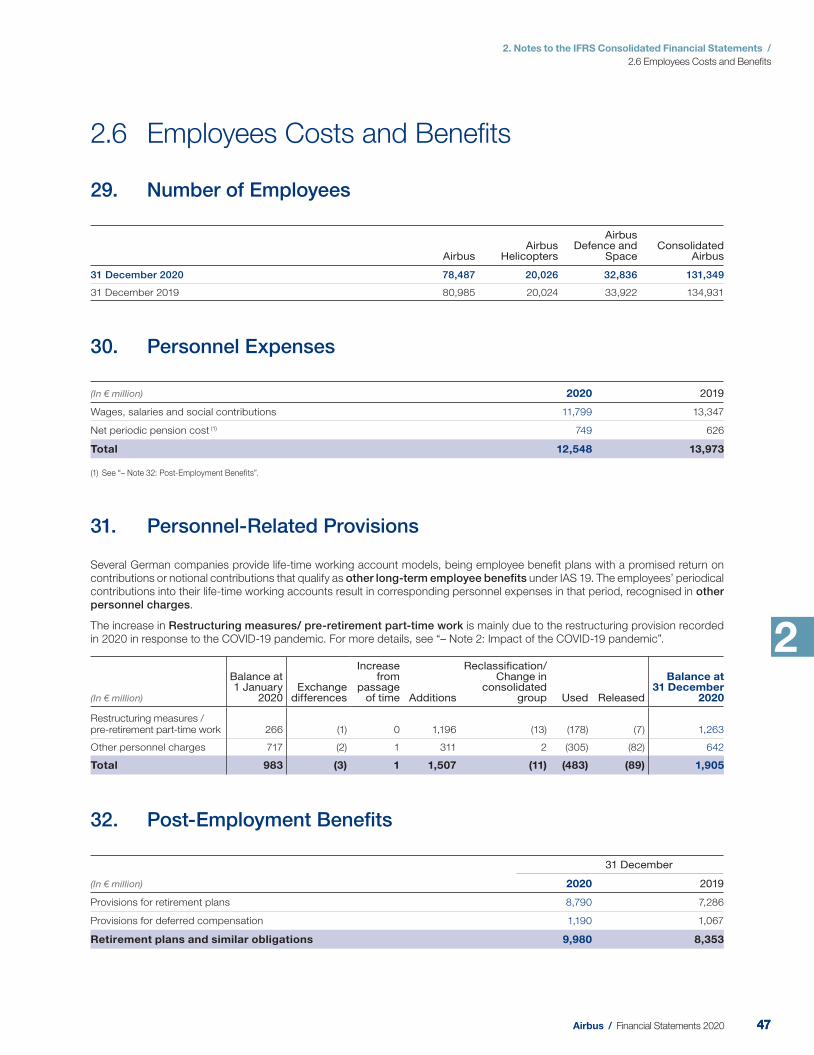
2. Notes to the IFRS Consolidated Financial Statements /
2.6 Employees Costs and Benefi ts
2
2.6 Employees Costs and Benefi ts
29. Number of Employees
Airbus Airbus
Helicopters
Airbus Defence and
Space Consolidated
Airbus
31 December 2020 78,487 20,026 32,836 131,349
31 December 2019 80,985 20,024 33,922 134,931
30. Personnel Expenses
(In € million) 2020 2019
Wages, salaries and social contributions 11,799 13,347
Net periodic pension cost (1) 749 626
Total 12,548 13,973
(1) See “– Note 32: Post-Employment Benefits”.
31. Personnel-Related Provisions
Several German companies provide life-time working account models, being employee benefi t plans with a promised return on contributions or notional contributions that qualify as other long-term employee benefits under IAS 19. The employees’ periodical contributions into their life-time working accounts result in corresponding personnel expenses in that period, recognised in other personnel charges.
The increase in Restructuring measures/ pre-retirement part-time work is mainly due to the restructuring provision recorded in 2020 in response to the COVID-19 pandemic. For more details, see “– Note 2: Impact of the COVID-19 pandemic”.
(In € million)
Balance at 1 January
2020 Exchange
differences
Increase from
passage of time Additions
Reclassification/Change in
consolidated group Used Released
Balance at 31 December
2020
Restructuring measures / pre-retirement part-time work 266 (1) 0 1,196 (13) (178) (7) 1,263
Other personnel charges 717 (2) 1 311 2 (305) (82) 642
Total 983 (3) 1 1,507 (11) (483) (89) 1,905
32. Post-Employment Benefi ts
(In € million)
31 December
2020 2019
Provisions for retirement plans 8,790 7,286
Provisions for deferred compensation 1,190 1,067
Retirement plans and similar obligations 9,980 8,353
4747Airbus / Financial Statements 2020
2. Notes to the IFRS Consolidated Financial Statements /
2.6 Employees Costs and Benefi ts
Plans description
When Company employees retire, they receive indemnities as stipulated in retirement agreements, in accordance with regulations and practices of the countries in which it operates.
Provision for deferred compensation represents obligations that arise if employees elect to convert part of their remuneration or bonus into an equivalent commitment for deferred compensation which is treated as a defi ned benefi t post-employment plan.
France — The French pension system is operated on a “pay as you go” basis. Besides the basic pension from the French social security system, each employee is entitled to receive a complementary pension from defi ned contribution schemes AGIRC-ARRCO (Association pour le régime de retraite complémentaire des salariés and Association générale des institutions de retraite des cadres). Moreover, French law stipulates that employees are paid retirement indemnities in the form of lump sums on the basis of the length of service, which are considered as defi ned benefi t obligations.
Germany — The Company has a pension plan (P3) for executive and non-executive employees in place. Under this plan, the employer provides contributions for the services rendered by the employees, which are dependent on their salaries in the respective service period. These contributions are converted into components which become part of the accrued pension liability at the end of the year. Total benefi ts are calculated as a career average over the entire period of service. Certain employees that are not covered by this plan receive retirement indemnities based on salary earned in the last year or on an average of the last three years of employment. For some executive employees, benefi ts are dependent on the fi nal salary of the respective individual at the date of retirement and the time period served as an executive.
In 2018, Airbus introduced the new Airbus Pensions Plan (“APP”) with security-linked benefi ts in Germany, which all new entrants after 1 January 2018 will join. Accordingly, the existing pension plan has been closed for new entrants. As of 1 January 2019, deferred compensation, which is fi nanced by the employees, is offered exclusively in APP for all employees. In 2020 the Company transferred about half of the active population of the P3 plan into APP. With effect as of 1 January 2020 these employees will accrue future benefi ts under APP but not in P3 anymore. Benefi ts related to past service are not affected by this transfer.
Parts of the pension obligation in Germany are funded by assets invested in specifi c funding vehicles. Besides a relief fund (“Unterstützungskasse”), the Company has implemented a Contractual Trust Arrangement. The Contractual Trust Arrangement structure is that of a bilateral trust arrangement. Assets that are transferred to the relief fund and the Contractual Trust Arrangement qualify as plan assets under IAS 19.
In the trust arrangements between the trust and the participating companies a minimum funding requirement is stipulated for the portion of the obligation, which is not protected by the pension guarantee association or Pensions-Sicherungs Verein in case of an insolvency of the subsidiaries concerned. Some portions of the obligation must be covered with securities in the same amount, while other portions must be covered by 115%.
United Kingdom — The Company UK Pension Scheme (“the Scheme”) was implemented by Airbus Defence and Space Ltd., Stevenage (UK) as the principal employer. This plan comprises all eligible employees of Airbus Defence and Space Ltd. as well
as all personnel, who were recruited by one of the Company subsidiaries located in the UK and participating in the scheme. The major part of the obligation is funded by scheme assets due to contributions of the participating companies. The Scheme is a registered pension scheme under the Finance Act 2004. The trustee’s only formal funding objective is the statutory funding objective under the Pensions Act part 6 2004, which is to have suffi cient and appropriate assets to cover the Scheme’s obligations. Since 1 November 2013, this plan is generally closed for joiners, who participate in a separate defi ned contribution plan.
Moreover, the Company participates in the UK in several funded trustee-administered pension plans for both executive and non-executive employees with BAE Systems being the principal employer. The Company’s most significant investments in terms of employees participating in these BAE Systems UK pension plans is Airbus Operations Ltd. Participating Airbus Operations Ltd. employees have continued to remain members in the BAE Systems UK pension plans due to the UK pension agreement between the Company and BAE Systems and a change in the UK pensions legislation enacted in April 2006.
For the most signifi cant of these BAE Systems Pension Schemes, the Main Scheme, BAE Systems, the Company and the scheme Trustees agreed on a sectionalisation, which was implemented on 1 April 2016. Although BAE Systems remains the only principal employer of the Scheme, the Company has obtained powers in relation to its section which are the same as if it were the principal employer.
Based on the funding situation of the respective pension schemes, the pension plan trustees determine the contribution rates to be paid by the participating employers to adequately fund the schemes. The different UK pension plans in which the Company investments participate are currently underfunded. Airbus Operations Ltd. (for its section of the Main Scheme) and BAE Systems (for the other schemes) have agreed with the trustees various measures designed to make good the underfunding. These include (i) regular contribution payments for active employees well above such which would prevail for funded plans and (ii) extra employers’ contributions.
In the event that an employer who participates in the BAE Systems pension schemes fails or cannot be compelled to fulfi l its obligations as a participating employer, the remaining participating employers are obliged to collectively take on its obligations.
The Company considers the likelihood of this event as remote. However, for the Main Scheme the Company considers that its obligation is in principle limited to that related to its section.
In addition, the Company has two guarantees to cover its obligation towards the Scheme and the BAE Systems pension schemes. To mitigate its exposure, the fi rst guarantee covers an amount up to GBP 400 million for an unlimited period of time while the second one covers an uncapped amount terminating in 2046, respectively for the Scheme and the BAE Systems Pension Schemes.
Canada — In 2018 Airbus acquired Airbus Canada Limited Partnership (“ACLP”). ACLP sponsors defi ned benefi t plans for its salaried, hourly and executive employees. In 2020 Airbus acquired Stelia Aeronautics Saint-Laurent Inc. which sponsors a defi ned benefi t plan for its salaried and hourly employees.
48 Airbus / Financial Statements 2020
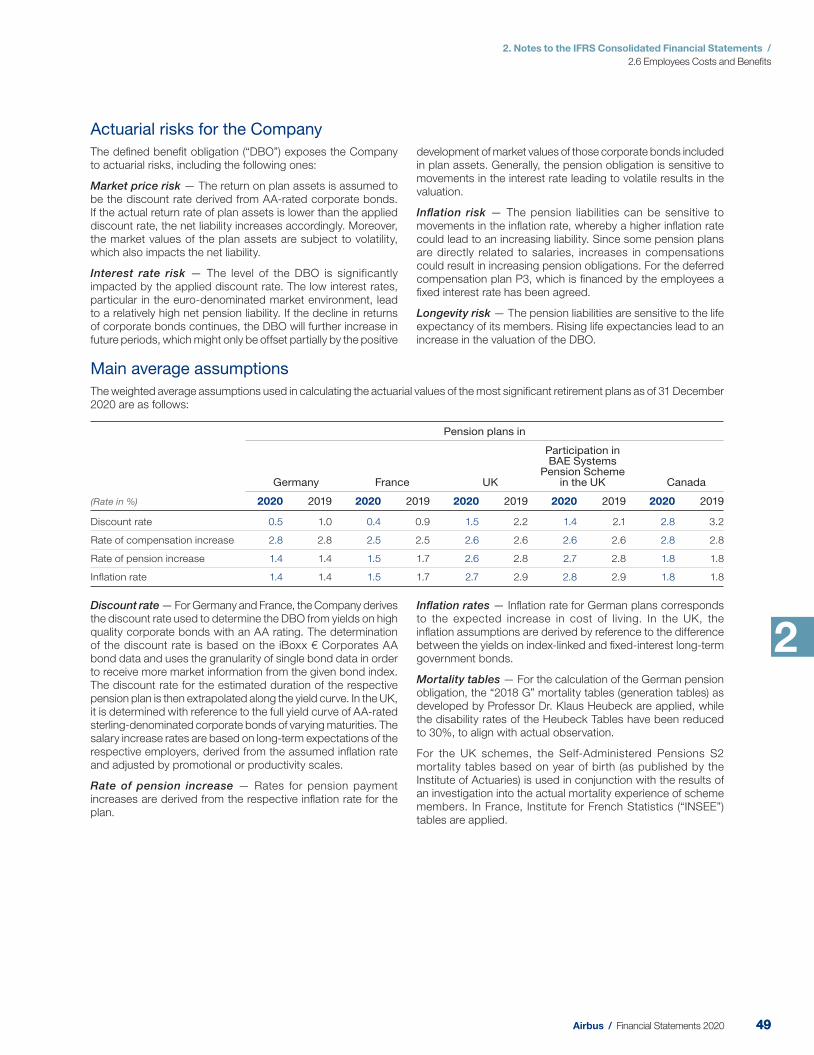
2. Notes to the IFRS Consolidated Financial Statements /
2.6 Employees Costs and Benefi ts
2
Actuarial risks for the Company
The defi ned benefi t obligation (“DBO”) exposes the Company to actuarial risks, including the following ones:
Market price risk — The return on plan assets is assumed to be the discount rate derived from AA-rated corporate bonds. If the actual return rate of plan assets is lower than the applied discount rate, the net liability increases accordingly. Moreover, the market values of the plan assets are subject to volatility, which also impacts the net liability.
Interest rate risk — The level of the DBO is significantly impacted by the applied discount rate. The low interest rates, particular in the euro-denominated market environment, lead to a relatively high net pension liability. If the decline in returns of corporate bonds continues, the DBO will further increase in future periods, which might only be offset partially by the positive
development of market values of those corporate bonds included in plan assets. Generally, the pension obligation is sensitive to movements in the interest rate leading to volatile results in the valuation.
Infl ation risk — The pension liabilities can be sensitive to movements in the infl ation rate, whereby a higher infl ation rate could lead to an increasing liability. Since some pension plans are directly related to salaries, increases in compensations could result in increasing pension obligations. For the deferred compensation plan P3, which is fi nanced by the employees a fi xed interest rate has been agreed.
Longevity risk — The pension liabilities are sensitive to the life expectancy of its members. Rising life expectancies lead to an increase in the valuation of the DBO.
Main average assumptions
The weighted average assumptions used in calculating the actuarial values of the most signifi cant retirement plans as of 31 December 2020 are as follows:
(Rate in %)
Pension plans in
Germany France UK
Participation in BAE Systems
Pension Scheme in the UK Canada
2020 2019 2020 2019 2020 2019 2020 2019 2020 2019
Discount rate 0.5 1.0 0.4 0.9 1.5 2.2 1.4 2.1 2.8 3.2
Rate of compensation increase 2.8 2.8 2.5 2.5 2.6 2.6 2.6 2.6 2.8 2.8
Rate of pension increase 1.4 1.4 1.5 1.7 2.6 2.8 2.7 2.8 1.8 1.8
Inflation rate 1.4 1.4 1.5 1.7 2.7 2.9 2.8 2.9 1.8 1.8
Discount rate — For Germany and France, the Company derives the discount rate used to determine the DBO from yields on high quality corporate bonds with an AA rating. The determination of the discount rate is based on the iBoxx € Corporates AA bond data and uses the granularity of single bond data in order to receive more market information from the given bond index. The discount rate for the estimated duration of the respective pension plan is then extrapolated along the yield curve. In the UK, it is determined with reference to the full yield curve of AA-rated sterling-denominated corporate bonds of varying maturities. The salary increase rates are based on long-term expectations of the respective employers, derived from the assumed infl ation rate and adjusted by promotional or productivity scales.
Rate of pension increase — Rates for pension payment increases are derived from the respective infl ation rate for the plan.
Infl ation rates — Infl ation rate for German plans corresponds to the expected increase in cost of living. In the UK, the infl ation assumptions are derived by reference to the difference between the yields on index-linked and fi xed-interest long-term government bonds.
Mortality tables — For the calculation of the German pension obligation, the “2018 G” mortality tables (generation tables) as developed by Professor Dr. Klaus Heubeck are applied, while the disability rates of the Heubeck Tables have been reduced to 30%, to align with actual observation.
For the UK schemes, the Self-Administered Pensions S2 mortality tables based on year of birth (as published by the Institute of Actuaries) is used in conjunction with the results of an investigation into the actual mortality experience of scheme members. In France, Institute for French Statistics (“INSEE”) tables are applied.
4949Airbus / Financial Statements 2020
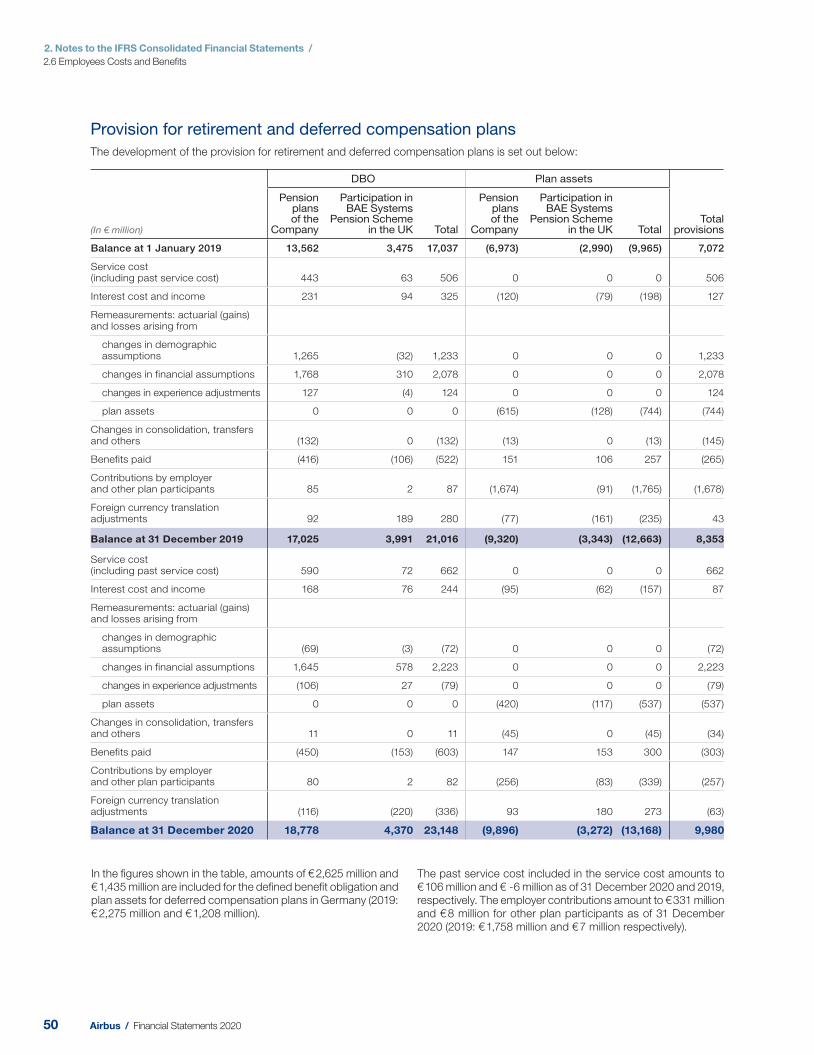
2. Notes to the IFRS Consolidated Financial Statements /
2.6 Employees Costs and Benefi ts
Provision for retirement and deferred compensation plans
The development of the provision for retirement and deferred compensation plans is set out below:
(In € million)
DBO Plan assets
Pension plans of the
Company
Participation in BAE Systems
Pension Scheme in the UK Total
Pension plans of the
Company
Participation in BAE Systems
Pension Scheme in the UK Total
Total provisions
Balance at 1 January 2019 13,562 3,475 17,037 (6,973) (2,990) (9,965) 7,072
Service cost (including past service cost) 443 63 506 0 0 0 506
Interest cost and income 231 94 325 (120) (79) (198) 127
Remeasurements: actuarial (gains) and losses arising from
changes in demographic assumptions 1,265 (32) 1,233 0 0 0 1,233
changes in financial assumptions 1,768 310 2,078 0 0 0 2,078
changes in experience adjustments 127 (4) 124 0 0 0 124
plan assets 0 0 0 (615) (128) (744) (744)
Changes in consolidation, transfers and others (132) 0 (132) (13) 0 (13) (145)
Benefits paid (416) (106) (522) 151 106 257 (265)
Contributions by employer and other plan participants 85 2 87 (1,674) (91) (1,765) (1,678)
Foreign currency translation adjustments 92 189 280 (77) (161) (235) 43
Balance at 31 December 2019 17,025 3,991 21,016 (9,320) (3,343) (12,663) 8,353
Service cost (including past service cost) 590 72 662 0 0 0 662
Interest cost and income 168 76 244 (95) (62) (157) 87
Remeasurements: actuarial (gains) and losses arising from
changes in demographic assumptions (69) (3) (72) 0 0 0 (72)
changes in financial assumptions 1,645 578 2,223 0 0 0 2,223
changes in experience adjustments (106) 27 (79) 0 0 0 (79)
plan assets 0 0 0 (420) (117) (537) (537)
Changes in consolidation, transfers and others 11 0 11 (45) 0 (45) (34)
Benefits paid (450) (153) (603) 147 153 300 (303)
Contributions by employer and other plan participants 80 2 82 (256) (83) (339) (257)
Foreign currency translation adjustments (116) (220) (336) 93 180 273 (63)
Balance at 31 December 2020 18,778 4,370 23,148 (9,896) (3,272) (13,168) 9,980
In the fi gures shown in the table, amounts of € 2,625 million and € 1,435 million are included for the defi ned benefi t obligation and plan assets for deferred compensation plans in Germany (2019: € 2,275 million and € 1,208 million).
The past service cost included in the service cost amounts to € 106 million and € -6 million as of 31 December 2020 and 2019, respectively. The employer contributions amount to € 331 million and € 8 million for other plan participants as of 31 December 2020 (2019: € 1,758 million and € 7 million respectively).
50 Airbus / Financial Statements 2020
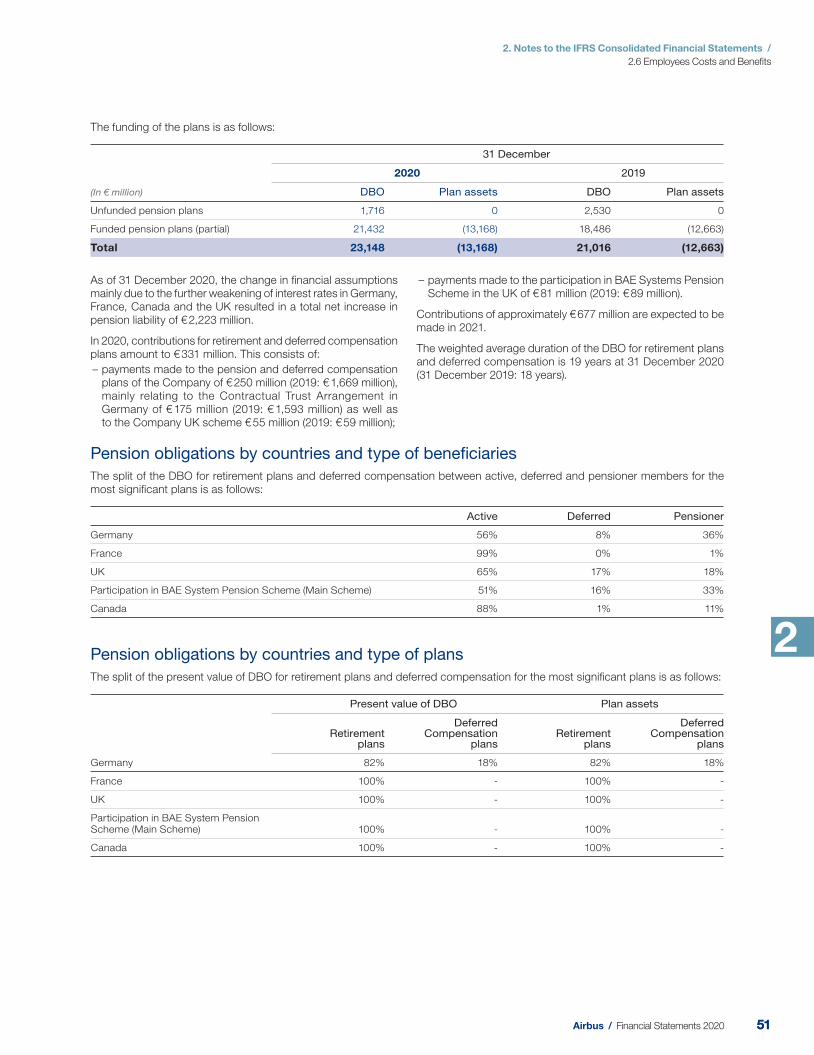
2. Notes to the IFRS Consolidated Financial Statements /
2.6 Employees Costs and Benefi ts
2
As of 31 December 2020, the change in fi nancial assumptions mainly due to the further weakening of interest rates in Germany, France, Canada and the UK resulted in a total net increase in pension liability of € 2,223 million.
In 2020, contributions for retirement and deferred compensation plans amount to € 331 million. This consists of:
– payments made to the pension and deferred compensation plans of the Company of € 250 million (2019: € 1,669 million), mainly relating to the Contractual Trust Arrangement in Germany of € 175 million (2019: € 1,593 million) as well as to the Company UK scheme € 55 million (2019: € 59 million);
– payments made to the participation in BAE Systems Pension Scheme in the UK of € 81 million (2019: € 89 million).
Contributions of approximately € 677 million are expected to be made in 2021.
The weighted ave rage duration of the DBO for retirement plans and deferred compensation is 19 years at 31 December 2020 (31 D ecember 2019: 18 y ears).
Pension obligations by countries and type of benefi ciaries
The split of the DBO for retirement plans and deferred compensation between active, deferred and pensioner members for the most signifi cant plans is as follows:
Active Deferred Pensioner
Germany 56% 8% 36%
France 99% 0% 1%
UK 65% 17% 18%
Participation in BAE System Pension Scheme (Main Scheme) 51% 16% 33%
Canada 88% 1% 11%
Pension obligations by countries and type of plans
The split of the present value of DBO for retirement plans and deferred compensation for the most signifi cant plans is as follows:
Present value of DBO Plan assets
Retirement plans
Deferred Compensation
plansRetirement
plans
Deferred Compensation
plans
Germany 82% 18% 82% 18%
France 100% - 100% -
UK 100% - 100% -
Participation in BAE System Pension Scheme (Main Scheme) 100% - 100% -
Canada 100% - 100% -
The funding of the plans is as follows:
(In € million)
31 December
2020 2019
DBO Plan assets DBO Plan assets
Unfunded pension plans 1,716 0 2,530 0
Funded pension plans (partial) 21,432 (13,168) 18,486 (12,663)
Total 23,148 (13,168) 21,016 (12,663)
5151Airbus / Financial Statements 2020
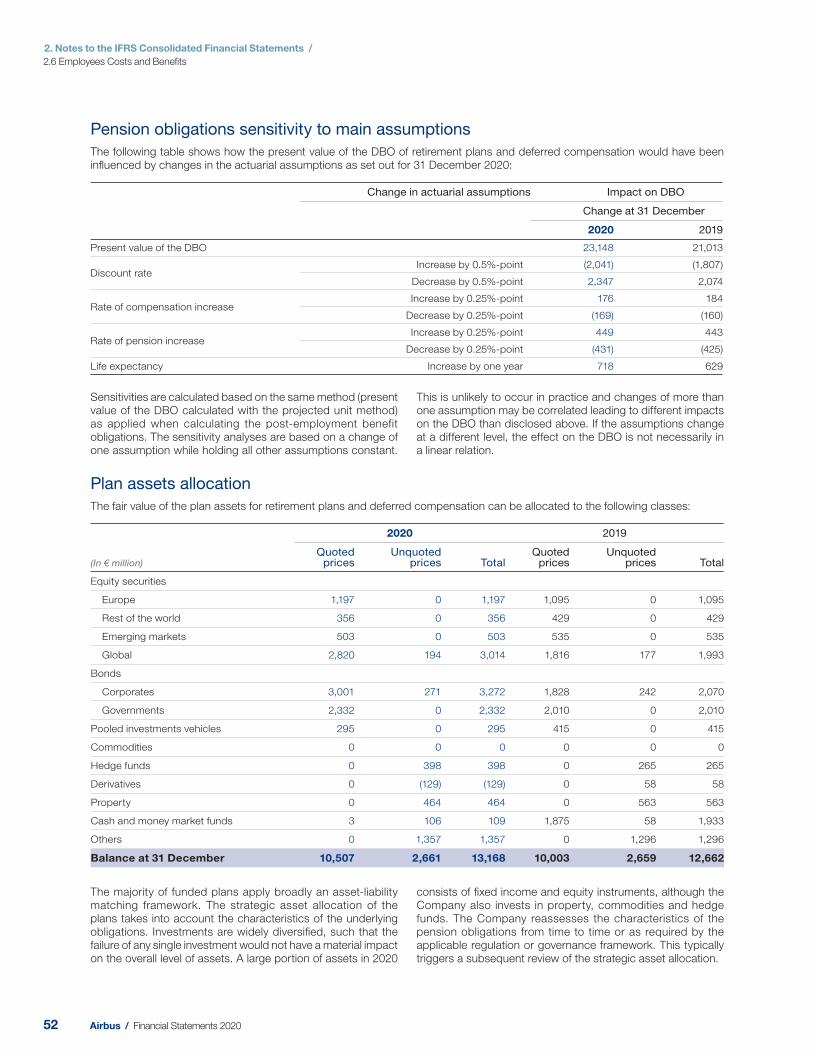
2. Notes to the IFRS Consolidated Financial Statements /
2.6 Employees Costs and Benefi ts
Pension obligations sensitivity to main assumptions
The following table shows how the present value of the DBO of retirement plans and deferred compensation would have been infl uenced by changes in the actuarial assumptions as set out for 31 December 2020:
Change in actuarial assumptions Impact on DBO
Change at 31 December
2020 2019
Present value of the DBO 23,148 21,013
Discount rate Increase by 0.5%-point (2,041) (1,807)
Decrease by 0.5%-point 2,347 2,074
Rate of compensation increase Increase by 0.25%-point 176 184
Decrease by 0.25%-point (169) (160)
Rate of pension increase Increase by 0.25%-point 449 443
Decrease by 0.25%-point (431) (425)
Life expectancy Increase by one year 718 629
Sensitivities are calculated based on the same method (present value of the DBO calculated with the projected unit method) as applied when calculating the post-employment benefit obligations. The sensitivity analyses are based on a change of one assumption while holding all other assumptions constant.
This is unlikely to occur in practice and changes of more than one assumption may be correlated leading to different impacts on the DBO than disclosed above. If the assumptions change at a different level, the effect on the DBO is not necessarily in a linear relation.
The majority of funded plans apply broadly an asset-liability matching framework. The strategic asset allocation of the plans takes into account the characteristics of the underlying obligations. Investments are widely diversifi ed, such that the failure of any single investment would not have a material impact on the overall level of assets. A large portion of assets in 2020
consists of fi xed income and equity instruments, although the Company also invests in property, commodities and hedge funds. The Company reassesses the characteristics of the pension obligations from time to time or as required by the applicable regulation or governance framework. This typically triggers a subsequent review of the strategic asset allocation.
Plan assets allocation
The fair value of the plan assets for retirement plans and deferred compensation can be allocated to the following classes:
(In € million)
2020 2019
Quoted prices
Unquotedprices Total
Quoted prices
Unquotedprices Total
Equity securities
Europe 1,197 0 1,197 1,095 0 1,095
Rest of the world 356 0 356 429 0 429
Emerging markets 503 0 503 535 0 535
Global 2,820 194 3,014 1,816 177 1,993
Bonds
Corporates 3,001 271 3,272 1,828 242 2,070
Governments 2,332 0 2,332 2,010 0 2,010
Pooled investments vehicles 295 0 295 415 0 415
Commodities 0 0 0 0 0 0
Hedge funds 0 398 398 0 265 265
Derivatives 0 (129) (129) 0 58 58
Property 0 464 464 0 563 563
Cash and money market funds 3 106 109 1,875 58 1,933
Others 0 1,357 1,357 0 1,296 1,296
Balance at 31 December 10,507 2,661 13,168 10,003 2,659 12,662
52 Airbus / Financial Statements 2020
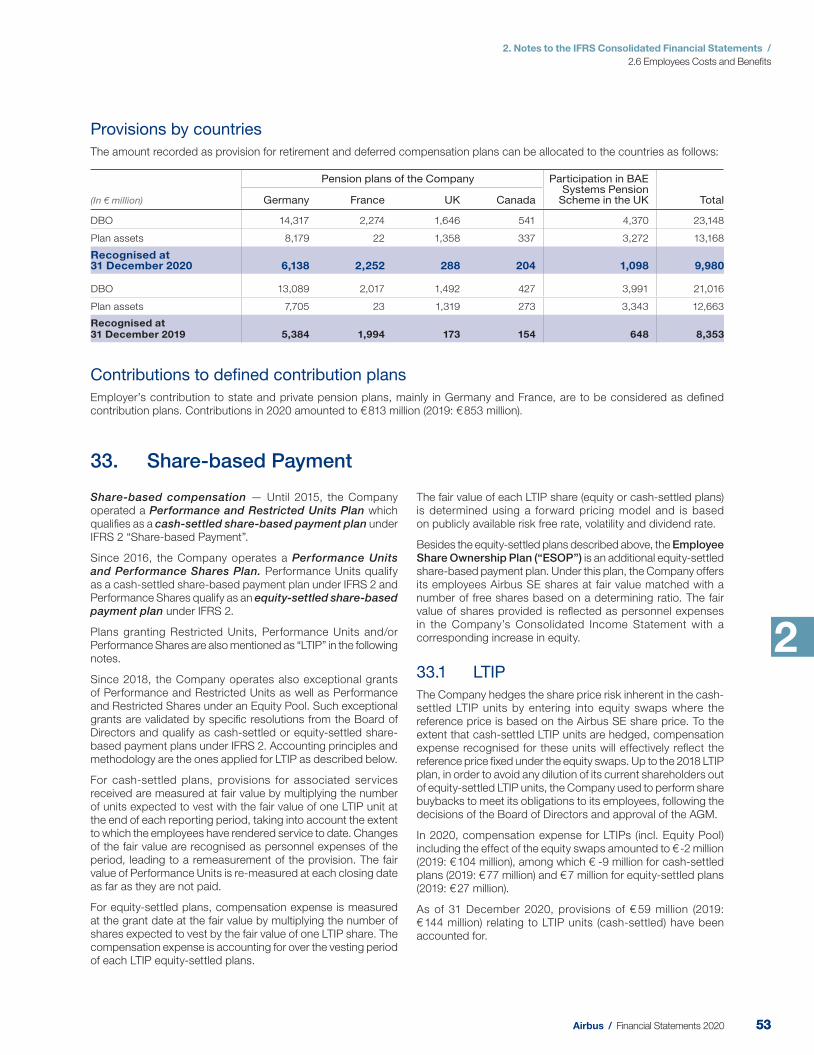
2. Notes to the IFRS Consolidated Financial Statements /
2.6 Employees Costs and Benefi ts
2
Provisions by countries
The amount recorded as provision for retirement and deferred compensation plans can be allocated to the countries as follows:
(In € million)
Pension plans of the Company Participation in BAE Systems Pension
Scheme in the UK Total Germany France UK Canada
DBO 14,317 2,274 1,646 541 4,370 23,148
Plan assets 8,179 22 1,358 337 3,272 13,168
Recognised at 31 December 2020 6,138 2,252 288 204 1,098 9,980
DBO 13,089 2,017 1,492 427 3,991 21,016
Plan assets 7,705 23 1,319 273 3,343 12,663
Recognised at 31 December 2019 5,384 1,994 173 154 648 8,353
Contributions to defi ned contribution plans
Employer’s contribution to state and private pension plans, mainly in Germany and France, are to be considered as defi ned contribution plans. Contributions in 2020 amounted to € 813 million (20 19: € 853 million).
33. Share-based Payment
Share-based compensation — Until 2015, the Company operated a Performance and Restricted Units Plan which qualifi es as a cash-settled share-based payment plan under IFRS 2 “Share-based Payment”.
Since 2016, the Company operates a Performance Units and Performance Shares Plan. Performance Units qualify as a cash-settled share-based payment plan under IFRS 2 and Performance Shares qualify as an equity-settled share-based payment plan under IFRS 2.
Plans granting Restricted Units, Performance Units and/or Performance Shares are also mentioned as “LTIP” in the following notes.
Since 2018, the Company operates also exceptional grants of Performance and Restricted Units as well as Performance and Restricted Shares under an Equity Pool. Such exceptional grants are validated by specifi c resolutions from the Board of Directors and qualify as cash-settled or equity-settled share-based payment plans under IFRS 2. Accounting principles and methodology are the ones applied for LTIP as described below.
For cash-settled plans, provisions for associated services received are measured at fair value by multiplying the number of units expected to vest with the fair value of one LTIP unit at the end of each reporting period, taking into account the extent to which the employees have rendered service to date. Changes of the fair value are recognised as personnel expenses of the period, leading to a remeasurement of the provision. The fair value of Performance Units is re-measured at each closing date as far as they are not paid.
For equity-settled plans, compensation expense is measured at the grant date at the fair value by multiplying the number of shares expected to vest by the fair value of one LTIP share. The compensation expense is accounting for over the vesting period of each LTIP equity-settled plans.
The fair value of each LTIP share (equity or cash-settled plans) is determined using a forward pricing model and is based on publicly available risk free rate, volatility and dividend rate.
Besides the equity-settled plans described above, the Employee Share Ownership Plan (“ESOP”) is an additional equity-settled share-based payment plan. Under this plan, the Company offers its employees Airbus SE shares at fair value matched with a number of free shares based on a determining ratio. The fair value of shares provided is refl ected as personnel expenses in the Company’s Consolidated Income Statement with a corresponding increase in equity.
33.1 LTIP
The Company hedges the share price risk inherent in the cash-settled LTIP units by entering into equity swaps where the reference price is based on the Airbus SE share price. To the extent that cash-settled LTIP units are hedged, compensation expense recognised for these units will effectively refl ect the reference price fi xed under the equity swaps. Up to the 2018 LTIP plan, in order to avoid any dilution of its current shareholders out of equity-settled LTIP units, the Company used to perform share buybacks to meet its obligations to its employees, following the decisions of the Board of Directors and approval of the AGM.
In 2020, compensation expense for LTIPs (incl. Equity Pool) including the effect of the equity swaps amounted to € -2 million (2019: € 104 million), among which € -9 million for cash-settled plans (2019: € 77 million) and € 7 million for equity-settled plans (2019: € 27 million).
As of 31 December 2020, provisions of € 59 million (2019: € 144 million) relating to LTIP units (cash-settled) have been accounted for.
5353Airbus / Financial Statements 2020
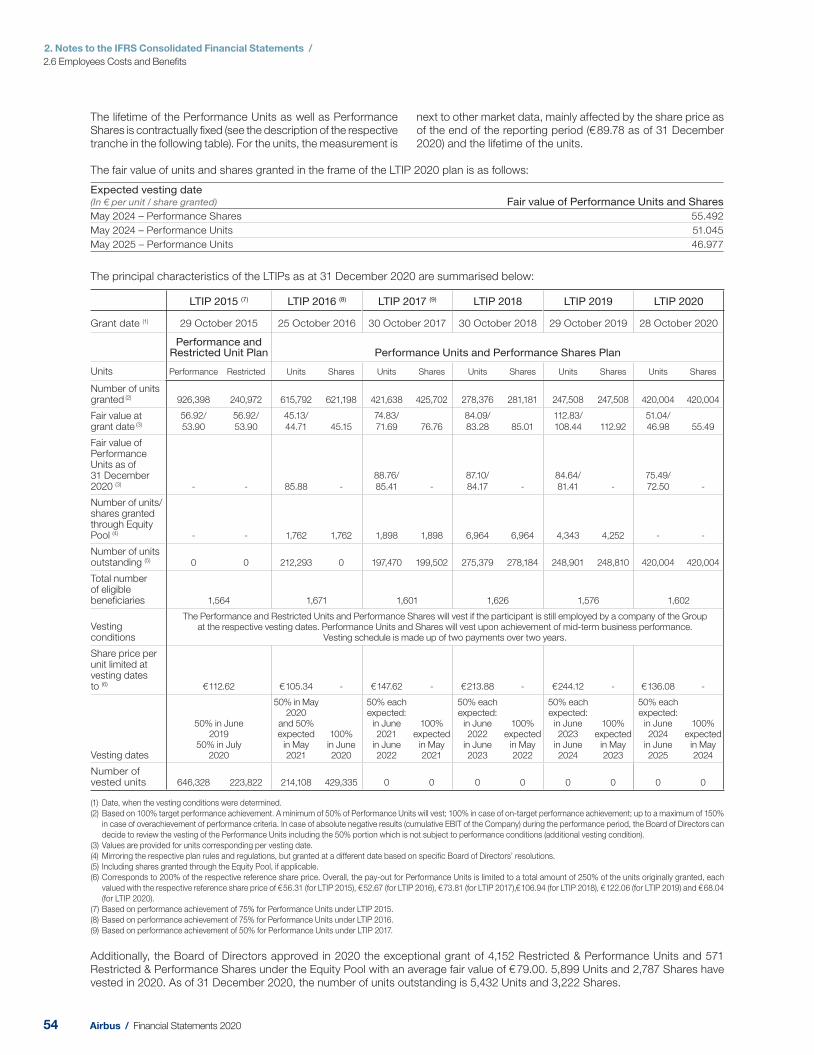
2. Notes to the IFRS Consolidated Financial Statements /
2.6 Employees Costs and Benefi ts
The lifetime of the Performance Units as well as Performance Shares is contractually fi xed (see the description of the respective tranche in the following table). For the units, the measurement is
next to other market data, mainly affected by the share price as of the end of the reporting period (€ 89.78 as of 31 December 2020) and the lifetime of the units.
The fair value of units and shares granted in the frame of the LTIP 2020 plan is as follows:
Expected vesting date (In € per unit / share granted) Fair value of Performance Units and Shares
May 2024 – Performance Shares 55.492
May 2024 – Performance Units 51.045
May 2025 – Performance Units 46.977
The principal characteristics of the LTIPs as at 31 December 2020 are summarised below:
LTIP 2015 (7) LTIP 2016 (8) LTIP 2017 (9) LTIP 2018 LTIP 2019 LTIP 2020
Grant date (1) 29 October 2015 25 October 2016 30 October 2017 30 October 2018 29 October 2019 28 October 2020
Performance and Restricted Unit Plan Performance Units and Performance Shares Plan
Units Performance Restricted Units Shares Units Shares Units Shares Units Shares Units Shares
Number of units granted (2) 926,398 240,972 615,792 621,198 421,638 425,702 278,376 281,181 247,508 247,508 420,004 420,004
Fair value at grant date (3)
56.92/
53.90
56.92/
53.90
45.13/
44.71 45.15
74.83/
71.69 76.76
84.09/
83.28 85.01
112.83/
108.44 112.92
51.04/
46.98 55.49
Fair value of Performance Units as of 31 December 2020 (3) - - 85.88 -
88.76/
85.41 -
87.10/
84.17 -
84.64/
81.41 -
75.49/
72.50 -
Number of units/shares granted through Equity Pool (4) - - 1,762 1,762 1,898 1,898 6,964 6,964 4,343 4,252 - -
Number of units outstanding (5) 0 0 212,293 0 197,470 199,502 275,379 278,184 248,901 248,810 420,004 420,004
Total number of eligible beneficiaries 1,564 1,671 1,601 1,626 1,576 1,602
Vesting conditions
The Performance and Restricted Units and Performance Shares will vest if the participant is still employed by a company of the Group at the respective vesting dates. Performance Units and Shares will vest upon achievement of mid-term business performance.
Vesting schedule is made up of two payments over two years.
Share price per unit limited at vesting dates to (6) € 112.62 € 105.34 - € 147.62 - € 213.88 - € 244.12 - € 136.08 -
Vesting dates
50% in June 2019
50% in July 2020
50% in May 2020
and 50% expected
in May 2021
100%in June 2020
50% each expected:
in June 2021
in June 2022
100% expected
in May 2021
50% each expected:
in June 2022
in June 2023
100% expected
in May 2022
50% eachexpected:
in June 2023
in June 2024
100% expected
in May 2023
50% each expected:
in June 2024
in June 2025
100% expected
in May 2024
Number of vested units 646,328 223,822 214,108 429,335 0 0 0 0 0 0 0 0
(1) Date, when the vesting conditions were determined.
(2) Based on 100% target performance achievement. A minimum of 50% of Performance Units will vest; 100% in case of on-target performance achievement; up to a maximum of 150%
in case of overachievement of performance criteria. In case of absolute negative results (cumulative EBIT of the Company) during the performance period, the Board of Directors can
decide to review the vesting of the Performance Units including the 50% portion which is not subject to performance conditions (additional vesting condition).
(3) Values are provided for units corresponding per vesting date.
(4) Mirroring the respective plan rules and regulations, but granted at a different date based on specific Board of Directors’ resolutions.
(5) Including shares granted through the Equity Pool, if applicable.
(6) Corresponds to 200% of the respective reference share price. Overall, the pay-out for Performance Units is limited to a total amount of 250% of the units originally granted, each
valued with the respective reference share price of € 56.31 (for LTIP 2015), € 52.67 (for LTIP 2016), € 73.81 (for LTIP 2017),€ 106.94 (for LTIP 2018), € 122.06 (for LTIP 2019) and € 68.04
(for LTIP 2020).
(7) Based on performance achievement of 75% for Performance Units under LTIP 2015.
(8) Based on performance achievement of 75% for Performance Units under LTIP 2016.
(9) Based on performance achievement of 50% for Performance Units under LTIP 2017.
Additionally, the Board of Directors approved in 2020 the exceptional grant of 4,152 Restricted & Performance Units and 571 Restricted & Performance Shares under the Equity Pool with an average fair value of € 79.00. 5,899 Units and 2,787 Shares have vested in 2020. As of 31 December 2020, the number of units outstanding is 5,432 Units and 3,222 Shares.
54 Airbus / Financial Statements 2020
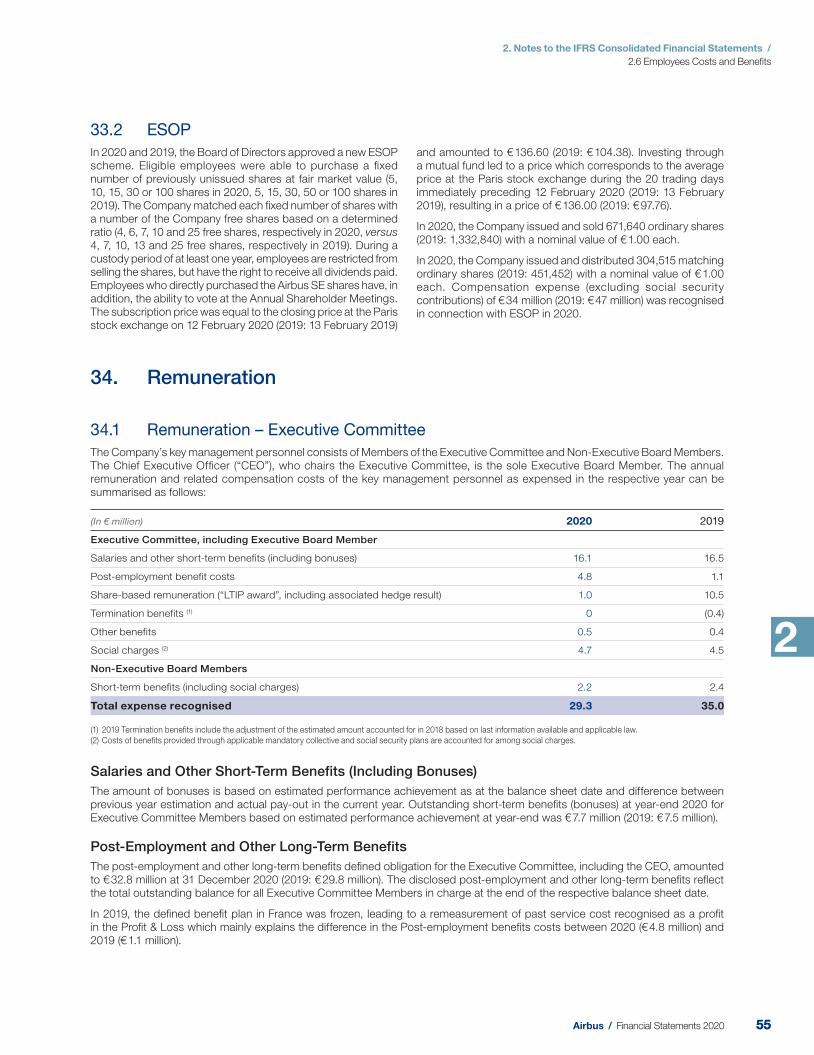
2. Notes to the IFRS Consolidated Financial Statements /
2.6 Employees Costs and Benefi ts
2
34. Remuneration
34.1 Remuneration – Executive Committee
The Company’s key management personnel consists of Members of the Executive Committee and Non-Executive Board Members. The Chief Executive Offi cer (“CEO”), who chairs the Executive Committee, is the sole Executive Board Member. The annual remuneration and related compensation costs of the key management personnel as expensed in the respective year can be summarised as follows:
(In € million) 2020 2019
Executive Committee, including Executive Board Member
Salaries and other short-term benefits (including bonuses) 16.1 16.5
Post-employment benefit costs 4.8 1.1
Share-based remuneration (“LTIP award”, including associated hedge result) 1.0 10.5
Termination benefits (1) 0 (0.4)
Other benefits 0.5 0.4
Social charges (2) 4.7 4.5
Non-Executive Board Members
Short-term benefits (including social charges) 2.2 2.4
Total expense recognised 29.3 35.0
(1) 2019 Termination benefits include the adjustment of the estimated amount accounted for in 2018 based on last information available and applicable law.
(2) Costs of benefits provided through applicable mandatory collective and social security plans are accounted for among social charges.
Salaries and Other Short-Term Benefits (Including Bonuses)
The amount of bonuses is based on estimated performance achievement as at the balance sheet date and difference between previous year estimation and actual pay-out in the current year. Outstanding short-term benefi ts (bonuses) at year-end 2020 for Executive Committee Members based on estimated performance achievement at year-end was € 7.7 million (2019: € 7.5 million).
Post-Employment and Other Long-Term Benefits
The post-employment and other long-term benefi ts defi ned obligation for the Executive Committee, including the CEO, amounted to € 32.8 million at 31 December 2020 (2019: € 29.8 million). The disclosed post-employment and other long-term benefi ts refl ect the total outstanding balance for all Executive Committee Members in charge at the end of the respective balance sheet date.
In 2019, the defi ned benefi t plan in France was frozen, leading to a remeasurement of past service cost recognised as a profi t in the Profi t & Loss which mainly explains the difference in the Post-employment benefi ts costs between 2020 (€ 4.8 million) and 2019 (€ 1.1 million).
33.2 ESOP
In 2020 and 2019, the Board of Directors approved a new ESOP scheme. Eligible employees were able to purchase a fi xed number of previously unissued shares at fair market value (5, 10, 15, 30 or 100 shares in 2020, 5, 15, 30, 50 or 100 shares in 2019). The Company matched each fi xed number of shares with a number of the Company free shares based on a determined ratio (4, 6, 7, 10 and 25 free shares, respectively in 2020, versus 4, 7, 10, 13 and 25 free shares, respectively in 2019). During a custody period of at least one year, employees are restricted from selling the shares, but have the right to receive all dividends paid. Employees who directly purchased the Airbus SE shares have, in addition, the ability to vote at the Annual Shareholder Meetings. The subscription price was equal to the closing price at the Paris stock exchange on 12 February 2020 (2019: 13 February 2019)
and amounted to € 136.60 (2019: € 104.38). Investing through a mutual fund led to a price which corresponds to the average price at the Paris stock exchange during the 20 trading days immediately preceding 12 February 2020 (2019: 13 February 2019), resulting in a price of € 136.00 (2019: € 97.76).
In 2020, the Company issued and sold 671,640 ordinary shares (2019: 1,332,840) with a nominal value of € 1.00 each.
In 2020, the Company issued and distributed 304,515 matching ordinary shares (2019: 451,452) with a nominal value of € 1.00 each. Compensation expense (excluding social security contributions) of € 34 million (2019: € 47 million) was recognised in connection with ESOP in 2020.
5555Airbus / Financial Statements 2020
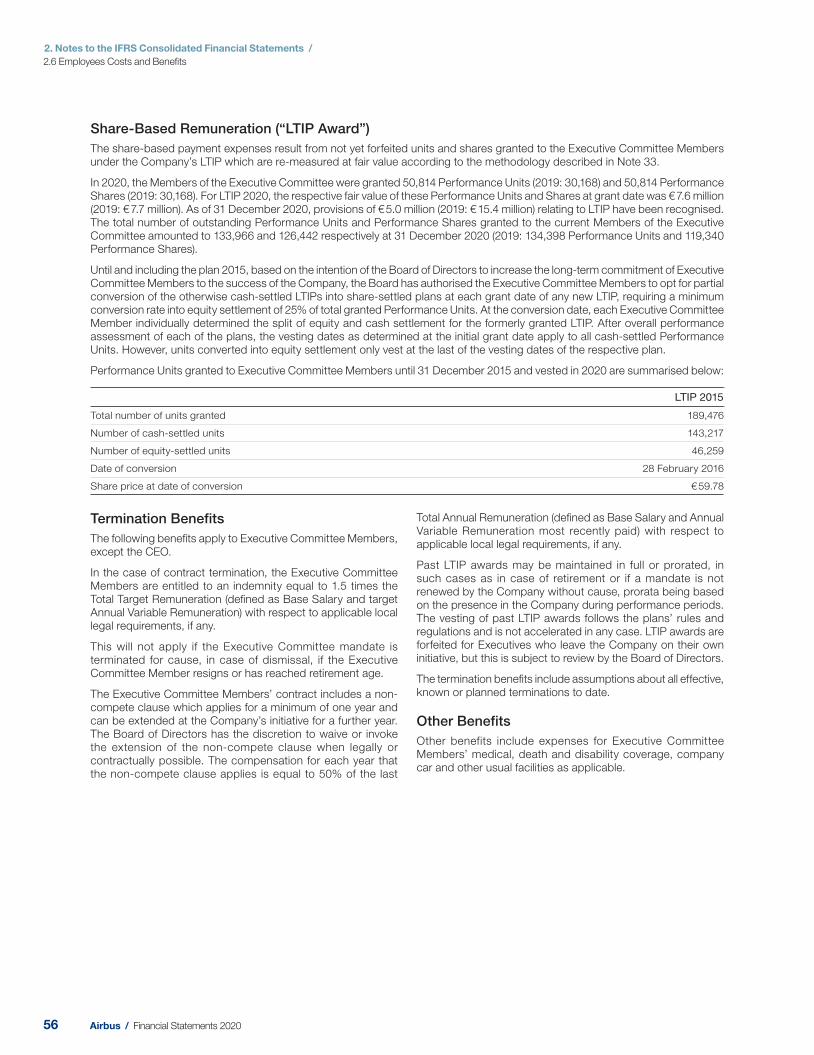
2. Notes to the IFRS Consolidated Financial Statements /
2.6 Employees Costs and Benefi ts
Share-Based Remuneration (“LTIP Award”)
The share-based payment expenses result from not yet forfeited units and shares granted to the Executive Committee Members under the Company’s LTIP which are re-measured at fair value according to the methodology described in Note 33.
In 2020, the Members of the Executive Committee were granted 50,814 Performance Units (2019: 30,168) and 50,814 Performance Shares (2019: 30,168). For LTIP 2020, the respective fair value of these Performance Units and Shares at grant date was € 7.6 million (2019: € 7.7 million). As of 31 December 2020, provisions of € 5.0 million (2019: € 15.4 million) relating to LTIP have been recognised. The total number of outstanding Performance Units and Performance Shares granted to the current Members of the Executive Committee amounted to 133,966 and 126,442 respectively at 31 December 2020 (2019: 134,398 Performance Units and 119,340 Performance Shares).
Until and including the plan 2015, based on the intention of the Board of Directors to increase the long-term commitment of Executive Committee Members to the success of the Company, the Board has authorised the Executive Committee Members to opt for partial conversion of the otherwise cash-settled LTIPs into share-settled plans at each grant date of any new LTIP, requiring a minimum conversion rate into equity settlement of 25% of total granted Performance Units. At the conversion date, each Executive Committee Member individually determined the split of equity and cash settlement for the formerly granted LTIP. After overall performance assessment of each of the plans, the vesting dates as determined at the initial grant date apply to all cash-settled Performance Units. However, units converted into equity settlement only vest at the last of the vesting dates of the respective plan.
Performance Units granted to Executive Committee Members until 31 December 2015 and vested in 2020 are summarised below:
LTIP 2015
Total number of units granted 189,476
Number of cash-settled units 143,217
Number of equity-settled units 46,259
Date of conversion 28 February 2016
Share price at date of conversion € 59.78
Termination Benefits
The following benefi ts apply to Executive Committee Members, except the CEO.
In the case of contract termination, the Executive Committee Members are entitled to an indemnity equal to 1.5 times the Total Target Remuneration (defi ned as Base Salary and target Annual Variable Remuneration) with respect to applicable local legal requirements, if any.
This will not apply if the Executive Committee mandate is terminated for cause, in case of dismissal, if the Executive Committee Member resigns or has reached retirement age.
The Executive Committee Members’ contract includes a non-compete clause which applies for a minimum of one year and can be extended at the Company’s initiative for a further year. The Board of Directors has the discretion to waive or invoke the extension of the non-compete clause when legally or contractually possible. The compensation for each year that the non-compete clause applies is equal to 50% of the last
Total Annual Remuneration (defi ned as Base Salary and Annual Variable Remuneration most recently paid) with respect to applicable local legal requirements, if any.
Past LTIP awards may be maintained in full or prorated, in such cases as in case of retirement or if a mandate is not renewed by the Company without cause, prorata being based on the presence in the Company during performance periods. The vesting of past LTIP awards follows the plans’ rules and regulations and is not accelerated in any case. LTIP awards are forfeited for Executives who leave the Company on their own initiative, but this is subject to review by the Board of Directors.
The termination benefi ts include assumptions about all effective, known or planned terminations to date.
Other Benefits
Other benefits include expenses for Executive Committee Members’ medical, death and disability coverage, company car and other usual facilities as applicable.
56 Airbus / Financial Statements 2020
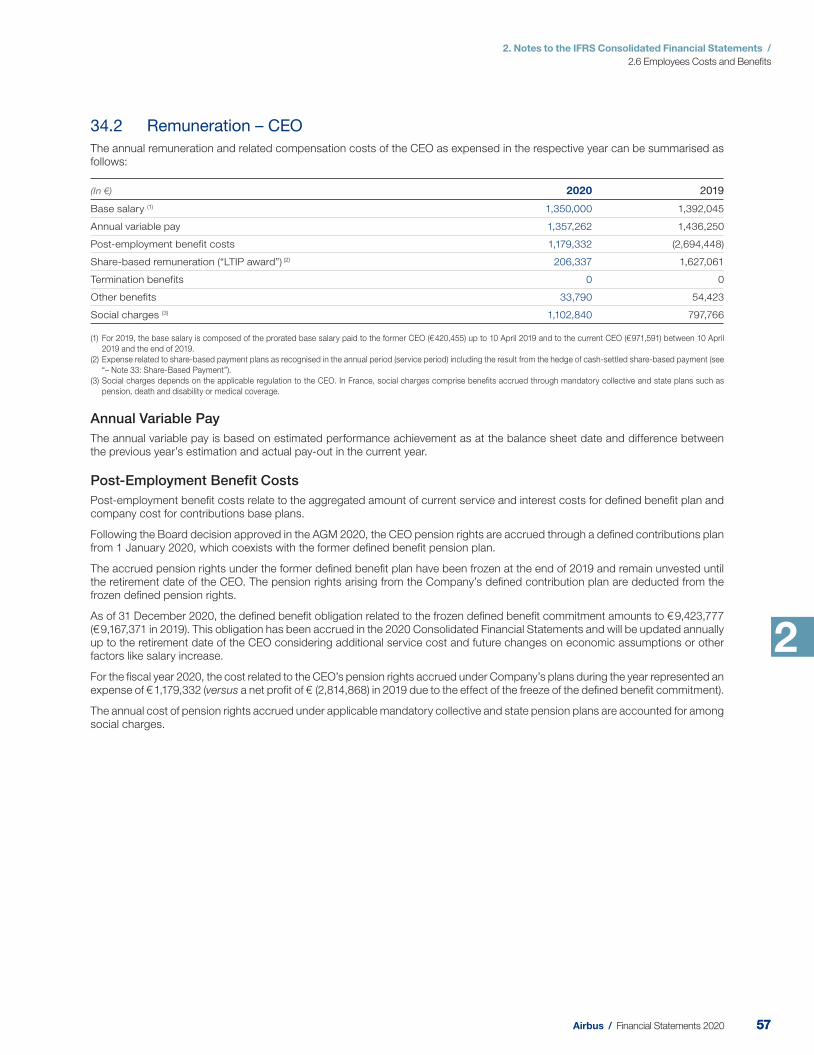
2. Notes to the IFRS Consolidated Financial Statements /
2.6 Employees Costs and Benefi ts
2
34.2 Remuneration – CEO
The annual remuneration and related compensation costs of the CEO as expensed in the respective year can be summarised as follows:
(In €) 2020 2019
Base salary (1) 1,350,000 1,392,045
Annual variable pay 1,357,262 1,436,250
Post-employment benefit costs 1,179,332 (2,694,448)
Share-based remuneration (“LTIP award”) (2) 206,337 1,627,061
Termination benefits 0 0
Other benefits 33,790 54,423
Social charges (3) 1,102,840 797,766
(1) For 2019, the base salary is composed of the prorated base salary paid to the former CEO (€ 420,455) up to 10 April 2019 and to the current CEO (€ 971,591) between 10 April
2019 and the end of 2019.
(2) Expense related to share-based payment plans as recognised in the annual period (service period) including the result from the hedge of cash-settled share-based payment (see
“– Note 33: Share-Based Payment”).
(3) Social charges depends on the applicable regulation to the CEO. In France, social charges comprise benefits accrued through mandatory collective and state plans such as
pension, death and disability or medical coverage.
Annual Variable Pay
The annual variable pay is based on estimated performance achievement as at the balance sheet date and difference between the previous year’s estimation and actual pay-out in the current year.
Post-Employment Benefit Costs
Post-employment benefi t costs relate to the aggregated amount of current service and interest costs for defi ned benefi t plan and company cost for contributions base plans.
Following the Board decision approved in the AGM 2020, the CEO pension rights are accrued through a defi ned contributions plan from 1 January 2020, which coexists with the former defi ned benefi t pension plan.
The accrued pension rights under the former defi ned benefi t plan have been frozen at the end of 2019 and remain unvested until the retirement date of the CEO. The pension rights arising from the Company’s defi ned contribution plan are deducted from the frozen defi ned pension rights.
As of 31 December 2020, the defi ned benefi t obligation related to the frozen defi ned benefi t commitment amounts to € 9,423,777 (€ 9,167,371 in 2019). This obligation has been accrued in the 2020 Consolidated Financial Statements and will be updated annually up to the retirement date of the CEO considering additional service cost and future changes on economic assumptions or other factors like salary increase.
For the fi scal year 2020, the cost related to the CEO’s pension rights accrued under Company’s plans during the year represented an expense of € 1,179,332 (versus a net profi t of € (2,814,868) in 2019 due to the effect of the freeze of the defi ned benefi t commitment).
The annual cost of pension rights accrued under applicable mandatory collective and state pension plans are accounted for among social charges.
5757Airbus / Financial Statements 2020
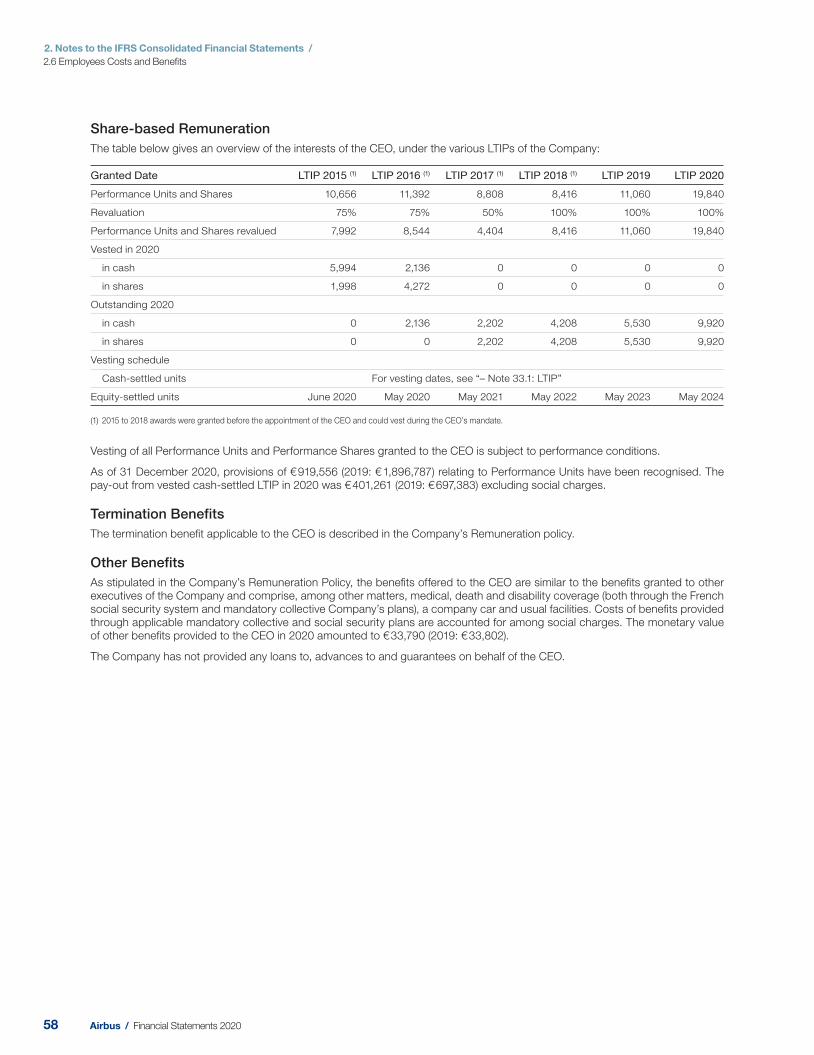
2. Notes to the IFRS Consolidated Financial Statements /
2.6 Employees Costs and Benefi ts
Share-based Remuneration
The table below gives an overview of the interests of the CEO, under the various LTIPs of the Company:
Granted Date LTIP 2015 (1) LTIP 2016 (1) LTIP 2017 (1) LTIP 2018 (1) LTIP 2019 LTIP 2020
Performance Units and Shares 10,656 11,392 8,808 8,416 11,060 19,840
Revaluation 75% 75% 50% 100% 100% 100%
Performance Units and Shares revalued 7,992 8,544 4,404 8,416 11,060 19,840
Vested in 2020
in cash 5,994 2,136 0 0 0 0
in shares 1,998 4,272 0 0 0 0
Outstanding 2020
in cash 0 2,136 2,202 4,208 5,530 9,920
in shares 0 0 2,202 4,208 5,530 9,920
Vesting schedule
Cash-settled units For vesting dates, see “– Note 33.1: LTIP”
Equity-settled units June 2020 May 2020 May 2021 May 2022 May 2023 May 2024
(1) 2015 to 2018 awards were granted before the appointment of the CEO and could vest during the CEO’s mandate.
Vesting of all Performance Units and Performance Shares granted to the CEO is subject to performance conditions.
As of 31 December 2020, provisions of € 919,556 (2019: € 1,896,787) relating to Performance Units have been recognised. The pay-out from vested cash-settled LTIP in 2020 was € 401,261 (2019: € 697,383) excluding social charges.
Termination Benefits
The termination benefi t applicable to the CEO is described in the Company’s Remuneration policy.
Other Benefits
As stipulated in the Company’s Remuneration Policy, the benefi ts offered to the CEO are similar to the benefi ts granted to other executives of the Company and comprise, among other matters, medical, death and disability coverage (both through the French social security system and mandatory collective Company’s plans), a company car and usual facilities. Costs of benefi ts provided through applicable mandatory collective and social security plans are accounted for among social charges. The monetary value of other benefi ts provided to the CEO in 2020 amounted to € 33,790 (2019: € 33,802).
The Company has not provided any loans to, advances to and guarantees on behalf of the CEO.
58 Airbus / Financial Statements 2020
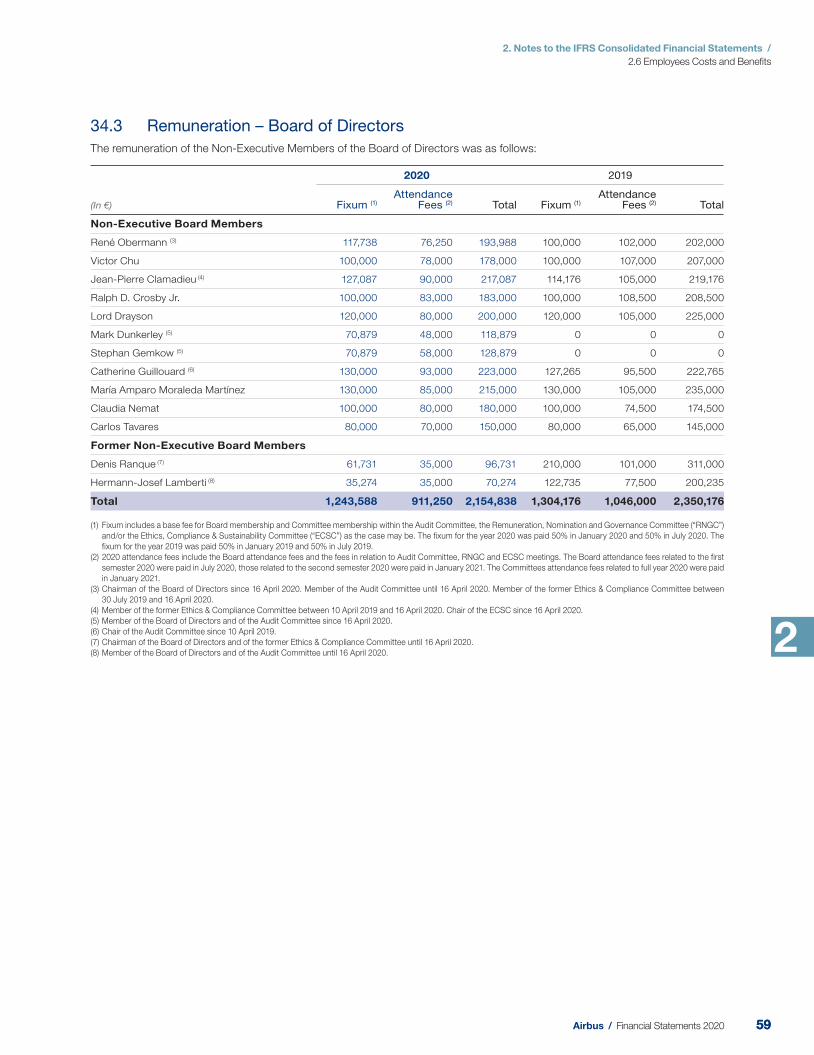
2. Notes to the IFRS Consolidated Financial Statements /
2.6 Employees Costs and Benefi ts
2
34.3 Remuneration – Board of Directors
The remuneration of the Non-Executive Members of the Board of Directors was as follows:
(In €)
2020 2019
Fixum (1)Attendance
Fees (2) Total Fixum (1)Attendance
Fees (2) Total
Non-Executive Board Members
René Obermann (3) 117,738 76,250 193,988 100,000 102,000 202,000
Victor Chu 100,000 78,000 178,000 100,000 107,000 207,000
Jean-Pierre Clamadieu (4) 127,087 90,000 217,087 114,176 105,000 219,176
Ralph D. Crosby Jr. 100,000 83,000 183,000 100,000 108,500 208,500
Lord Drayson 120,000 80,000 200,000 120,000 105,000 225,000
Mark Dunkerley (5) 70,879 48,000 118,879 0 0 0
Stephan Gemkow (5) 70,879 58,000 128,879 0 0 0
Catherine Guillouard (6) 130,000 93,000 223,000 127,265 95,500 222,765
María Amparo Moraleda Martínez 130,000 85,000 215,000 130,000 105,000 235,000
Claudia Nemat 100,000 80,000 180,000 100,000 74,500 174,500
Carlos Tavares 80,000 70,000 150,000 80,000 65,000 145,000
Former Non-Executive Board Members
Denis Ranque (7) 61,731 35,000 96,731 210,000 101,000 311,000
Hermann-Josef Lamberti (8) 35,274 35,000 70,274 122,735 77,500 200,235
Total 1,243,588 911,250 2,154,838 1,304,176 1,046,000 2,350,176
(1) Fixum includes a base fee for Board membership and Committee membership within the Audit Committee, the Remuneration, Nomination and Governance Committee (“RNGC”)
and/or the Ethics, Compliance & Sustainability Committee (“ECSC”) as the case may be. The fixum for the year 2020 was paid 50% in January 2020 and 50% in July 2020. The
fixum for the year 2019 was paid 50% in January 2019 and 50% in July 2019.
(2) 2020 attendance fees include the Board attendance fees and the fees in relation to Audit Committee, RNGC and ECSC meetings. The Board attendance fees related to the first
semester 2020 were paid in July 2020, those related to the second semester 2020 were paid in January 2021. The Committees attendance fees related to full year 2020 were paid
in January 2021.
(3) Chairman of the Board of Directors since 16 April 2020. Member of the Audit Committee until 16 April 2020. Member of the former Ethics & Compliance Committee between
30 July 2019 and 16 April 2020.
(4) Member of the former Ethics & Compliance Committee between 10 April 2019 and 16 April 2020. Chair of the ECSC since 16 April 2020.
(5) Member of the Board of Directors and of the Audit Committee since 16 April 2020.
(6) Chair of the Audit Committee since 10 April 2019.
(7) Chairman of the Board of Directors and of the former Ethics & Compliance Committee until 16 April 2020.
(8) Member of the Board of Directors and of the Audit Committee until 16 April 2020.
5959Airbus / Financial Statements 2020
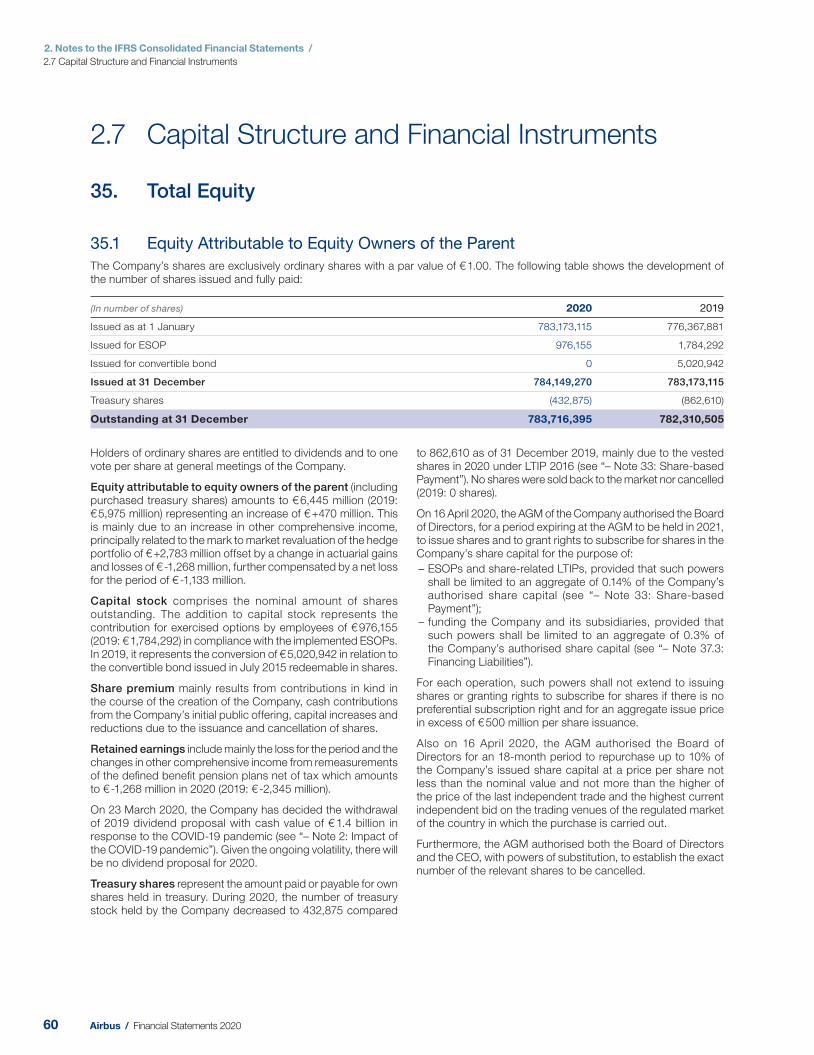
2. Notes to the IFRS Consolidated Financial Statements /
2.7 Capital Structure and Financial Instruments
2.7 Capital Structure and Financial Instruments
35. Total Equity
35.1 Equity Attributable to Equity Owners of the Parent
The Company’s shares are exclusively ordinary shares with a par value of € 1.00. The following table shows the development of the number of shares issued and fully paid:
(In number of shares) 2020 2019
Issued as at 1 January 783,173,115 776,367,881
Issued for ESOP 976,155 1,784,292
Issued for convertible bond 0 5,020,942
Issued at 31 December 784,149,270 783,173,115
Treasury shares (432,875) (862,610)
Outstanding at 31 December 783,716,395 782,310,505
Holders of ordinary shares are entitled to dividends and to one vote per share at general meetings of the Company.
Equity attributable to equity owners of the parent (including purchased treasury shares) amounts to € 6,445 million (2019: € 5,975 million) representing an increase of € +470 million. This is mainly due to an increase in other comprehensive income, principally related to the mark to market revaluation of the hedge portfolio of € +2,783 million offset by a change in actuarial gains and losses of € -1,268 million, further compensated by a net loss for the period of € -1,133 million.
Capital stock comprises the nominal amount of shares outstanding. The addition to capital stock represents the contribution for exercised options by employees of € 976,155 (2019: € 1,784,292) in compliance with the implemented ESOPs. In 2019, it represents the conversion of € 5,020,942 in relation to the convertible bond issued in July 2015 redeemable in shares.
Share premium mainly results from contributions in kind in the course of the creation of the Company, cash contributions from the Company’s initial public offering, capital increases and reductions due to the issuance and cancellation of shares.
Retained earnings include mainly the loss for the period and the changes in other comprehensive income from remeasurements of the defi ned benefi t pension plans net of tax which amounts to € -1,268 million in 2020 (2019: € -2,345 milli on).
On 23 March 2020, the Company has decided the withdrawal of 2019 dividend proposal with cash value of € 1.4 billion in response to the COVID-19 pandemic (see “– Note 2: Impact of the COVID-19 pandemic”). Given the ongoing volatility, there will be no dividend proposal for 2020.
Treasury shares represent the amount paid or payable for own shares held in treasury. During 2020, the number of treasury stock held by the Company decreased to 432,875 compared
to 862,610 as of 31 December 2019, mainly du e to the vested shares in 2020 under LTIP 2016 (see “– Note 33: Share-based Payment”). No shares were sold back to the market nor cancelled (2019: 0 shares).
On 16 Apr il 2020, the AGM of t he Company authorised the Board of Directors, for a period expiring at the AGM to be held in 2021, to issue shares and t o grant rights to subscribe for shares in the Company’s share capital for the purpose of:
– ESOPs and share-related LTIPs, provided that such powers shall be limited to an aggregate of 0.14% of the Company’s authorised share capital (see “– Note 33: Share-based Payment”);
– funding the Company and its subsidiaries, provided that such powers shall be limited to an aggregate of 0.3% of the Company’s authorised share capital (see “– Note 37.3: Financing Liabilities”).
For each operation, such powers shall not extend to issuing shares or granting rights to subscribe for shares if there is no preferential subscription right and for an aggregate issue price in excess of € 500 million per share issuance.
Also on 16 April 2020, the AGM authorise d the Board of Directors for an 18-month period to repurchase up to 10% of the Company’s issued share capital at a price per share not less than the nominal value and not more than the higher of the price of the last independent trade and the highest current independent bid on the trading venues of the regulated market of the country in which the purchase is carried out.
Furthermore, the AGM authorised both the Board of Directors and the CEO, with powers of substitution, to establish the exact number of the relevant shares to be cancelled.
60 Airbus / Financial Statements 2020
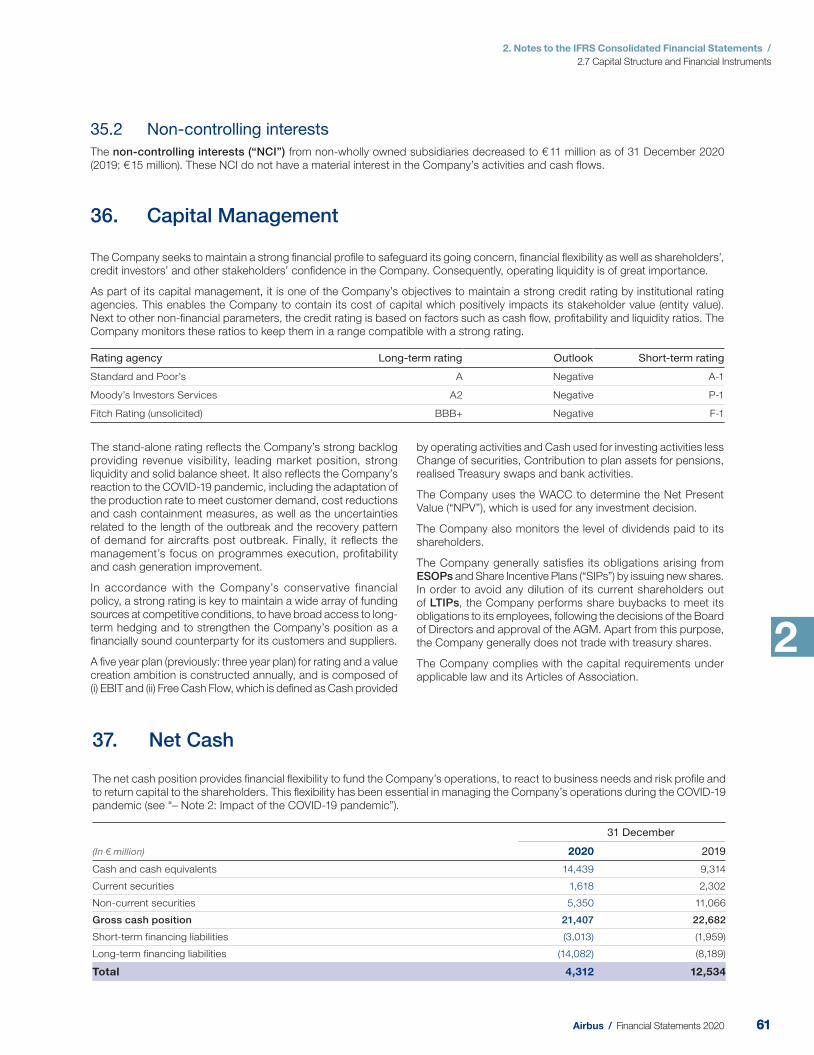
2. Notes to the IFRS Consolidated Financial Statements /
2.7 Capital Structure and Financial Instruments
2
36. Capital Management
The Company seeks to maintain a strong fi nancia l profi le to safeguard its going concern, fi nancial fl exibility as well as shareholders’, credit investors’ and other stakeholders’ confi dence in the Company. Consequently, operating liquidity is of great importance.
As part of its capital management, it is one of the Company’s objectives to maintain a strong credit rating by institutional rating agencies. This enables the Company to contain its cost of capital which positively impacts its stakeholder value (entity value). Next to other non-fi nancial parameters, the credit rating is based on factors such as cash fl ow, profi tability and liquidity ratios. The Company monitors these ratios to keep them in a range compatible with a strong rating.
Rating agency Long-term rating Outlook Short-term rating
Standard and Poor’s A Negative A-1
Moody’s Investors Services A2 Negative P-1
Fitch Rating (unsolicited) BBB+ Negative F-1
The stand-alone rating refl ects the Company’s strong backlog providing revenue visibility, leading market position, strong liquidity and solid balance sheet. It also refl ects the Company’s reaction to the COVID-19 pandemic, including the adaptation of the production rate to meet customer demand, cost reductions and cash containment measures, as well as the uncertainties related to the length of the outbreak and the recovery pattern of demand for aircrafts post outbreak. Finally, it refl ects the management’s focus on programmes execution, profi tability and cash generation improvement.
In accordance with the Company’s conservative financial policy, a strong rating is key to maintain a wide array of funding sources at competitive conditions, to have broad access to long-term hedging and to strengthen the Company’s position as a fi nancially sound counterparty for its customers and suppliers.
A fi ve year plan (previously: three year plan) for rating and a value creation ambition is constructed annually, and is composed of (i) EBIT and (ii) Free Cash Flow, which is defi ned as Cash provided
by operating activities and Cash used for investing activities less Change of securities, Contribution to plan assets for pensions, realised Treasury swaps and bank activities.
The Company uses the WACC to determine the Net Present Value (“NPV”), which is used for any investment decision.
The Company also monitors the level of dividends paid to its shareholders.
The Company generally satisfi es its obligations arising from ESOPs and Share Incentive Plans (“SIPs”) by issuing new shares. In order to avoid any dilution of its current shareholders out of LTIPs, the Company performs share buybacks to meet its obligations to its employees, following the decisions of the Board of Directors and approval of the AGM. Apart from this purpose, the Company generally does not trade with treasury shares.
The Company complies with the capital requirements under applicable law and its Articles of Association.
35.2 Non-controlling interests
The non-controlling interests (“NCI”) from non-wholly owned subsidiaries decreased to € 11 million as of 31 December 2020 (2019: € 15 million). These NCI do not have a material interest in the Company’s activities and cash fl ows.
37. Net Cash
The net cash position provides fi nancial fl exibility to fund the Company’s operations, to react to business needs and risk profi le and to return capital to the shareholders. This fl exibility has been essential in managing the Company’s operations during the COVID-19 pandemic (see “– Note 2: Impact of the COVID-19 pandemic”).
(In € million)
31 December
2020 2019
Cash and cash equivalents 14,439 9,314
Current securities 1,618 2,302
Non-current securities 5,350 11,066
Gross cash position 21,407 22,682
Short-term financing liabilities (3,013) (1,959)
Long-term financing liabilities (14,082) (8,189)
Total 4,312 12,534
6161Airbus / Financial Statements 2020
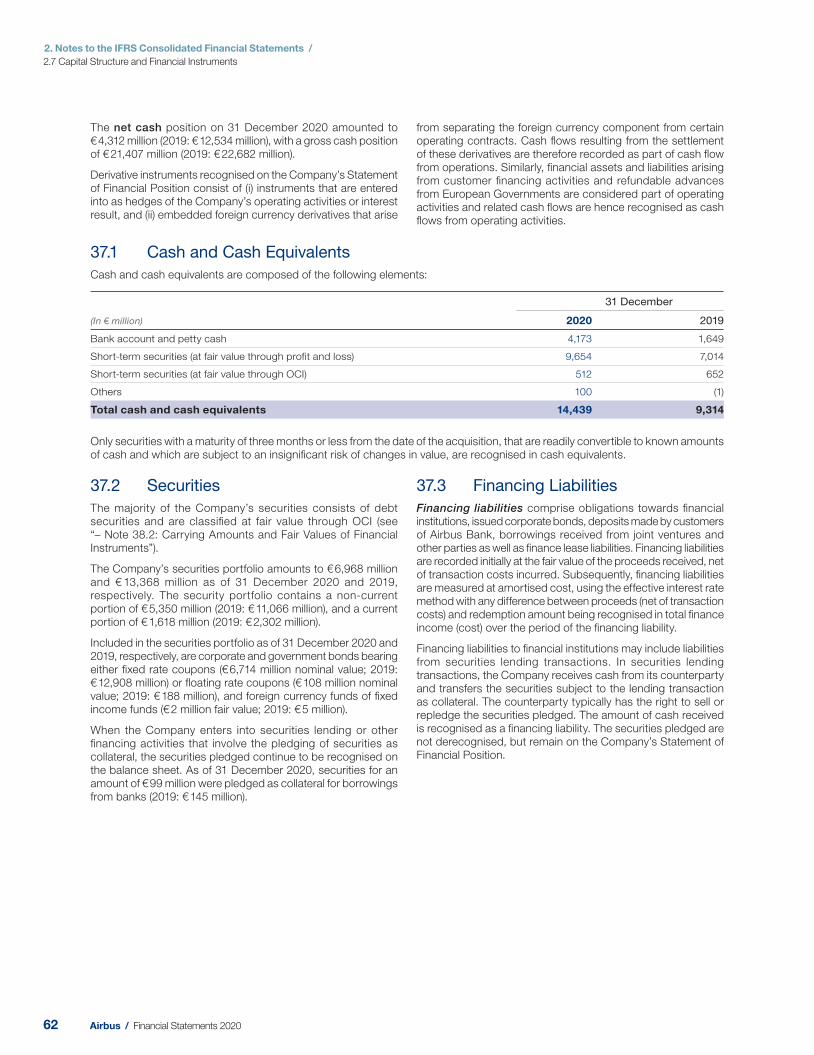
2. Notes to the IFRS Consolidated Financial Statements /
2.7 Capital Structure and Financial Instruments
The net cash position on 31 December 2020 amounted to € 4,312 million (2019: € 12,534 million), with a gross cash position of € 21,407 million (2019: € 22,682 million).
Derivative instruments recognised on the Company’s Statement of Financial Position consist of (i) instruments that are entered into as hedges of the Company’s operating activities or interest result, and (ii) embedded foreign currency derivatives that arise
from separating the foreign currency component from certain operating contracts. Cash fl ows resulting from the settlement of these derivatives are therefore recorded as part of cash fl ow from operations. Similarly, fi nancial assets and liabilities arising from customer fi nancing activities and refundable advances from European G overnments are considered part of operating activities and related cash fl ows are hence recognised as cash fl ows from operating activities.
37.1 Cash and Cash Equivalents
Cash and cash equivalents are composed of the following elements:
(In € million)
31 December
2020 2019
Bank account and petty cash 4,173 1,649
Short-term securities (at fair value through profit and loss) 9,654 7,014
Short-term securities (at fair value through OCI) 512 652
Others 100 (1)
Total cash and cash equivalents 14,439 9,314
Only securities with a maturity of three months or less from the date of the acquisition, that are readily convertible to known amounts of cash and which are subject to an insignifi cant risk of changes in value, are recognised in cash equivalents.
37.2 Securities
The majority of the Company’s securities consists of debt securities and are classifi ed at fair value through OCI (see “– Note 38.2: Carrying Amounts and Fair Values of Financial Instruments”).
The Company’s securities portfolio amounts to € 6,968 million and € 13,368 million as of 31 December 2020 and 2019, respectively. The security portfolio contains a non-current portion of € 5,350 million (2019: € 11,066 million), and a current portion of € 1,618 million (2019: € 2,302 million).
Included in the securities portfolio as of 31 December 20 20 and 2019, respecti vely, are corporate and government bonds bearing either fi xed rate coupons (€ 6,714 million nominal value; 2019: € 12,908 m illion) or fl oating rate coupons (€ 108 million nominal value; 2019: € 188 million) , and foreign currency funds of fi xed income funds (€ 2 million fair value; 2019: € 5 million).
When the Company enters into securities lending or other fi nancing activities that involve the pledging of securities as collateral, the securities pledged continue to be recognised on the balance sheet. As of 31 December 2020, securities for an amount of € 99 million were pledged as collateral for borrowings from banks (2019: € 145 million).
37.3 Financing Liabilities
Financing liabilities comprise obligations towards fi nancial institutions, issued corporate bonds, deposits made by customers of Airbus Bank, borrowings received from joint ventures and other parties as well as fi nance lease liabilities. Financing liabilities are recorded initially at the fair value of the proceeds received, net of transaction costs incurred. Subsequently, fi nancing liabilities are measured at amortised cost, using the effective interest rate method with any difference between proceeds (net of transaction costs) and redemption amount being recognised in total fi nance income (cost) over the period of the fi nancing liability.
Financing liabilities to fi nancial institutions may include liabilities from securities lending transactions. In securities lending transactions, the Company receives cash from its counterparty and transfers the securities subject to the lending transaction as collateral. The counterparty typically has the right to sell or repledge the securities pledged. The amount of cash received is recognised as a fi nancing liability. The securities pledged are not derecognised, but remain on the Company’s Statement of Financial Position.
62 Airbus / Financial Statements 2020
2. Notes to the IFRS Consolidated Financial Statements /
2.7 Capital Structure and Financial Instruments
2
(In € million)
31 December
2020 2019
Bonds and commercial papers 12,032 6,491
Liabilities to financial institutions 418 244
Loans 94 156
Lease liabilities 1,538 1,298
Total long term financing liabilities 14,082 8,189
Bonds and commercial papers 1,075 0
Liabilities to financial institutions 111 106
Loans 94 127
Lease liabilities 260 262
Others (1) 1,473 1,464
Total short-term financing liabilities 3,013 1,959
Total 17,095 10,148
(1) Included in “others” are financing liabilities to joint ventures.
Long-term financing liabilities, mainly comprising of bonds and lease liabilities, increased by € +5,893 million to € 14,082 million (2019: € 8,189 million), mainly due to the issuance of two bonds for a total of € 6 billion. The fi rst bond was split into a 5 year-maturity tranche of € 750 million with a coupon of 1.625%, an 8 year-maturity tranche of € 750 million with a coupon of 2.00% and a 12 year-maturity tranche of € 1 billion with a coupon of 2.375%.
The second bond was split into a six year-maturity tranche of € 1.25 billion with a coupon of 1.375%, a ten year-maturity tranche of € 1.25 billion with a coupon of 1.625% and a 20 year-maturity tranche of € 1 billion with a coupon of 2.375%.
Short-term financing liabilities increased by € +1,054 million to € 3,013 million (2019: € 1,959 million). The increase in short-term fi nancing liabilities is mainly related to the reclassifi cation of € 1 billion of exchangeable bonds from long-term to short-term due to maturity in June 2021.
The Company has issued several euro-denominated bonds under its EMTN programme and three stand-alone US dollar-denominated bonds on the US institutional market under Rule 144A. It has also issued a euro-denominated exchangeable bonds into Dassault Aviation shares. Furthermore, the Company has long-term US dollar-denominated loans outstanding with the Development Bank of Japan (“DBJ”).
The Company can issue commercial paper under its Negotiable European Commercial Paper (“NEuCP”) programme at fl oating or fi xed interest rates corresponding to the individual maturities ranging from 1 day to 12 months. The programme has been set up in 2003 with a maximum volume of € 2 billion, increased in 2013 to € 3 billion and in 2020 to a maximum volume of € 11 billion. In 2020, the Company established a Euro Commercial Paper (“ECP”) Programme with a maximum volume of € 4 billion. The Company established in April 2015 a US$ 2 billion commercial paper programme which has been increased to US$ 3 billion in April 2016. As of 31 December 2020, there were no outstanding amounts under any of its commercial paper programmes.
6363Airbus / Financial Statements 2020
2. Notes to the IFRS Consolidated Financial Statements /
2.7 Capital Structure and Financial Instruments
The terms and repayment schedules of these bonds and loans are as follows:
Principal amount
(In million)
Carrying amount (In € million)
Issuance date
Coupon or interest
rate
Effective interest
rate Maturity
date Additional features
31 December
2020 2019
US$ Bond 10 years US$ 1,000 845 896 Apr 2013 2.70% 2.77% Apr 2023 Interest rate swappedinto 3M Libor +0.68%
EMTN 10 years € 1,000 1,047 1,049 Apr 2014 2.375% 2.424% Apr 2024 Interest rate swapped
into 3M Euribor +1.40%
EMTN 15 years € 500 571 555 Oct 2014 2.125% 2.208% Oct 2029 Interest rate swapped
into 3M Euribor +0.84%
EMTN 10 years € 600 626 617 May 2016 0.875% 0.980% May 2026 Interest rate swapped
into 3M Euribor +0.50%
EMTN 15 years € 900 983 940 May 2016 1.375% 1.502% May 2031 Interest rate swapped
into 3M Euribor +0.66%
EMTN 5 years € 750 745 - Mar 2020 1.625% 1.798% April 2025
EMTN 6 years € 1,250 1,243 - June 2020 1.375% 1.474% June 2026
EMTN 8 years € 750 745 - Mar 2020 2% 2.099% April 2028
EMTN 10 years € 1,250 1,237 - June 2020 1.625% 1.737% June 2030
EMTN 12 years € 1,000 987 - June 2020 2.375% 2.494% April 2032
EMTN 20 years € 1,000 988 - Mar 2020 2.375% 2.437% June 2040
Exchangeable bonds5 years € 1,078 1,075 1,068 Jun 2016 0.00% 0.333% Jun 2021
Exchangeable intoDassault Aviation shares
issued at 103.75%
US$ Bond 10 years US$ 750 672 687 Apr 2017 3.15% 3.20% Apr 2027 Interest rate swappedinto 3M Libor +0.87%
US$ Bond 30 years US$ 750 667 680 Apr 2017 3.95% 4.02% Apr 2047 Interest rate swappedinto 3M Libor +1.61%
ACLP Private placement US$ 830 676 -
July 2020, Dec 2020
1.982%-2.544%
2.77%-3.09%
July 2026 to
July 2029
Bonds 13,107 6,491
DBJ 10 years US$ 300 81 89 Jan 2011
3M US-Libor
+1.15% 4.84% Jan 2021 Interest rate swapped
into 4.76% fixed
Others 448 261
Liabilities to financial institutions 529 350
Reconciliation of liabilities arising from fi nancing liabilities:
(In € million)
Balance at 1 January
2020 Cash flows
Non-cash movements
Balance at 31 December
2020 Changes in scope
Foreign exchange
movements Others (1)
Bonds and commercial papers 6,491 6,660 0 (44) 0 13,107
Liabilities to financial institutions 350 292 0 (47) (66) 529
Loans 283 (73) 0 (22) 0 188
Finance lease liabilities 1,560 (331) 0 (36) 605 1,798
Others 1,464 109 0 (100) 0 1,473
Total 10,148 6,657 0 (249) 539 17,095
(1) Included in “other assets and liabilities” in the Statements of Cash Flows.
64 Airbus / Financial Statements 2020
2. Notes to the IFRS Consolidated Financial Statements /
2.7 Capital Structure and Financial Instruments
2
38. Financial Instruments
38.1 Financial Risk Management
By the nature of its activities, the Company is exposed to a variety of fi nancial risks: (i) market risks, in particular foreign exchange risk, but also interest rate risk, equity price risk and commodity price risk, (ii) liquidity risk and (iii) credit risk. The Company’s overall fi nancial risk management activities focus on mitigating unpredictable fi nancial market risks and their potential adverse effects on the Company’s operational and fi nancial performance.
The fi nancial risk management of the Company is generally carried out by the Treasury department of the Company under policies approved by the Board of Directors or by the Chief Financial Offi cer. The identifi cation, evaluation and hedging of the fi nancial risks is in the joint responsibility of several established specifi c committees such as the Foreign Exchange Committee and the Asset Liability Management Committee, including the Company business segments.
The Company uses fi nancial derivatives solely for risk mitigating purposes (“hedging”) and applies hedge accounting for a signifi cant portion of its hedging portfolio.
Market Risk
Foreign exchange risk — Foreign exchange risk arises when future commercial transactions or fi rm commitments, recognised monetary assets and liabilities and net investments in foreign operations are denominated in a currency that is not the entity’s functional currency.
The Company manages a long-term hedge portfolio with maturities of several years covering its net exposure to US dollar sales, mainly from the commercial activities of Airbus. This hedge portfolio covers a large portion of the Company’s fi rm commitments and highly probable forecasted transactions.
For Airbus , the highly probable criteria of the underlying foreign currency exposure of cash fl ow hedges is assessed based on the IFRS15 backlog value analysis. This consists in reducing the contractual fi rm backlog by all deliveries which cannot be considered as highly probable due to the existence of either cancellation rights, risk of bankruptcy or other risk of order restructuring. The latter assessments is taking into account customers’ situation and commercial aspects. The resulting backlog is further adjusted to the foreign exchange management hedging horizon. The highly probable underlying foreign currency exposure is then caped to the production plan when applicable.
Most of the Company’s revenue is denominated in US dollars, while a major portion of its costs is incurred in euro and to a lesser extent in other foreign currencies. Consequently, to the extent that the Company does not use fi nancial instruments to hedge its exposure resulting from this currency mismatch, its profi ts will be affected by changes in the €/US$ exchange rate. As the Company intends to generate profi ts primarily from its operations rather than through speculation on exchange rate movements, it uses hedging strategies to manage and minimise the impact of exchange rate fl uctuations on these profi ts.
With respect to its commercial aircraft products, as of 30 June 2018, the Company adopted a new hedge strategy to hedge its net exposure (US dollar revenue less US dollar cost) resulting from commercial aircraft deliveries of specifi c aircraft types. The strategy more closely aligns hedge accounting with risk management activities.
Under the new strategy the foreign exchange derivatives used as hedging instruments are designated as a hedge of a portion of the cash fl ows received for each of a number of deliveries of a specifi c aircraft type that are expected to occur in a given month and hence will allow the hedge result to move along with the hedged deliveries in the event of a shift in deliveries.
If such a shift in hedged deliveries occurs, hedge ineffectiveness will arise to the extent the maturities of the hedging instrument and the expected timing of the hedged cash fl ows are no longer perfectly aligned. In order to minimise such ineffectiveness the Company will close the timing gap by rolling over hedges to new maturities, using foreign exchange swap contracts.
In addition, the Company will designate the risk of changes in the spot element as the hedged risk in order to eliminate the ineffectiveness resulting from changes in forward points between different maturities. The forward element will be accounted for as a cost of hedging similar to the time value of options.
Until 30 June 2018 the Company typically hedged firmly committed sales in US dollar using a “fi rst fl ow approach”. Under that approach, the foreign currency derivatives the Company entered into were designated as a hedge of the fi rst US dollar infl ows received from the customer at aircraft delivery in a given month. The strategy implied that only a portion of the expected monthly customer payments made at aircraft delivery were hedged and that a reduction of monthly cash infl ows as a result of postponements or order cancellations had no impact on the effectiveness of the hedge as long as the actual gross US dollar cash infl ows received at aircraft delivery in a particular month exceeded the portion designated as being hedged in that month. According to the prospective application requirement of IFRS 9, the fair values of the legacy portfolio in place at inception of the new strategy continue to be assigned to the previous fi rst fl ow hedge regime and remain in the hedge reserve in OCI, to be recognised in profi t and loss only at maturity of the originally hedged cash fl ows (unless those cash fl ows are no longer expected to occur).
As a result of prospective application, the hedging instruments designated under the new strategy had a non-zero fair value at hedge inception, which might create some small ineffectiveness.
Another source of ineffectiveness is the counterparty credit risk inherent in the hedge portfolio. As such, credit risk is absent from the hedged cash fl ows. However, since netting arrangements are in place with all the hedge counterparties and the Company has a policy of trading with investment grade counterparties only, the credit risk arising from its hedging instruments, and associated changes in credit risk, have historically been negligible and are expected to remain so.
6565Airbus / Financial Statements 2020
2. Notes to the IFRS Consolidated Financial Statements /
2.7 Capital Structure and Financial Instruments
The Company also hedges its expected foreign currency exposure arising from US dollar or pound sterling cash outfl ows in the commercial aircraft business on a fi rst outfl ow basis, though to a much lesser extent than US dollar cash infl ows.
In military aircraft and non-aircraft businesses, the Company hedges infl ows and outfl ows in foreign currencies from fi rmly committed or highly probable forecast sales and purchase contracts. Here, foreign currency derivatives are typically contracted in lower volumes; they may be accounted for using a fi rst fl ow approach or are designated as hedges of specifi c agreed milestone payments. The amount of the expected fl ows to be hedged can cover up to 100% of the equivalent of the net US dollar exposure at inception. The coverage ratio considers the variability in the range of potential outcomes taking into account macroeconomic movements affecting spot rates and interest rates as well as the robustness of the commercial cycle.
In situations where the payment dates for hedged firmly committed cash fl ows are not fi xed and subject to potentially signifi cant delays, the Company may use rollover strategies, usually involving foreign exchange swaps.
For all foreign currency hedges of future cash fl ows which qualify for hedge accounting under IFRS 9, the Company uses the cash fl ow hedge model, which requires (i) recognising the effective portion of the fair value changes of the hedging derivatives in equity (within OCI) and (ii) recognising the effect of the hedge in profi t or loss when the hedged cash fl ows affect profi t or loss.
In addition, the Company hedges currency risk arising from fi nancial assets or liabilities denominated in currencies other than the euro, including foreign currency receivable and payable accounts, as well as foreign currency denominated funding transactions or securities. The Company applies hedge accounting if a mismatch in terms of profi t or loss recognition of the hedging instrument and hedged item would otherwise occur. Frequently, however, the currency-induced gains or losses of the hedging instrument and the hedged item match in terms of profi t or loss recognition (“natural hedge”), so no hedge accounting is required. Sometimes such gains or losses may end up in different sections of the income statement (such as operating profi t for the hedged item and fi nancial result for the hedging instrument). If so, the Company may choose to present the gains or losses of both the hedging instrument and the hedged item in the same income statement line item if certain formal requirements are met.
As hedging instruments, the Company primarily uses foreign currency forwards, foreign currency options and to a minor extent non-derivative fi nancial instruments. A hedge ratio of 1:1 is applied by the Company.
The Company also has foreign currency derivative instruments which are embedded in certain purchase contracts denominated in a currency other than the functional currency of any substantial party to the contract, principally in US dollar and pound sterling. If such embedded derivatives are required to be accounted for separately from the host purchase contract, related gains or losses are generally recognised in other fi nancial result. However, if the embedded derivatives qualify for hedge accounting, the Company might choose to designate them as a hedging instrument in a hedge of foreign currency risk, in which case they are accounted for under the cash fl ow hedge model as described above.
Interest rate risk — The Company uses an asset-liability management approach with the objective to limit its interest rate risk. It undertakes to match the risk profi le of its interest-bearing assets with those of its interest-bearing liabilities. The remaining net interest rate exposure is managed through several types of interest rate derivatives, such as interest rate swaps and interest rate futures contracts, in order to minimise risks and fi nancial impacts.
The vast majority of related interest rate hedges qualify for hedge accounting, and most of them are accounted for under the fair value hedge model. As a result, both the fair value changes of these derivatives and the portion of the hedged items’ fair value change that is attributable to the hedged interest rate risk are recognised in profi t and loss, where they offset to the extent the hedge is effective.
A few interest rate swaps that have been entered into as a hedge of certain of the Company variable rate debt (see “– Note 36.3: Financing Liabilities”) are accounted for under the cash fl ow hedge model. Related fair value gains are recognised in OCI and reclassifi ed to profi t or loss when the hedged interest payments affect profi t or loss.
The Company has applied the relief introduced by the amendments made to IFRS 9 in September 2019 on hedge accounting, having the effect that the IBOR reform should not cause hedge accounting to terminate.
The Company invests in fi nancial instruments such as overnight deposits, certifi cates of deposits, commercial papers, other money market instruments and short-term as well as medium-term bonds. For its fi nancial instruments portfolio, the Company has an Asset Liability Management Committee in place that meets regularly and aims to limit the interest rate risk on a fair value basis through a value-at-risk approach, from which results a hedge ratio that is however not actively steered.
Commodity price risk — The Company is exposed to risk relating to fl uctuations in the prices of commodities used in the supply chain. It manages these risks in the procurement process and to a certain extent uses derivative instruments in order to mitigate the risks associated with the purchase of raw materials. To the extent that the gains or losses of the derivative and those of the hedged item or transaction do not match in terms of profi t or loss, the Company applies cash fl ow hedge accounting to the derivative instruments, with a hedge ratio of 1:1.
Equity price risk — The Company is to a small extent invested in equity securities mainly for operational reasons. Its exposure to equity price risk is hence limited. Furthermore, it is exposed under its LTIP to the risk of the Company share price increases. The Company limits these risks through the use of equity derivatives that qualify for hedge accounting and have been designated as hedging instruments in cash fl ow hedges, with a hedge ratio of 1:1.
Sensitivities of market risks — The approach used to measure and control market risk exposure of the Company’s fi nancial instrument portfolio is, amongst other key indicators, the value-at-risk model (“VaR”). The VaR of a portfolio is the estimated potential loss that will not be exceeded over a specifi ed period of time (holding period) from an adverse market movement with a specifi ed confi dence level. The VaR used by the Company is based upon a 95% confi dence level and assumes a fi ve-day holding period. The VaR model used is mainly based on
66 Airbus / Financial Statements 2020
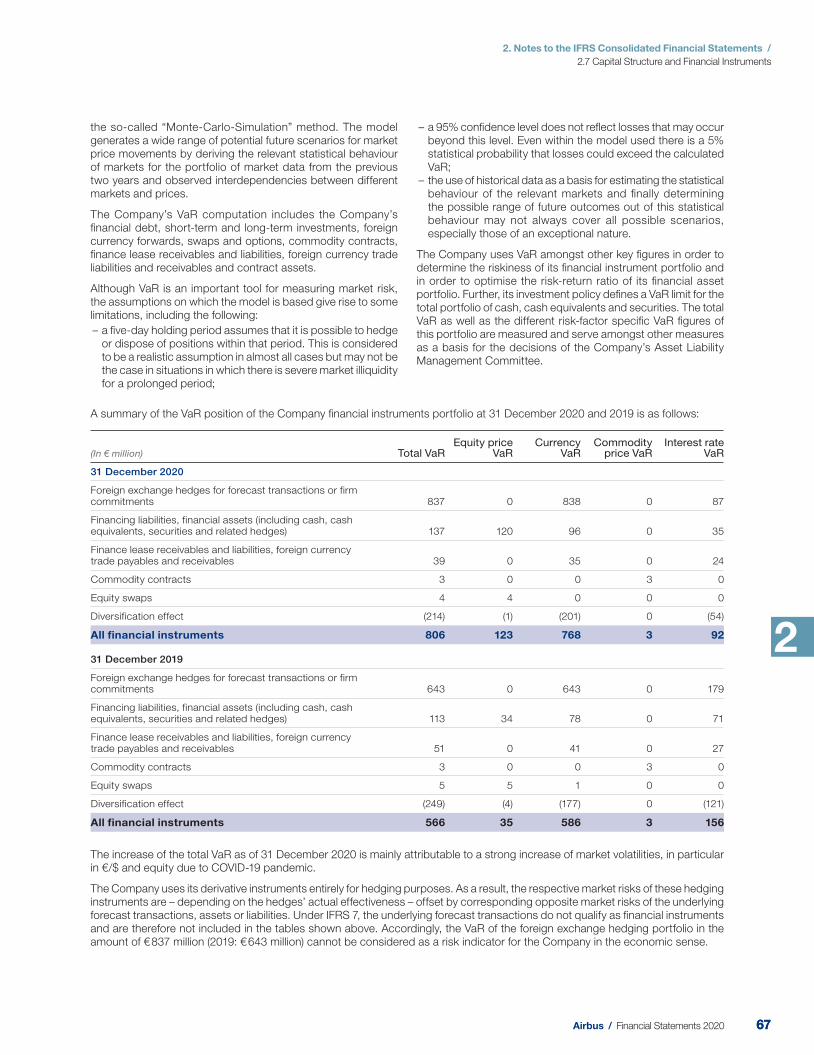
2. Notes to the IFRS Consolidated Financial Statements /
2.7 Capital Structure and Financial Instruments
2
the so-called “Monte-Carlo-Simulation” method. The model generates a wide range of potential future scenarios for market price movements by deriving the relevant statistical behaviour of markets for the portfolio of market data from the previous two years and observed interdependencies between different markets and prices.
The Company’s VaR computation includes the Company’s fi nancial debt, short-term and long-term investments, foreign currency forwards, swaps and options, commodity contracts, fi nance lease receivables and liabilities, foreign currency trade liabilities and receivables and contract assets.
Although VaR is an important tool for measuring market risk, the assumptions on which the model is based give rise to some limitations, including the following:
– a fi ve-day holding period assumes that it is possible to hedge or dispose of positions within that period. This is considered to be a realistic assumption in almost all cases but may not be the case in situations in which there is severe market illiquidity for a prolonged period;
– a 95% confi dence level does not refl ect losses that may occur beyond this level. Even within the model used there is a 5% statistical probability that losses could exceed the calculated VaR;
– the use of historical data as a basis for estimating the statistical behaviour of the relevant markets and fi nally determining the possible range of future outcomes out of this statistical behaviour may not always cover all possible scenarios, especially those of an exceptional nature.
The Company uses VaR amongst other key fi gures in order to determine the riskiness of its fi nancial instrument portfolio and in order to optimise the risk-return ratio of its fi nancial asset portfolio. Further, its investment policy defi nes a VaR limit for the total portfolio of cash, cash equivalents and securities. The total VaR as well as the different risk-factor specifi c VaR fi gures of this portfolio are measured and serve amongst other measures as a basis for the decisions of the Company’s Asset Liability Management Committee.
A summary of the VaR position of the Company fi nancial instruments portfolio at 31 December 2020 and 20 19 is as follows:
(In € million) Total VaR Equity price
VaR Currency
VaR Commodity
price VaR Interest rate
VaR
31 December 2020
Foreign exchange hedges for forecast transactions or firm commitments 837 0 838 0 87
Financing liabilities, financial assets (including cash, cash equivalents, securities and related hedges) 137 120 96 0 35
Finance lease receivables and liabilities, foreign currency trade payables and receivables 39 0 35 0 24
Commodity contracts 3 0 0 3 0
Equity swaps 4 4 0 0 0
Diversification effect (214) (1) (201) 0 (54)
All financial instruments 806 123 768 3 92
31 December 2019
Foreign exchange hedges for forecast transactions or firm commitments 643 0 643 0 179
Financing liabilities, financial assets (including cash, cash equivalents, securities and related hedges) 113 34 78 0 71
Finance lease receivables and liabilities, foreign currency trade payables and receivables 51 0 41 0 27
Commodity contracts 3 0 0 3 0
Equity swaps 5 5 1 0 0
Diversification effect (249) (4) (177) 0 (121)
All financial instruments 566 35 586 3 156
The increase of the total VaR as of 31 December 2020 is mainly attributable to a strong increase of market volatilities, in particular in €/$ and equity due to COVID-19 pandemic.
The Company uses its derivative instruments entirely for hedging purposes. As a result, the respective market risks of these hedging instruments are – depending on the hedges’ actual effectiveness – offset by corresponding opposite market risks of the underlying forecast transactions, assets or liabilities. Under IFRS 7, the underlying forecast transactions do not qualify as fi nancial instruments and are therefore not included in the tables shown above. Accordingly, the VaR of the foreign exchange hedging portfolio in the amount of € 837 million (201 9: € 643 million) cannot be considered as a risk indicator for the Company in the economic sense.
6767Airbus / Financial Statements 2020
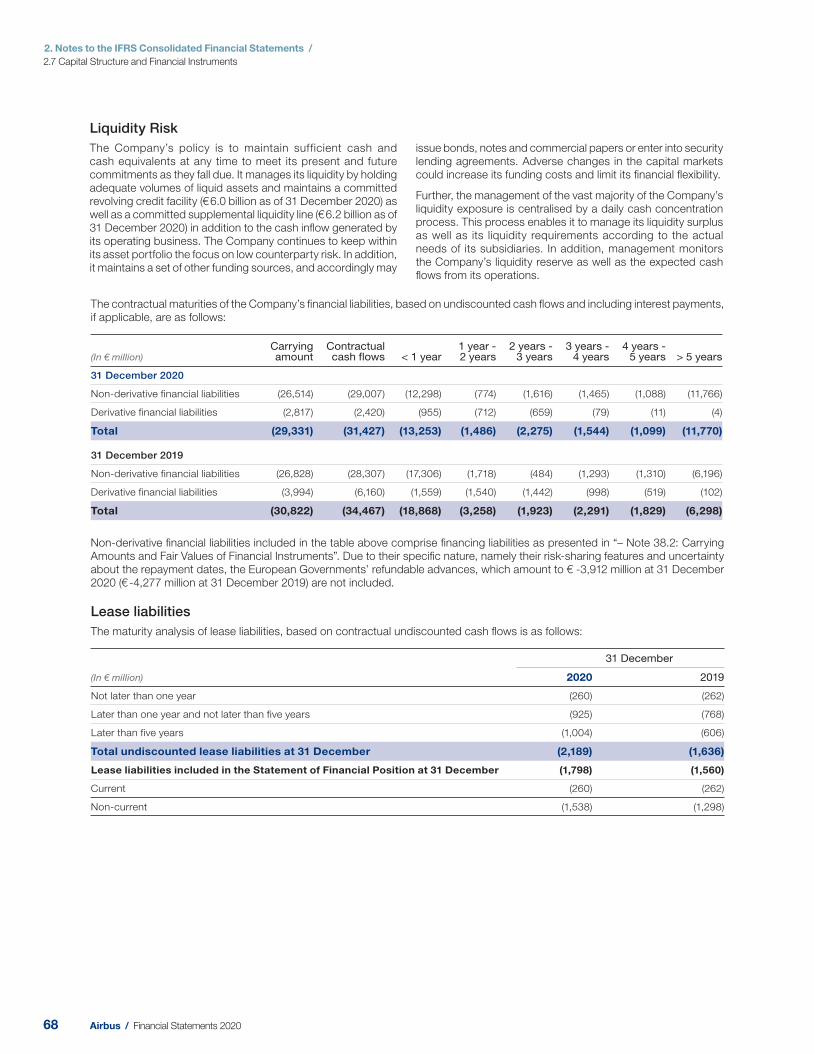
2. Notes to the IFRS Consolidated Financial Statements /
2.7 Capital Structure and Financial Instruments
The contractual maturities of the Company’s fi nancial liabilities, based on undiscounted cash fl ows and including interest payments, if applicable, are as follows:
(In € million) Carrying amount
Contractual cash flows < 1 year
1 year - 2 years
2 years - 3 years
3 years - 4 years
4 years - 5 years > 5 years
31 December 2020
Non-derivative financial liabilities (26,514) (29,007) (12,298) (774) (1,616) (1,465) (1,088) (11,766)
Derivative financial liabilities (2,817) (2,420) (955) (712) (659) (79) (11) (4)
Total (29,331) (31,427) (13,253) (1,486) (2,275) (1,544) (1,099) (11,770)
31 December 2019
Non-derivative financial liabilities (26,828) (28,307) (17,306) (1,718) (484) (1,293) (1,310) (6,196)
Derivative financial liabilities (3,994) (6,160) (1,559) (1,540) (1,442) (998) (519) (102)
Total (30,822) (34,467) (18,868) (3,258) (1,923) (2,291) (1,829) (6,298)
Non-derivative fi nancial liabilities included in the table above comprise fi nancing liabilities as presented in “– Note 38.2: Carrying Amounts and Fair Values of Financial Instruments”. Due to their specifi c nature, namely their risk-sharing features and uncertainty about the repayment dates, the European G overnments’ refundable advances, which amount to € -3,912 million at 31 D ecember 2020 (€ -4,277 million at 31 Dec ember 2019) are not included.
Lease liabilities
The maturity analysis of lease liabilities, based on contractual undiscounted cash fl ows is as follows:
(In € million)
31 December
2020 2019
Not later than one year (260) (262)
Later than one year and not later than five years (925) (768)
Later than five years (1,004) (606)
Total undiscounted lease liabilities at 31 December (2,189) (1,636)
Lease liabilities included in the Statement of Financial Position at 31 December (1,798) (1,560)
Current (260) (262)
Non-current (1,538) (1,298)
Liquidity Risk
The Company’s policy is to maintain sufficient cash and cash equivalents at any time to meet its present and future commitments as they fall due. It manages its liquidity by holding adequate volumes of liquid assets and maintains a committed revolving credit facility (€ 6.0 billion as of 31 December 2020) as well as a committed supplemental liquidity line (€ 6.2 billion as of 31 December 2020) in addition to the cash infl ow generated by its operating business. The Company continues to keep within its asset portfolio the focus on low counterparty risk. In addition, it maintains a set of other funding sources, and accordingly may
issue bonds, notes and commercial papers or enter into security lending agreements. Adverse changes in the capital markets could increase its funding costs and limit its fi nancial fl exibility.
Further, the management of the vast majority of the Company’s liquidity exposure is centralised by a daily cash concentration process. This process enables it to manage its liquidity surplus as well as its liquidity requirements according to the actual needs of its subsidiaries. In addition, management monitors the Company’s liquidity reserve as well as the expected cash fl ows from its operations.
68 Airbus / Financial Statements 2020
2. Notes to the IFRS Consolidated Financial Statements /
2.7 Capital Structure and Financial Instruments
2
Credit Risk
The Company is exposed to credit risk to the extent of non-performance by either its customers (e.g. airlines) or its counterparts with regard to fi nancial instruments or issuers of fi nancial instruments for gross cash investments. However, it has policies in place to avoid concentrations of credit risk and to ensure that credit risk is limited.
As far as central treasury activities are concerned, credit risk resulting from fi nancial instruments is managed by the Company. In order to ensure suffi cient diversifi cation, a credit limit system is used.
The Company monitors the performance of the individual fi nancial instruments and the impact of market developments on their performance and takes appropriate action on foreseeable adverse development based on pre-defi ned procedures and escalation levels.
Sales of products and services are made to customers after having conducted appropriate internal credit risk assessment. In order to support sales, primarily at Airbus, Airbus Helicopters and ATR, the Company may agree to participate in customer fi nancing, on a case-by-case basis either directly or through guarantees provided to third parties. In determining the amount and terms of the fi nancing transaction, the Company takes into account the airline’s credit rating and economic factors refl ecting the relevant fi nancial market conditions, together with appropriate assumptions as to the anticipated future value of the fi nanced asset.
The booked amount of fi nancial assets represents the maximum credit exposure. The credit quality of fi nancial assets can be assessed by reference to external credit rating (if available) or internal assessment of customers’ creditworthiness e.g. airlines by way of internal risk pricing methods.
For further information relating to gross credit risk and impairment see “– Note 38.7: Impairment Losses”.
38.2 Carrying Amounts and Fair Values of Financial Instruments
Financial instruments — The Company’s fi nancial assets mainly consist of cash, short to medium-term deposits and securities. Its fi nancial liabilities include trade liabilities, obligations towards fi nancial institutions, issued bonds and refundable advances from European G overnments. All purchases and sales of fi nancial assets are recognised on the settlement date according to market conventions.
Financial assets at amortised cost — This category comprises assets that are held for collection of contractual cash fl ows where those cash fl ows represent solely payments of principal and interest. It includes trade receivables.
Financial assets at fair value through OCI — This category comprises:
(i) equity investments that are not held for trading. With the exception of dividends received, the associated gains and losses (including any related foreign exchange component) are recognised in OCI. Amounts presented in OCI are not subsequently transferred to profit and loss on derecognition of the equity investment nor in the event of an impairment;
(ii) debt instruments where contractual cash flows are solely payments of principal and interest, and that are held both for sales and collecting contractual cash flows. Changes in their fair value other than impairment losses and foreign exchange gains and losses on monetary items are recognised directly within AOCI. Upon disposal of such financial assets, the cumulative gain or loss previously recognised in equity is recorded as part of other income (other expenses) from investments in the Consolidated Income Statement for the period. Interest earned on the investment are presented as interest income in the Consolidated Income Statement using the effective interest method. Dividends earned on investment were recognised as other income (other expenses) from investments in the Consolidated Income Statement when the right to the payment had been established.
Financial assets at fair value through profi t or loss — This category comprises all other fi nancial assets (e.g. derivative instruments) that are to be measured at fair value (including equity investments for which the Company did not elect to present changes in fair value in OCI).
The Company assigns its fi nancial instruments into classes based on their balance sheet category.
6969Airbus / Financial Statements 2020
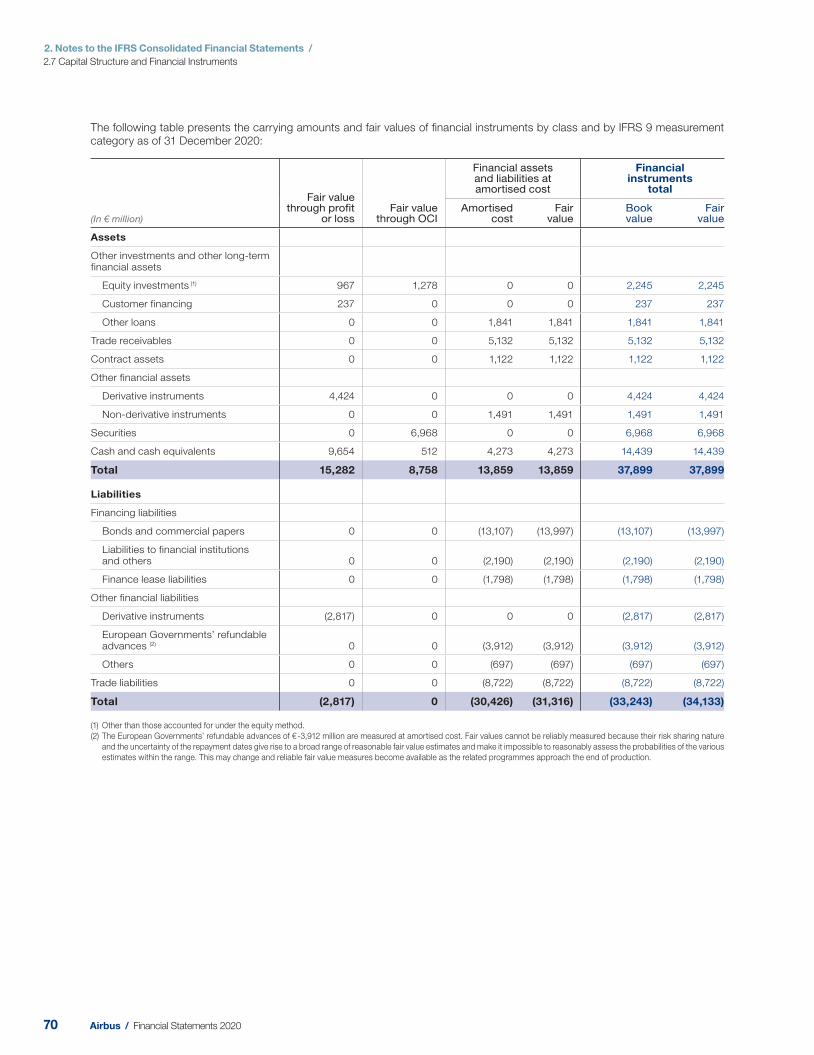
2. Notes to the IFRS Consolidated Financial Statements /
2.7 Capital Structure and Financial Instruments
The following table presents the carrying amounts and fair values of fi nancial instruments by class and by IFRS 9 measurement category as of 31 December 2020:
(In € million)
Fair value through profit
or loss Fair value
through OCI
Financial assets and liabilities at amortised cost
Financial instruments
total
Amortised cost
Fair value
Book value
Fair value
Assets
Other investments and other long-term financial assets
Equity investments (1) 967 1,278 0 0 2,245 2,245
Customer financing 237 0 0 0 237 237
Other loans 0 0 1,841 1,841 1,841 1,841
Trade receivables 0 0 5,132 5,132 5,132 5,132
Contract assets 0 0 1,122 1,122 1,122 1,122
Other financial assets
Derivative instruments 4,424 0 0 0 4,424 4,424
Non-derivative instruments 0 0 1,491 1,491 1,491 1,491
Securities 0 6,968 0 0 6,968 6,968
Cash and cash equivalents 9,654 512 4,273 4,273 14,439 14,439
Total 15,282 8,758 13,859 13,859 37,899 37,899
Liabilities
Financing liabilities
Bonds and commercial papers 0 0 (13,107) (13,997) (13,107) (13,997)
Liabilities to financial institutions and others 0 0 (2,190) (2,190) (2,190) (2,190)
Finance lease liabilities 0 0 (1,798) (1,798) (1,798) (1,798)
Other financial liabilities
Derivative instruments (2,817) 0 0 0 (2,817) (2,817)
European G overnments’ refundable advances (2) 0 0 (3,912) (3,912) (3,912) (3,912)
Others 0 0 (697) (697) (697) (697)
Trade liabilities 0 0 (8,722) (8,722) (8,722) (8,722)
Total (2,817) 0 (30,426) (31,316) (33,243) (34,133)
(1) Other than those accounted for under the equity method.
(2) The European G overnments’ refundable advances of € -3,912 million are measured at amortised cost. Fair values cannot be reliably measured because their risk sharing nature
and the uncertainty of the repayment dates give rise to a broad range of reasonable fair value estimates and make it impossible to reasonably assess the probabilities of the various
estimates within the range. This may change and reliable fair value measures become available as the related programmes approach the end of production.
70 Airbus / Financial Statements 2020
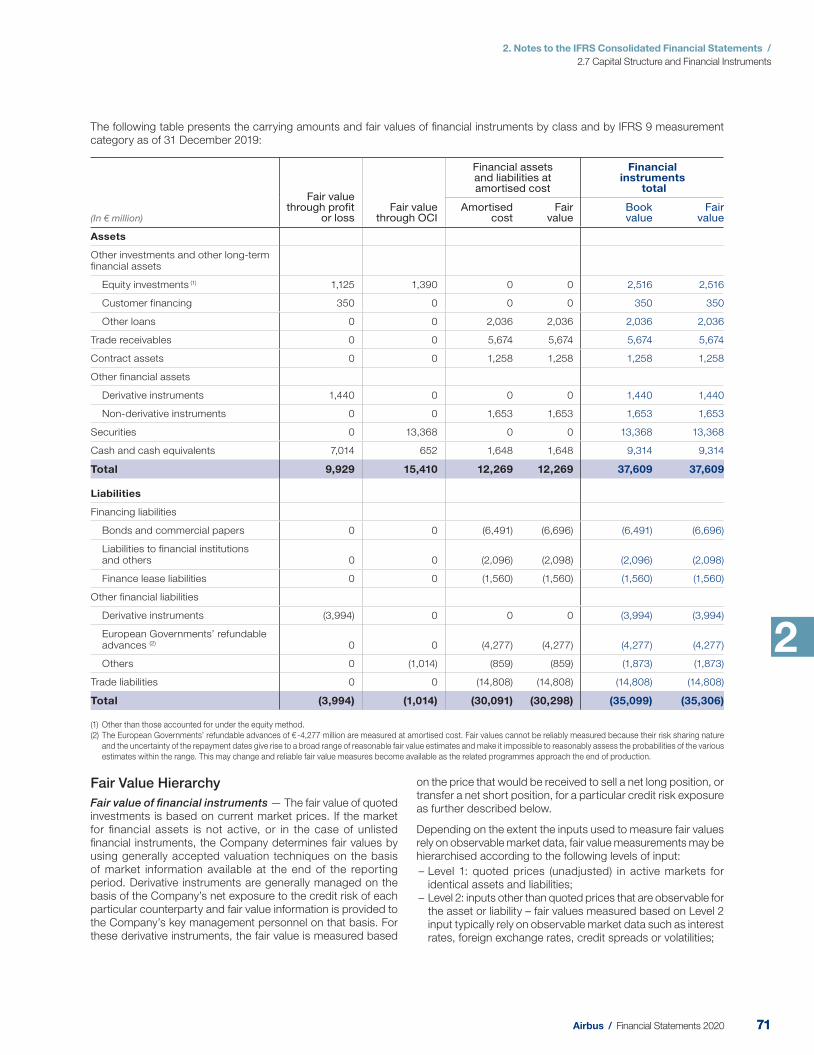
2. Notes to the IFRS Consolidated Financial Statements /
2.7 Capital Structure and Financial Instruments
2
The following table presents the carrying amounts and fair values of fi nancial instruments by class and by IFRS 9 measurement category as of 31 December 2019:
(In € million)
Fair value through profit
or lossFair value
through OCI
Financial assets and liabilities at amortised cost
Financial instruments
total
Amortised cost
Fair value
Book value
Fair value
Assets
Other investments and other long-term financial assets
Equity investments (1) 1,125 1,390 0 0 2,516 2,516
Customer financing 350 0 0 0 350 350
Other loans 0 0 2,036 2,036 2,036 2,036
Trade receivables 0 0 5,674 5,674 5,674 5,674
Contract assets 0 0 1,258 1,258 1,258 1,258
Other financial assets
Derivative instruments 1,440 0 0 0 1,440 1,440
Non-derivative instruments 0 0 1,653 1,653 1,653 1,653
Securities 0 13,368 0 0 13,368 13,368
Cash and cash equivalents 7,014 652 1,648 1,648 9,314 9,314
Total 9,929 15,410 12,269 12,269 37,609 37,609
Liabilities
Financing liabilities
Bonds and commercial papers 0 0 (6,491) (6,696) (6,491) (6,696)
Liabilities to financial institutions and others 0 0 (2,096) (2,098) (2,096) (2,098)
Finance lease liabilities 0 0 (1,560) (1,560) (1,560) (1,560)
Other financial liabilities
Derivative instruments (3,994) 0 0 0 (3,994) (3,994)
European G overnments’ refundable advances (2) 0 0 (4,277) (4,277) (4,277) (4,277)
Others 0 (1,014) (859) (859) (1,873) (1,873)
Trade liabilities 0 0 (14,808) (14,808) (14,808) (14,808)
Total (3,994) (1,014) (30,091) (30,298) (35,099) (35,306)
(1) Other than those accounted for under the equity method.
(2) The European G overnments’ refundable advances of € -4,277 million are measured at amortised cost. Fair values cannot be reliably measured because their risk sharing nature
and the uncertainty of the repayment dates give rise to a broad range of reasonable fair value estimates and make it impossible to reasonably assess the probabilities of the various
estimates within the range. This may change and reliable fair value measures become available as the related programmes approach the end of production.
Fair Value Hierarchy
Fair value of fi nancial instruments — The fair value of quoted investments is based on current market prices. If the market for fi nancial assets is not active, or in the case of unlisted fi nancial instruments, the Company determines fair values by using generally accepted valuation techniques on the basis of market information available at the end of the reporting period. Derivative instruments are generally managed on the basis of the Company’s net exposure to the credit risk of each particular counterparty and fair value information is provided to the Company’s key management personnel on that basis. For these derivative instruments, the fair value is measured based
on the price that would be received to sell a net long position, or transfer a net short position, for a particular credit risk exposure as further described below.
Depending on the extent the inputs used to measure fair values rely on observable market data, fair value measurements may be hierarchised according to the following levels of input:
– Level 1: quoted prices (unadjusted) in active markets for identical assets and liabilities;
– Level 2: inputs other than quoted prices that are observable for the asset or liability – fair values measured based on Level 2 input typically rely on observable market data such as interest rates, foreign exchange rates, credit spreads or volatilities;
7171Airbus / Financial Statements 2020
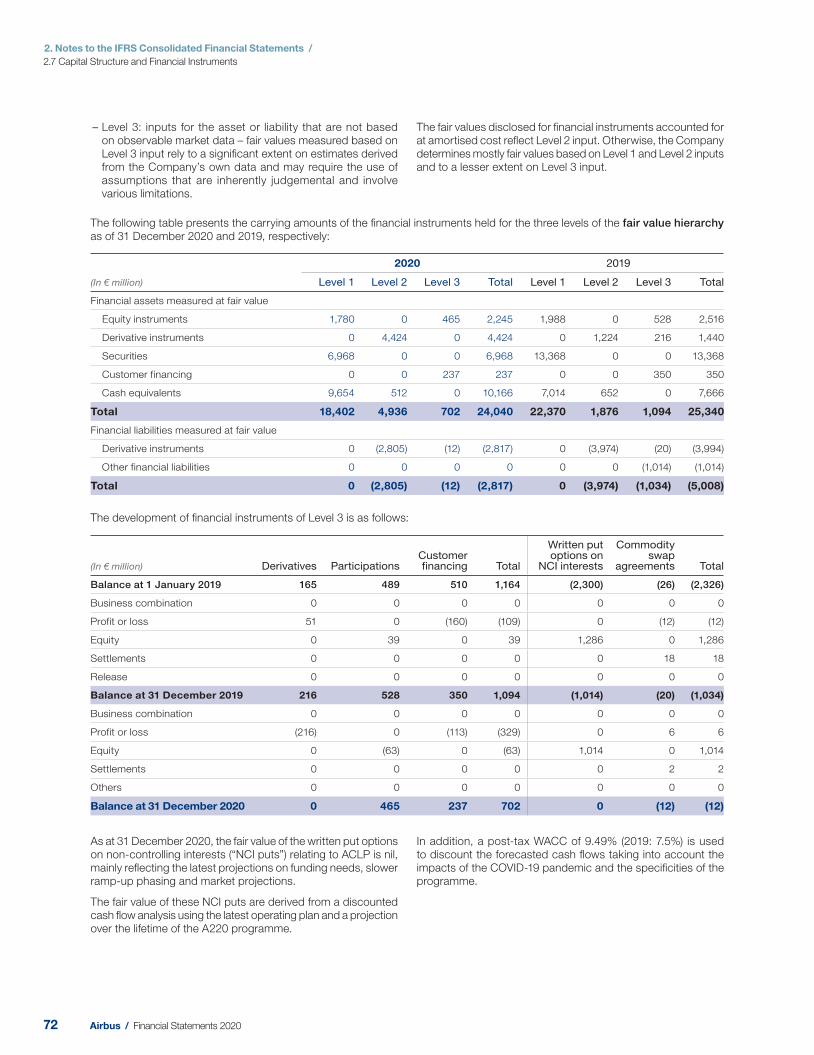
2. Notes to the IFRS Consolidated Financial Statements /
2.7 Capital Structure and Financial Instruments
– Level 3: inputs for the asset or liability that are not based on observable market data – fair values measured based on Level 3 input rely to a signifi cant extent on estimates derived from the Company’s own data and may require the use of assumptions that are inherently judgemental and involve various limitations.
The fair values disclosed for fi nancial instruments accounted for at amortised cost refl ect Level 2 input. Otherwise, the Company determines mostly fair values based on Level 1 and Level 2 inputs and to a lesser extent on Level 3 input.
The following table presents the carrying amounts of the fi nancial instruments held for the three levels of the fair value hierarchy as of 31 December 2020 and 2019, respectively:
(In € million)
2020 2019
Level 1 Level 2 Level 3 Total Level 1 Level 2 Level 3 Total
Financial assets measured at fair value
Equity instruments 1,780 0 465 2,245 1,988 0 528 2,516
Derivative instruments 0 4,424 0 4,424 0 1,224 216 1,440
Securities 6,968 0 0 6,968 13,368 0 0 13,368
Customer financing 0 0 237 237 0 0 350 350
Cash equivalents 9,654 512 0 10,166 7,014 652 0 7,666
Total 18,402 4,936 702 24,040 22,370 1,876 1,094 25,340
Financial liabilities measured at fair value
Derivative instruments 0 (2,805) (12) (2,817) 0 (3,974) (20) (3,994)
Other financial liabilities 0 0 0 0 0 0 (1,014) (1,014)
Total 0 (2,805) (12) (2,817) 0 (3,974) (1,034) (5,008)
The development of fi nancial instruments of Level 3 is as follows:
(In € million) Derivatives ParticipationsCustomer financing Total
Written put options on
NCI interests
Commodity swap
agreements Total
Balance at 1 January 2019 165 489 510 1,164 (2,300) (26) (2,326)
Business combination 0 0 0 0 0 0 0
Profit or loss 51 0 (160) (109) 0 (12) (12)
Equity 0 39 0 39 1,286 0 1,286
Settlements 0 0 0 0 0 18 18
Release 0 0 0 0 0 0 0
Balance at 31 December 2019 216 528 350 1,094 (1,014) (20) (1,034)
Business combination 0 0 0 0 0 0 0
Profit or loss (216) 0 (113) (329) 0 6 6
Equity 0 (63) 0 (63) 1,014 0 1,014
Settlements 0 0 0 0 0 2 2
Others 0 0 0 0 0 0 0
Balance at 31 December 2020 0 465 237 702 0 (12) (12)
As at 31 December 2020, the fair value of the written put options on non-controlling interests (“NCI puts”) relating to ACLP is nil, mainly refl ecting the latest projections on funding needs, slower ramp-up phasing and market projections.
The fair value of these NCI puts are derived from a discounted cash fl ow analysis using the latest operating plan and a projection over the lifetime of the A220 programme.
In addition, a post-tax WACC of 9.49% (2019: 7.5%) is used to discount the forecasted cash fl ows taking into account the impacts of the COVID-19 pandemic and the specifi cities of the programme.
72 Airbus / Financial Statements 2020
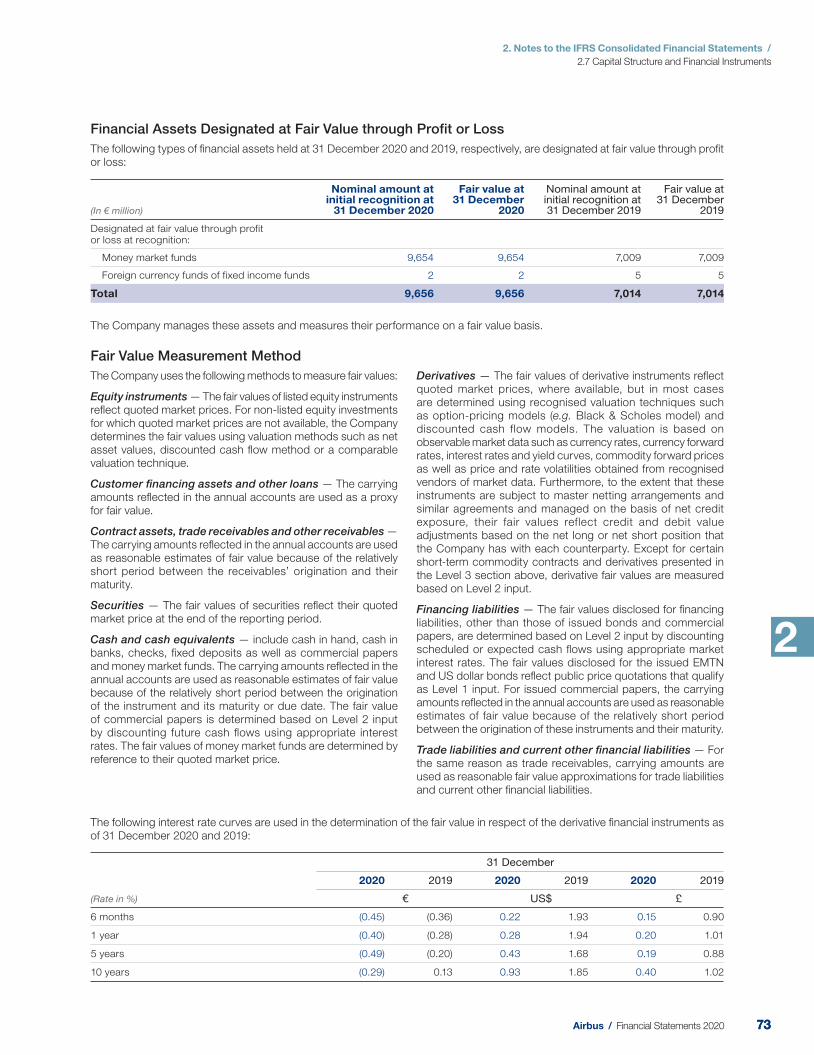
2. Notes to the IFRS Consolidated Financial Statements /
2.7 Capital Structure and Financial Instruments
2
Financial Assets Designated at Fair Value through Profit or Loss
The following types of fi nancial assets held at 31 December 2020 and 2019, respectively, are designated at fair value through profi t or loss:
(In € million)
Nominal amount at initial recognition at
31 December 2020
Fair value at 31 December
2020
Nominal amount at initial recognition at 31 December 2019
Fair value at 31 December
2019
Designated at fair value through profit or loss at recognition:
Money market funds 9,654 9,654 7,009 7,009
Foreign currency funds of fixed income funds 2 2 5 5
Total 9,656 9,656 7,014 7,014
The Company manages these assets and measures their performance on a fair value basis.
Fair Value Measurement Method
The Company uses the following methods to measure fair values:
Equity instruments — The fair values of listed equity instruments refl ect quoted market prices. For non-listed equity investments for which quoted market prices are not available, the Company determines the fair values using valuation methods such as net asset values, discounted cash fl ow method or a comparable valuation technique.
Customer fi nancing assets and other loans — The carrying amounts refl ected in the annual accounts are used as a proxy for fair value.
Contract assets, trade receivables and other receivables — The carrying amounts refl ected in the annual accounts are used as reasonable estimates of fair value because of the relatively short period between the receivables’ origination and their maturity.
Securities — The fair values of securities refl ect their quoted market price at the end of the reporting period.
Cash and cash equivalents — include cash in hand, cash in banks, checks, fi xed deposits as well as commercial papers and money market funds. The carrying amounts refl ected in the annual accounts are used as reasonable estimates of fair value because of the relatively short period between the origination of the instrument and its maturity or due date. The fair value of commercial papers is determined based on Level 2 input by discounting future cash fl ows using appropriate interest rates. The fair values of money market funds are determined by reference to their quoted market price.
Derivatives — The fair values of derivative instruments refl ect quoted market prices, where available, but in most cases are determined using recognised valuation techniques such as option-pricing models (e.g. Black & Scholes model) and discounted cash flow models. The valuation is based on observable market data such as currency rates, currency forward rates, interest rates and yield curves, commodity forward prices as well as price and rate volatilities obtained from recognised vendors of market data. Furthermore, to the extent that these instruments are subject to master netting arrangements and similar agreements and managed on the basis of net credit exposure, their fair values reflect credit and debit value adjustments based on the net long or net short position that the Company has with each counterparty. Except for certain short-term commodity contracts and derivatives presented in the Level 3 section above, derivative fair values are measured based on Level 2 input.
Financing liabilities — The fair values disclosed for fi nancing liabilities, other than those of issued bonds and commercial papers, are determined based on Level 2 input by discounting scheduled or expected cash fl ows using appropriate market interest rates. The fair values disclosed for the issued EMTN and US dollar bonds refl ect public price quotations that qualify as Level 1 input. For issued commercial papers, the carrying amounts refl ected in the annual accounts are used as reasonable estimates of fair value because of the relatively short period between the origination of these instruments and their maturity.
Trade liabilities and current other fi nancial liabilities — For the same reason as trade receivables, carrying amounts are used as reasonable fair value approximations for trade liabilities and current other fi nancial liabilities.
The following interest rate curves are used in the determination of the fair value in respect of the derivative fi nancial instruments as of 31 December 2020 and 2019:
(Rate in %)
31 December
2020 2019 2020 2019 2020 2019
€ US$ £
6 months (0.45) (0.36) 0.22 1.93 0.15 0.90
1 year (0.40) (0.28) 0.28 1.94 0.20 1.01
5 years (0.49) (0.20) 0.43 1.68 0.19 0.88
10 years (0.29) 0.13 0.93 1.85 0.40 1.02
7373Airbus / Financial Statements 2020
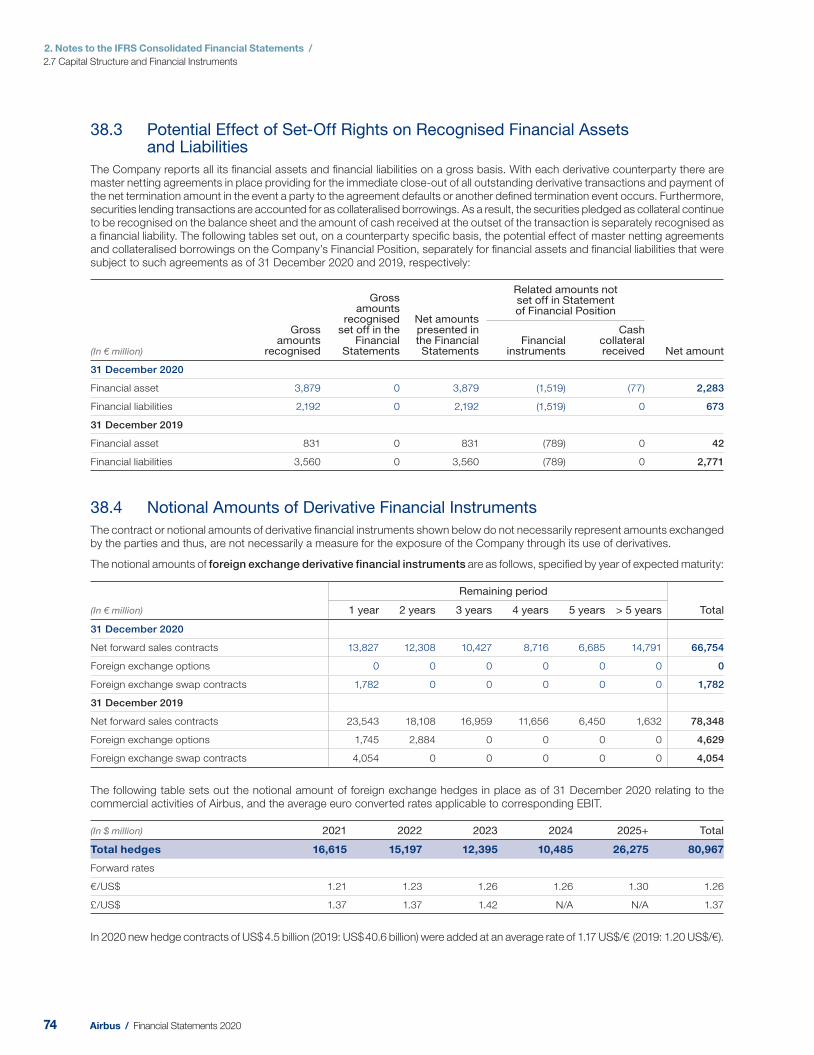
2. Notes to the IFRS Consolidated Financial Statements /
2.7 Capital Structure and Financial Instruments
38.3 Potential Effect of Set-Off Rights on Recognised Financial Assets and Liabilities
The Company reports all its fi nancial assets and fi nancial liabilities on a gross basis. With each derivative counterparty there are master netting agreements in place providing for the immediate close-out of all outstanding derivative transactions and payment of the net termination amount in the event a party to the agreement defaults or another defi ned termination event occurs. Furthermore, securities lending transactions are accounted for as collateralised borrowings. As a result, the securities pledged as collateral continue to be recognised on the balance sheet and the amount of cash received at the outset of the transaction is separately recognised as a fi nancial liability. The following tables set out, on a counterparty specifi c basis, the potential effect of master netting agreements and collateralised borrowings on the Company’s Financial Position, separately for fi nancial assets and fi nancial liabilities that were subject to such agreements as of 31 December 2020 and 2019, respectively:
(In € million)
Gross amounts
recognised
Gross amounts
recognised set off in the
Financial Statements
Net amounts presented in the Financial Statements
Related amounts not set off in Statement of Financial Position
Net amount Financial
instruments
Cash collateral received
31 December 2020
Financial asset 3,879 0 3,879 (1,519) (77) 2,283
Financial liabilities 2,192 0 2,192 (1,519) 0 673
31 December 2019
Financial asset 831 0 831 (789) 0 42
Financial liabilities 3,560 0 3,560 (789) 0 2,771
38.4 Notional Amounts of Derivative Financial Instruments
The contract or notional amounts of derivative fi nancial instruments shown below do not necessarily represent amounts exchanged by the parties and thus, are not necessarily a measure for the exposure of the Company through its use of derivatives.
The notional amounts of foreign exchange derivative financial instruments are as follows, specifi ed by year of expected maturity:
(In € million)
Remaining period
1 year 2 years 3 years 4 years 5 years > 5 years Total
31 December 2020
Net forward sales contracts 13,827 12,308 10,427 8,716 6,685 14,791 66,754
Foreign exchange options 0 0 0 0 0 0 0
Foreign exchange swap contracts 1,782 0 0 0 0 0 1,782
31 December 2019
Net forward sales contracts 23,543 18,108 16,959 11,656 6,450 1,632 78,348
Foreign exchange options 1,745 2,884 0 0 0 0 4,629
Foreign exchange swap contracts 4,054 0 0 0 0 0 4,054
The following table sets out the notional amount of foreign exchange hedges in place as of 31 December 2020 relating to the commercial activities of Airbus, and the average euro converted rates applicable to corresponding EBIT.
(In $ million) 2021 2022 2023 2024 2025+ Total
Total hedges 16,615 15,197 12,395 10,485 26,275 80,967
Forward rates
€/US$ 1.21 1.23 1.26 1.26 1.30 1.26
£/US$ 1.37 1.37 1.42 N/A N/A 1.37
In 2020 new hedge contracts of US$ 4.5 billion (2 019: US$ 40.6 billion) were added at an average rate of 1.17 US$/€ (2019: 1.20 US$/€).
74 Airbus / Financial Statements 2020
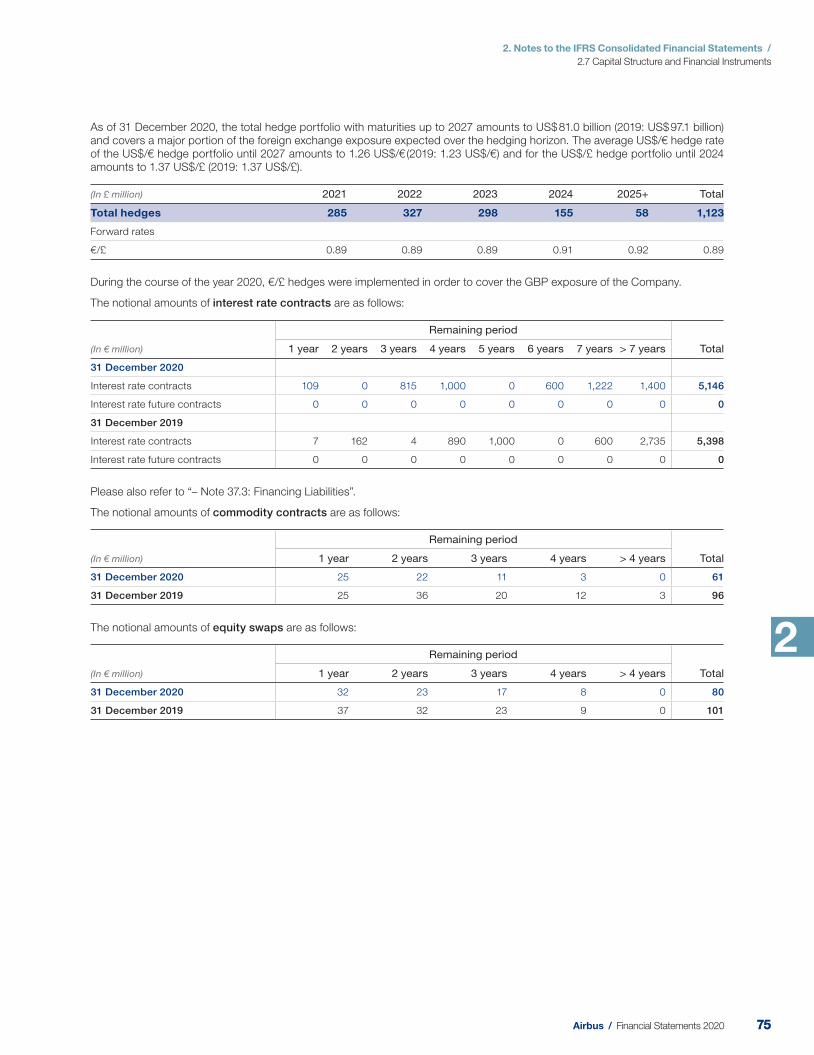
2. Notes to the IFRS Consolidated Financial Statements /
2.7 Capital Structure and Financial Instruments
2
As of 31 De cember 2020, the total hedge portfolio with maturities up to 2027 amounts to US$ 81.0 billion (2019: US$ 97.1 billion) and covers a major portion of the foreign exchange exposure expected over the hedging horizon. The average US$/€ hedge rate of the US$/€ hedge portfolio until 2027 amounts to 1.26 US$/€ (2019: 1.23 US$/€) and for the US$/£ hedge portfolio until 2024 amounts to 1.37 US$/£ (2019: 1.37 US$/£).
(In £ million) 2021 2022 2023 2024 2025+ Total
Total hedges 285 327 298 155 58 1,123
Forward rates
€/£ 0.89 0.89 0.89 0.91 0.92 0.89
During the course of the year 2020, €/£ hedges were implemented in order to cover the GBP exposure of the Company.
The notional amounts of interest rate contracts are as follows:
(In € million)
Remaining period
1 year 2 years 3 years 4 years 5 years 6 years 7 years > 7 years Total
31 December 2020
Interest rate contracts 109 0 815 1,000 0 600 1,222 1,400 5,146
Interest rate future contracts 0 0 0 0 0 0 0 0 0
31 December 2019
Interest rate contracts 7 162 4 890 1,000 0 600 2,735 5,398
Interest rate future contracts 0 0 0 0 0 0 0 0 0
Please also refer to “– Note 37.3: Financing Liabilities”.
The notional amounts of commodity contracts are as follows:
(In € million)
Remaining period
1 year 2 years 3 years 4 years > 4 years Total
31 December 2020 25 22 11 3 0 61
31 December 2019 25 36 20 12 3 96
The notional amounts of equity swaps are as follows:
(In € million)
Remaining period
1 year 2 years 3 years 4 years > 4 years Total
31 December 2020 32 23 17 8 0 80
31 December 2019 37 32 23 9 0 101
7575Airbus / Financial Statements 2020
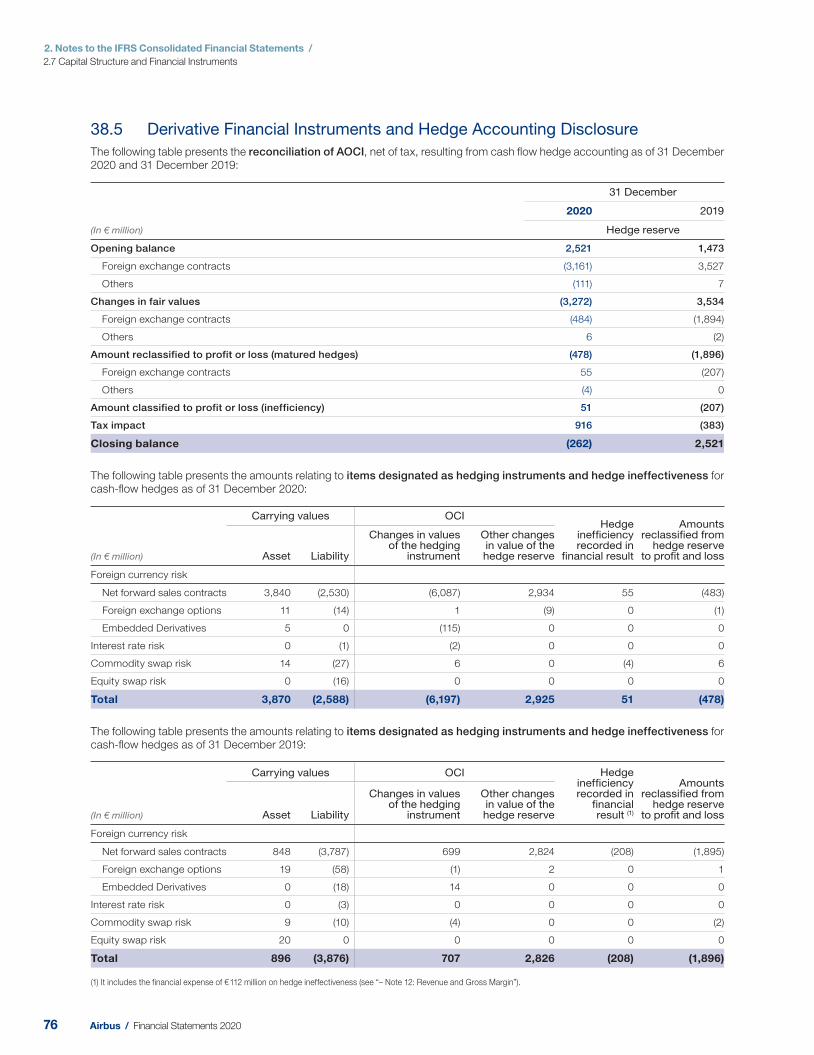
2. Notes to the IFRS Consolidated Financial Statements /
2.7 Capital Structure and Financial Instruments
38.5 Derivative Financial Instruments and Hedge Accounting Disclosure
The following table presents the reconciliation of AOCI, net of tax, resulting from cash fl ow hedge accounting as of 31 December 2020 and 31 December 2019:
(In € million)
31 December
2020 2019
Hedge reserve
Opening balance 2,521 1,473
Foreign exchange contracts (3,161) 3,527
Others (111) 7
Changes in fair values (3,272) 3,534
Foreign exchange contracts (484) (1,894)
Others 6 (2)
Amount reclassified to profit or loss (matured hedges) (478) (1,896)
Foreign exchange contracts 55 (207)
Others (4) 0
Amount classified to profit or loss (inefficiency) 51 (207)
Tax impact 916 (383)
Closing balance (262) 2,521
The following table presents the amounts relating to items designated as hedging instruments and hedge ineffectiveness for cash-fl ow hedges as of 31 December 2020:
(In € million)
Carrying values OCI Hedge
inefficiency recorded in
financial result
Amounts reclassified from
hedge reserve to profit and loss Asset Liability
Changes in values of the hedging
instrument
Other changes in value of the hedge reserve
Foreign currency risk
Net forward sales contracts 3,840 (2,530) (6,087) 2,934 55 (483)
Foreign exchange options 11 (14) 1 (9) 0 (1)
Embedded Derivatives 5 0 (115) 0 0 0
Interest rate risk 0 (1) (2) 0 0 0
Commodity swap risk 14 (27) 6 0 (4) 6
Equity swap risk 0 (16) 0 0 0 0
Total 3,870 (2,588) (6,197) 2,925 51 (478)
The following table presents the amounts relating to items designated as hedging instruments and hedge ineffectiveness for cash-fl ow hedges as of 31 December 2019:
(In € million)
Carrying values OCI Hedge inefficiency recorded in
financial result (1)
Amounts reclassified from
hedge reserve to profit and lossAsset Liability
Changes in values of the hedging
instrument
Other changes in value of thehedge reserve
Foreign currency risk
Net forward sales contracts 848 (3,787) 699 2,824 (208) (1,895)
Foreign exchange options 19 (58) (1) 2 0 1
Embedded Derivatives 0 (18) 14 0 0 0
Interest rate risk 0 (3) 0 0 0 0
Commodity swap risk 9 (10) (4) 0 0 (2)
Equity swap risk 20 0 0 0 0 0
Total 896 (3,876) 707 2,826 (208) (1,896)
(1) It includes the financial expense of € 112 million on hedge ineffectiveness (see “– Note 12: Revenue and Gross Margin”).
76 Airbus / Financial Statements 2020
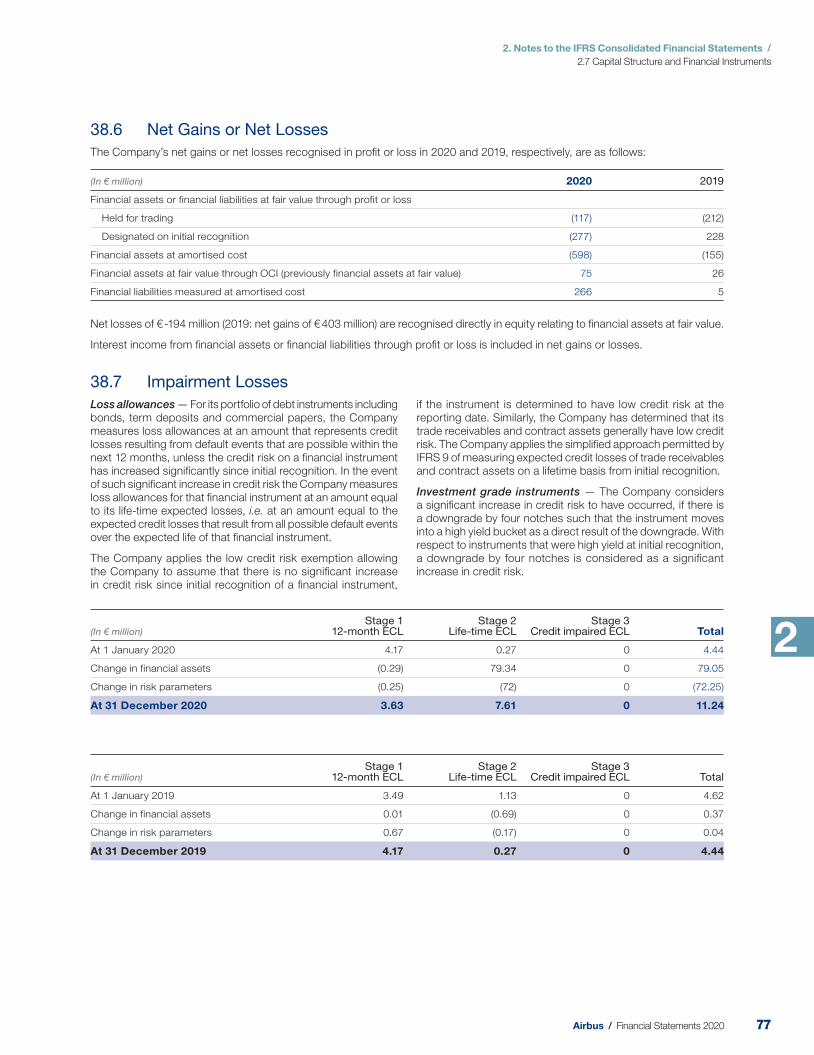
2. Notes to the IFRS Consolidated Financial Statements /
2.7 Capital Structure and Financial Instruments
2
38.6 Net Gains or Net Losses
The Company’s net gains or net losses recognised in profi t or loss in 2020 and 2019, respectively, are as follows:
(In € million) 2020 2019
Financial assets or financial liabilities at fair value through profit or loss
Held for trading (117) (212)
Designated on initial recognition (277) 228
Financial assets at amortised cost (598) (155)
Financial assets at fair value through OCI (previously financial assets at fair value) 75 26
Financial liabilities measured at amortised cost 266 5
Net losses of € -194 million (20 19: net gains of € 403 million) are recognised directly in equity relating to fi nancial assets at fair value.
Interest income from fi nancial assets or fi nancial liabilities through profi t or loss is included in net gains or losses.
38.7 Impairment Losses
Loss allowances — For its portfolio of debt instruments including bonds, term deposits and commercial papers, the Company measures loss allowances at an amount that represents credit losses resulting from default events that are possible within the next 12 months, unless the credit risk on a fi nancial instrument has increased signifi cantly since initial recognition. In the event of such signifi cant increase in credit risk the Company measures loss allowances for that fi nancial instrument at an amount equal to its life-time expected losses, i.e. at an amount equal to the expected credit losses that result from all possible default events over the expected life of that fi nancial instrument.
The Company applies the low credit risk exemption allowing the Company to assume that there is no signifi cant increase in credit risk since initial recognition of a fi nancial instrument,
if the instrument is determined to have low credit risk at the reporting date. Similarly, the Company has determined that its trade receivables and contract assets generally have low credit risk. The Company applies the simplifi ed approach permitted by IFRS 9 of measuring expected credit losses of trade receivables and contract assets on a lifetime basis from initial recognition.
Investment grade instruments — The Company considers a signifi cant increase in credit risk to have occurred, if there is a downgrade by four notches such that the instrument moves into a high yield bucket as a direct result of the downgrade. With respect to instruments that were high yield at initial recognition, a downgrade by four notches is considered as a signifi cant increase in credit risk.
(In € million)Stage 1
12-month ECLStage 2
Life-time ECL Stage 3
Credit impaired ECL Total
At 1 January 2020 4.17 0.27 0 4.44
Change in financial assets (0.29) 79.34 0 79.05
Change in risk parameters (0.25) (72) 0 (72.25)
At 31 December 2020 3.63 7.61 0 11.24
(In € million)Stage 1
12-month ECLStage 2
Life-time ECLStage 3
Credit impaired ECL Total
At 1 January 2019 3.49 1.13 0 4.62
Change in financial assets 0.01 (0.69) 0 0.37
Change in risk parameters 0.67 (0.17) 0 0.04
At 31 December 2019 4.17 0.27 0 4.44
7777Airbus / Financial Statements 2020
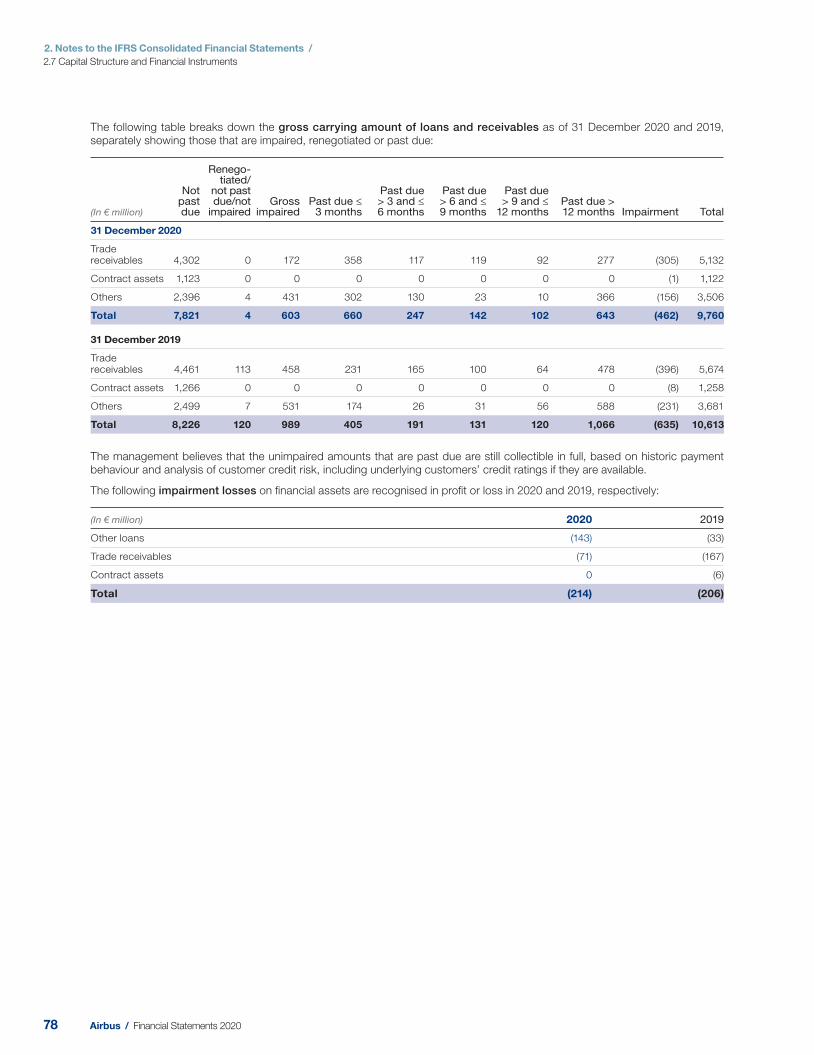
2. Notes to the IFRS Consolidated Financial Statements /
2.7 Capital Structure and Financial Instruments
The following table breaks down the gross carrying amount of loans and receivables as of 31 December 2020 and 2019, separately showing those that are impaired, renegotiated or past due:
(In € million)
Not past due
Renego-tiated/
not past due/not
impaired Gross
impaired Past due ≤
3 months
Past due > 3 and ≤6 months
Past due > 6 and ≤9 months
Past due > 9 and ≤
12 months Past due >12 months Impairment Total
31 December 2020
Trade receivables 4,302 0 172 358 117 119 92 277 (305) 5,132
Contract assets 1,123 0 0 0 0 0 0 0 (1) 1,122
Others 2,396 4 431 302 130 23 10 366 (156) 3,506
Total 7,821 4 603 660 247 142 102 643 (462) 9,760
31 December 2019
Trade receivables 4,461 113 458 231 165 100 64 478 (396) 5,674
Contract assets 1,266 0 0 0 0 0 0 0 (8) 1,258
Others 2,499 7 531 174 26 31 56 588 (231) 3,681
Total 8,226 120 989 405 191 131 120 1,066 (635) 10,613
The management believes that the unimpaired amounts that are past due are still collectible in full, based on historic payment behaviour and analysis of customer credit risk, including underlying customers’ credit ratings if they are available.
The following impairment losses on fi nancial assets are recognised in profi t or loss in 2020 and 2019, respectively:
(In € million) 2020 2019
Other loans (143) (33)
Trade receivables (71) (167)
Contract assets 0 (6)
Total (214) (206)
78 Airbus / Financial Statements 2020
2. Notes to the IFRS Consolidated Financial Statements /
2.8 Other Notes
2
2.8 Other Notes
39. Litigation and Claims
Litigation and claims — Various legal actions, governmental investigations, proceedings and other claims are pending or may be instituted or asserted in the future against the Company. Litigation is subject to many uncertainties, and the outcome of individual matters is not predictable with certainty. The Company believes that it has made adequate provisions to cover current or contemplated litigation risks. It is reasonably possible that the fi nal resolution of some of these matters may require the Company to make expenditures, in excess of established reserves, over an extended period of time and in a range of amounts that cannot be reasonably estimated. The term “reasonably possible” is used herein to mean that the chance of a future transaction or event occurring is more than remote but less than likely.
The Company is involved from time to time in various legal and arbitration proceedings in the ordinary course of its business, the most signifi cant of which are described below. Other than as described below, the Company is not aware of any material governmental, legal or arbitration proceedings (including any such proceedings which are pending or threatened), during a period covering at least the previous twelve months which may have, or have had in the recent past signifi cant effects on Airbus SE’s or the Company’s Financial Position or profi tability.
If the Company concludes that the disclosures relative to contingent liabilities can be expected to prejudice seriously its position in a dispute with other parties, the Company limits its disclosures to the nature of the dispute.
WTO
Although the Company is not a party, the Company is supporting the European Commission in litigation before the WTO. Following its unilateral withdrawal from the 1992 EU-US Agreement on Trade in Large Civil Aircraft, the US lodged a request on 6 October 2004 to initiate proceedings before the WTO. On the same day, the EU launched a parallel WTO case against the US in relation to its subsidies to Boeing.
Following a series of interim WTO panel decisions, in May 2018 the WTO held that the EU achieved compliance in respect of the majority of the subsidies at issue but considered that some remaining obligations required adjustments. The Company and the EU took corrective actions that were reviewed by a WTO panel. The decision of that panel is currently being appealed. In the meantime, the WTO authorised the US to impose US$ 7.5 billion in annual countermeasures. The United States Trade Representative (“USTR”) imposed tariffs on a range of imports to the US from the EU including 10% on the importation of large civil aircraft from the EU. Those tariffs went into effect on 18 October 2019. On 18 March 2020, the US increased the additional duty rate imposed on aircraft imported from the EU to 15%. On 12 January 2021, the US imposed an additional tariff of 15% on imports of aircraft manufacturing parts from certain Member States of the EU delivered to the US.
The tariffs could have a material impact on the Financial Statements, business and operations of the Company. Duties on the importation of Airbus products into the US could result in (i) increased costs for the aerospace and airline industries as well as other industries that rely on air transport, (ii) weakening demand for new aircraft and negatively affecting the fi nancial condition of air carriers and lessors, (iii) decisions to defer, reject or reschedule the delivery of new aircraft or limit the routes upon which new aircraft will be used, (iv) increased costs to consumers, and/or (v) damage to the Company’s business or reputation via negative publicity adversely affecting the Company’s prospects in the commercial market place.
Several years of proceedings also identifi ed signifi cant unlawful support to Boeing. In March 2019, the WTO found that the steps by the US to address US subsidies to Boeing were inadequate. In October 2020, the WTO announced its decision to authorise the EU to impose US$ 4 billion in annual countermeasures. In November 2020, the EU imposed tariffs on a range of imports to the EU from the US including 15% on the importation of large civil aircraft from the US.
The respective WTO authorisations to impose tariffs will remain valid until the EU or the US prove to the WTO that they are in full compliance, or until both parties agree to settle the dispute.
GPT
In August 2012, the UK Serious Fraud Offi ce (“SFO”) announced that it had opened a formal criminal investigation in relation to GPT Special Project Management Ltd (“GPT”). GPT is a UK company that operated in the Kingdom of Saudi Arabia which the Company acquired in 2007. GPT is now an indirect subsidiary of Airbus Defence and Space. It ceased operations in April 2020.
The SFO’s investigation related to contractual arrangements that had been put in place prior to GPT’s acquisition by the Company, but which continued thereafter.
On 29 July 2020, the SFO requisitioned (required) GPT to appear in court, and a series of hearings have followed. The single charge against GPT relates to alleged historic corruption in the Kingdom of Saudi Arabia between 2007 and 2012. No plea has yet been entered. For legal reasons, neither the Company nor GPT can comment further on it.
On 31 January 2020 the Company reached a fi nal agreement with investigating authorities in France, the UK and the US in relation to all wrongdoing alleged against the Company and its controlled subsidiaries, with the exception of the pre-existing and separate investigation into GPT. The Deferred Prosecution Agreement of 31 January 2020 mentioned below under “Investigation by the UK SFO, France’s PNF, US Departments of State and Justice and Related Commercial Litigation” is not affected in any way by the prosecution of GPT.
7979Airbus / Financial Statements 2020
2. Notes to the IFRS Consolidated Financial Statements /
2.8 Other Notes
Eurofi ghter Austria
In 2017, the Austrian Federal Ministry of Defence raised criminal allegations against Airbus Defence and Space GmbH and Eurofi ghter Jagdfl ugzeug GmbH for wilful deception and fraud in the context of the sale of the Eurofi ghter aircraft to Austria and respective damage claims. After the Austrian Federal Ministry of Defence raised its criminal allegations, the Austrian public prosecutor opened investigations against Airbus Defence and Space GmbH, Eurofi ghter Jagdfl ugzeug GmbH and former and current employees of the two entities including related to the corresponding offset obligations. The Company has fi led several submissions to the Austrian public prosecutor in response to the allegations of deception in the procurement of Eurofi ghter combat aircraft made by the Austrian Defence Minister. Since the result of the investigations by the Austrian public prosecutor did not confi rm the allegations of wilful deception and fraud, the Austrian authorities accordingly terminated the investigations against Airbus Defence and Space GmbH and Eurofi ghter Jagdfl ugzeug GmbH.
Investigation by the UK SFO, France’s PNF, US Departments of State and Justice and Related Commercial Litigation
The Company reached fi nal agreements (“the agreements”) with the French Parquet National Financier (“PNF”), the UK Serious Fraud Offi ce (“SFO”), and the US Department of Justice (“DoJ”) resolving the authorities’ investigations into allegations of bribery and corruption, as well as with the US Department of State (“DoS”) and the DoJ to resolve their investigations into inaccurate and misleading fi lings made with the DoS pursuant to the US International Traffi c in Arms Regulations (“ITAR”). The agreements were approved and made public on 31 January 2020.
Under the terms of the agreements, the Company agreed to pay penalties of € 3,597,766,766 plus interest and costs to the French, UK and US authorities. This was recognised in the Company’s 2019 accounts. The settlements with each authority were as follows: PNF € 2,083,137,455, the SFO € 983,974,311, the DoJ € 526,150,496 and the DoS € 9,009,008 of which € 4,504,504 May be used for approved remedial compliance measures. All penalties have been paid, except for $ 1 million that remains to be paid to the DoS by 28 January 2022.
Under the terms of the Convention judiciaire d’intérêt public (“CJIP”) with the PNF, the Company has an obligation to submit its compliance programme to targeted audits carried out by the Agence Française Anticorruption (“AFA”) over a period of three years.
Under the terms of the Deferred Prosecution Agreement (“DPA”) with the SFO, no independent compliance monitor will be imposed on the Company in light of the continuing monitorship to be conducted by the AFA.
Under the terms of the DPA with the DoJ, no independent compliance monitor will be imposed on Airbus under the agreement with the DoJ, but the Company will periodically report on its continuing compliance enhancement progress during the three year term of the DPA and carry out further reviews as required by the DoJ.
The agreements result in the suspension of prosecution for a duration of three years whereupon the prosecutions will be extinguished if the Company complies with their terms throughout the period.
Under the terms of the Consent Agreement with the DoS, the DoS has agreed to settle all civil violations of the ITAR outlined in the Company’s voluntary disclosures identified in the Consent Agreement, and the Company has agreed to retain an independent export control compliance offi cer, who will monitor the effectiveness of the Company’s export control systems and its compliance with the ITAR for a duration of three years.
Any breach of the terms of the agreements by the Company could lead to rescission by the authorities of the terms of the agreements and reopening of the prosecutions. Prosecution could result in the imposition of further monetary penalties or other sanctions including additional tax liability and could have a material impact on the Financial Statements, business and operations of the Company.
In addition to any pending investigation in other jurisdi ctions, the factual disclosures made in the course of reaching the agreements may result in the commencement of additional investigations in other jurisdictions. Such investigations could also result in (i) civil claims or claims by shareholders against the Company, (ii) adverse consequences on the Company’s ability to obtain or continue fi nancing for current or future projects, (iii) limitations on the eligibility of group companies for certain public sector contracts, and/or (iv) damage to the Company’s business or reputation via negative publicity adversely affecting the Company’s prospects in the commercial market place.
Airbus will continue to cooperate with the authorities in the future, pursuant to the agreements and to enhance its strong Ethics & Compliance culture within the Company.
Several consultants and other third parties have initiated commercial litigation and arbitration against the Company seeking relief. The agreements reached with authorities may lead to additional commercial litigation and arbitration against the Company and tax liability in the future, which could have a material impact on the Financial Statements, business and operations of the Company.
Securities Litigation
In August 2020, a putative class action lawsuit was fi led in US federal court in the state of New Jersey against Airbus SE and members of its current and former management. The lawsuit was brought on behalf of alleged shareholders that purchased or otherwise acquired Airbus SE securities in the US between 24 February 2016 and 30 July 2020, and asserts violations of US securities laws. The complaint alleges that defendants made false and misleading statements or omissions concerning, among other things, the Company’s agreements approved on 31 January 2020 with the French PNF, the UK SFO, the US DoJ and the US DoS as well as the Company’s historic practices regarding the use of third party business partners and anti-corruption compliance. The lawsuit seeks unquantifi ed damages. The Company believes it has solid grounds to defend itself against the allegations. The consequences of such litigation and the outcome of the proceedings cannot be fully assessed at this stage, but any judgement or decision unfavourable to the Company could have a material adverse impact on the Financial Statements, business and operations of the Company.
80 Airbus / Financial Statements 2020
2. Notes to the IFRS Consolidated Financial Statements /
2.8 Other Notes
2
40. Auditor Fees
With reference to Section 2:382a (1) and (2) of the Netherlands Civil Code, the following fees for the fi nancial year 2020 have been charged by EY to the Company, its subsidiaries and other consolidated entities:
(In € thousand) 2020 2019
Audit of the Financial Statements 11,386 11,618
Other audit engagements 308 220
Tax services 445 1,037
Other non-audit services 447 1,726
Total 12,586 14,601
Other audit fi rms have audit fees related to audit process, certifi cation and examination of individual and consolidated accounts of € 5 million in 20 20 (20 19: € 6 million).
41. Events after the Reporting Date
Other Investigations
The Company is cooperating fully with the authorities in a judicial investigation in France related to Kazakhstan. In this spirit, the Company asked to be interviewed by the investigating magistrates and has been granted the status of “assisted witness” in the investigation.
In 2019, the Company self-reported to German authorities potentially improper advance receipt and communication of confi dential customer information by employees of Airbus Defence and Space GmbH. The information concerned relates to two future German government procurement projects in the programme line Connected Intelligence. The self-disclosure by the Company follows an ongoing internal review with the support of an external law fi rm. Both the German Ministry of Defence and the Munich public prosecutor opened an investigation into the matter. The Company will continue to fully cooperate with
relevant authorities. The investigation could have an impact on Airbus Defence and Space GmbH’s and Airbus Secure Land Communications GmbH’s ability to participate in future public procurement projects in Germany and may have other legal consequences.
Other Disputes
In the course of a commercial dispute, the Company received a statement of claim by the Republic of China (Taiwan) alleging liability for refunding part of the purchase price of a large contract for the supply of missiles by subsidiary Matra Défense S.A.S., which the customer claims it was not obliged to pay. An arbitral award was rendered on 12 January 2018 with a principal amount of € 104 million plus interest and costs against Matra Défense S.A.S. Post-award proceedings are currently underway.
In r esponse to the market environment, the Company is updating its production rate planning.
For its A320 Family aircraft, the new average production rates will now lead to a gradual increase in production from the current rate of 40 per month to 43 and 45, respectively in the third and fourth quarter of 2021. The A220 monthly production rate will increase from four to fi ve aircraft per month from the end of the fi rst quarter of 2021. Widebody production is expected to remain stable at current levels.
8181Airbus / Financial Statements 2020
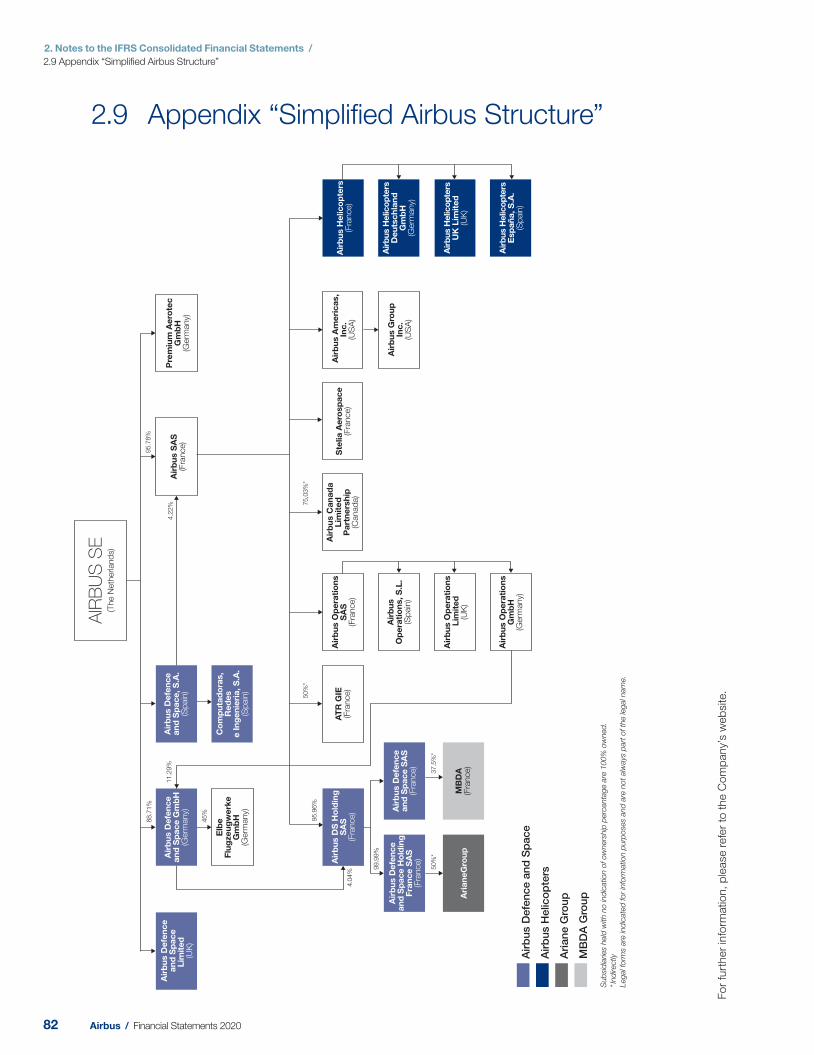
2. Notes to the IFRS Consolidated Financial Statements /
2.9 Appendix “Simplifi ed Airbus Structure”
AIR
BU
S S
E(T
he N
eth
erland
s)
Air
bu
s D
efe
nc
e
an
d S
pa
ce
Gm
bH
(Germ
any)
Elb
eF
lug
ze
ug
we
rke
Gm
bH
(Germ
any)
Pre
miu
m A
ero
tec
Gm
bH
(Germ
any)
Air
bu
s D
efe
nc
ea
nd
Sp
ac
e
Lim
ite
d(U
K)
Air
bu
s O
pe
rati
on
sS
AS
(Fra
nce)
Air
bu
s O
pe
rati
on
s L
imit
ed
(U
K)
Air
bu
s O
pe
rati
on
s
Gm
bH
(G
erm
any)
Air
bu
s
Op
era
tio
ns, S
.L.
(Sp
ain
)
Air
bu
s H
elic
op
ters
(Fra
nce)
Air
bu
s D
efe
nc
e
an
d S
pa
ce
, S
.A.
(Sp
ain
)
Co
mp
uta
do
ras,
Re
de
se
In
ge
nie
ria
, S
.A.
(Sp
ain
)
Air
bu
s H
elic
op
ters
Esp
añ
a, S
.A.
(Sp
ain
)
Air
bu
s H
elic
op
ters
UK
Lim
ite
d
(UK
)
Air
bu
s H
elico
pte
rsD
eu
tsc
hla
nd
G
mb
H
(Germ
any)
95.7
8%
95.9
6%
75,0
3%
*50%
*
45%
88.7
1%
11.2
9%
4.0
4%
4.2
2%
Air
bu
s A
me
ric
as,
Inc
.(U
SA
)
Air
bu
s G
rou
pIn
c.
(US
A)
Air
bu
s S
AS
(F
rance)
Ste
lia
Ae
rosp
ac
e
(Fra
nce)
Air
bu
s C
an
ad
aL
imit
ed
P
art
ne
rsh
ip(C
anad
a)
AT
R G
IE(F
rance)
Air
bu
s D
S H
old
ing
S
AS
(Fra
nce)
MB
DA
(Fra
nce)
Air
bu
s D
efe
nc
e
an
d S
pa
ce
SA
S
(Fra
nce)
Air
bu
s D
efe
nc
e
an
d S
pa
ce
Ho
ldin
gF
ran
ce
SA
S
(Fra
nce)
Ari
an
eG
rou
p
50%
*
99.9
9%
37.5
%*
Air
bu
s D
efe
nce a
nd
Sp
ace
Air
bu
s H
elic
op
ters
Ari
an
e G
rou
p
MB
DA
Gro
up
Sub
sid
iaries h
eld
with
no in
dic
atio
n o
f ow
ners
hip
perc
enta
ge a
re 1
00%
ow
ned
.
* In
directly
Legal f
orm
s a
re in
dic
ate
d for
info
rmatio
n p
urp
oses a
nd
are
not alw
ays
part
of th
e le
gal n
am
e.
2.9 Appendix “Simplifi ed Airbus Structure”
Fo
r fu
rther
info
rmatio
n,
ple
ase r
efe
r to
the C
om
pany’
s w
eb
site.
82 Airbus / Financial Statements 2020

2. Notes to the IFRS Consolidated Financial Statements /
2
8383Airbus / Financial Statements 2020

Chapter
384 Airbus / Financial Statements 2020
85 Airbus / Financial Statements 2020
IFRS Company Income Statement
for the years ended 31 December 2020 and 2019 86
IFRS Company Statement of Comprehensive Income
for the years ended 31 December 2020 and 2019 86
IFRS Company Statement of Financial Position
for the years ended 31 December 2020 and 2019 87
IFRS Company Statement of Cash Flows
for the years ended 31 December 2020 and 2019 88
IFRS Company Statement of Changes in Equity
for the years ended 31 December 2020 and 2019 89
3. Airbus SE IFRS Company Financial Statements
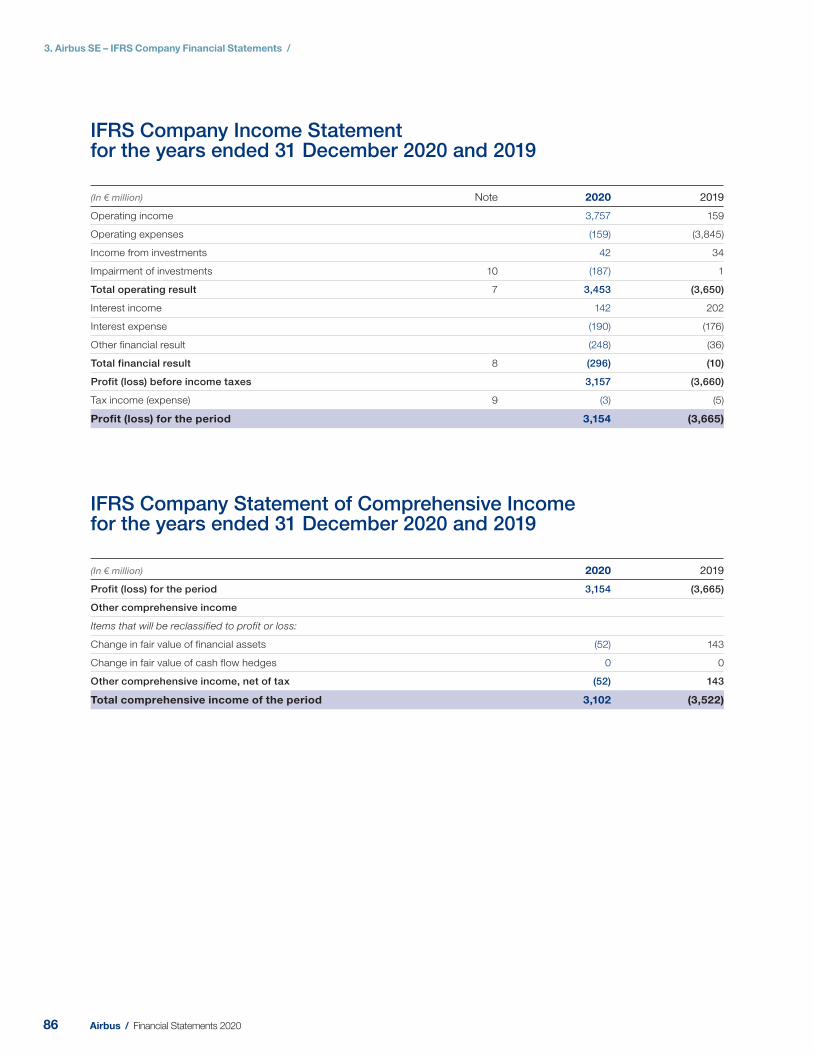
3. Airbus SE – IFRS Company Financial Statements /
IFRS Company Income Statementfor the years ended 31 December 2020 and 2019
(In € million) Note 2020 2019
Operating income 3,757 159
Operating expenses (159) (3,845)
Income from investments 42 34
Impairment of investments 10 (187) 1
Total operating result 7 3,453 (3,650)
Interest income 142 202
Interest expense (190) (176)
Other financial result (248) (36)
Total financial result 8 (296) (10)
Profit (loss) before income taxes 3,157 (3,660)
Tax income (expense) 9 (3) (5)
Profit (loss) for the period 3,154 (3,665)
IFRS Company Statement of Comprehensive Incomefor the years ended 31 December 2020 and 2019
(In € million) 2020 2019
Profit (loss) for the period 3,154 (3,665)
Other comprehensive income
Items that will be reclassified to profit or loss:
Change in fair value of financial assets (52) 143
Change in fair value of cash flow hedges 0 0
Other comprehensive income, net of tax (52) 143
Total comprehensive income of the period 3,102 (3,522)
86 Airbus / Financial Statements 2020
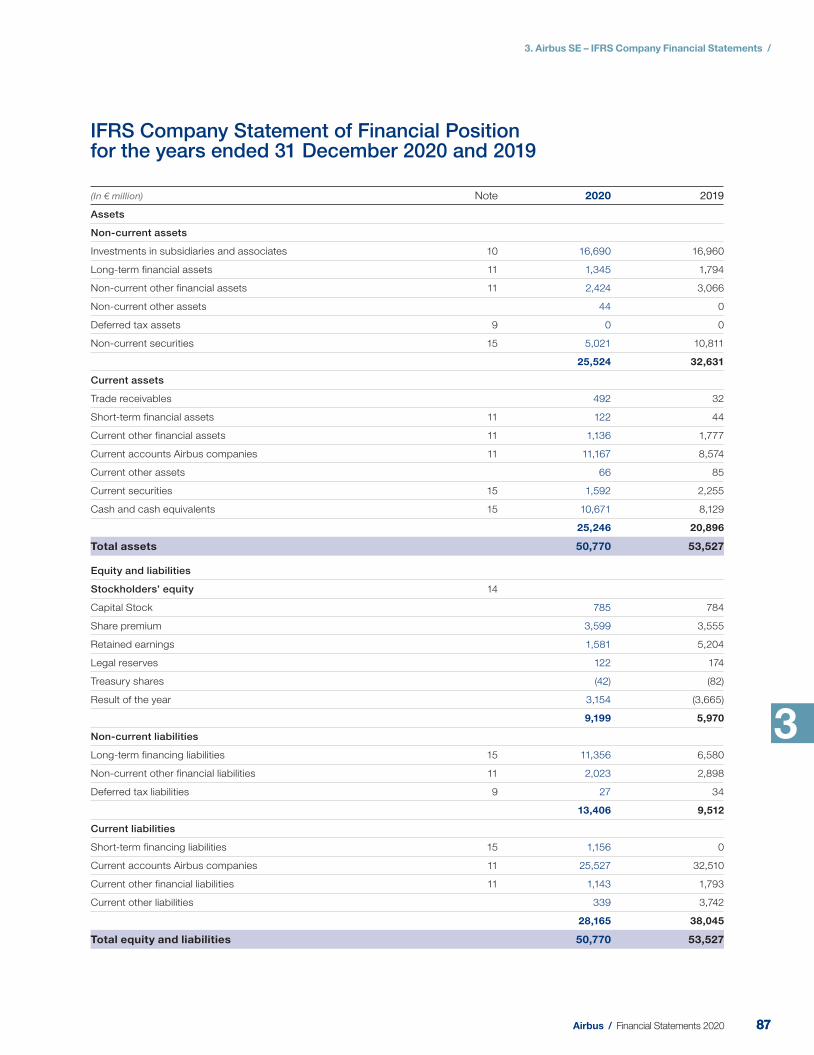
3. Airbus SE – IFRS Company Financial Statements /
3
IFRS Company Statement of Financial Position for the years ended 31 December 2020 and 2019
(In € million) Note 2020 2019
Assets
Non-current assets
Investments in subsidiaries and associates 10 16,690 16,960
Long-term financial assets 11 1,345 1,794
Non-current other financial assets 11 2,424 3,066
Non-current other assets 44 0
Deferred tax assets 9 0 0
Non-current securities 15 5,021 10,811
25,524 32,631
Current assets
Trade receivables 492 32
Short-term financial assets 11 122 44
Current other financial assets 11 1,136 1,777
Current accounts Airbus companies 11 11,167 8,574
Current other assets 66 85
Current securities 15 1,592 2,255
Cash and cash equivalents 15 10,671 8,129
25,246 20,896
Total assets 50,770 53,527
Equity and liabilities
Stockholders’ equity 14
Capital Stock 785 784
Share premium 3,599 3,555
Retained earnings 1,581 5,204
Legal reserves 122 174
Treasury shares (42) (82)
Result of the year 3,154 (3,665)
9,199 5,970
Non-current liabilities
Long-term financing liabilities 15 11,356 6,580
Non-current other financial liabilities 11 2,023 2,898
Deferred tax liabilities 9 27 34
13,406 9,512
Current liabilities
Short-term financing liabilities 15 1,156 0
Current accounts Airbus companies 11 25,527 32,510
Current other financial liabilities 11 1,143 1,793
Current other liabilities 339 3,742
28,165 38,045
Total equity and liabilities 50,770 53,527
8787Airbus / Financial Statements 2020
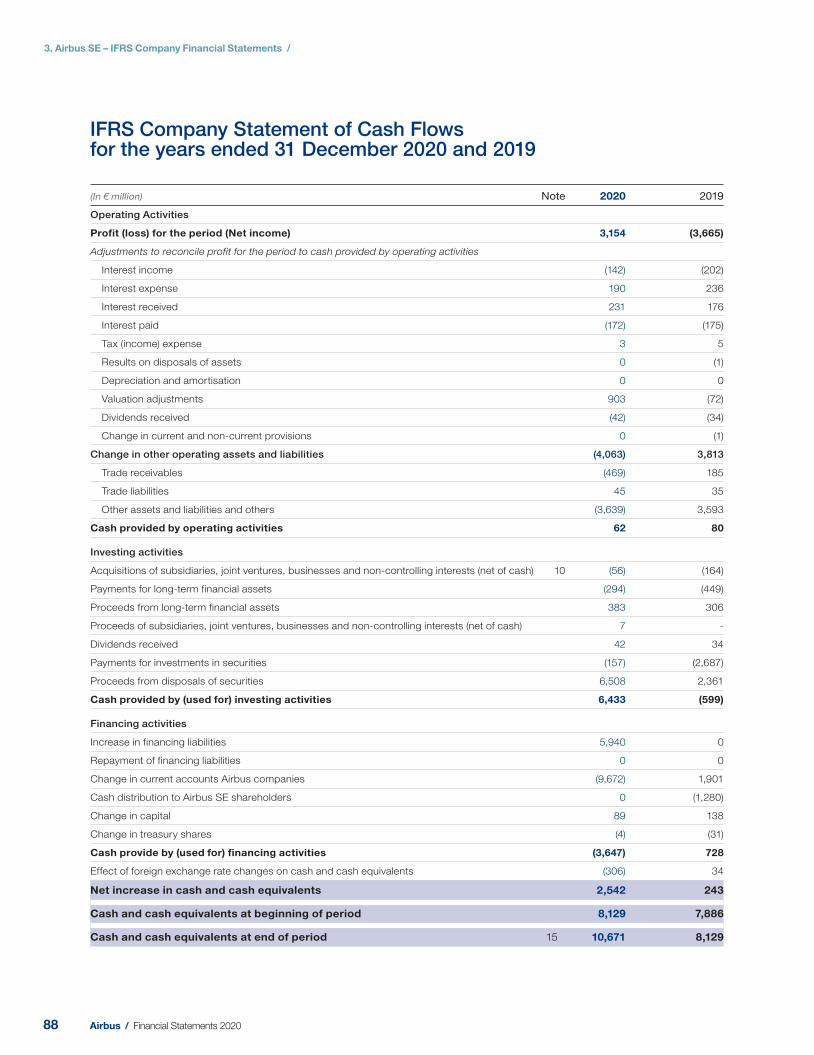
3. Airbus SE – IFRS Company Financial Statements /
IFRS Company Statement of Cash Flowsfor the years ended 31 December 2020 and 2019
(In € million) Note 2020 2019
Operating Activities
Profit (loss) for the period (Net income) 3,154 (3,665)
Adjustments to reconcile profit for the period to cash provided by operating activities
Interest income (142) (202)
Interest expense 190 236
Interest received 231 176
Interest paid (172) (175)
Tax (income) expense 3 5
Results on disposals of assets 0 (1)
Depreciation and amortisation 0 0
Valuation adjustments 903 (72)
Dividends received (42) (34)
Change in current and non-current provisions 0 (1)
Change in other operating assets and liabilities (4,063) 3,813
Trade receivables (469) 185
Trade liabilities 45 35
Other assets and liabilities and others (3,639) 3,593
Cash provided by operating activities 62 80
Investing activities
Acquisitions of subsidiaries, joint ventures, businesses and non-controlling interests (net of cash) 10 (56) (164)
Payments for long-term financial assets (294) (449)
Proceeds from long-term financial assets 383 306
Proceeds of subsidiaries, joint ventures, businesses and non-controlling interests (net of cash) 7 -
Dividends received 42 34
Payments for investments in securities (157) (2,687)
Proceeds from disposals of securities 6,508 2,361
Cash provided by (used for) investing activities 6,433 (599)
Financing activities
Increase in financing liabilities 5,940 0
Repayment of financing liabilities 0 0
Change in current accounts Airbus companies (9,672) 1,901
Cash distribution to Airbus SE shareholders 0 (1,280)
Change in capital 89 138
Change in treasury shares (4) (31)
Cash provide by (used for) financing activities (3,647) 728
Effect of foreign exchange rate changes on cash and cash equivalents (306) 34
Net increase in cash and cash equivalents 2,542 243
Cash and cash equivalents at beginning of period 8,129 7,886
Cash and cash equivalents at end of period 15 10,671 8,129
88 Airbus / Financial Statements 2020
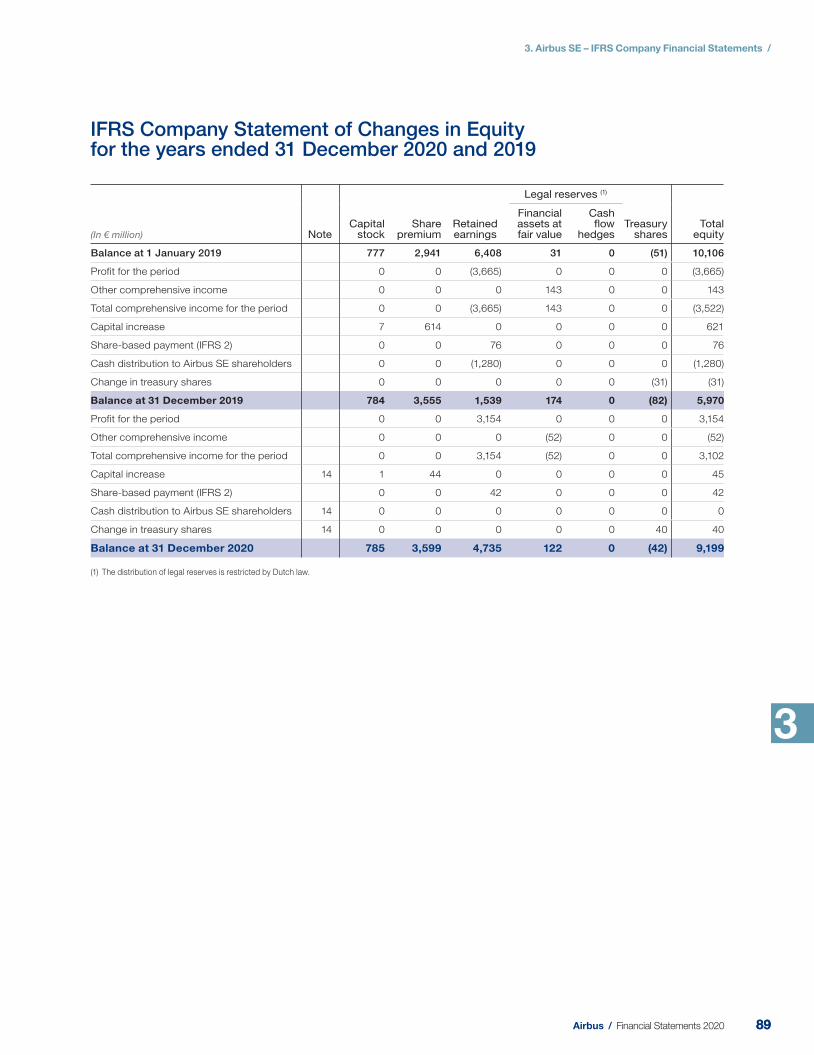
3. Airbus SE – IFRS Company Financial Statements /
3
IFRS Company Statement of Changes in Equityfor the years ended 31 December 2020 and 2019
(In € million) NoteCapital
stockShare
premiumRetained earnings
Legal reserves (1)
Treasury shares
Total equity
Financial assets at fair value
Cash flow
hedges
Balance at 1 January 2019 777 2,941 6,408 31 0 (51) 10,106
Profit for the period 0 0 (3,665) 0 0 0 (3,665)
Other comprehensive income 0 0 0 143 0 0 143
Total comprehensive income for the period 0 0 (3,665) 143 0 0 (3,522)
Capital increase 7 614 0 0 0 0 621
Share-based payment (IFRS 2) 0 0 76 0 0 0 76
Cash distribution to Airbus SE shareholders 0 0 (1,280) 0 0 0 (1,280)
Change in treasury shares 0 0 0 0 0 (31) (31)
Balance at 31 December 2019 784 3,555 1,539 174 0 (82) 5,970
Profit for the period 0 0 3,154 0 0 0 3,154
Other comprehensive income 0 0 0 (52) 0 0 (52)
Total comprehensive income for the period 0 0 3,154 (52) 0 0 3,102
Capital increase 14 1 44 0 0 0 0 45
Share-based payment (IFRS 2) 0 0 42 0 0 0 42
Cash distribution to Airbus SE shareholders 14 0 0 0 0 0 0 0
Change in treasury shares 14 0 0 0 0 0 40 40
Balance at 31 December 2020 785 3,599 4,735 122 0 (42) 9,199
(1) The distribution of legal reserves is restricted by Dutch law.
8989Airbus / Financial Statements 2020

Chapter
490 Airbus / Financial Statements 2020
91 Airbus / Financial Statements 2020
4.1 Basis of Presentation 93
4.2 Company Performance 96
4.3 Operational Assets and Liabilities 99
4.4 Employees 102
4.5 Capital Structure and Financial Instruments 102
4.6 Other Notes 113
4.Notes to the IFRS Company Financial Statements
4. Notes to the IFRS Company Financial Statements /
4.1 Basis of Presentation 93
1. The Company 93
2. Impact of the COVID-19 pandemic 93
3. Signifi cant Accounting Policies 93
4. Key Estimates and Judgements 94
5. Brexit 94
6. Related Party Transactions 95
4.2 Company Performance 96
7. Total Operating Result 96
8. Total Financial Result 96
9. Income Tax 97
4.3 Operational Assets and Liabilities 99
10. Investments in Subsidiaries, Associates
and Participations 99
11. Financial Assets and Financial Liabilities 101
12. Commitments and Contingencies 101
4.4 Employees 102
13. Number of Employees 102
4.5 Capital Structure
and Financial Instruments 102
14. Total Equity 102
15. Cash, Securities and Financing Liabilities 104
16. Information about Financial Instruments 107
4.6 Other Notes 113
17. Auditor Fees 113
18. Events after the Reporting Date 113
Contents /
92 Airbus / Financial Statements 2020
4. Notes to the IFRS Company Financial Statements /
4
4.1 Basis of Presentation
1. The Company
The Company’s principal activity is acting as a holding and management company for the subsidiaries of Airbus SE, the “Company”, a listed company in the form of a European public limited-liability company (Societas Europaea), legally seated in Amsterdam (current registered offi ce at Mendelweg 30, 2333 CS Leiden, The Netherlands) and registered at the Dutch
Commercial Register (Handelsregister) in The Hague under number 24288945. The Company is listed on the European stock exchanges in Paris, Frankfurt am Main, Madrid, Barcelona, Valencia and Bilbao. The IFRS Financial Statements were authorised for issue by the Company’s Board of Directors on 17 February 2021.
2. Impact of the COVID-19 pandemic
3. Signifi cant Accounting Policies
Regarding the impact of the COVID-19 pandemic, please refer to “– Note 2: Impact of the COVID-19 pandemic” of the Consolidated Financial Statements.
Basis of preparation — The Company’s Financial Statements are prepared in accordance with International Financial Reporting Standards (“IFRS”), issued by the International Accounting Standards Board (“IASB”) as endorsed by the European Union (“EU”) and with Part 9 of Book 2 of the Netherlands Civil Code. They are prepared and reported in euro (“€”) and all values are rounded to the nearest million appropriately. Due to rounding, numbers presented may not add up precisely to the totals provided and percentages may not precisely refl ect the absolute fi gures.
In the Company Financial Statements of Airbus SE, unless otherwise disclosed, the same accounting principles have been applied as set out in the Notes to the Consolidated Financial Statements, except for the valuation of the investments as presented under investments in subsidiaries and associates in the Company Financial Statements. These policies have been consistently applied to all years presented.
In the Company Financial Statements, the investments in subsidiaries and associates are recorded at acquisition cost. In the Company Income Statement, dividends received from investments are recorded as dividend income.
Due to this application, the Company equity and net result are not equal to the consolidated equity and net result. A reconciliation of the total shareholders’ equity and profi t for the period is presented in “– Note 14: Total Equity” to the Company Financial Statements.
The Company Financial Statements have been prepared on a historical cost basis, except for the equity instruments, securities and derivative instruments that have been measured at fair value.
Regarding the application of new, revised or amended IFRS issued and applying from 1 January 2020 and issued but not yet applied please refer to “– Note 5: Change in Accounting Policies and Disclosures” of the Consolidated Financial Statements.
In addition, no material changes are expected in the Company Financial Statements of Airbus SE from the implementation of the new standards not yet applied. Further information about Share-based payment and Employee Stock Ownership Plans (ESOP) is presented in Note 33 and information about Remuneration is presented in Note 34 of the Consolidated Financial Statements.
9393Airbus / Financial Statements 2020
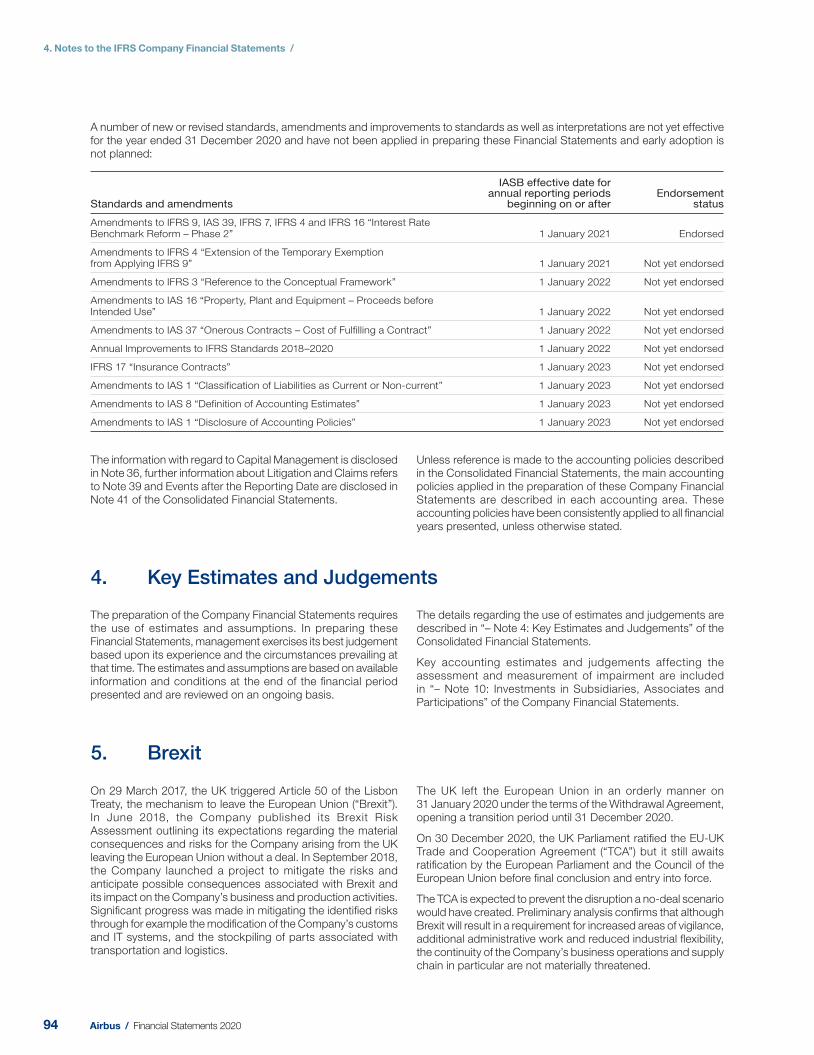
4. Notes to the IFRS Company Financial Statements /
4. Key Estimates and Judgements
5. Brexit
The preparation of the Company Financial Statements requires the use of estimates and assumptions. In preparing these Financial Statements, management exercises its best judgement based upon its experience and the circumstances prevailing at that time. The estimates and assumptions are based on available information and conditions at the end of the fi nancial period presented and are reviewed on an ongoing basis.
The details regarding the use of estimates and judgements are described in “– Note 4: Key Estimates and Judgements” of the Consolidated Financial Statements.
Key accounting estimates and judgements affecting the assessment and measurement of impairment are included in “– Note 10: Investments in Subsidiaries, Associates and Participations” of the Company Financial Statements.
On 29 March 2017, the UK triggered Article 50 of the Lisbon Treaty, the mechanism to leave the European Union (“Brexit”). In June 2018, the Company published its Brexit Risk Assessment outlining its expectations regarding the material consequences and risks for the Company arising from the UK leaving the European Union without a deal. In September 2018, the Company launched a project to mitigate the risks and anticipate possible consequences associated with Brexit and its impact on the Company’s business and production activities. Signifi cant progress was made in mitigating the identifi ed risks through for example the modifi cation of the Company’s customs and IT systems, and the stockpiling of parts associated with transportation and logistics.
The UK left the European Union in an orderly manner on 31 January 2020 under the terms of the Withdrawal Agreement, opening a transition period until 31 December 2020.
On 30 December 2020, the UK Parliament ratifi ed the EU-UK Trade and Cooperation Agreement (“TCA”) but it still awaits ratifi cation by the European Parliament and the Council of the European Union before fi nal conclusion and entry into force.
The TCA is expected to prevent the disruption a no-deal scenario would have created. Preliminary analysis confi rms that although Brexit will result in a requirement for increased areas of vigilance, additional administrative work and reduced industrial fl exibility, the continuity of the Company’s business operations and supply chain in particular are not materially threatened.
A number of new or revised standards, amendments and improvements to standards as well as interpretations are not yet effective for the year ended 31 Decem ber 2020 and have not been applied in preparing these Financial Statements and early adoption is not planned:
Standards and amendments
IASB effective date for annual reporting periods
beginning on or afterEndorsement
status
Amendments to IFRS 9, IAS 39, IFRS 7, IFRS 4 and IFRS 16 “Interest Rate Benchmark Reform – Phase 2” 1 January 2021 Endorsed
Amendments to IFRS 4 “Extension of the Temporary Exemption from Applying IFRS 9” 1 January 2021 Not yet endorsed
Amendments to IFRS 3 “Reference to the Conceptual Framework” 1 January 2022 Not yet endorsed
Amendments to IAS 16 “Property, Plant and Equipment – Proceeds before Intended Use” 1 January 2022 Not yet endorsed
Amendments to IAS 37 “Onerous Contracts – Cost of Fulfilling a Contract” 1 January 2022 Not yet endorsed
Annual Improvements to IFRS Standards 2018–2020 1 January 2022 Not yet endorsed
IFRS 17 “Insurance Contracts” 1 January 2023 Not yet endorsed
Amendments to IAS 1 “Classification of Liabilities as Current or Non-current” 1 January 2023 Not yet endorsed
Amendments to IAS 8 “Definition of Accounting Estimates” 1 January 2023 Not yet endorsed
Amendments to IAS 1 “Disclosure of Accounting Policies” 1 January 2023 Not yet endorsed
The information with regard to Capital Management is disclosed in Note 36, further information about Litigation and Claims refers to Note 39 and Events after the Reporting Date are disclosed in Note 41 of the Consolidated Financial Statements.
Unless reference is made to the accounting policies described in the Consolidated Financial Statements, the main accounting policies applied in the preparation of these Company Financial Statements are described in each accounting area. These accounting policies have been consistently applied to all fi nancial years presented, unless otherwise stated.
94 Airbus / Financial Statements 2020
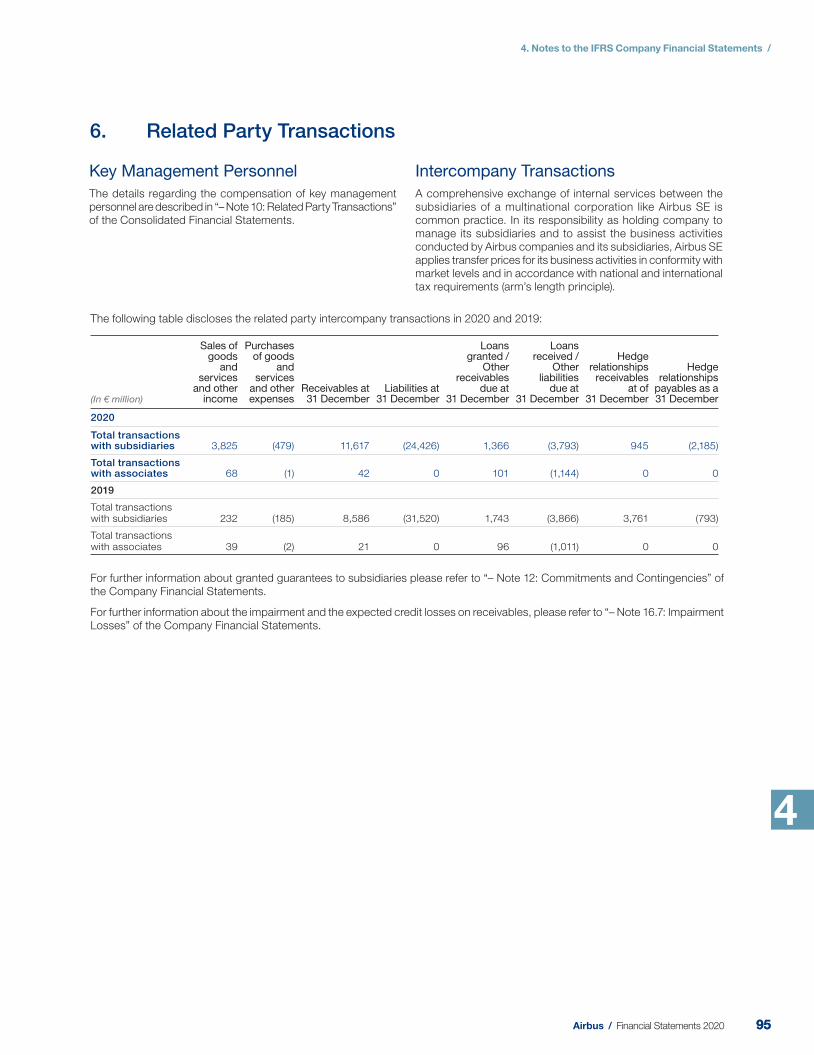
4. Notes to the IFRS Company Financial Statements /
4
The following table discloses the related party intercompany transactions in 2020 and 2019:
(In € million)
Sales of goods
and services
and other income
Purchases of goods
and services
and other expenses
Receivables at 31 December
Liabilities at 31 December
Loans granted /
Other receivables
due at 31 December
Loans received /
Other liabilities
due at 31 December
Hedge relationships
receivables at of
31 December
Hedge relationships
payables as a 31 December
2020
Total transactions with subsidiaries 3,825 (479) 11,617 (24,426) 1,366 (3,793) 945 (2,185)
Total transactions with associates 68 (1) 42 0 101 (1,144) 0 0
2019
Total transactions with subsidiaries 232 (185) 8,586 (31,520) 1,743 (3,866) 3,761 (793)
Total transactions with associates 39 (2) 21 0 96 (1,011) 0 0
For further information about granted guarantees to subsidiaries please refer to “– Note 12: Commitments and Contingencies” of the Company Financial Statements.
For further information about the impairment and the expected credit losses on receivables, please refer to “– Note 16.7: Impairment Losses” of the Company Financial Statements.
6. Related Party Transactions
Key Management Personnel
The details regarding the compensation of key management personnel are described in “– Note 10: Related Party Transactions” of the Consolidated Financial Statements.
Intercompany Transactions
A comprehensive exchange of internal services between the subsidiaries of a multinational corporation like Airbus SE is common practice. In its responsibility as holding company to manage its subsidiaries and to assist the business activities conducted by Airbus companies and its subsidiaries, Airbus SE applies transfer prices for its business activities in conformity with market levels and in accordance with national and international tax requirements (arm’s length principle).
9595Airbus / Financial Statements 2020
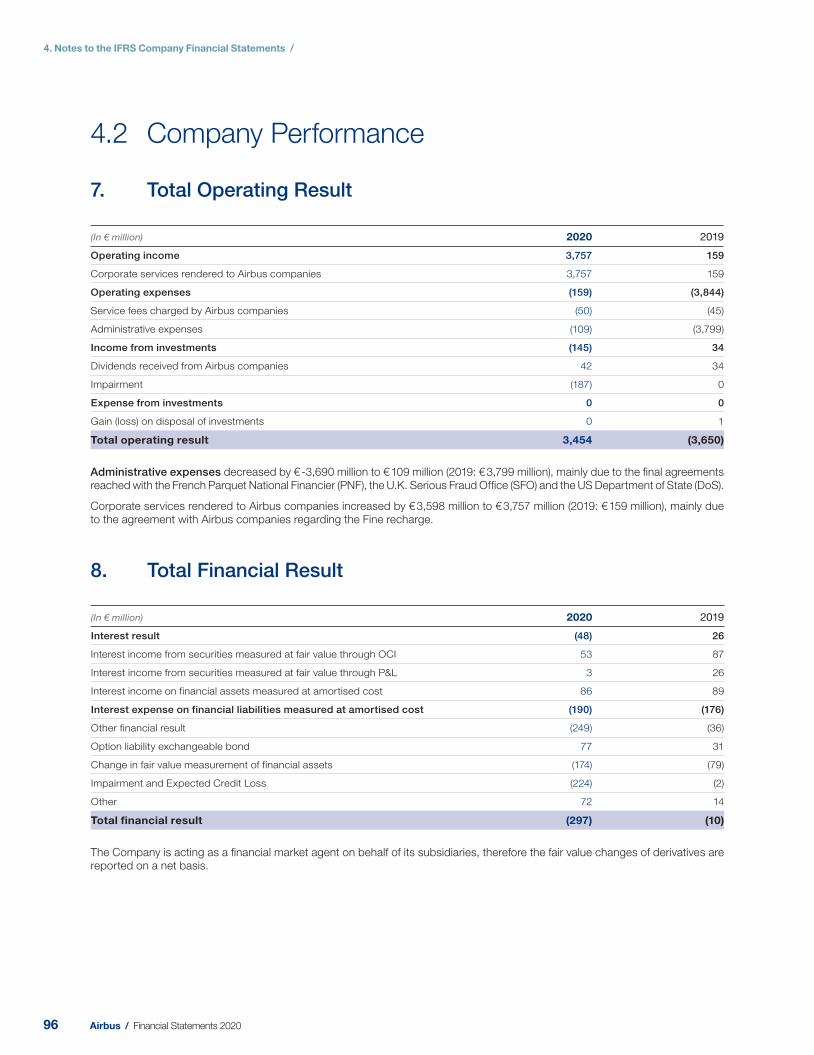
4. Notes to the IFRS Company Financial Statements /
4.2 Company Performance
7. Total Operating Result
(In € million) 2020 2019
Operating income 3,757 159
Corporate services rendered to Airbus companies 3,757 159
Operating expenses (159) (3,844)
Service fees charged by Airbus companies (50) (45)
Administrative expenses (109) (3,799)
Income from investments (145) 34
Dividends received from Airbus companies 42 34
Impairment (187) 0
Expense from investments 0 0
Gain (loss) on disposal of investments 0 1
Total operating result 3,454 (3,650)
Administrative expenses decreased by € -3,690 million to € 109 million (2019: € 3,799 million), mainly due to the fi nal agreements reached with the French Parquet National Financier (PNF), the U.K. Serious Fraud Offi ce (SFO) and the US Department of State (DoS).
Corporate services rendered to Airbus c ompanies increased by € 3,598 million to € 3,757 million (2019: € 159 million), mainly due to the agreement with Airbus c ompanies regarding the Fine recharge.
8. Total Financial Result
(In € million) 2020 2019
Interest result (48) 26
Interest income from securities measured at fair value through OCI 53 87
Interest income from securities measured at fair value through P&L 3 26
Interest income on financial assets measured at amortised cost 86 89
Interest expense on financial liabilities measured at amortised cost (190) (176)
Other financial result (249) (36)
Option liability exchangeable bond 77 31
Change in fair value measurement of financial assets (174) (79)
Impairment and Expected Credit Loss (224) (2)
Other 72 14
Total financial result (297) (10)
The Company is acting as a fi nancial market agent on behalf of its subsidiaries, therefore the fair value changes of derivatives are reported on a net basis.
96 Airbus / Financial Statements 2020
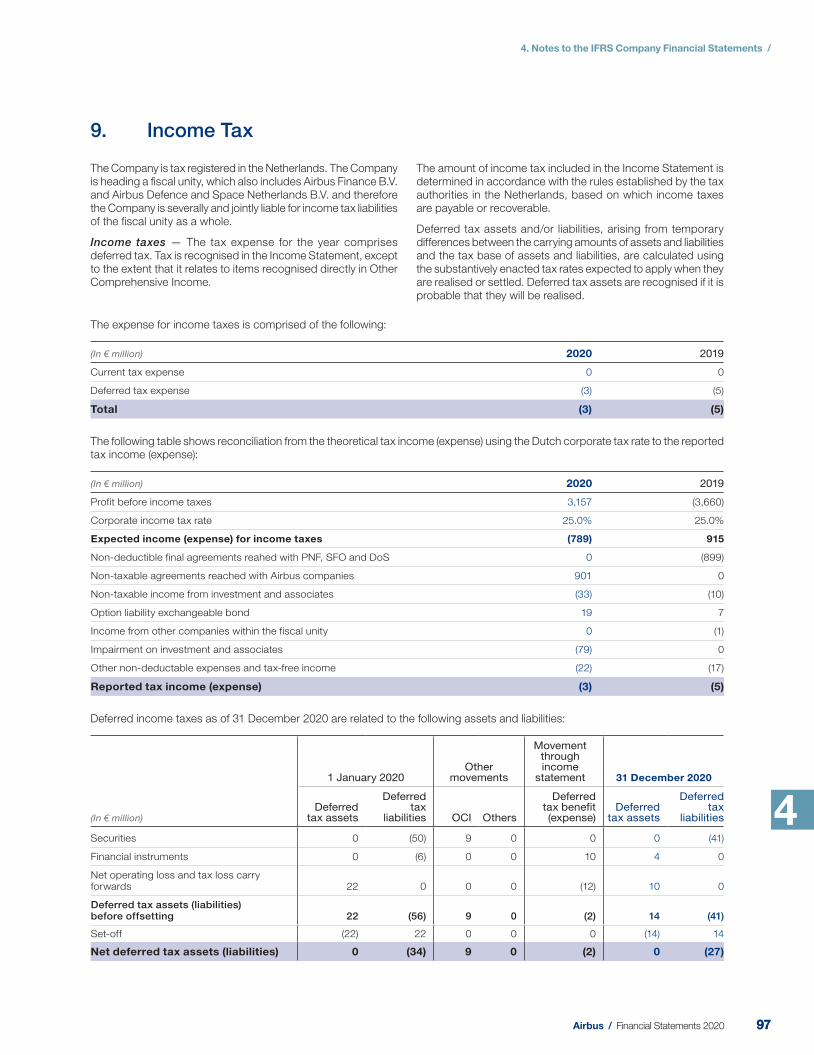
4. Notes to the IFRS Company Financial Statements /
4
9. Income Tax
The Company is tax registered in the Netherlands. The Company is heading a fi scal unity, which also includes Airbus Finance B.V. and Airbus Defence and Space Netherlands B.V. and therefore the Company is severally and jointly liable for income tax liabilities of the fi scal unity as a whole.
Income taxes — The tax expense for the year comprises deferred tax. Tax is recognised in the Income Statement, except to the extent that it relates to items recognised directly in Other Comprehensive Income.
The amount of income tax included in the Income Statement is determined in accordance with the rules established by the tax authorities in the Netherlands, based on which income taxes are payable or recoverable.
Deferred tax assets and/or liabilities, arising from temporary differences between the carrying amounts of assets and liabilities and the tax base of assets and liabilities, are calculated using the substantively enacted tax rates expected to apply when they are realised or settled. Deferred tax assets are recognised if it is probable that they will be realised.
The expense for income taxes is comprised of the following:
(In € million) 2020 2019
Current tax expense 0 0
Deferred tax expense (3) (5)
Total (3) (5)
The following table shows reconciliation from the theoretical tax income (expense) using the Dutch corporate tax rate to the reported tax income (expense):
(In € million) 2020 2019
Profit before income taxes 3,157 (3,660)
Corporate income tax rate 25.0% 25.0%
Expected income (expense) for income taxes (789) 915
Non-deductible final agreements reahed with PNF, SFO and DoS 0 (899)
Non-taxable agreements reached with Airbus c ompanies 901 0
Non-taxable income from investment and associates (33) (10)
Option liability exchangeable bond 19 7
Income from other companies within the fiscal unity 0 (1)
Impairment on investment and associates (79) 0
Other non-deductable expenses and tax-free income (22) (17)
Reported tax income (expense) (3) (5)
Deferred income taxes as of 31 December 2020 are related to the following assets and liabilities:
(In € million)
1 January 2020Other
movements
Movement through income
statement 31 December 2020
Deferred tax assets
Deferred tax
liabilities OCI Others
Deferred tax benefit (expense)
Deferred tax assets
Deferred tax
liabilities
Securities 0 (50) 9 0 0 0 (41)
Financial instruments 0 (6) 0 0 10 4 0
Net operating loss and tax loss carry forwards 22 0 0 0 (12) 10 0
Deferred tax assets (liabilities) before offsetting 22 (56) 9 0 (2) 14 (41)
Set-off (22) 22 0 0 0 (14) 14
Net deferred tax assets (liabilities) 0 (34) 9 0 (2) 0 (27)
9797Airbus / Financial Statements 2020
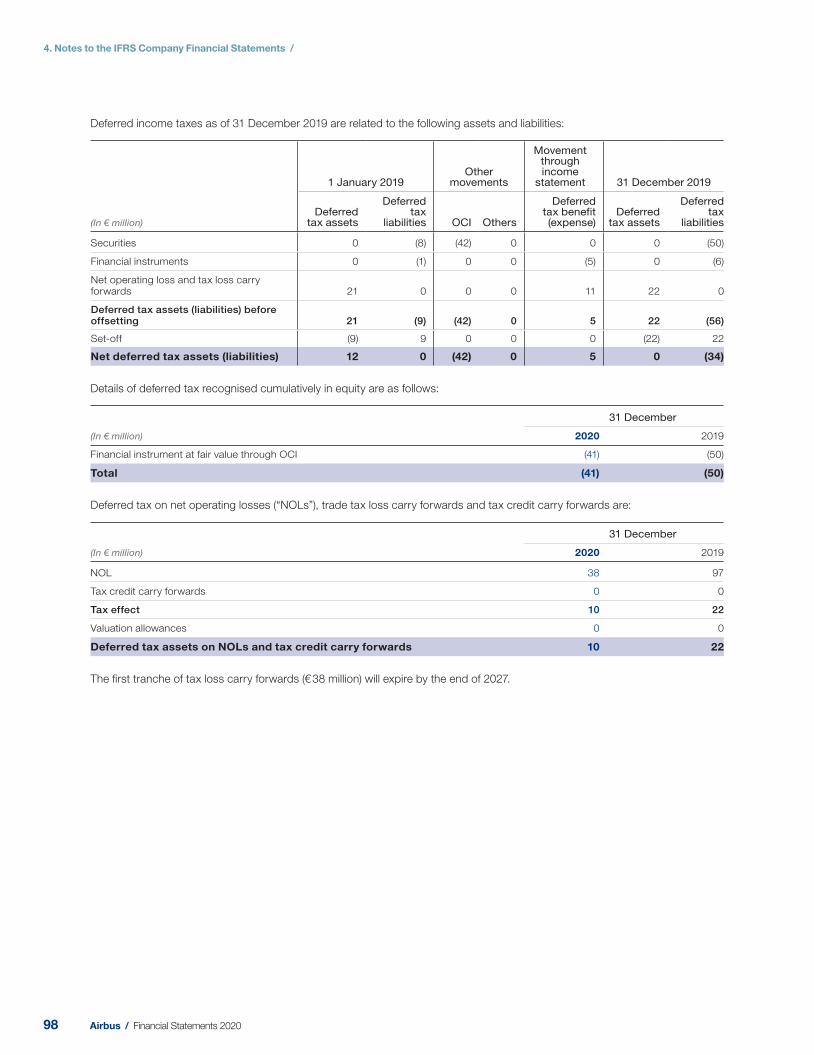
4. Notes to the IFRS Company Financial Statements /
Deferred income taxes as of 31 December 2019 are related to the following assets and liabilities:
(In € million)
1 January 2019Other
movements
Movement through income
statement 31 December 2019
Deferred tax assets
Deferred tax
liabilities OCI Others
Deferred tax benefit (expense)
Deferred tax assets
Deferred tax
liabilities
Securities 0 (8) (42) 0 0 0 (50)
Financial instruments 0 (1) 0 0 (5) 0 (6)
Net operating loss and tax loss carry forwards 21 0 0 0 11 22 0
Deferred tax assets (liabilities) before offsetting 21 (9) (42) 0 5 22 (56)
Set-off (9) 9 0 0 0 (22) 22
Net deferred tax assets (liabilities) 12 0 (42) 0 5 0 (34)
Details of deferred tax recognised cumulatively in equity are as follows:
(In € million)
31 December
2020 2019
Financial instrument at fair value through OCI (41) (50)
Total (41) (50)
Deferred tax on net operating losses (“NOLs”), trade tax loss carry forwards and tax credit carry forwards are:
(In € million)
31 December
2020 2019
NOL 38 97
Tax credit carry forwards 0 0
Tax effect 10 22
Valuation allowances 0 0
Deferred tax assets on NOLs and tax credit carry forwards 10 22
The fi rst tranche of tax loss carry forwards (€ 38 million) will expire by the end of 2027.
98 Airbus / Financial Statements 2020
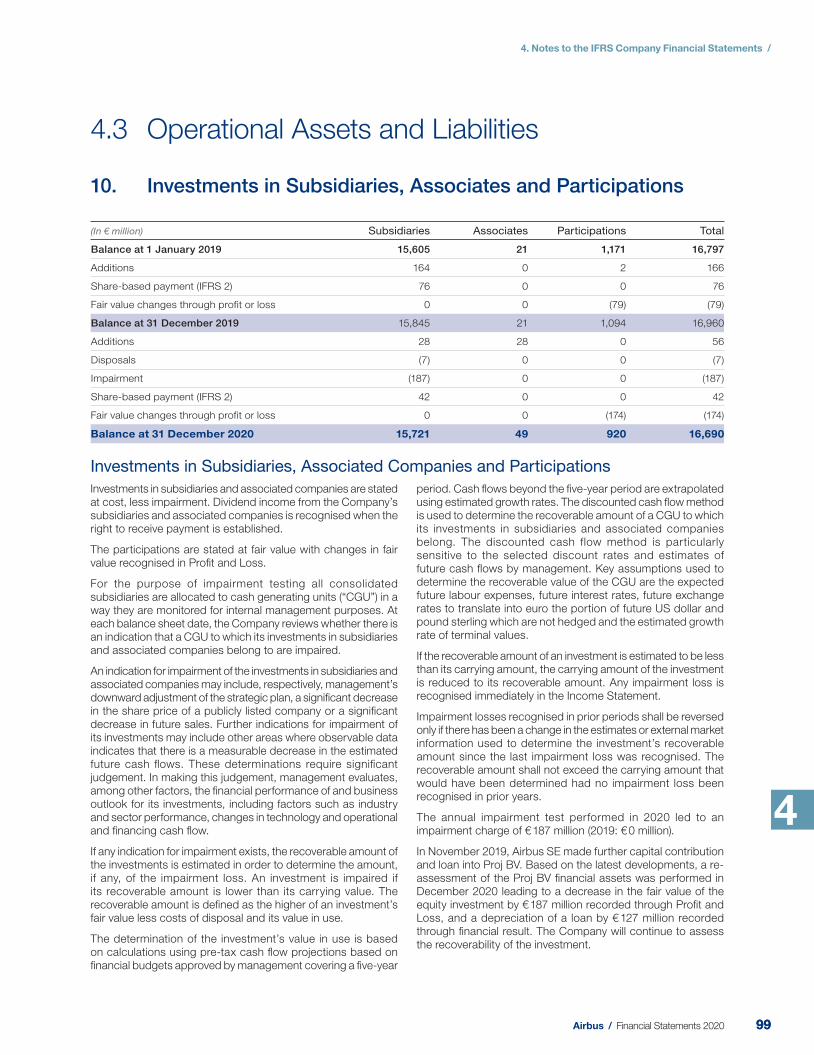
4. Notes to the IFRS Company Financial Statements /
4
4.3 Operational Assets and Liabilities
10. Investments in Subsidiaries, Associates and Participations
(In € million) Subsidiaries Associates Participations Total
Balance at 1 January 2019 15,605 21 1,171 16,797
Additions 164 0 2 166
Share-based payment (IFRS 2) 76 0 0 76
Fair value changes through p rofit or l oss 0 0 (79) (79)
Balance at 31 December 2019 15,845 21 1,094 16,960
Additions 28 28 0 56
Disposals (7) 0 0 (7)
Impairment (187) 0 0 (187)
Share-based payment (IFRS 2) 42 0 0 42
Fair value changes through p rofit or l oss 0 0 (174) (174)
Balance at 31 December 2020 15,721 49 920 16,690
Investments in Subsidiaries, Associated Companies and Participations
Investments in subsidiaries and associated companies are stated at cost, less impairment. Dividend income from the Company’s subsidiaries and associated companies is recognised when the right to receive payment is established.
The participations are stated at fair value with changes in fair value recognised in Profi t and Loss.
For the purpose of impairment testing all consolidated subsidiaries are allocated to cash generating units (“CGU”) in a way they are monitored for internal management purposes. At each balance sheet date, the Company reviews whether there is an indication that a CGU to which its investments in subsidiaries and associated companies belong to are impaired.
An indication for impairment of the investments in subsidiaries and associated companies may include, respectively, management’s downward adjustment of the strategic plan, a signifi cant decrease in the share price of a publicly listed company or a signifi cant decrease in future sales. Further indications for impairment of its investments may include other areas where observable data indicates that there is a measurable decrease in the estimated future cash fl ows. These determinations require signifi cant judgement. In making this judgement, management evaluates, among other factors, the fi nancial performance of and business outlook for its investments, including factors such as industry and sector performance, changes in technology and operational and fi nancing cash fl ow.
If any indication for impairment exists, the recoverable amount of the investments is estimated in order to determine the amount, if any, of the impairment loss. An investment is impaired if its recoverable amount is lower than its carrying value. The recoverable amount is defi ned as the higher of an investment’s fair value less costs of disposal and its value in use.
The determination of the investment’s value in use is based on calculations using pre-tax cash fl ow projections based on fi nancial budgets approved by management covering a fi ve-year
period. Cash fl ows beyond the fi ve-year period are extrapolated using estimated growth rates. The discounted cash fl ow method is used to determine the recoverable amount of a CGU to which its investments in subsidiaries and associated companies belong. The discounted cash flow method is particularly sensitive to the selected discount rates and estimates of future cash fl ows by management. Key assumptions used to determine the recoverable value of the CGU are the expected future labour expenses, future interest rates, future exchange rates to translate into euro the portion of future US dollar and pound sterling which are not hedged and the estimated growth rate of terminal values.
If the recoverable amount of an investment is estimated to be less than its carrying amount, the carrying amount of the investment is reduced to its recoverable amount. Any impairment loss is recognised immediately in the Income Statement.
Impairment losses recognised in prior periods shall be reversed only if there has been a change in the estimates or external market information used to determine the investment’s recoverable amount since the last impairment loss was recognised. The recoverable amount shall not exceed the carrying amount that would have been determined had no impairment loss been recognised in prior years.
The annual impairment test performed in 2020 led to an impairment charge of € 187 million (2019: € 0 million).
In November 2019, Airbus SE made further capital contribution and loan into Proj BV. Based on the latest developments, a re-assessment of the Proj BV fi nancial assets was performed in December 2020 leading to a decrease in the fair value of the equity investment by € 187 million recorded through Profi t and Loss, and a depreciation of a loan by € 127 million recorded through fi nancial result. The Company will continue to assess the recoverability of the investment.
9999Airbus / Financial Statements 2020
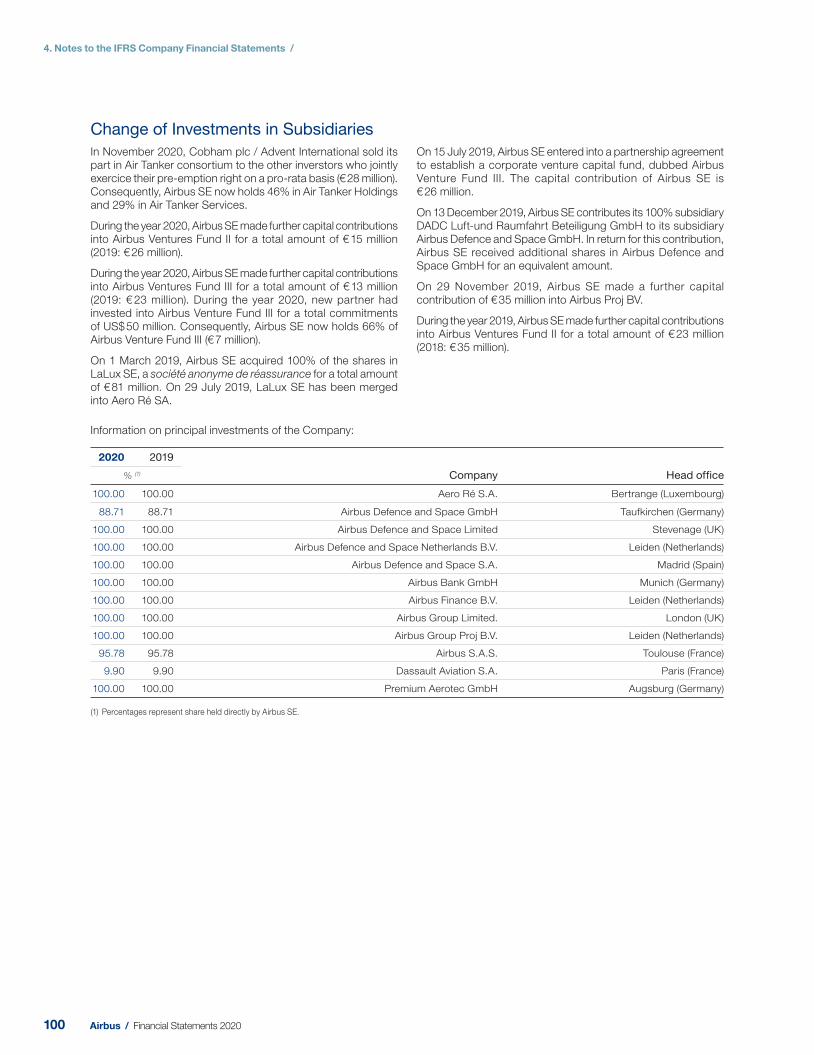
4. Notes to the IFRS Company Financial Statements /
Change of Investments in Subsidiaries
In November 2020, Cobham plc / Advent International sold its part in Air Tanker consortium to the other inverstors who jointly exercice their pre-emption right on a pro-rata basis (€ 28 million). Consequently, Airbus SE now holds 46% in Air Tanker Holdings and 29% in Air Tanker Services.
During the year 2020, Airbus SE made further capital contributions into Airbus Ventures Fund II for a total amount of € 15 million (2019: € 26 million).
During the year 2020, Airbus SE made further capital contributions into Airbus Ventures Fund III for a total amount of € 13 million (2019: € 23 million). During the year 2020, new partner had invested into Airbus Venture Fund III for a total commitments of US$ 50 million. Consequently , Airbus SE now holds 66% of Airbus Venture Fund III (€ 7 million).
On 1 March 2019, Airbus SE acquired 100% of the shares in LaL ux SE, a société anonyme de réassurance for a total amount of € 81 million. On 29 July 2019, LaL ux SE has been merged into Aero Ré SA.
On 15 July 2019, Airbus SE entered into a partnership agreement to establish a corporate venture capital fund, dubbed Airbus Venture Fund III. The capital contribution of Airbus SE is € 26 million.
On 13 December 2019, Airbus SE contributes its 100% subsidiary DADC Luft-und Raumfahrt Beteiligung GmbH to its subsidiary Airbus Defence and Space GmbH. In return for this contribution, Airbus SE received additional shares in Airbus Defence and Space GmbH for an equivalent amount.
On 29 November 2019, Airbus SE made a further capital contribution of € 35 million into Airbus Proj BV.
During the year 2019, Airbus SE made further capital contributions into Airbus Ventures Fund II for a total amount of € 23 million (2018: € 35 million).
Information on principal investments of the Company:
2020 2019
Company Head office% (1)
100.00 100.00 Aero Ré S.A. Bertrange (Luxembourg)
88.71 88.71 Airbus Defence and Space GmbH Taufkirchen (Germany)
100.00 100.00 Airbus Defence and Space Limited Stevenage (UK)
100.00 100.00 Airbus Defence and Space Netherlands B.V. Leiden (Netherlands)
100.00 100.00 Airbus Defence and Space S.A. Madrid (Spain)
100.00 100.00 Airbus Bank GmbH Munich (Germany)
100.00 100.00 Airbus Finance B.V. Leiden (Netherlands)
100.00 100.00 Airbus Group Limited. London (UK)
100.00 100.00 Airbus Group Proj B.V. Leiden (Netherlands)
95.78 95.78 Airbus S.A.S. Toulouse (France)
9.90 9.90 Dassault Aviation S.A. Paris (France)
100.00 100.00 Premium Aerotec GmbH Augsburg (Germany)
(1) Percentages represent share held directly by Airbus SE.
100 Airbus / Financial Statements 2020
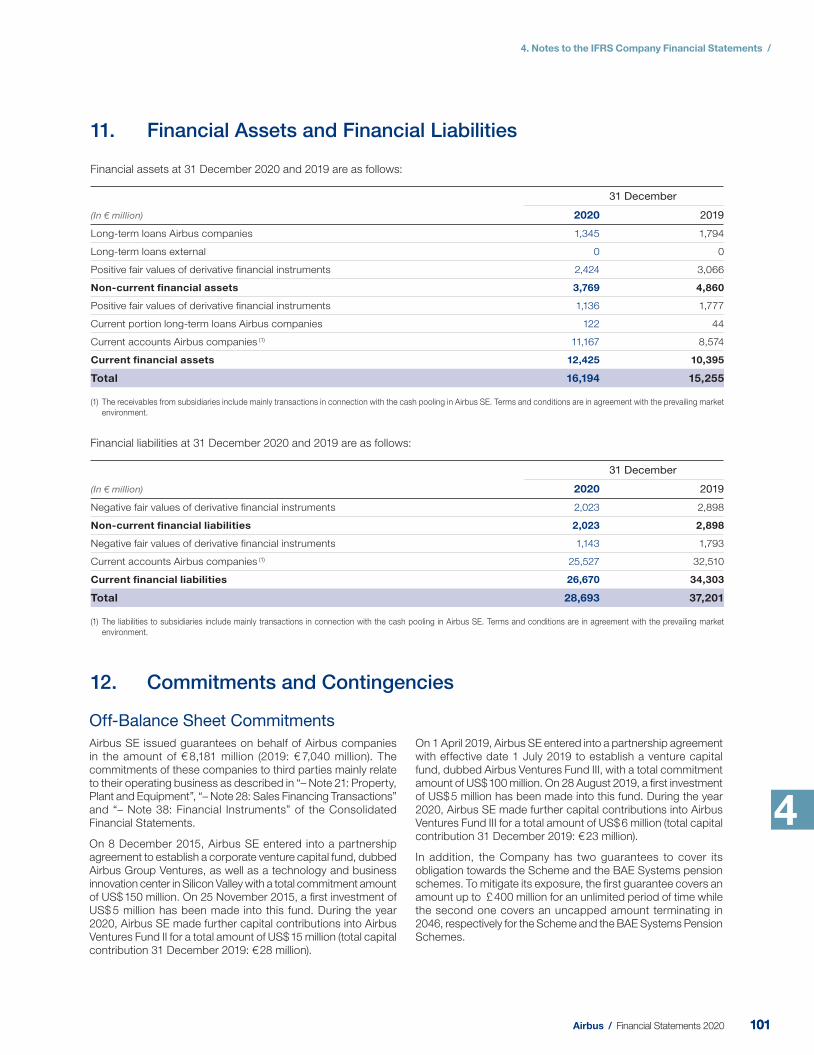
4. Notes to the IFRS Company Financial Statements /
4
11. Financial Assets and Financial Liabilities
Financial assets at 31 December 2020 and 2019 are as follows:
(In € million)
31 December
2020 2019
Long-term loans Airbus companies 1,345 1,794
Long-term loans external 0 0
Positive fair values of derivative financial instruments 2,424 3,066
Non-current financial assets 3,769 4,860
Positive fair values of derivative financial instruments 1,136 1,777
Current portion long-term loans Airbus companies 122 44
Current accounts Airbus companies (1) 11,167 8,574
Current financial assets 12,425 10,395
Total 16,194 15,255
(1) The receivables from subsidiaries include mainly transactions in connection with the cash pooling in Airbus SE. Terms and conditions are in agreement with the prevailing market
environment.
Financial liabilities at 31 December 2020 and 2019 are as follows:
(In € million)
31 December
2020 2019
Negative fair values of derivative financial instruments 2,023 2,898
Non-current financial liabilities 2,023 2,898
Negative fair values of derivative financial instruments 1,143 1,793
Current accounts Airbus companies (1) 25,527 32,510
Current financial liabilities 26,670 34,303
Total 28,693 37,201
(1) The liabilities to subsidiaries include mainly transactions in connection with the cash pooling in Airbus SE. Terms and conditions are in agreement with the prevailing market
environment.
Off-Balance Sheet Commitments
Airbus SE issued guarantees on behalf of Airbus companies in the amount of € 8,181 million (2019: € 7,040 million). The commitments of these companies to third parties mainly relate to their operating business as described in “– Note 21: Property, Plant and Equipment”, “– Note 28: Sales Financing Transactions” and “– Note 38: Financial Instruments” of the Consolidated Financial Statements.
On 8 December 2015, Airbus SE entered into a partnership agreement to establish a corporate venture capital fund, dubbed Airbus Group Ventures, as well as a technology and business innovation center in Silicon Valley with a total commitment amount of US$ 150 million. On 25 November 2015, a fi rst investment of US$ 5 million has been made into this fund. During the year 2020, Airbus SE made further capital contributions into Airbus Ventures Fund II for a total amount of US$ 15 million (total capital contribution 31 December 2019: € 28 million).
On 1 April 2019, Airbus SE entered into a partnership agreement with effective date 1 July 2019 to establish a venture capital fund, dubbed Airbus Ventures Fund III, with a total commitment amount of US$ 100 million. On 28 August 2019, a fi rst investment of US$ 5 million has been made into this fund. During the year 2020, Airbus SE made further capital contributions into Airbus Ventures Fund III for a total amount of US$ 6 million (total capital contribution 31 December 2019: € 23 million).
In addition, the Company has two guarantees to cover its obligation towards the Scheme and the BAE Systems pension schemes. To mitigate its exposure, the fi rst guarantee covers an amount up to £ 400 million for an unlimited period of time while the second one covers an uncapped amount terminating in 2046, respectively for the Scheme and the BAE Systems Pension Schemes.
12. Commitments and Contingencies
101101Airbus / Financial Statements 2020
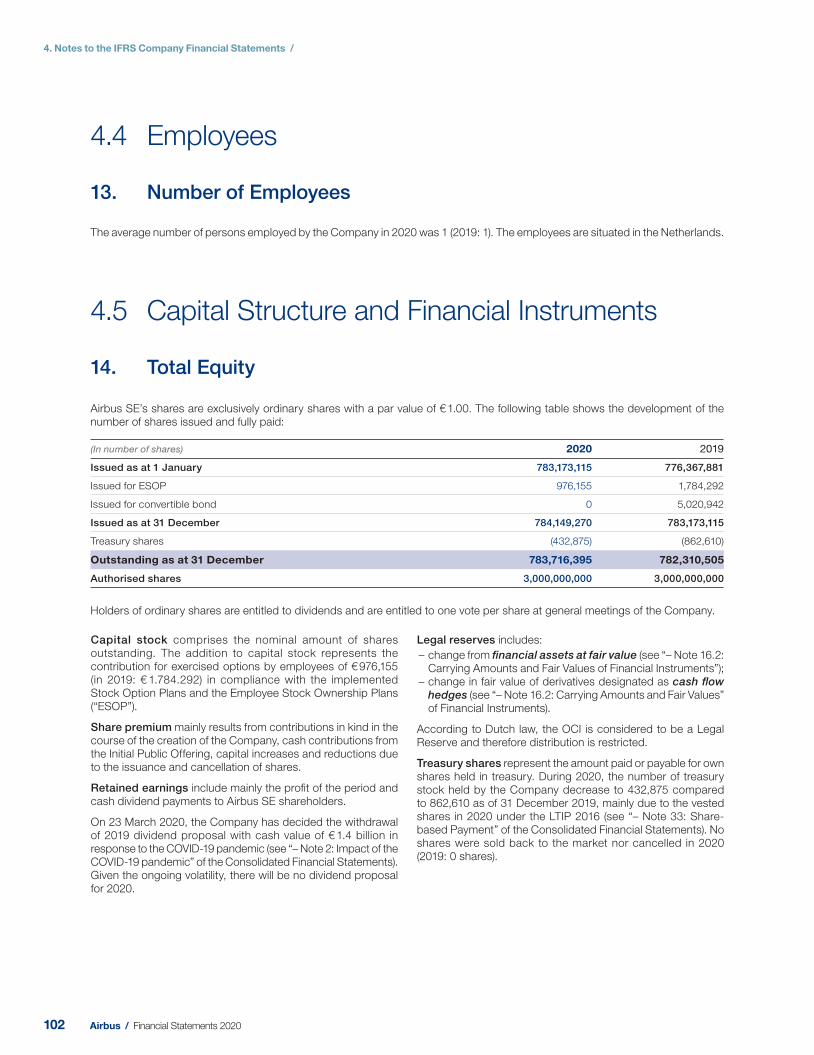
4. Notes to the IFRS Company Financial Statements /
4.4 Employees
13. Number of Employees
The average number of persons employed by the Company in 2020 was 1 (2019: 1). The employees are situated in the Netherlands.
4.5 Capital Structure and Financial Instruments
14. Total Equity
Airbus SE’s shares are exclusively ordinary shares with a par value of € 1.00. The following table shows the development of the number of shares issued and fully paid:
(In number of shares) 2020 2019
Issued as at 1 January 783,173,115 776,367,881
Issued for ESOP 976,155 1,784,292
Issued for convertible bond 0 5,020,942
Issued as at 31 December 784,149,270 783,173,115
Treasury shares (432,875) (862,610)
Outstanding as at 31 December 783,716,395 782,310,505
Authorised shares 3,000,000,000 3,000,000,000
Holders of ordinary shares are entitled to dividends and are entitled to one vote per share at general meetings of the Company.
Capital stock comprises the nominal amount of shares outstanding. The addition to capital stock represents the contribution for exercised options by employees of € 976,155 (in 2019: € 1.784.292) in compliance with the implemented Stock Option Plans and the Employee Stock Ownership Plans (“ESOP”).
Share premium mainly results from contributions in kind in the course of the creation of the Company, cash contributions from the Initial Public Offering, capital increases and reductions due to the issuance and cancellation of shares.
Retained earnings include mainly the profi t of the period and cash dividend payments to Airbus SE shareholders.
On 23 March 2020, the Company has decided the withdrawal of 2019 dividend proposal with cash value of € 1.4 billion in response to the COVID-19 pandemic (see “– Note 2: Impact of the COVID-19 pandemic” of the Consolidated Financial Statements). Given the ongoing volatility, there will be no dividend proposal for 2020.
Legal reserves includes:
– change from fi nancial assets at fair value (see “– Note 16.2: Carrying Amounts and Fair Values of Financial Instruments”);
– change in fair value of derivatives designated as cash fl ow hedges (see “– Note 16.2: Carrying Amounts and Fair Values” of Financial Instruments ).
According to Dutch law, the OCI is considered to be a Legal Reserve and therefore distribution is restricted.
Treasury shares represent the amount paid or payable for own shares held in treasury. During 2020, the number of treasury stock held by the Company decrease to 432,875 compared to 862,610 as of 31 December 2019, mainly due to the vested shares in 2020 under the LTIP 2016 (see “– Note 33: Share-based Payment” of the Consolidated Financial Statements). No shares were sold back to the market nor cancelled in 2020 (2019: 0 shares).
102 Airbus / Financial Statements 2020
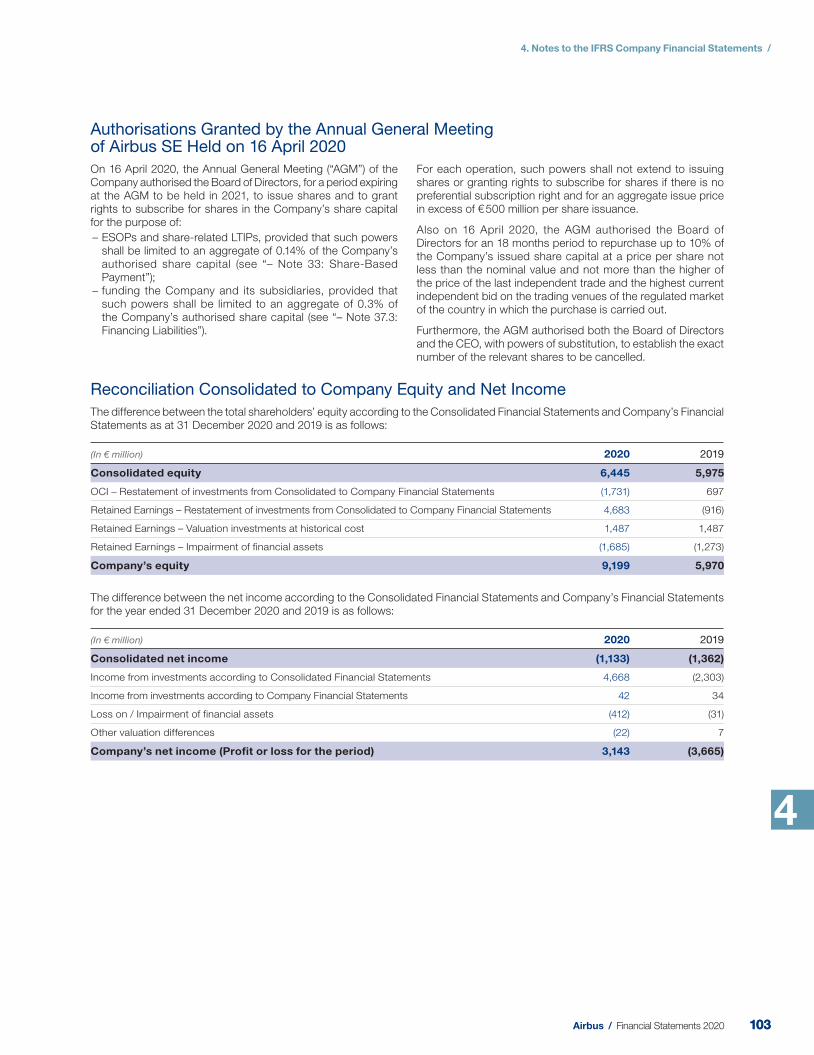
4. Notes to the IFRS Company Financial Statements /
4
Authorisations Granted by the Annual General Meeting of Airbus SE Held on 16 April 2020
On 16 April 2020 , the Annual General Meeting (“AGM”) of the Company authorised the Board of Directors, for a period expiring at the AGM to be held in 2021, to issu e shares and to grant rights to subscribe for shares in the Company’s share capital for the purpose of:
– ESOPs and share-related LTIPs, provided that such powers shall be limited to an aggregate of 0.14% of the Company’s authorised share capital (see “– Note 33: Share-Based Payment”);
– funding the Company and its subsidiaries, provided that such powers shall be limited to an aggregate of 0.3% of the Company’s authorised share capital (see “– Note 37.3: Financing Liabilities”).
For each operation, such powers shall not extend to issuing shares or granting rights to subscribe for shares if there is no preferential subscription right and for an aggregate issue price in excess of € 500 million per share issuance.
Also on 16 April 2020, the AGM authorised the Board of Directors for an 18 months period to repurchase up to 10% of the Company’s issued share capital at a price per share not less than the nominal value and not more than the higher of the price of the last independent trade and the highest current independent bid on the trading venues of the regulated market of the country in which the purchase is carried out.
Furthermore, the AGM authorised both the Board of Directors and the CEO, with powers of substitution, to establish the exact number of the relevant shares to be cancelled.
Reconciliation Consolidated to Company Equity and Net Income
The difference between the total shareholders’ equity according to the Consolidated Financial Statements and Company’s Financial Statements as at 31 December 2020 and 2019 is as follows:
(In € million) 2020 2019
Consolidated equity 6,445 5,975
OCI – Restatement of investments from Consolidated to Company Financial Statements (1,731) 697
Retained Earnings – Restatement of investments from Consolidated to Company Financial Statements 4,683 (916)
Retained Earnings – Valuation investments at historical cost 1,487 1,487
Retained Earnings – Impairment of financial assets (1,685) (1,273)
Company’s equity 9,199 5,970
The difference between the net income according to the Consolidated Financial Statements and Company’s Financial Statements for the year ended 31 December 2020 and 2019 is as follows:
(In € million) 2020 2019
Consolidated net income (1,133) (1,362)
Income from investments according to Consolidated Financial Statements 4,668 (2,303)
Income from investments according to Company Financial Statements 42 34
Loss on / Impairment of financial assets (412) (31)
Other valuation differences (22) 7
Company’s net income (Profit or loss for the period) 3,143 (3,665)
103103Airbus / Financial Statements 2020
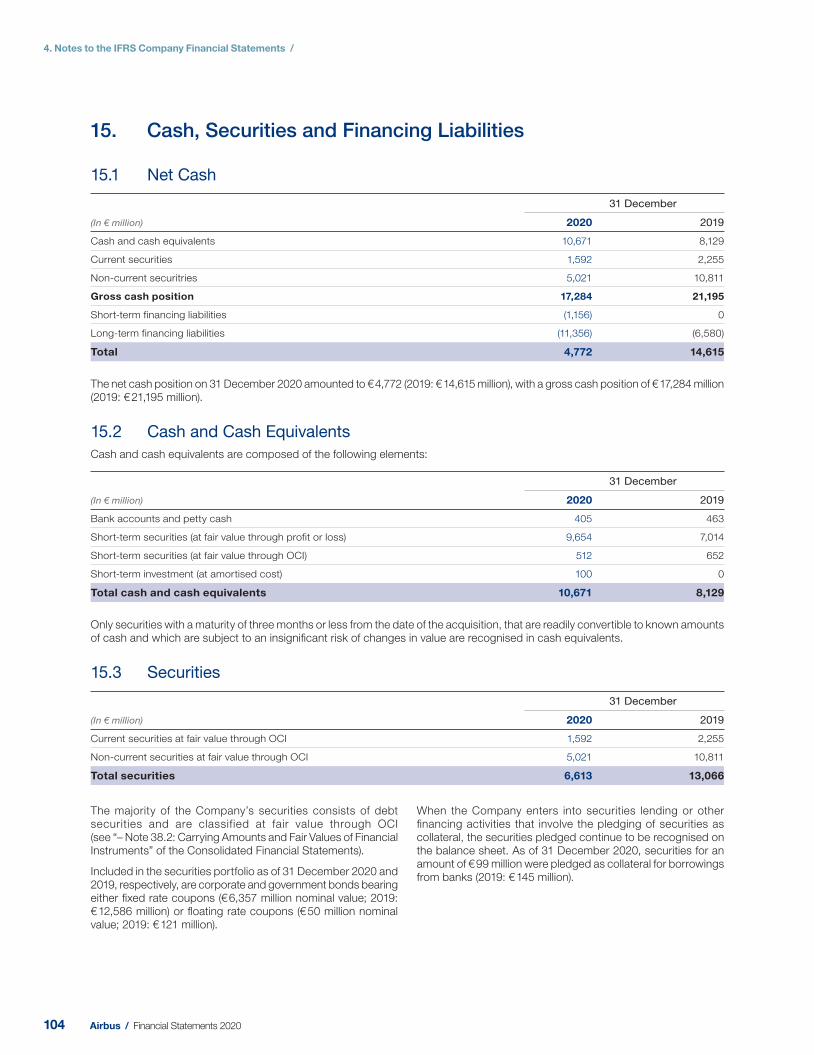
4. Notes to the IFRS Company Financial Statements /
The majority of the Company’s securities consists of debt securities and are classified at fair value through OCI (see “– Note 38.2: Carrying Amounts and Fair Values of Financial Instruments” of the Consolidated Financial Statements).
Included in the securities portfolio as of 31 December 2020 and 2019, respectively, are corporate and government bonds bearing either fi xed rate coupons (€ 6,357 million nominal value; 2019: € 12,586 million) or fl oating rate coupons (€ 50 million nominal value; 2019: € 121 million).
When the Company enters into securities lending or other fi nancing activities that involve the pledging of securities as collateral, the securities pledged continue to be recognised on the balance sheet. As of 31 Decem ber 2020, securities for an amount of € 99 million were pledged as collateral for borrowings from banks (2019: € 14 5 million).
15. Cash, Securities and Financing Liabilities
15.1 Net Cash
(In € million)
31 December
2020 2019
Cash and c ash equivalents 10,671 8,129
Current s ecurities 1,592 2,255
Non-c urrent s ecuritries 5,021 10,811
Gross c ash position 17,284 21,195
Short-term financing liabilities (1,156) 0
Long-term financing liabilities (11,356) (6,580)
Total 4,772 14,615
The net cash position on 31 December 2020 amounted to € 4,772 (2019: € 14,615 million), with a gross cash position of € 17,284 million (2019: € 21,195 million).
15.2 Cash and Cash Equivalents
Cash and cash equivalents are composed of the following elements:
(In € million)
31 December
2020 2019
Bank accounts and petty cash 405 463
Short-term securities (at fair value through profit or loss) 9,654 7,014
Short-term securities (at fair value through OCI) 512 652
Short-term investment (at amortised cost) 100 0
Total cash and cash equivalents 10,671 8,129
Only securities with a maturity of three months or less from the date of the acquisition, that are readily convertible to known amounts of cash and which are subject to an insignifi cant risk of changes in value are recognised in cash equivalents.
15.3 Securities
(In € million)
31 December
2020 2019
Current securities at fair value through OCI 1,592 2,255
Non-current securities at fair value through OCI 5,021 10,811
Total securities 6,613 13,066
104 Airbus / Financial Statements 2020
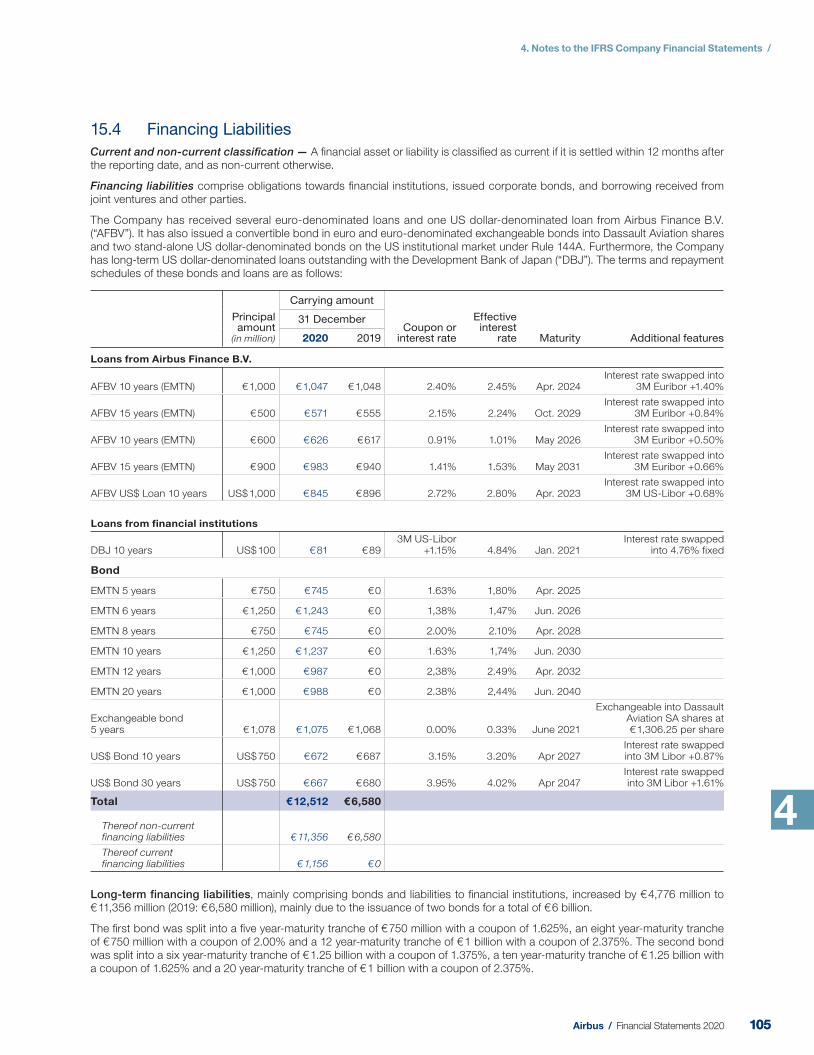
4. Notes to the IFRS Company Financial Statements /
4
15.4 Financing Liabilities
Current and non-current classifi cation — A fi nancial asset or liability is classifi ed as current if it is settled within 12 months after the reporting date, and as non-current otherwise.
Financing liabilities comprise obligations towards fi nancial institutions, issued corporate bonds, and borrowing received from joint ventures and other parties.
The Company has received several euro-denominated loans and one US dollar-denominated loan from Airbus Finance B.V. (“AFBV”). It has also issued a convertible bond in euro and euro-denominated exchangeable bonds into Dassault Aviation shares and two stand-alone US dollar-denominated bonds on the US institutional market under Rule 144A. Furthermore, the Company has long-term US dollar-denominated loans outstanding with the Development Bank of Japan (“DBJ”). The terms and repayment schedules of these bonds and loans are as follows:
Principal amount
(in million)
Carrying amount
Coupon or interest rate
Effective interest
rate Maturity Additional features
31 December
2020 2019
Loans from Airbus Finance B.V.
AFBV 10 years (EMTN) € 1,000 € 1,047 € 1,048 2.40% 2.45% Apr. 2024Interest rate swapped into
3M Euribor +1.40%
AFBV 15 years (EMTN) € 500 € 571 € 555 2.15% 2.24% Oct. 2029Interest rate swapped into
3M Euribor +0.84%
AFBV 10 years (EMTN) € 600 € 626 € 617 0.91% 1.01% May 2026Interest rate swapped into
3M Euribor +0.50%
AFBV 15 years (EMTN) € 900 € 983 € 940 1.41% 1.53% May 2031Interest rate swapped into
3M Euribor +0.66%
AFBV US$ Loan 10 years US$ 1,000 € 845 € 896 2.72% 2.80% Apr. 2023Interest rate swapped into
3M US-Libor +0.68%
Loans from financial institutions
DBJ 10 years US$ 100 € 81 € 893M US-Libor
+1.15% 4.84% Jan. 2021Interest rate swapped
into 4.76% fixed
Bond
EMTN 5 years € 750 € 745 € 0 1.63% 1,80% Apr. 2025
EMTN 6 years € 1,250 € 1,243 € 0 1,38% 1,47% Jun. 2026
EMTN 8 years € 750 € 745 € 0 2.00% 2.10% Apr. 2028
EMTN 10 years € 1,250 € 1,237 € 0 1.63% 1,74% Jun. 2030
EMTN 12 years € 1,000 € 987 € 0 2,38% 2.49% Apr. 2032
EMTN 20 years € 1,000 € 988 € 0 2.38% 2,44% Jun. 2040
Exchangeable bond 5 years € 1,078 € 1,075 € 1,068 0.00% 0.33% June 2021
Exchangeable into Dassault Aviation SA shares at € 1,306.25 per share
US$ Bond 10 years US$ 750 € 672 € 687 3.15% 3.20% Apr 2027Interest rate swapped into 3M Libor +0.87%
US$ Bond 30 years US$ 750 € 667 € 680 3.95% 4.02% Apr 2047Interest rate swapped into 3M Libor +1.61%
Total € 12,512 € 6,580
Thereof non-current financing liabilities € 11,356 € 6,580
Thereof current financing liabilities € 1,156 € 0
Long-term financing liabilities, mainly comprising bonds and liabilities to fi nancial institutions, increased by € 4,776 million to € 11,356 million (2019 : € 6,580 million), mainly due to the issuance of two bonds for a total of € 6 billion.
The fi rst bond was split into a fi ve year-maturity tranche of € 750 million with a coupon of 1.625%, an eight year-maturity tranche of € 750 million with a coupon of 2.00% and a 12 year-maturity tranche of € 1 billion with a coupon of 2.375%. The second bond was split into a six year-maturity tranche of € 1.25 billion with a coupon of 1.375%, a ten year-maturity tranche of € 1.25 billion with a coupon of 1.625% and a 20 year-maturity tranche of € 1 billion with a coupon of 2.375%.
105105Airbus / Financial Statements 2020
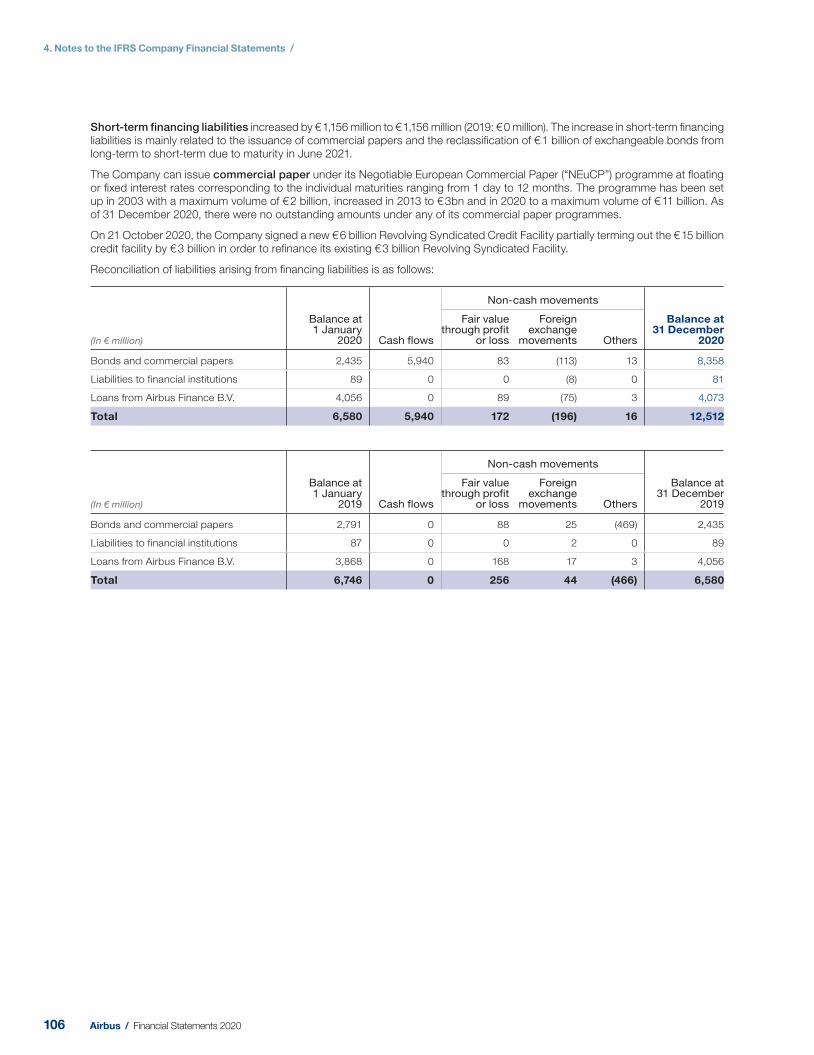
4. Notes to the IFRS Company Financial Statements /
Short-term financing liabilities increased by € 1,156 million to € 1,156 million (2019: € 0 million). The increase in short-term fi nancing liabilities is mainly related to the issuance of commercial papers and the reclassifi cation of € 1 billion of exchangeable bonds from long-term to short-term due to maturity in June 2021.
The Company can issue commercial paper under its Negotiable European Commercial Paper (“NEuCP”) programme at fl oating or fi xed interest rates corresponding to the individual maturities ranging from 1 day to 12 months. The programme has been set up in 2003 with a maximum volume of € 2 billion, increased in 2013 to € 3bn and in 2020 to a maximum volume of € 11 billion. As of 31 December 2020, there were no outstanding amounts under any of its commercial paper programmes.
On 21 October 2020, the Company signed a new € 6 billion Revolving Syndicated Credit Facility partially terming out the € 15 billion credit facility by € 3 billion in order to refi nance its existing € 3 billion Revolving Syndicated Facility.
Reconciliation of liabilities arising from fi nancing liabilities is as follows :
(In € million)
Balance at 1 January
2020 Cash flows
Non-cash movements
Balance at 31 December
2020
Fair value through profit
or loss
Foreign exchange
movements Others
Bonds and commercial papers 2,435 5,940 83 (113) 13 8,358
Liabilities to financial institutions 89 0 0 (8) 0 81
Loans from Airbus Finance B.V. 4,056 0 89 (75) 3 4,073
Total 6,580 5,940 172 (196) 16 12,512
(In € million)
Balance at 1 January
2019 Cash flows
Non-cash movements
Balance at 31 December
2019
Fair value through profit
or loss
Foreign exchange
movements Others
Bonds and commercial papers 2,791 0 88 25 (469) 2,435
Liabilities to financial institutions 87 0 0 2 0 89
Loans from Airbus Finance B.V. 3,868 0 168 17 3 4,056
Total 6,746 0 256 44 (466) 6,580
106 Airbus / Financial Statements 2020
4. Notes to the IFRS Company Financial Statements /
4
16.1 Financial Risk Management
The Company acts as an intermediary for its subsidiaries when they wish to enter into derivative contracts to hedge against foreign exchange risk or other market risks such as interest rate risk, commodity price risk or equity price risk. The Company’s practice is to set up a derivative contract with a subsidiary and at the same time enter into a back-to-back derivative transaction with a bank. Contracts with subsidiaries being thus mirrored (on a one-to-one basis) by contracts with banks, the Company’s net exposure is virtually zero. There are, however, a few derivative contracts the Company holds in order to hedge its own market risk exposure.
As the Company’s back-to-back hedge contracts are entered into with different counterparties, their fair values are refl ected separately in the statement of Financial Position and recognised as other fi nancial assets and fi nancial liabilities as disclosed in “– Note 11: Financial assets and liabilities” of the Company Financial Statements.
In the Income Statement, the results of the back-to-back hedge transactions, both realised and unrealised, are presented on a net basis as the Company acts as an agent for its subsidiaries.
The Company’s overall fi nancial risk management activities and their objectives are described in detail in “– Note 38.1: Financial Risk Management” of the Consolidated Financial Statements.
Market Risk
Foreign exchange risk — The Company manages a long-term hedge portfolio with maturities of several years for its subsidiaries, mainly Airbus, and to a small extent for its joint ventures or associates. This hedge portfolio covers a large portion of Airbus’ fi rm commitments and highly probable forecast transactions. As explained above, owing to the Company’s back-to-back approach, its own exposure to foreign exchange risk is very limited.
Interest rate risk — The Company uses an asset-liability management approach with the objective to limit its interest rate risk. It undertakes to match the risk profi le of its interest-bearing assets with those of its interest-bearing liabilities. The remaining net interest rate exposure is managed through several types of interest rate derivatives, such as interest rate swaps and interest rate futures contracts, in order to minimise risks and fi nancial impacts.
The vast majority of related interest rate hedges qualify for hedge accounting, and most of them are accounted for under the fair value hedge model. As a result, both the fair value changes of these derivatives and the portion of the hedged items’ fair value
change that is attributable to the hedged interest rate risk are recognised in profi t and loss, where they offset to the extent the hedge is effective.
A few interest rate swaps that have been entered into as a hedge of certain of the Company variable rate debt (see “– Note 37.3: Financing Liabilities”) are accounted for under the cash fl ow hedge model. Related fair value gains are recognised in OCI and reclassifi ed to profi t or loss when the hedged interest payments affect profi t or loss.
The Company invests in fi nancial instruments such as overnight deposits, certifi cates of deposits, commercial papers, other money market instruments and short-term as well as medium-term bonds. For its fi nancial instruments portfolio, the Company has an Asset Liability Management Committee in place that meets regularly and aims to limit the interest rate risk on a fair value basis through a value-at-risk approach, from which results a hedge ratio that is however not actively steered.
Commodity price risk — The Company is exposed to risk relating to fl uctuations in the prices of commodities used in the supply chain. It manages these risks in the procurement process and to a certain extent uses derivative instruments in order to mitigate the risks associated with the purchase of raw materials. To the extent that the gains or losses of the derivative and those of the hedged item or transaction do not match in terms of profi t or loss, the Company applies cash fl ow hedge accounting to the derivative instruments, with a hedge ratio of 1:1.
Equity price risk — The Company is to a small extent invested in equity securities mainly for operational reasons. Its exposure to equity price risk is hence limited. Furthermore, it is exposed under its LTIP to the risk of the Company share price increases. The Company limits these risks through the use of equity derivatives that qualify for hedge accounting and have been designated as hedging instruments in cash fl ow hedges, with a hedge ratio of 1:1.
Sensitivities of market risks —The approach used to measure and control market risk exposure within the Group’s fi nancial instrument portfolio is amongst other key indicators the value-at-risk (“VaR”). For information about VaR and the approach used by the Company to assess and monitor sensitivities of market risks please refer to “– Note 38.1: Financial Risk Management” of the Consolidated Financial Statements.
The Company is part of the Group risk management process, which is more fully described in “– Note 38.1: Financial Risk Management” of the Consolidated Financial Statements.
16. Information about Financial Instruments
107107Airbus / Financial Statements 2020
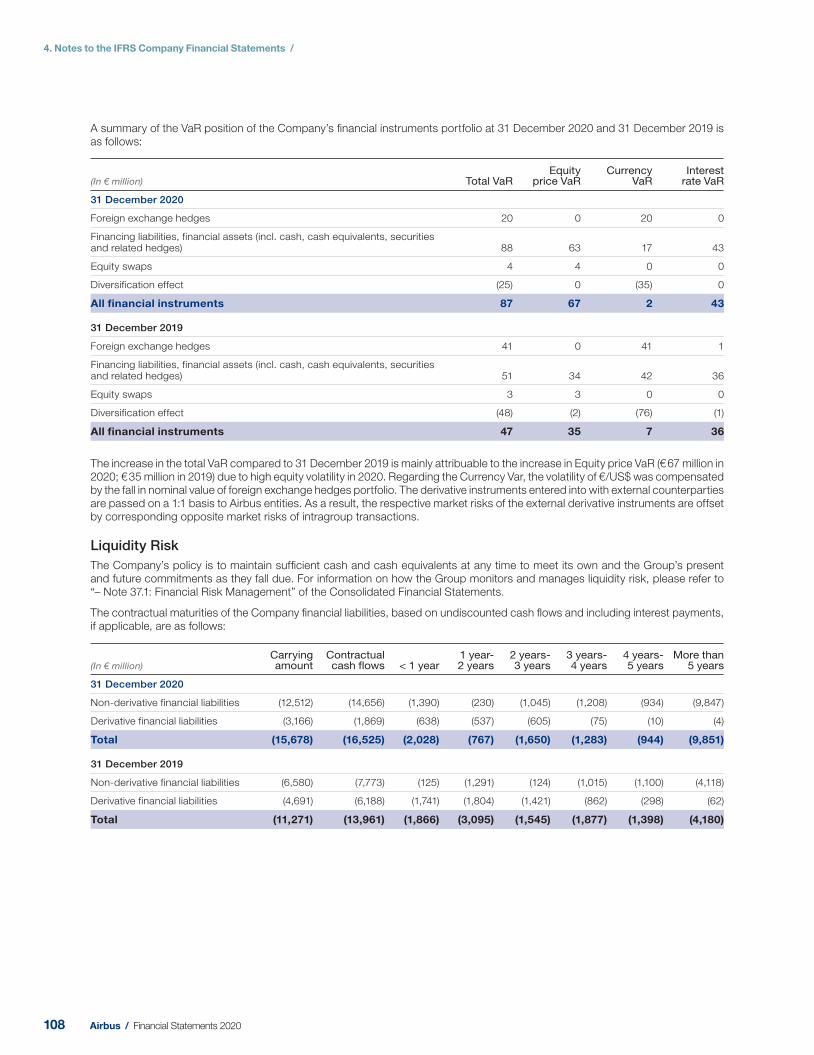
4. Notes to the IFRS Company Financial Statements /
A summary of the VaR position of the Company’s fi nancial instruments portfolio at 31 December 2020 and 31 December 2019 is as follows:
(In € million) Total VaREquity
price VaRCurrency
VaRInterest
rate VaR
31 December 2020
Foreign exchange hedges 20 0 20 0
Financing liabilities, financial assets (incl. cash, cash equivalents, securities and related hedges) 88 63 17 43
Equity swaps 4 4 0 0
Diversification effect (25) 0 (35) 0
All financial instruments 87 67 2 43
31 December 2019
Foreign exchange hedges 41 0 41 1
Financing liabilities, financial assets (incl. cash, cash equivalents, securities and related hedges) 51 34 42 36
Equity swaps 3 3 0 0
Diversification effect (48) (2) (76) (1)
All financial instruments 47 35 7 36
The increase in the total VaR compared to 31 December 2019 is mainly attribuable to the increase in Equity price VaR (€ 67 million in 2020; € 35 million in 2019) due to high equity volatility in 2020. Regarding the Currency Var, the volatility of €/US$ was compensated by the fall in nominal value of foreign exchange hedges portfolio. The derivative instruments entered into with external counterparties are passed on a 1:1 basis to Airbus entities. As a result, the respective market risks of the external derivative instruments are offset by corresponding opposite market risks of intragroup transactions.
Liquidity Risk
The Company’s policy is to maintain suffi cient cash and cash equivalents at any time to meet its own and the Group’s present and future commitments as they fall due. For information on how the Group monitors and manages liquidity risk, please refer to “– Note 37.1: Financial Risk Management” of the Consolidated Financial Statements.
The contractual maturities of the Company fi nancial liabilities, based on undiscounted cash fl ows and including interest payments, if applicable, are as follows:
(In € million)Carrying amount
Contractual cash flows < 1 year
1 year-2 years
2 years-3 years
3 years-4 years
4 years-5 years
More than 5 years
31 December 2020
Non-derivative financial liabilities (12,512) (14,656) (1,390) (230) (1,045) (1,208) (934) (9,847)
Derivative financial liabilities (3,166) (1,869) (638) (537) (605) (75) (10) (4)
Total (15,678) (16,525) (2,028) (767) (1,650) (1,283) (944) (9,851)
31 December 2019
Non-derivative financial liabilities (6,580) (7,773) (125) (1,291) (124) (1,015) (1,100) (4,118)
Derivative financial liabilities (4,691) (6,188) (1,741) (1,804) (1,421) (862) (298) (62)
Total (11,271) (13,961) (1,866) (3,095) (1,545) (1,877) (1,398) (4,180)
108 Airbus / Financial Statements 2020
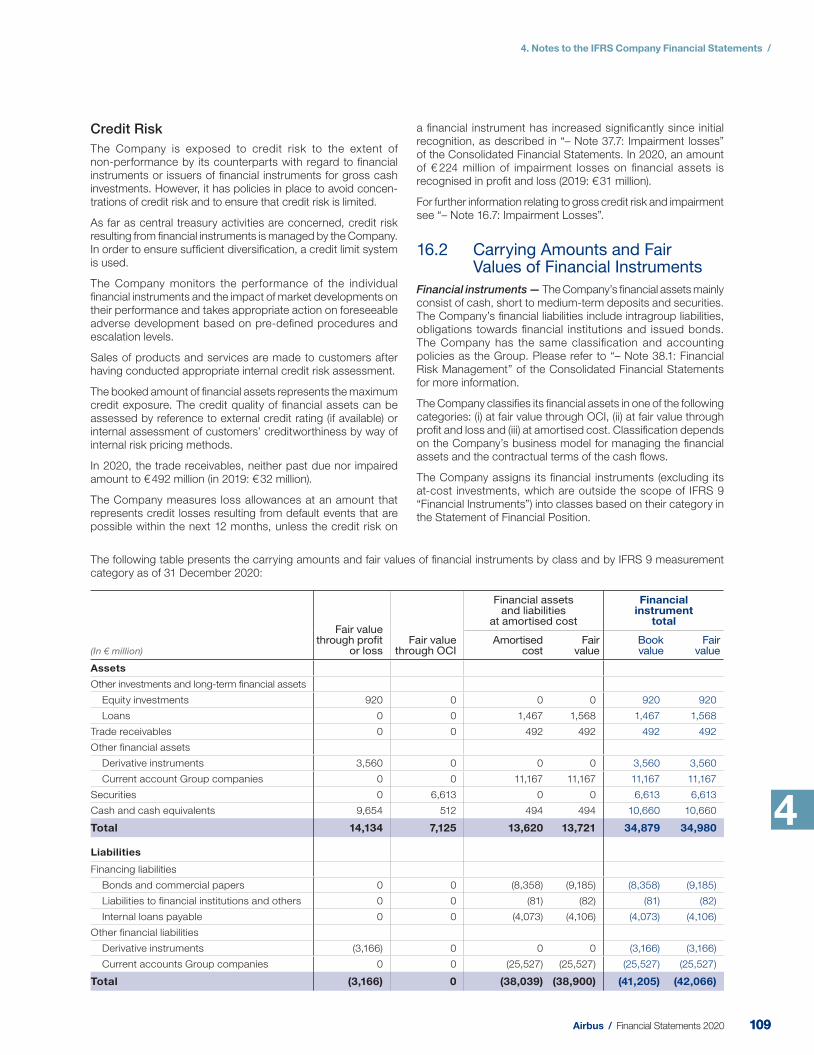
4. Notes to the IFRS Company Financial Statements /
4
Credit Risk
The Company is exposed to credit risk to the extent of non- performance by its counterparts with regard to fi nancial instru ments or issuers of fi nancial instruments for gross cash investments. However, it has policies in place to avoid concen-trations of credit risk and to ensure that credit risk is limited.
As far as central treasury activities are concerned, credit risk resulting from fi nancial instruments is managed by the Company. In order to ensure suffi cient diversifi cation, a credit limit system is used.
The Company monitors the performance of the individual fi nancial instruments and the impact of market developments on their performance and takes appropriate action on foreseeable adverse development based on pre-defi ned procedures and escalation levels.
Sales of products and services are made to customers after having conducted appropriate internal credit risk assessment.
The booked amount of fi nancial assets represents the maximum credit exposure. The credit quality of fi nancial assets can be assessed by reference to external credit rating (if available) or internal assessment of customers’ creditworthiness by way of internal risk pricing methods.
In 2020, the trade receivables, neither past due nor impaired amount to € 492 million (in 2019: € 32 million).
The Company measures loss allowances at an amount that represents credit losses resulting from default events that are possible within the next 12 months, unless the credit risk on
a fi nancial instrument has increased signifi cantly since initial recognition, as described in “– Note 37.7: Impairment losses” of the Consolidated Financial Statements. In 2020, an amount of € 224 million of impairment losses on fi nancial assets is recognised in profi t and loss (2019: € 31 million).
For further information relating to gross credit risk and impairment see “– Note 16.7: Impairment Losses”.
16.2 Carrying Amounts and Fair Values of Financial Instruments
Financial instruments — The Company’s fi nancial assets mainly consist of cash, short to medium-term deposits and securities. The Company’s fi nancial liabilities include intragroup liabilities, obligations towards fi nancial institutions and issued bonds. The Company has the same classifi cation and accounting policies as the Group. Please refer to “– Note 38.1: Financial Risk Management” of the Consolidated Financial Statements for more information.
The Company classifi es its fi nancial assets in one of the following categories: (i) at fair value through OCI, (ii) at fair value through profi t and loss and (iii) at amortised cost. Classifi cation depends on the Company’s business model for managing the fi nancial assets and the contractual terms of the cash fl ows.
The Company assigns its fi nancial instruments (excluding its at-cost investments, which are outside the scope of IFRS 9 “Financial Instruments”) into classes based on their category in the Statement of Financial Position.
The following table presents the carrying amounts and fair values of fi nancial instruments by class and by IFRS 9 measurement category as of 31 December 2 020:
(In € million)
Fair value through profit
or lossFair value
through OCI
Financial assets and liabilities
at amortised cost
Financial instrument
total
Amortised cost
Fair value
Book value
Fair value
Assets
Other investments and long-term financial assets
Equity investments 920 0 0 0 920 920
Loans 0 0 1,467 1,568 1,467 1,568
Trade receivables 0 0 492 492 492 492
Other financial assets
Derivative instruments 3,560 0 0 0 3,560 3,560
Current account Group companies 0 0 11,167 11,167 11,167 11,167
Securities 0 6,613 0 0 6,613 6,613
Cash and cash equivalents 9,654 512 494 494 10,660 10,660
Total 14,134 7,125 13,620 13,721 34,879 34,980
Liabilities
Financing liabilities
Bonds and commercial papers 0 0 (8,358) (9,185) (8,358) (9,185)
Liabilities to financial institutions and others 0 0 (81) (82) (81) (82)
Internal loans payable 0 0 (4,073) (4,106) (4,073) (4,106)
Other financial liabilities
Derivative instruments (3,166) 0 0 0 (3,166) (3,166)
Current accounts Group companies 0 0 (25,527) (25,527) (25,527) (25,527)
Total (3,166) 0 (38,039) (38,900) (41,205) (42,066)
109109Airbus / Financial Statements 2020
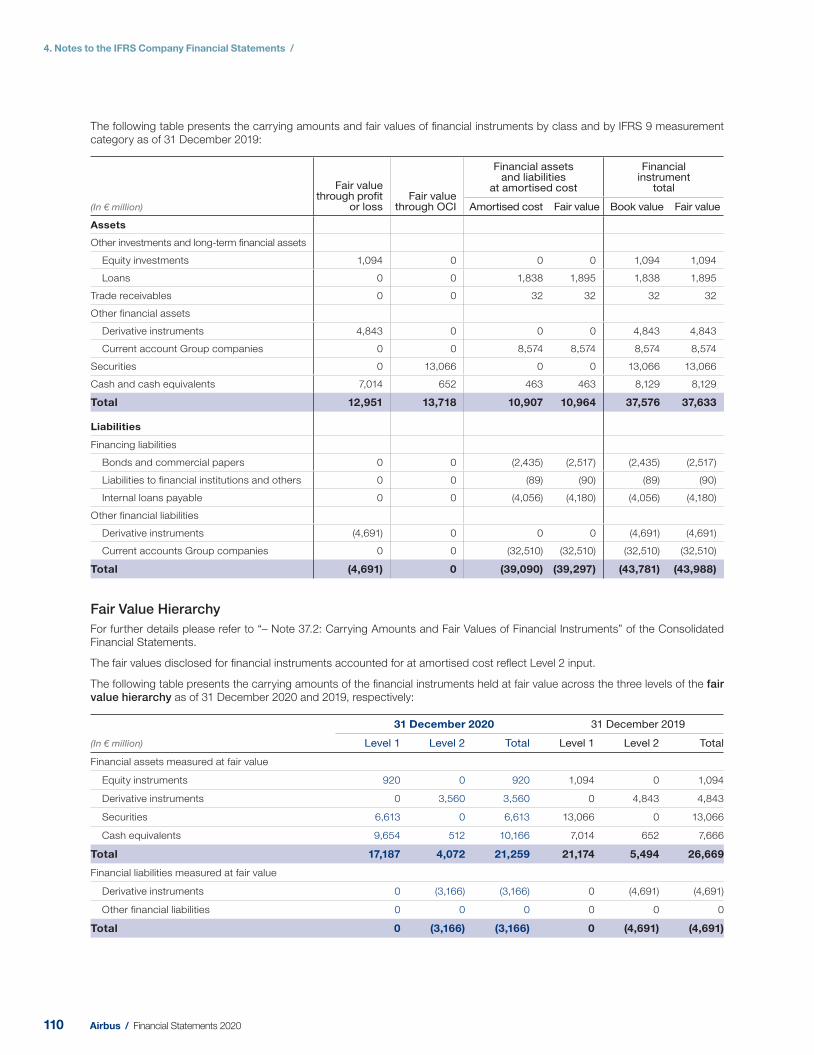
4. Notes to the IFRS Company Financial Statements /
The following table presents the carrying amounts and fair values of fi nancial instruments by class and by IFRS 9 measurement category as of 31 December 2019:
(In € million)
Fair value through profit
or lossFair value
through OCI
Financial assets and liabilities
at amortised cost
Financial instrument
total
Amortised cost Fair value Book value Fair value
Assets
Other investments and long-term financial assets
Equity investments 1,094 0 0 0 1,094 1,094
Loans 0 0 1,838 1,895 1,838 1,895
Trade receivables 0 0 32 32 32 32
Other financial assets
Derivative instruments 4,843 0 0 0 4,843 4,843
Current account Group companies 0 0 8,574 8,574 8,574 8,574
Securities 0 13,066 0 0 13,066 13,066
Cash and cash equivalents 7,014 652 463 463 8,129 8,129
Total 12,951 13,718 10,907 10,964 37,576 37,633
Liabilities
Financing liabilities
Bonds and commercial papers 0 0 (2,435) (2,517) (2,435) (2,517)
Liabilities to financial institutions and others 0 0 (89) (90) (89) (90)
Internal loans payable 0 0 (4,056) (4,180) (4,056) (4,180)
Other financial liabilities
Derivative instruments (4,691) 0 0 0 (4,691) (4,691)
Current accounts Group companies 0 0 (32,510) (32,510) (32,510) (32,510)
Total (4,691) 0 (39,090) (39,297) (43,781) (43,988)
Fair Value Hierarchy
For further details please refer to “– Note 37.2: Carrying Amounts and Fair Values of Financial Instruments” of the Consolidated Financial Statements.
The fair values disclosed for fi nancial instruments accounted for at amortised cost refl ect Level 2 input.
The following table presents the carrying amounts of the fi nancial instruments held at fair value across the three levels of the fair value hierarchy as of 31 December 2020 and 2019, respectively:
(In € million)
31 December 2020 31 December 2019
Level 1 Level 2 Total Level 1 Level 2 Total
Financial assets measured at fair value
Equity instruments 920 0 920 1,094 0 1,094
Derivative instruments 0 3,560 3,560 0 4,843 4,843
Securities 6,613 0 6,613 13,066 0 13,066
Cash equivalents 9,654 512 10,166 7,014 652 7,666
Total 17,187 4,072 21,259 21,174 5,494 26,669
Financial liabilities measured at fair value
Derivative instruments 0 (3,166) (3,166) 0 (4,691) (4,691)
Other financial liabilities 0 0 0 0 0 0
Total 0 (3,166) (3,166) 0 (4,691) (4,691)
110 Airbus / Financial Statements 2020
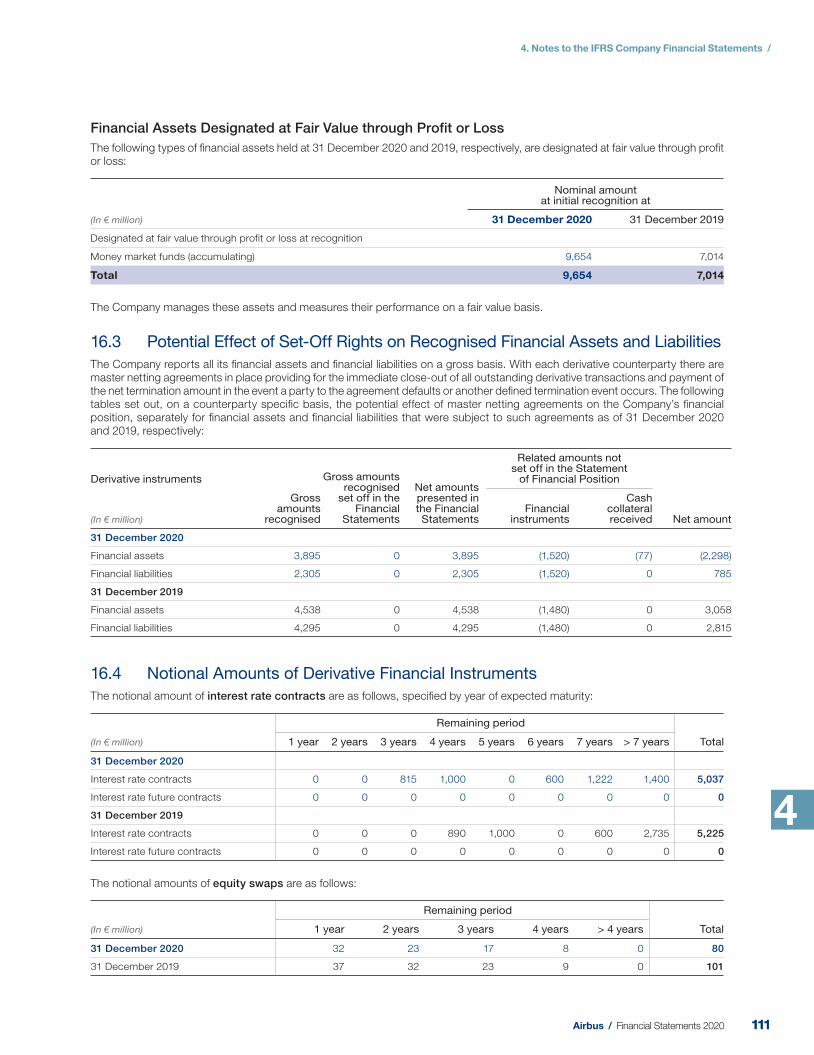
4. Notes to the IFRS Company Financial Statements /
4
Financial Assets Designated at Fair Value through Profit or Loss
The following types of fi nancial assets held at 31 December 2020 and 2019, respectively, are designated at fair value through profi t or loss:
(In € million)
Nominal amount at initial recognition at
31 December 2020 31 December 2019
Designated at fair value through profit or loss at recognition
Money market funds (accumulating) 9,654 7,014
Total 9,654 7,014
The Company manages these assets and measures their performance on a fair value basis.
16.3 Potential Effect of Set-Off Rights on Recognised Financial Assets and Liabilities
The Company reports all its fi nancial assets and fi nancial liabilities on a gross basis. With each derivative counterparty there are master netting agreements in place providing for the immediate close-out of all outstanding derivative transactions and payment of the net termination amount in the event a party to the agreement defaults or another defi ned termination event occurs. The following tables set out, on a counterparty specifi c basis, the potential effect of master netting agreements on the Company’s fi nancial p osition, separately for fi nancial assets and fi nancial liabilities that were subject to such agreements as of 31 December 2020 and 2019 , respectively:
Derivative instruments
Gross amounts
recognised
Gross amounts recognised
set off in the Financial
Statements
Net amounts presented in the Financial Statements
Related amounts not set off in the Statement
of Financial Position
Net amount(In € million)Financial
instruments
Cash collateral received
31 December 2020
Financial assets 3,895 0 3,895 (1,520) (77) (2,298)
Financial liabilities 2,305 0 2,305 (1,520) 0 785
31 December 2019
Financial assets 4,538 0 4,538 (1,480) 0 3,058
Financial liabilities 4,295 0 4,295 (1,480) 0 2,815
16.4 Notional Amounts of Derivative Financial Instruments
The notional amount of interest rate contracts are as follows, specifi ed by year of expected maturity:
(In € million)
Remaining period
Total1 year 2 years 3 years 4 years 5 years 6 years 7 years > 7 years
31 December 2020
Interest rate contracts 0 0 815 1,000 0 600 1,222 1,400 5,037
Interest rate future contracts 0 0 0 0 0 0 0 0 0
31 December 2019
Interest rate contracts 0 0 0 890 1,000 0 600 2,735 5,225
Interest rate future contracts 0 0 0 0 0 0 0 0 0
The notional amounts of equity swaps are as follows:
(In € million)
Remaining period
Total1 year 2 years 3 years 4 years > 4 years
31 December 2020 32 23 17 8 0 80
31 December 2019 37 32 23 9 0 101
111111Airbus / Financial Statements 2020
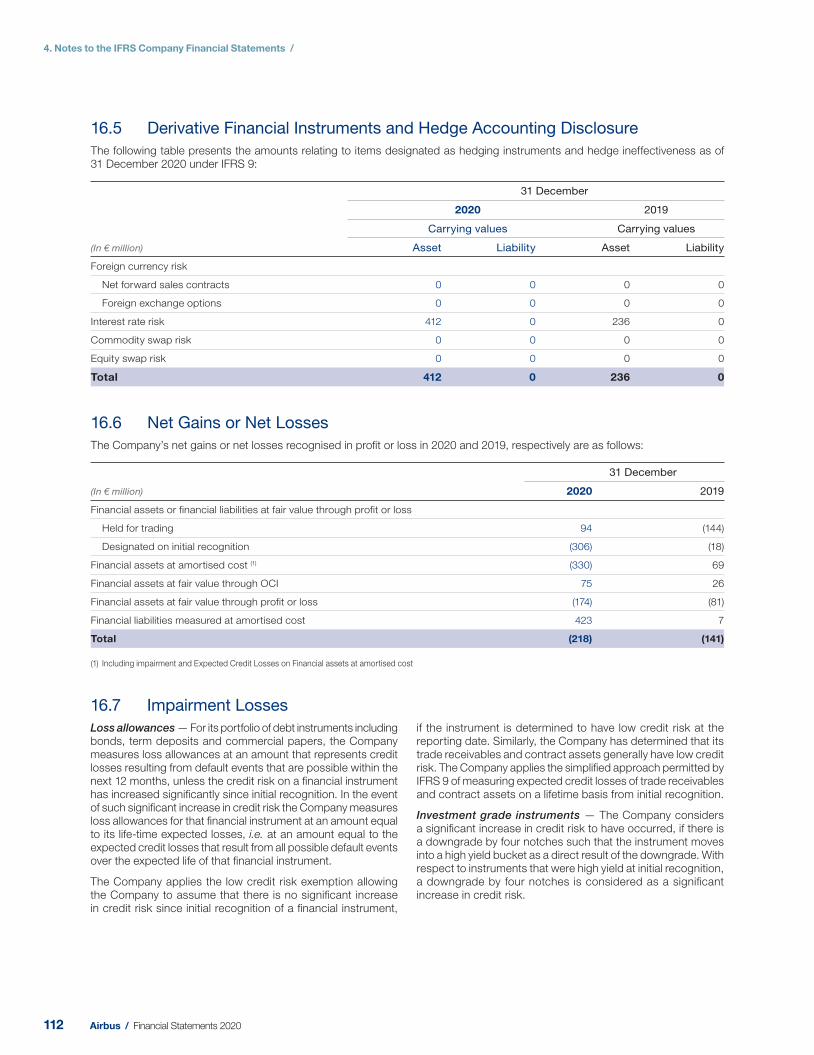
4. Notes to the IFRS Company Financial Statements /
16.5 Derivative Financial Instruments and Hedge Accounting Disclosure
The following table presents the amounts relating to items designated as hedging instruments and hedge ineffectiveness as of 31 December 2020 under IFRS 9:
(In € million)
31 December
2020 2019
Carrying values Carrying values
Asset Liability Asset Liability
Foreign currency risk
Net forward sales contracts 0 0 0 0
Foreign exchange options 0 0 0 0
Interest rate risk 412 0 236 0
Commodity swap risk 0 0 0 0
Equity swap risk 0 0 0 0
Total 412 0 236 0
16.6 Net Gains or Net Losses
The Company’s net gains or net losses recognised in profi t or loss in 2020 and 2019, respectively are as follows:
(In € million)
31 December
2020 2019
Financial assets or financial liabilities at fair value through profit or loss
Held for trading 94 (144)
Designated on initial recognition (306) (18)
Financial assets at amortised cost (1) (330) 69
Financial assets at fair value through OCI 75 26
Financial assets at fair value through profit or l oss (174) (81)
Financial liabilities measured at amortised cost 423 7
Total (218) (141)
(1) Including impairment and Expected Credit Losses on Financial assets at amortised cost
16.7 Impairment Losses
Loss allowances — For its portfolio of debt instruments including bonds, term deposits and commercial papers, the Company measures loss allowances at an amount that represents credit losses resulting from default events that are possible within the next 12 months, unless the credit risk on a fi nancial instrument has increased signifi cantly since initial recognition. In the event of such signifi cant increase in credit risk the Company measures loss allowances for that fi nancial instrument at an amount equal to its life-time expected losses, i.e. at an amount equal to the expected credit losses that result from all possible default events over the expected life of that fi nancial instrument.
The Company applies the low credit risk exemption allowing the Company to assume that there is no signifi cant increase in credit risk since initial recognition of a fi nancial instrument,
if the instrument is determined to have low credit risk at the reporting date. Similarly, the Company has determined that its trade receivables and contract assets generally have low credit risk. The Company applies the simplifi ed approach permitted by IFRS 9 of measuring expected credit losses of trade receivables and contract assets on a lifetime basis from initial recognition.
Investment grade instruments — The Company considers a signifi cant increase in credit risk to have occurred, if there is a downgrade by four notches such that the instrument moves into a high yield bucket as a direct result of the downgrade. With respect to instruments that were high yield at initial recognition, a downgrade by four notches is considered as a signifi cant increase in credit risk.
112 Airbus / Financial Statements 2020
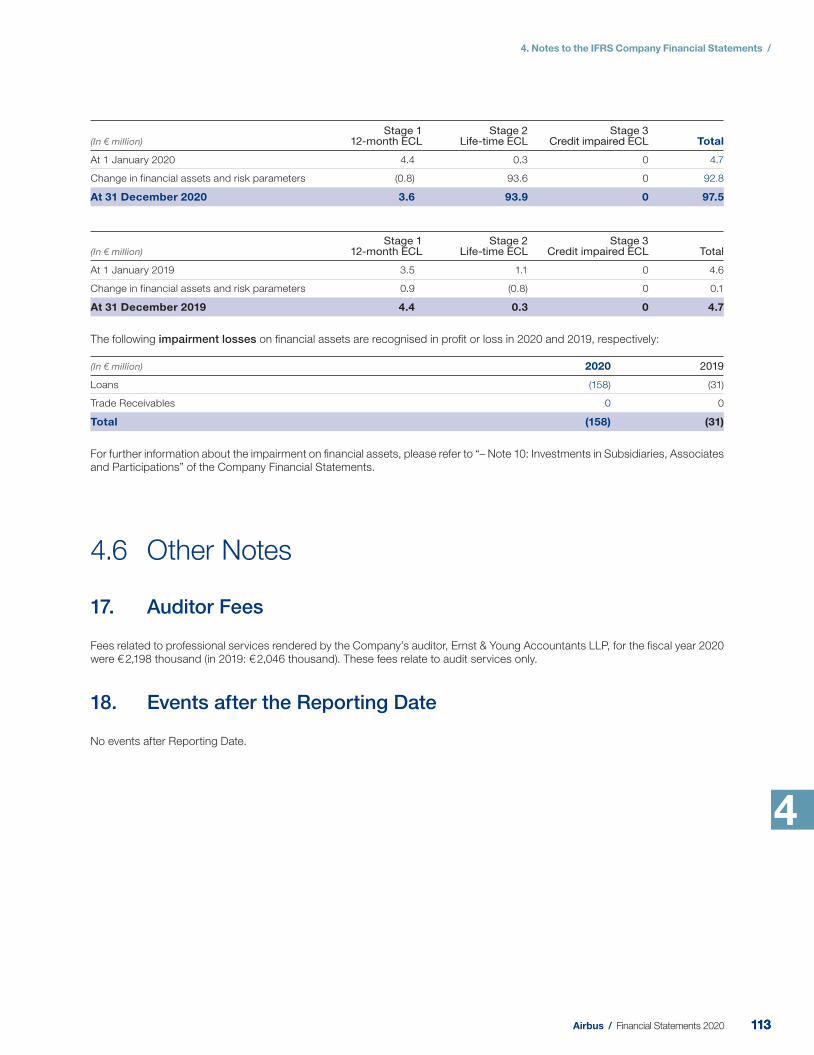
4. Notes to the IFRS Company Financial Statements /
4
(In € million)Stage 1
12-month ECLStage 2
Life-time ECLStage 3
Credit impaired ECL Total
At 1 January 2020 4.4 0.3 0 4.7
Change in financial assets and risk parameters (0.8) 93.6 0 92.8
At 31 December 2020 3.6 93.9 0 97.5
(In € million)Stage 1
12-month ECLStage 2
Life-time ECLStage 3
Credit impaired ECL Total
At 1 January 2019 3.5 1.1 0 4.6
Change in financial assets and risk parameters 0.9 (0.8) 0 0.1
At 31 December 2019 4.4 0.3 0 4.7
The following impairment losses on fi nancial assets are recognised in profi t or loss in 2020 and 2019, respectively:
(In € million) 2020 2019
Loans (158) (31)
Trade Receivables 0 0
Total (158) (31)
For further information about the impairment on fi nancial assets, please refer to “– Note 10: Investments in Subsidiaries, Associates and Participations” of the Company Financial Statements.
4.6 Other Notes
17. Auditor Fees
Fees related to professional services rendered by the Company’s auditor, Ernst & Young Accountants LLP, for the fi scal year 2020 were € 2,198 thousand (in 2019: € 2,046 thousand). These fees relate to audit services only.
18. Events after the Reporting Date
No events after Reporting Date.
113113Airbus / Financial Statements 2020

Chapter
5114 Airbus / Financial Statements 2020
115 Airbus / Financial Statements 2020
5.Other Supplementary Information Including the Independent Auditor’s Report
5. Other Supplementary Information Including the Independent Auditor’s Report /
Other Supplementary Information
1. Appropriation of Result
Articles 30 and 31 of the Articles of Association provide that the Board of Directors shall determine which part of the result shall be attributed to the reserves. The General Meeting of Shareholders may dispose of a reserve only upon a proposal of the Board of Directors and to the extent it is permitted by law and the Articles of Association. Dividends may only be paid after adoption of the annual accounts from which it appears that the shareholders’ equity of the Company is more than the amount of the issued and paid-in part of the capital increased by the reserves that must be maintained by law.
It will be proposed at the Annual General Meeting of Shareholders that the Profi t for the period of € 3,143 million as shown in the income statements for the fi nancial year 2020 is to be added to retained earnings and given the ongoing volatility, there will be no dividend proposal for 2020.
2. Independent Auditor’s Report
To: the General Meeting of Shareholders of Airbus SE
To: the shareholders and Board of Directors of Airbus SE
Report on the audit of the Financial Statements 2020 included in the annual report
Our opinion
We have audited the Financial Statements 2020 of Airbus SE (the Company), based in Amsterdam.
In our opinion the accompanying Financial Statements give a true and fair view of the Financial Position of Airbus SE as at 31 December 2020, and of its result and its cash fl ows for 2020 in accordance with International Financial Reporting Standards as adopted by the European Union (EU-IFRS) and with Part 9 of Book 2 of the Dutch Civil Code.
The Financial Statements comprise:
– the Consolidated and Company Statement of Financial Position as at 31 December 2020; – the following statements for 2020: the consolidated and company income statement; – the Consolidated and Company Statements of Comprehensive Income, Changes in Equity and Cash Flows; – the notes comprising a summary of the signifi cant accounting policies and other explanatory information.
Basis for our opinion
We conducted our audit in accordance with Dutch law, including the Dutch Standards on Auditing. Our responsibilities under those standards are further described in the “Our responsibilities for the audit of the Financial Statements” section of our report.
We are independent of Airbus SE in accordance with the EU Regulation on specifi c requirements regarding statutory audit of public-interest entities, the “Wet toezicht accountantsorganisaties” (Wta, Audit fi rms supervision act), the “Verordening inzake de onafhankelijkheid van accountants bij assurance-opdrachten” (ViO, Code of Ethics for Professional Accountants, a regulation with respect to independence) and other relevant independence regulations in the Netherlands. Furthermore we have complied with the “Verordening gedrags- en beroepsregels accountants” (VGBA, Dutch Code of Ethics).
We believe the audit evidence we have obtained is suffi cient and appropriate to provide a basis for our opinion.
Our audit approach
Our understanding of the business
The Company is a global leader in aeronautics, aerospace and related services. The Company is structured in segments and we tailored our group audit approach accordingly. We paid specifi c attention in our audit to a number of areas driven by the operations of the Group and our risk assessment. We refer to the key audit matters for those areas.
We start by determining materiality and by identifying and assessing the risks of material misstatement of the Financial Statements, whether due to fraud, non-compliance with laws and regulations or error in order to design audit procedures responsive to those risks, and in order to obtain audit evidence that is suffi cient and appropriate to provide a basis for our opinion. The risk of not detecting a material misstatement resulting from fraud is higher than for one resulting from error, as fraud may involve collusion, forgery, intentional omissions, misrepresentations, or the override of internal control.
116 Airbus / Financial Statements 2020
5. Other Supplementary Information Including the Independent Auditor’s Report /
5
Materiality
Materiality € 250 million (2019: € 347 million)
Benchmark applied
5% of “normalized” EBIT Adjusted. (2019: 5% of EBIT Adjusted).
Explanation We consider normalized EBIT Adjusted as the most appropriate benchmark as it best aligns with the expectations of those charged with governance at Airbus and of users of the Company’s Financial Statements.
In determining this year’s materiality, we have considered the unique combination of macro-economic factors that led to disruption in demand. We believe that in order to set materiality in the current uncertain economic times, we should account for what is expected to be a relatively temporary phenomenon. Whilst we considered alternative benchmarks to normalized EBIT Adjusted including revenue and total assets, we believe that a normalized EBIT Adjusted approach to materiality remains appropriate. This addresses the analysts’ consensus that the Company’s industry economics including demand will return to previous levels over time. The normalized EBIT Adjusted is based on an historic ratio comparing EBIT Adjusted to revenue.
We confirmed with the Audit Committee that they were satisfied that the level of materiality was appropriate. We kept our assessment of materiality under review throughout our audit.
We have also taken into account misstatements and/or possible misstatements that in our opinion are material for the users of the Financial Statements for qualitative reasons.
We agreed with the Audit Committee of the Board of Directors (the Audit Committee) that misstatements in excess of € 12 million that are identifi ed during the audit would be reported to them, as well as smaller misstatements that in our view must be reported on qualitative grounds.
Scope of the Group audit
Airbus SE is at the head of a group of entities. The fi nancial information of this group is included in the Consolidated Financial Statements of Airbus SE.
The entities are grouped into three business segments: Airbus, Airbus Helicopters and Airbus Defence and Space. The audit of the three segments is performed jointly by EY and KPMG. The audit of the entities in scope is performed by either EY or KPMG network fi rms.
Because we are ultimately responsible for the opinion, we are also responsible for directing, supervising and performing the Group audit. In this respect we have determined the nature and extent of the audit procedures to be carried out for group entities. Decisive were the size and/or the risk profi le of the Group entities or operations. On this basis, we selected group entities for which an audit or review had to be carried out on the complete set of fi nancial information or specifi c items.
Our group audit focused mainly on signifi cant group entities that are of signifi cant size, have signifi cant risks to the Company associated with them or are considered for other reasons.
Because of the (international) travel restrictions and social distancing due to the COVID-19 pandemic, we needed to restrict or have been unable to visit management and component auditors to discuss, among others, the business activities and the identifi ed signifi cant risks or to review and evaluate relevant parts of the component auditor’s audit documentation and to discuss signifi cant matters arising from that evaluation on site. Furthermore we were forced to perform our procedures to a greater extent remotely due to the COVID-19 measures. In order to compensate for the limitations related to the absence of physical meetings and direct observation, we used predominantly communication technology and written information exchange, attended calls and video conferences with (local) management and local auditors throughout the audit and closing meetings, intensifi ed communication with component teams, required more granular reporting from component audit teams, and reviewed remotely the component teams’ working papers in order to obtain suffi cient and appropriate audit evidence to provide a basis for our opinion.
In total our audit procedures represent 92% of total consolidated revenue, 89% of total consolidated assets and 85% of total consolidated EBIT and all adjustments to EBIT. The remaining 8% of revenues, 11% of total assets and 15% of total EBIT result from entities, none of which individually represents more than 1% of revenues or EBIT. For those entities, we performed, amongst others, analytical procedures to corroborate our assessment that the Financial Statements are free from material misstatements.
We executed an audit plan that includes participation in risk assessment and planning discussions, setting the direction of the Group audit work (including instructions to the divisional and entity auditors), reviewing and discussing the planned audit approach, obtaining an understanding of the fi nancial reporting process and performing procedures on the Group consolidation, participating in the evaluation of key accounting topics, reviewing the Financial Statements and participating in meetings with the management of the Company and its division s. In our audit instructions, we also included targeted audit procedures that address the A220, A350, A380, A400M programmes as well as the risk of non-compliance with laws and regulations. We ensured that the audit teams both at group and at component levels included the appropriate skills and competences which are needed for the audit of a listed client in the aerospace industry. We furthermore executed fi le reviews at EY network teams and KPMG. We involved several EY specialists to assist the audit team, including specialists from our tax, actuarial, treasury, valuation and compliance departments.
117117Airbus / Financial Statements 2020
5. Other Supplementary Information Including the Independent Auditor’s Report /
By performing the procedures mentioned above at group entities, together with additional procedures at group level, we have been able to obtain suffi cient and appropriate audit evidence about the Company’s fi nancial information to provide an opinion about the Consolidated Financial Statements.
Our focus on fraud and non-compliance with laws and regulations
Our responsibility
Although we are not responsible for preventing fraud or non-compliance and cannot be expected to detect non-compliance with all laws and regulations, it is our responsibility to obtain reasonable assurance that the Financial Statements, taken as a whole, are free from material misstatement, whether caused by fraud or error. Non-compliance with laws and regulations may result in fi nes, litigation or other consequences for the Company that may have a material effect on the Financial Statements.
Our audit response related to fraud risks
In order to identify and assess the risks of material misstatements of the Financial Statements due to fraud, we obtained an understanding of the entity and its environment, including the entity’s internal control relevant to the audit and in order to design audit procedures that are appropriate in the circumstances. As in all of our audits, we addressed the risk of management override of internal control. We do not audit internal control per se for the purpose of expressing an opinion on the effectiveness of the Company’s internal control.
We considered available information and made enquiries of relevant executives, directors (including internal audit, legal, compliance, human resources and regional directors) and the Ethics and Compliance Committee. As part of our process of identifying fraud risks, we evaluated fraud risk factors with respect to fi nancial reporting fraud, misappropriation of assets and bribery and corruption in close co-operation with our forensic and legal specialists. As the Company is a global company, operating in multiple jurisdictions, we considered the risk of bribery and corruption. We refer to our Key Audit Matter “Litigation and claims and risk of non-compliance with laws and regulations” for more details.
In our process of identifying fraud risks, we considered whether the COVID-19 pandemic gives rise to specifi c fraud risk factors resulting from a decrease in the effectiveness of controls as a result of the general disruption associated with remote working, illness and workforce reductions, supply chain disruptions, or workarounds.
We evaluated the design and the implementation and, where considered appropriate, tested the operating effectiveness of internal controls that mitigate fraud risks. In addition, we performed procedures to evaluate key accounting estimates for management bias in particular relating to important judgement areas and signifi cant accounting estimates as disclosed in Note 4 to the Financial Statements. We have also used data analysis to identify and address high-risk journal entries.
We incorporated elements of unpredictability in our audit. We considered the outcome of our other audit procedures and evaluated whether any fi ndings were indicative of fraud or non-compliance. If so, we re-evaluate our assessment of fraud risk and its resulting impact on our audit procedures.
Our audit response related to risks of non-compliance with laws and regulations
We assessed factors related to the risks of non-compliance with laws and regulations that could reasonably be expected to have a material effect on the Financial Statements from our general industry experience, through discussions with the management board, reading minutes, inspection of internal audit and compliance reports and performing substantive tests of details of classes of transactions, account balances or disclosures.
We also inspected lawyers’ letters and correspondence with regulatory authorities and remained alert to any indication of (suspected) non-compliance throughout the audit. Finally we obtained written representations that all known instances of non-compliance with laws and regulations have been disclosed to us. We refer to our Key Audit Matter “Litigation and claims and risk of non-compliance with laws and regulations” for more details.
Going concern
We performed the following procedures in order to identify and assess the risks of going concern and to conclude on the appropriateness of management’s use of the going concern basis of accounting. Management made a specifi c assessment of the Company’s ability to continue as a going concern and to continue its operations for at least the next 12 months from when the Financial Statements are authorized for issue. We discussed and evaluated the assessment including scenarios with management. We exercised professional judgment and applied professional scepticism, and focused specifi cally on the process followed by management to make the assessment, on instances of management bias that could represent a risk, on the impact that current events and conditions have on the Company’s operations and forecasted cash fl ows, in order to challenge management’s assertion whether or not the Company will have suffi cient liquidity to continue to meet its obligations as they fall due. We involved specialists to review the prospective fi nancial information and underlying assumptions.
118 Airbus / Financial Statements 2020
5. Other Supplementary Information Including the Independent Auditor’s Report /
5
We consider based on the audit evidence obtained, whether a material uncertainty exists related to events or conditions that may cast signifi cant doubt on the Company’s ability to continue as a going concern. Should we have concluded that a material uncertainty exists, we would be required to draw attention in our auditor’s report to the related disclosures in the Financial Statements or, if such disclosures are inadequate, to modify our opinion. Our conclusions are based on the audit evidence obtained up to the date of our auditor’s report. However, future events or conditions may cause a company to cease to continue as a going concern.
General audit procedures
Our audit further included among others:
– performing audit procedures responsive to the risks identifi ed, and obtaining audit evidence that is suffi cient and appropriate to provide a basis for our opinion;
– evaluating the appropriateness of accounting policies used and the reasonableness of accounting estimates and related disclosures made by management;
– evaluating the overall presentation, structure and content of the Financial Statements, including the disclosures; – evaluating whether the Financial Statements represent the underlying transactions and events in a manner that achieves fair presentation.
Our key audit matters
Key audit matters are those matters that, in our professional judgement, were of most signifi cance in our audit of the Financial Statements. We have communicated the key audit matters to the Audit Committee. The key audit matters are not a comprehensive refl ection of all matters discussed.
The key audit matter ‘Settlement agreements reached with the French Parquet National Financier (PNF), the UK Serious Fraud Offi ce (SFO) and the US Department of Justice (DoJ) and US Department of State (DoS)’ which was included in our last year’s auditor’s report, is no longer considered a key audit matter for this year as this was related to a one-off transaction.
These matters were addressed in the context of our audit of the Financial Statements as a whole and in forming our opinion thereon, and we do not provide a separate opinion on these matters.
Revenue recognition
(Reference is made to the disclosures on “– Note 3: Significant Accounting Policies”, “– Note 4: Key estimates and judgements”,
“– Note 11: Segment Information” and “– Note 12: Revenues and gross margin” of the Financial Statements)
Risk The Group revenue recognition is complex due to its wide range of activities (including the sale of commercial aircraft and helicopters, sale of military aircraft and helicopters, sale of space systems and services), its various types of contracts including non-standard clauses and the duration of some contracts including long-term development activities.
Recognition of revenue includes significant judgements and estimates including whether or not the contracts contain multiple performance obligations which should be accounted for separately and including the determination of the most appropriate method for revenue recognition of these performance obligations. This comprises the identification of potential variable considerations reducing the consideration received, allocation of this consideration to the different performance obligations and assessing if the performance obligations are satisfied over time or at a point in time. In particular the amount of revenue and profit recognized in a year for performance obligations satisfied at a point in time is dependent on the transfer of control. For performance obligations satisfied over time this is dependent on the assessment of the stage of completion of performance obligations as well as estimated total revenues and estimated total costs. The Company uses costs incurred as the method for determining stage of completion. Recognition of revenue for some activities may include the assessment of the ability to collect the customer consideration. In the context of COVID-19 pandemic, the deterioration of customer’s ability to pay can impact the measurement of revenues.
Our audit approach
Our audit procedures included, amongst others, assessing the appropriateness of the Company’s accounting policies related to revenue recognition according to IFRS15 “Revenue from contracts with customers”. In addition, we evaluated the design and implementation and, where considered appropriate, tested the operating effectiveness of internal controls related to the completeness, accuracy and timing of the revenue recognized. We selected individual revenue transactions to assess proper identification of the performance obligations in the contracts and allocation of the consideration amongst the performance obligation (such as the A400M contract and space contracts), the completeness and valuation of the variable considerations (including constraints applied, if applicable) included in the transaction price (notably for A400M contract and residual value guarantee in the sale of some commercial aircrafts) and the timing of transfer of control.
In order to evaluate the significant judgements and estimates made by management, we read supporting contractual agreements, met with sales representatives and programme teams to understand the nature of the various obligations to be rendered under the contract and discuss specific clauses that could prevent transfer of control (mostly for the sales of commercial aircrafts), obtained evidence of transfer of control such as proof of delivery, tested the costs incurred, examined computation of costs progression and assessed the reasonableness of the estimated cost to complete included in the cost-to-cost method for performance obligation recognized over time (notably for A400M development, Tiger and Eurofighter contracts and some border security and space contracts).
Finally we determined that the appropriate disclosures were made in the Financial Statements.
119119Airbus / Financial Statements 2020
5. Other Supplementary Information Including the Independent Auditor’s Report /
Estimations related to contract margin for the accounting of onerous contracts
(Reference is made to the disclosure on “– Note 3: Significant Accounting Policies”, “– Note 4: Key estimates and judgements”,
“– Note 12: Revenues and gross margin” and “– Note 25: Provisions, contingent assets and contingent liabilities” of the Financial Statements)
Risk The Group owns a large portfolio of long-term contracts for which it needs to assess the contract margin in order to recognise a provision for onerous contract.
Provisions for onerous contracts such as for the A400M contract are recognized when it becomes probable that the present value of unavoidable costs of fulfilling the obligations under the contract exceeds the present value of economic benefits expected to be received under the contract.
The determination of these contract margins and provisions for onerous contracts requires management’s significant judgement and assumptions associated with estimated revenue and costs at completion of the programme, the achievement of technical milestones, production plan, performance guarantees as well as key risks such as expected outcome from ongoing negotiations with customers, penalties for delay or non-compliance.
Our audit approach
We evaluated the design and implementation and where considered appropriate tested the operating effectiveness of internal controls for accounting for onerous contracts and for the assessment of the contract margin.We also performed substantive procedures on individually significant programmes. We evaluated management’s assumptions in the determination of amongst others the stage of completion of a project and estimates to complete for both revenue and costs. We tested the costs incurred to date and the accuracy and completeness of the data used in developing these key estimates.
We also evaluated management’s assessment of key contract risks and opportunities to determine whether or not these are appropriately reflected in the cost to complete forecasts, paid specific attention to technical and market developments and ongoing negotiations with customers. We performed inquiries with the programme team and the Head of Programme in order to confirm our understanding on the programme status and associated risks which may affect total estimated costs to complete.
We challenged management’s assumptions by discussing and reviewing correspondence with customers, considered the accuracy and consistency of similar estimates made in previous years and corroborated the assumptions with the latest contractual information.
Finally we determined that the appropriate disclosures were made in the Financial Statements.
Recoverability of key programme assets - long-lived assets and inventory
(Reference is made to the disclosures on “– Note 3: Significant Accounting Policies”, “– Note 19: Intangible Assets” and “– Note 21: Property,
Plant and Equipment” of the Financial Statements)
Risk Finished aircraft and work in progress inventory, capitalized development costs, other intangible assets and jigs and tools relating to the key programmes, such as the A220, A330, A350, A380, H160 and H175, were tested for impairment in the context of COVID-19 and reduction of aircraft deliveries. The main estimates to determine if an impairment of long-lived assets such as capitalized development costs, other intangible assets and jigs and tools has to be recognized are the future cash flows (including the projected number of deliveries and the associated margin per aircraft) and the appropriate discount rates. With the reduction of deliveries, some work in progress and finished aircraft may no longer be fully recoverable due to cancellation of orders and resulting remarketing costs. Associated depreciations depend on the estimate of the selling price, remarketing costs and other costs.
Owing to the inherent uncertainty involved in forecasting future costs and interpreting contractual and commercial positions in determining impairments, especially in the COVID-19 context, this is a key audit area.
Our audit approach
We evaluated the design and implementation and where considered appropriate tested the operating effectiveness of internal controls for identifying and recording impairments of long-lived assets and depreciations of Work in progress and finished aircrafts.
We evaluated the impairment tests performed by testing the integrity of the management’s impairment model. We assessed management’s assumptions for the discount rate and the determination of the forecasted revenue to be realized (including the timing of expected deliveries and estimated selling price), cost to be incurred (including any contractual penalties) and the expected gross margin, including performing sensitivity to evaluate the impact of changing some assumptions such as the discount rate or key business parameters (price, growth rate for instance). We also performed inquiry of the programme controller and Head of Programmes to confirm our understanding of the status of the programme.
We tested the provision for depreciation of work in progress and finished goods by evaluating management’s assumptions in the determination of likelihood of cancellation, future selling price, remarketing and other costs. We challenged management’s assumptions by discussing and reviewing correspondence with customers and comparing them with historical data, appraisers’ market value and agreements with customers.
Finally we determined that the appropriate disclosures were made in the Financial Statements.
120 Airbus / Financial Statements 2020
5. Other Supplementary Information Including the Independent Auditor’s Report /
5
Valuation of derivative financial instruments and hedge accounting
(Reference is made to “– Note 38: Financial instruments” of the Financial Statements)
Risk The Company operates in a business environment that is exposed to currency volatility. A significant portion of the Company’s revenue is denominated in US dollars, while a major part of its costs is incurred in Euro and, to a lesser extent, in Pounds Sterling. In response to these risks the Company uses financial instruments (mainly currency forwards) to mitigate the exposure to changes in market rates.The Company applies cash flow hedge accounting. The accounting policy allows the Company to re-position the foreign currency hedges and avoid hedge disqualification when a hedged aircraft is postponed. This is conditioned by the Company’s ability to demonstrate the absence of a reduction in the number of hedged aircrafts over the Foreign Exchange management hedging horizon.
The magnitude of the Company’s hedge portfolio entails a significant “mark to market” valuation risk. Furthermore, in the COVID-19 context, potential changes in the delivery assumptions related to aircraft cancelations, customer defaults and aircraft postponement beyond the Foreign exchange management hedging horizon could lead to disqualification of the associated cash-flow hedges.
Our audit approach
For the audit of the foreign currency hedge portfolio, we used specialists who tested the controls around the Company’s central treasury system, independently calculated the valuation of the treasury portfolio (by sample) and evaluated the application of the cash-flow hedge accounting rules.
We obtained counterparty confirmation of the outstanding financial instruments to verify the existence and ownership of the hedge portfolio.Based on a sample of financial derivative instruments we assessed that the fair value of the financial instruments was correctly determined and no material exceptions were noted.
We verified the documentation of the hedged items supported by both the recoverable backlog and production rate over the Foreign Exchange management hedging horizon. We tested the highly probable assessment of future aircraft delivery performed by the Company and challenged key management assumptions pertaining to order cancellation, airline default and aircraft rescheduling risks.
Finally we determined that the appropriate disclosures were made in the Financial Statements.
121121Airbus / Financial Statements 2020
5. Other Supplementary Information Including the Independent Auditor’s Report /
Litigation and claims and risk of non-compliance with laws and regulations
(Reference is made to the disclosures on “– Note 4: Key estimates and judgements”, “– Note 25: Provisions, contingent assets
and contingent liabilities” and “– Note 39: Litigations and claims” of the Financial Statements)
Risk Litigation and claims involve amounts that are potentially significant and the estimate of the amount to be provided as a liability, if any, is inherently subjective. The outcome of these matters may have a material effect on the Company’s results and its Financial Position.
A part of the Company’s business is characterized by competition for individually significant contracts with customers which are often directly or indirectly associated with governments. The process associated with these activities is susceptible to the risk of non-compliance with laws and regulations. In addition, the Company operates in a number of territories where the use of commercial intermediaries is normal practice. Certain entities of the Group remain under investigation by various law enforcement agencies for amongst others alleged irregularities concerning commercial intermediaries. Breaches of laws and regulations in these areas can lead to fines, penalties, criminal prosecution, commercial litigation and restrictions on future business.
Our audit approach
We planned and designed our audit approach to this area in conjunction with our in-house forensic specialists.
We evaluated the tone set by management and the Board of Directors and the Company’s approach to managing this risk.
We assessed the overall control environment and evaluated and tested the Company’s policies, procedures and controls to identify and assess possible non-compliance.
Furthermore we tested the selection process of intermediaries, related contractual arrangements, payments to intermediaries and the Company’s responses to suspected breaches of policy and non-compliance with laws and regulations.
We made inquiries of the Board of Directors and the Audit Committee, as well as the Company’s internal and external legal advisors as to the areas of potential or suspected breaches of law and regulations relating to bribery, including the status of ongoing investigations. To corroborate the results of those inquiries we vouched information received with objective evidence, third parties and we reviewed related documentation.We maintained a high level of vigilance to possible indications of significant non-compliance with laws and regulations relating to bribery and corruption whilst carrying out our other audit procedures. Accompanied by our own legal advisors we met on several occasions with the Company’s external counsel to obtain their views about the status of ongoing investigations as well as their potential impact on the Financial Statements. We furthermore tested journals entries and other transactions with unusual characteristics using amongst other data-analytics tools.
For (threatened) litigation cases and claims, we gained additional assurance by comparing management’s position to the assessment from external parties such as external lawyers in those cases where a high amount of judgement is involved.
We assessed that the disclosures in the Financial Statements reflect the current status of the investigations regarding suspected breaches of law or regulations in accordance with accounting standards. We also assessed the appropriateness of the contingent liability disclosure in the Financial Statements.
Report on other information included in the annual report
In addition to the Financial Statements and our auditor’s report thereon, the annual report contains other information that consists of:
– the report of the Board of Directors including the remuneration report (we refer to www.airbus.com for the board report); – other information as required by Part 9 of Book 2 of the Dutch Civil Code.
Based on the following procedures performed, we conclude that the other information:
– is consistent with the Financial Statements and does not contain material misstatements; – contains the information as required by Part 9 of Book 2 of the Dutch Civil Code and Section 2:135b and 2:145 sub-section 2 of the Dutch Civil Code.
We have read the other information. Based on our knowledge and understanding obtained through our audit of the Financial Statements or otherwise, we have considered whether the other information contains material misstatements. By performing these procedures, we comply with the requirements of Part 9 of Book 2 of the Dutch Civil Code and Section 2:135b sub-Section 7 of the Dutch Civil Code and the Dutch Standard 720. The scope of the procedures performed is substantially less than the scope of those performed in our audit of the Financial Statements.
The Board of Directors is responsible for the preparation of the other information, including the report of the Board of Directors in accordance with Part 9 of Book 2 of the Dutch Civil Code, other information as required by Part 9 of Book 2 of the Dutch Civil Code and the remuneration report in accordance with Sections 2:135b and 2:145 sub-section 2 of the Dutch Civil Code.
122 Airbus / Financial Statements 2020
5. Other Supplementary Information Including the Independent Auditor’s Report /
5
Report on other legal and regulatory requirements
Engagement
We were appointed by the Annual General Meeting of as auditor of Airbus SE on 28 April 2016, as of the audit for the year 2016 and have operated as statutory auditor since that date.
No prohibited non-audit services
We have not provided prohibited non-audit services as referred to in Article 5(1) of the EU Regulation on specifi c requirements regarding statutory audit of public-interest entities.
Description of responsibilities for the Financial Statements
Responsibilities of the Board of Directors and the Audit Committee for the Financial Statements
The Board of Directors is responsible for the preparation and fair presentation of the Financial Statements in accordance with EU-IFRS and Part 9 of Book 2 of the Dutch Civil Code. Furthermore, the Board of Directors is responsible for such internal control as management determines is necessary to enable the preparation of the Financial Statements that are free from material misstatement, whether due to fraud or error.
As part of the preparation of the Financial Statements, the Board of Directors is responsible for assessing the Company’s ability to continue as a going concern. Based on the fi nancial reporting frameworks mentioned, the Board of Directors should prepare the Financial Statements using the going concern basis of accounting unless the Board of Directors either intends to liquidate the Company or to cease operations, or has no realistic alternative but to do so. The Board of Directors should disclose events and circumstances that may cast signifi cant doubt on the Company’s ability to continue as a going concern in the Financial Statements.
The Audit Committee is responsible for overseeing the Company’s fi nancial reporting process.
Our responsibilities for the audit of the Financial Statements
Our objective is to plan and perform the audit engagement in a manner that allows us to obtain suffi cient and appropriate audit evidence for our opinion.
Our audit has been performed with a high, but not absolute, level of assurance, which means we may not detect all material errors and fraud during our audit.
Misstatements can arise from fraud or error and are considered material if, individually or in the aggregate, they could reasonably be expected to infl uence the economic decisions of users taken on the basis of these Financial Statements. The materiality affects the nature, timing and extent of our audit procedures and the evaluation of the effect of identifi ed misstatements on our opinion.
We have exercised professional judgement and have maintained professional skepticism throughout the audit, in accordance with Dutch Standards on Auditing, ethical requirements and independence requirements. The Our audit approach section above includes an informative summary of our responsibilities and the work performed as the basis for our opinion.
Communication
We communicate with the Audit Committee regarding, amongst other matters, the planned scope and timing of the audit and signifi cant audit fi ndings, including any signifi cant fi ndings in internal control that we identify during our audit. In this respect we also submit an additional report to the Audit Committee in accordance with Article 11 of the EU Regulation on specifi c requirements regarding statutory audit of public-interest entities. The information included in this additional report is consistent with our audit opinion in this auditor’s report.
We provide the Audit Committee with a statement that we have complied with relevant ethical requirements regarding independence, and to communicate with them all relationships and other matters that may reasonably be thought to bear on our independence, and where applicable, related safeguards.
From the matters communicated with the Audit Committee, we determine the key audit matters: those matters that were of most signifi cance in the audit of the Financial Statements. We describe these matters in our auditor’s report unless law or regulation precludes public disclosure about the matter or when, in extremely rare circumstances, not communicating the matter is in the public interest.
Amsterdam, 17 February 2021
Ernst & Young Accountants LLP
signed by A.A. van Eimeren
123123Airbus / Financial Statements 2020