Embed Size (px)
Citation preview
Air Transportation Network Load Balancing using Auction-Based Slot
Allocation for Congestion Management
GL Donohue, L Le, CH Chen, D WangGL Donohue, L Le, CH Chen, D WangCenter for Air Transportation Systems Research
Dept. of Systems Engineering & Operations ResearchGeorge Mason University
Fairfax, VANEXTOR NEXTOR WyeWye River ConfRiver Conf
June 21June 21--23, 200423, 2004
Outline
Description of the Congestion Problem− Chicago O’Hare Airport− NY La Guardia Airport
History of Congestion Management in the USAuction model for airport arrival slotsChicago ORD airport case study− simulated scenarios− results and interpretation
Observations and Recommendations

National Airspace System Characteristics
The NAS is a Stochastic AdaptiveStochastic Adaptive Network−− Stochastic:Stochastic: The system is characterized by PDF’s−− Adaptive:Adaptive: These PDF’s are a function of the System State and
Airline Market Decisions
Reasons that the NAS Cannot be DeterministicCannot be Deterministic:− Weather (winds, hazardous weather)− Mechanical Equipment Characteristics− Air Traffic Control System (including Controllers)− Aircraft Control System (including Pilots)− Airline Schedules set by varying Market Conditions
All Analysis and FAA Rules Must Acknowledge this Fundamental Nature in the Future

Operations are Back but ORD Delays are Worse
Monthly Total Operations at Major US Airports (Source: ETMS)
60,000
65,000
70,000
75,000
80,000
85,000
90,000
Jan-0
1Mar-
01May
-01Ju
l-01
Sep-01
Nov-01
Jan-0
2Mar-
02May
-02Ju
l-02
Sep-02
Nov-02
Jan-0
3Mar-
03May
-03Ju
l-03
Sep-03
Nov-03
Jan-0
4
Month
#Flights
ATL ORDAir travel is gradually picking up
Delayed Flights of Major US Air Carriers at ORD (Source: BTS)
02,0004,0006,0008,000
10,00012,00014,000
Jan-01
Mar-01
May-01
Jul-0
1Sep-01Nov-0
1Ja
n-02Mar-0
2May-0
2Ju
l-02
Sep-02Nov-0
2Ja
n-03Mar-0
3May-0
3Ju
l-03
Sep-03Nov-0
3Ja
n-04
Month
#Flights
Departure Arrival
Congestion is coming back
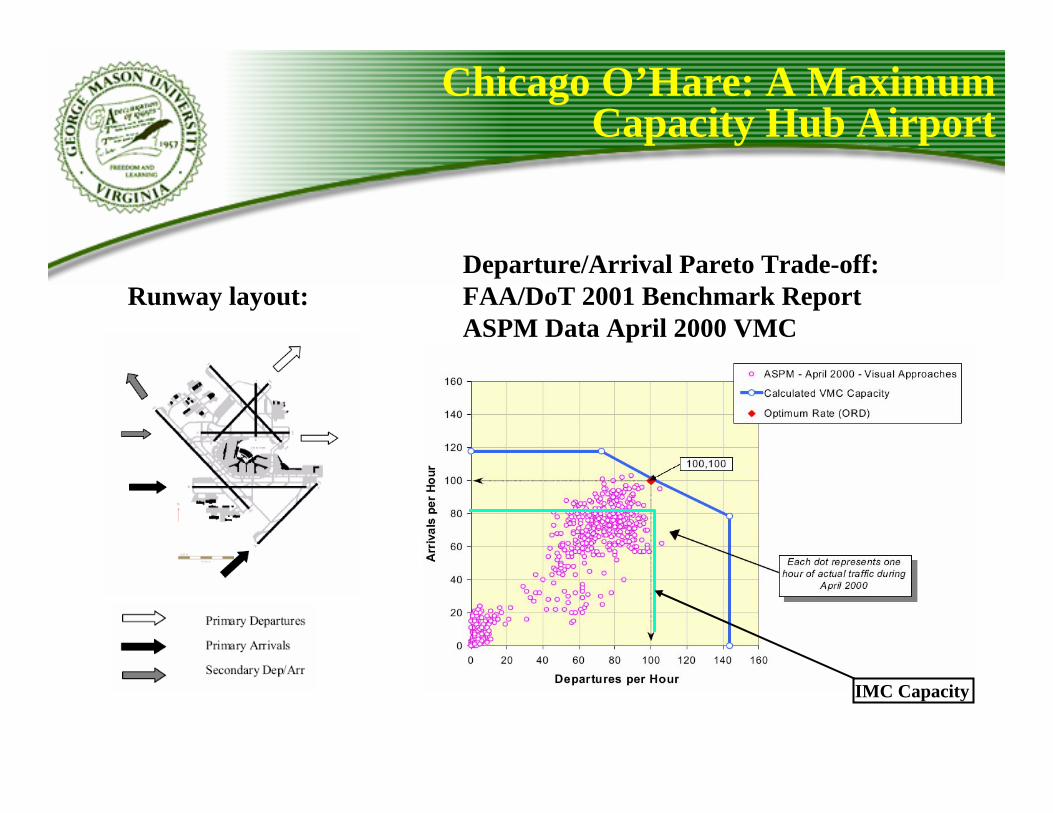
Chicago O’Hare: A Maximum Capacity Hub Airport
Runway layout:Departure/Arrival Pareto Trade-off:FAA/DoT 2001 Benchmark Report ASPM Data April 2000 VMC
IMC Capacity
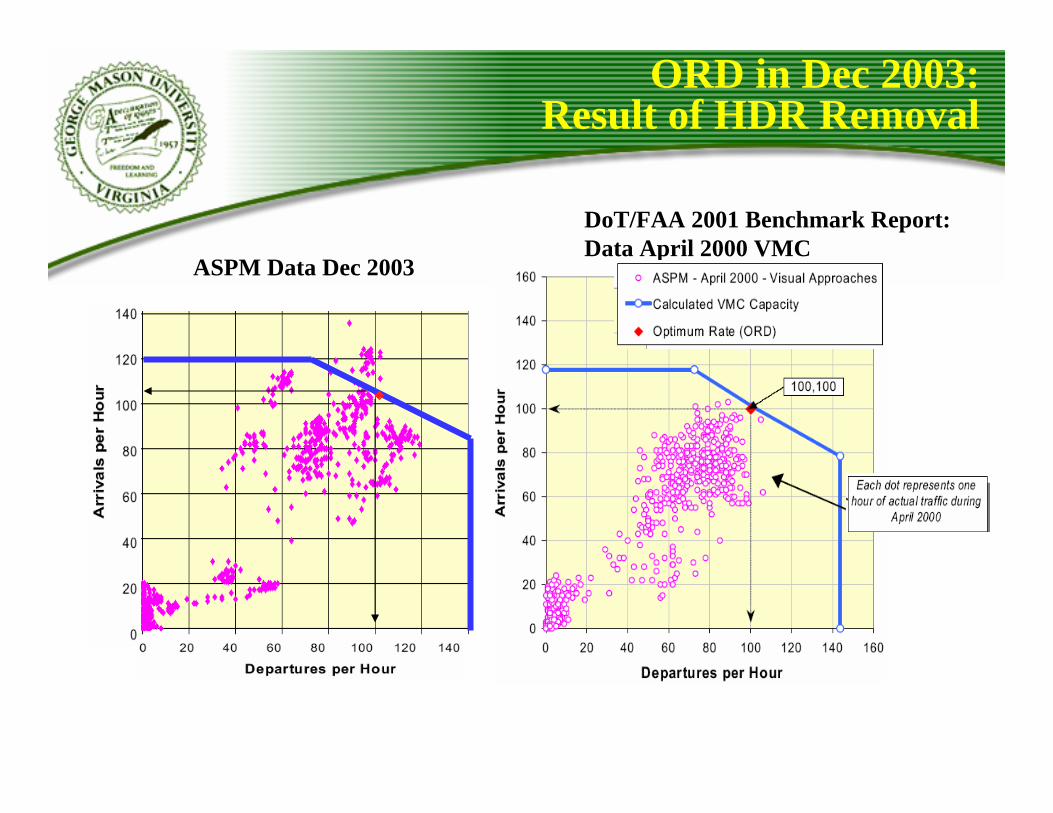
ORD in Dec 2003:Result of HDR Removal
DoT/FAA 2001 Benchmark Report:Data April 2000 VMC
ASPM Data Dec 2003
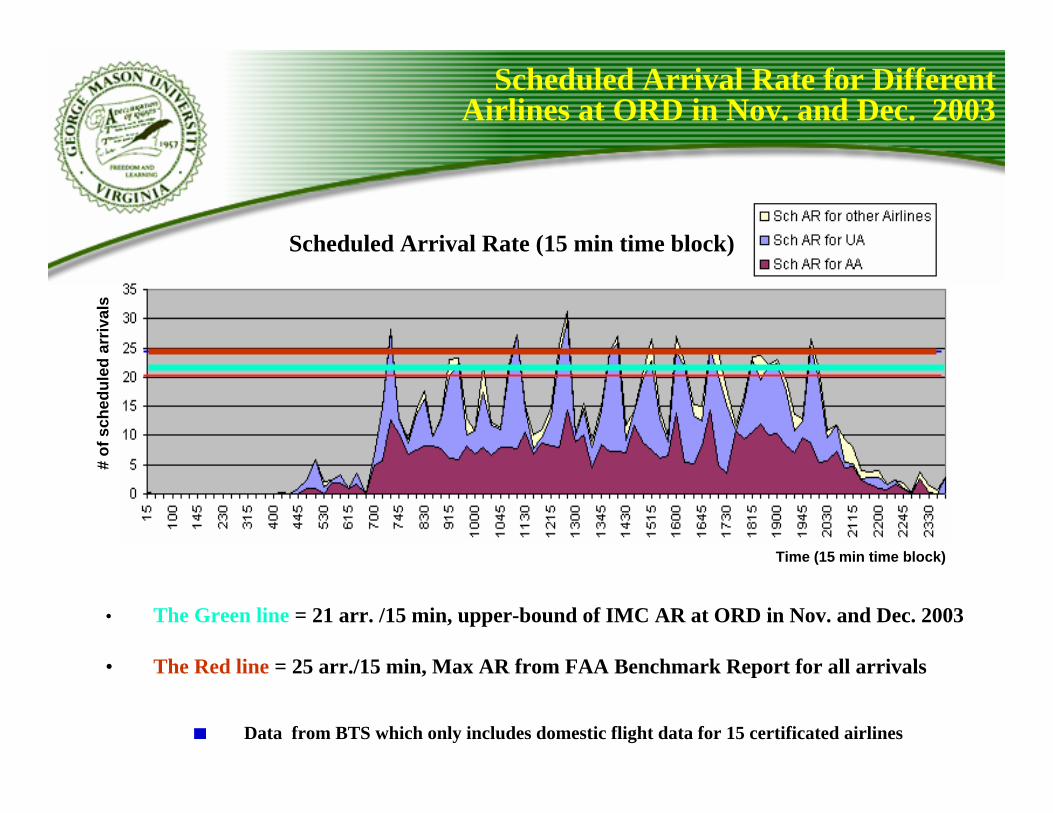
Scheduled Arrival Rate for Different Airlines at ORD in Nov. and Dec. 2003
Scheduled Arrival Rate (15 min time block)
Time (15 min time block)
# of
sch
edul
ed a
rriv
als
• The Green line = 21 arr. /15 min, upper-bound of IMC AR at ORD in Nov. and Dec. 2003
• The Red line = 25 arr./15 min, Max AR from FAA Benchmark Report for all arrivals
Data from BTS which only includes domestic flight data for 15 certificated airlines

Smaller Aircraft trend Exacerbates Congestion
Frequency competition Reduces Seat Capacity and Increases FAA Operational Load
O’Hare Airport Yearly Throughput
911,917
922,817928,691
1998 1999 2000 2001 2002 2003Year
Flight Operations
896,104 896,228
908,989
72,501,988 72,610,12172,145,489
67,448,06466,565,952
69,508,672
Passengers
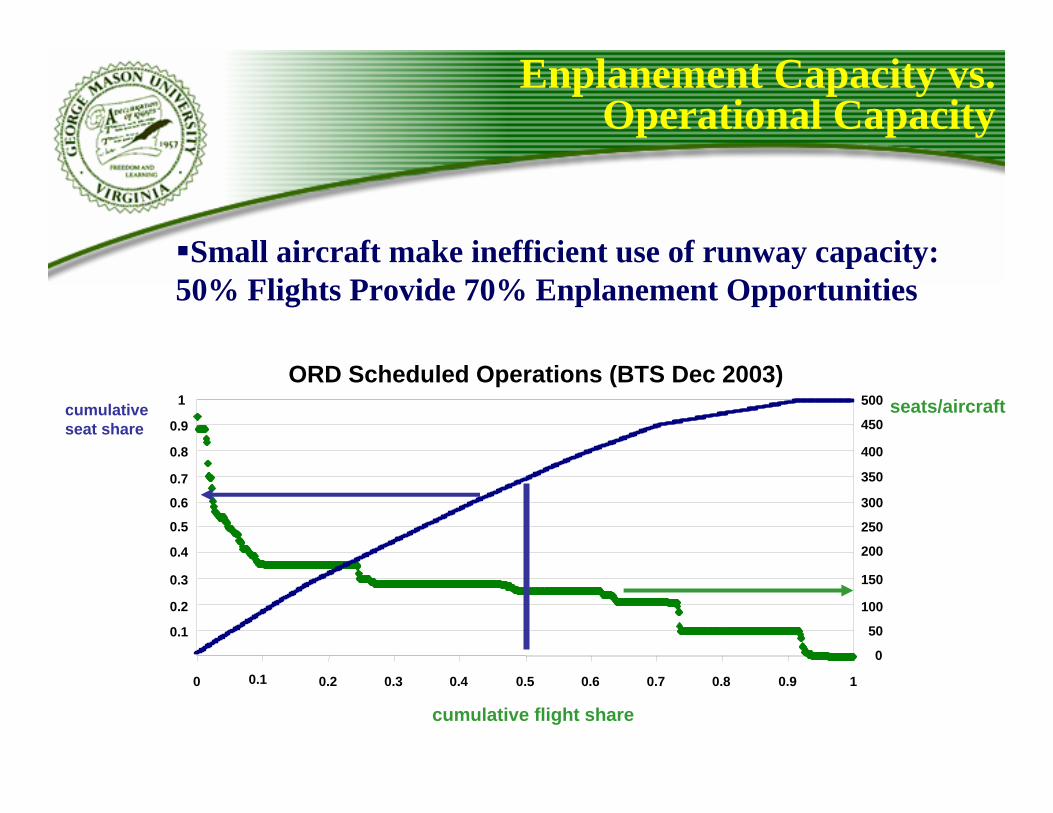
Small aircraft make inefficient use of runway capacity: 50% Flights Provide 70% Enplanement Opportunities
ORD Scheduled Operations (BTS Dec 2003)
0 0.1 0.2 0.3 0.4 0.5 0.6 0.7 0.8 0.9 1
cumulative flight share
seats/aircraft
0.1
0.2
0.3
0.4
0.5
0.6
0.7
0.8
0.9
1cumulative seat share
0
50
100
150
200
250
300
350
400
450
500
Enplanement Capacity vs. Operational Capacity
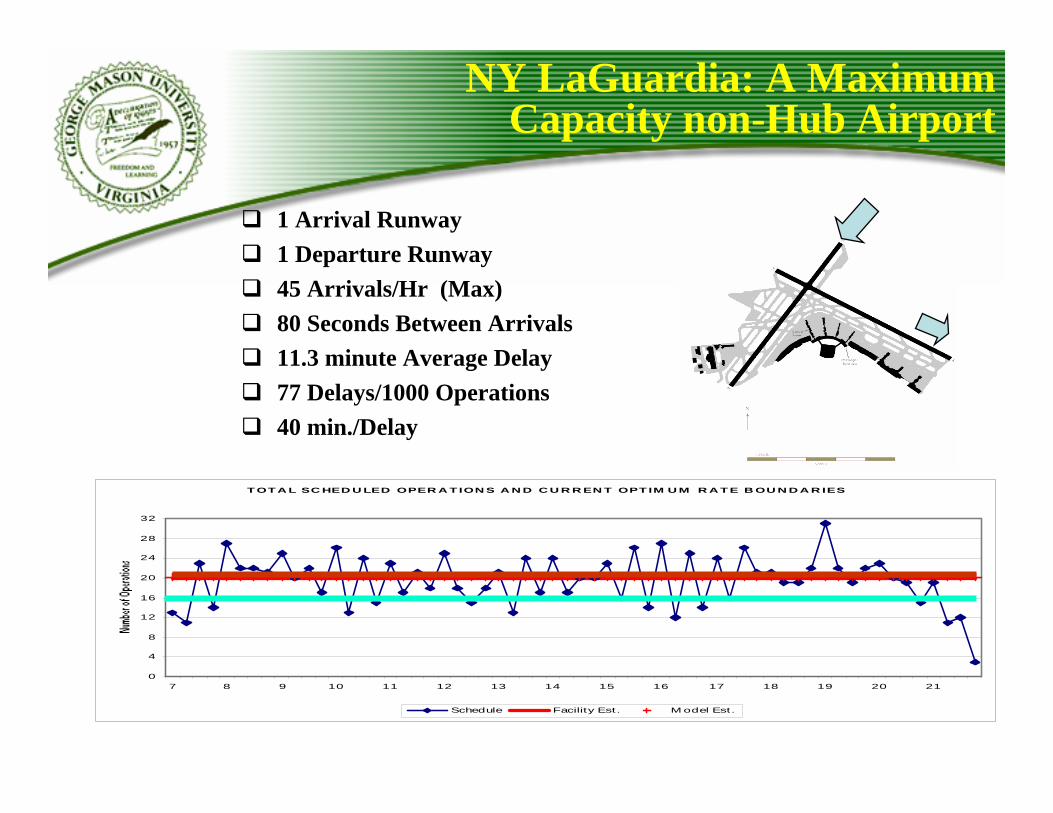
NY LaGuardia: A Maximum Capacity non-Hub Airport
1 Arrival Runway1 Departure Runway45 Arrivals/Hr (Max)80 Seconds Between Arrivals11.3 minute Average Delay77 Delays/1000 Operations40 min./Delay
TOTA L SC HED U LED OPER A TION S A N D C U R R EN T OPT IM U M R A TE B OU N D A R IES
0
4
8
12
16
20
24
28
32
7 8 9 10 11 12 13 14 15 16 17 18 19 20 21
Schedule Facility Est. M odel Est.
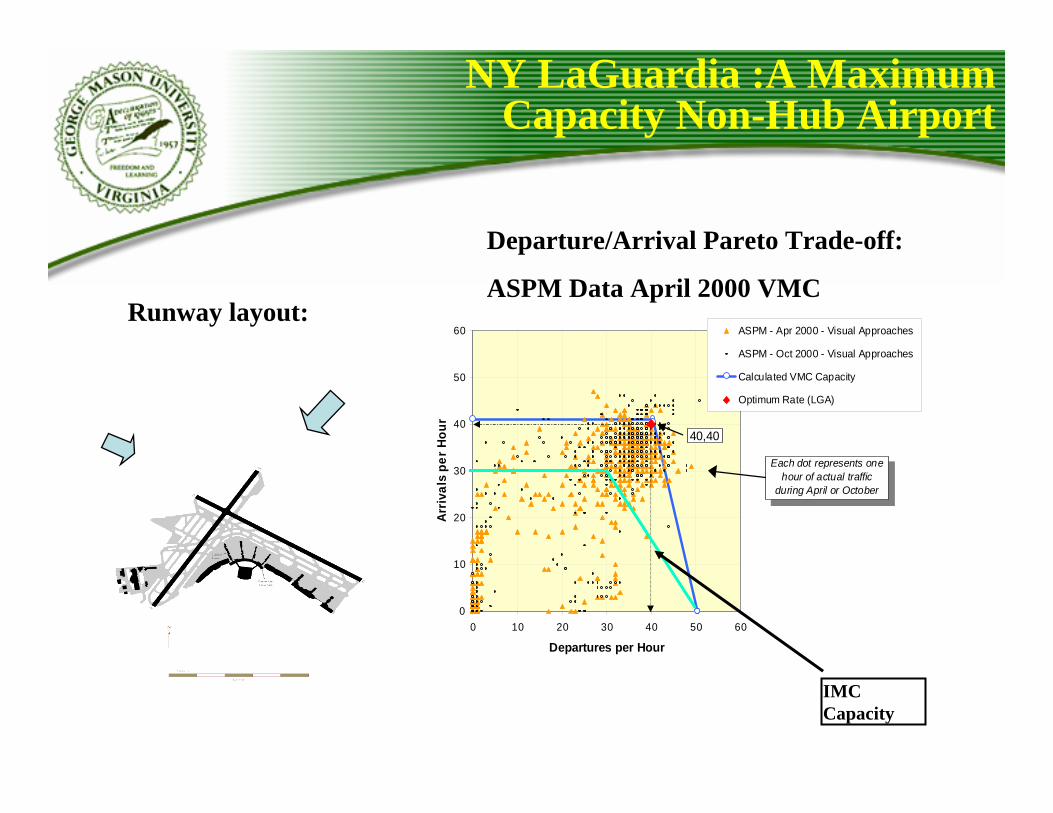
NY LaGuardia :A Maximum Capacity Non-Hub Airport
0
10
20
30
40
50
60
0 10 20 30 40 50 60
Departures per Hour
Arriv
als
per H
our
ASPM - Apr 2000 - Visual Approaches
ASPM - Oct 2000 - Visual Approaches
Calculated VMC Capacity
Optimum Rate (LGA)
40,40
Each dot represents one hour of actual traffic
during April or October 2000
Runway layout:
Departure/Arrival Pareto Trade-off:
ASPM Data April 2000 VMC
IMC Capacity
Factors that Determine Capacity
Local Airport Authority− #Runways, #Taxiways, High-speed turnoffs, #Gates,
RW spacing, RW configuration, Noise Restrictions, etc.FAA− ATM/CNS Equipage, Separation Standards, ATC
Procedures and Airspace Design Weather− Winds, Ceiling, Visibility, Severe weather
Airline Schedules− Network Banking Requirements− Market Competition Strategies
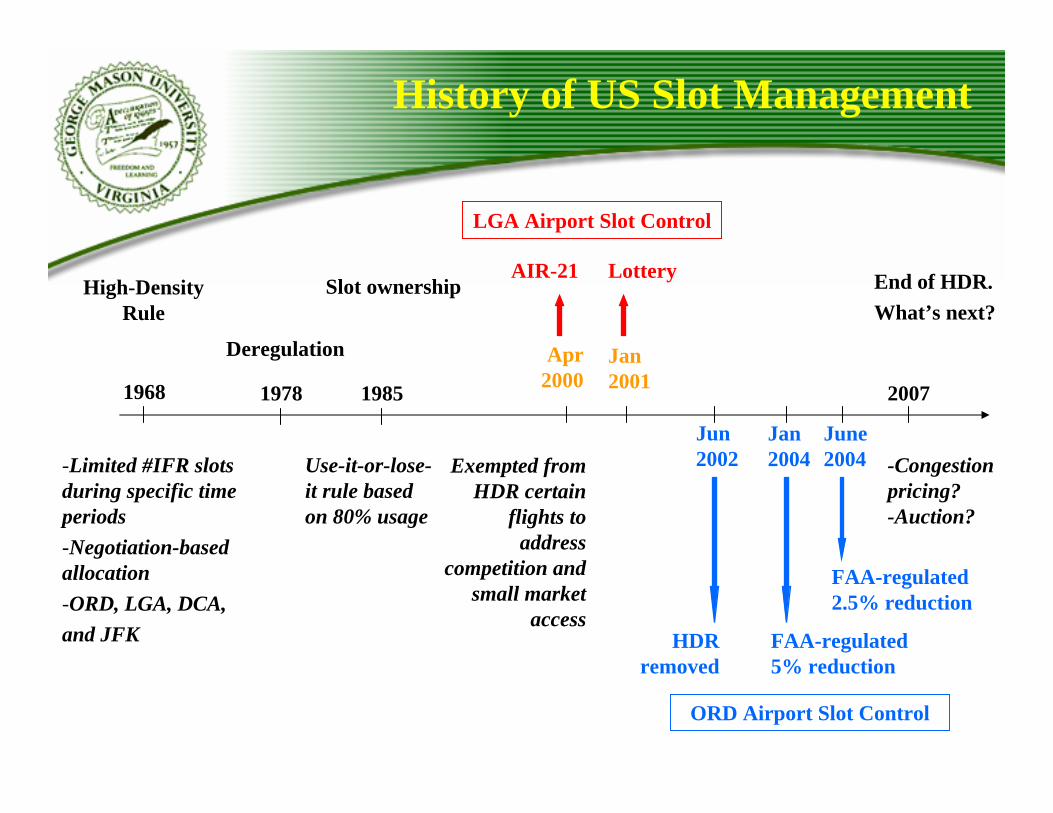
History of US Slot Management
-Limited #IFR slots during specific time periods-Negotiation-based allocation-ORD, LGA, DCA,and JFK
1968
High-Density Rule
Apr2000
Exempted from HDR certain
flights to address
competition and small market
access
AIR-21
Jan2001
Lottery
1978
Deregulation
Use-it-or-lose-it rule based on 80% usage
1985
Slot ownership
2007
End of HDR. What’s next?
-Congestion pricing?-Auction?
LGA Airport Slot Control
Jun2002
ORD Airport Slot Control
HDRremoved
Jan2004
FAA-regulated5% reduction
June2004
FAA-regulated2.5% reduction
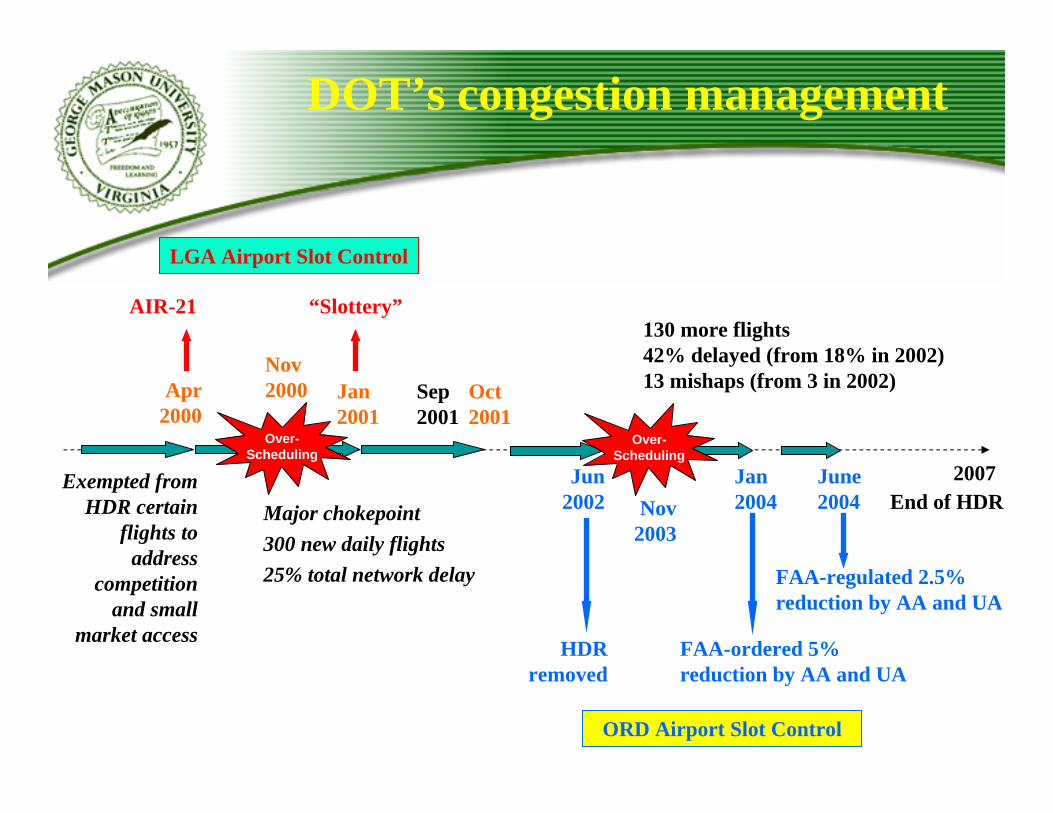
DOT’s congestion management
2007
LGA Airport Slot Control
Jun2002
ORD Airport Slot Control
HDRremoved
Apr2000
Exempted from HDR certain
flights to address
competition and small
market access
AIR-21
Jan2001
“Slottery”
Nov2000
Major chokepoint300 new daily flights25% total network delay
Jan2004
FAA-ordered 5% reduction by AA and UA
Sep 2001
Oct 2001
Nov2003
130 more flights42% delayed (from 18% in 2002)13 mishaps (from 3 in 2002)
June2004
FAA-regulated 2.5% reduction by AA and UA
Over-Scheduling
Over-Scheduling
End of HDR

Congestion Management Approaches
Administrative− negotiation-based IATA biannual conferencesMarket Based− weight-based landing fee: no incentive for large
aircraft – inefficient Enplanement capacity− time-based congestion pricing: not reveal the true
value of scarce resources− DoT/FAA supervised MarketMarket--based Auctions based Auctions of
Arrival Metering-Fix Time SlotsHybrid

Auction Model Design Issues
Feasibility− Package slot allocation for arrival slots− Politically acceptable net prices
Optimality− Efficiency: i.e. Match Customer value to Cost
Maximum Schedule PredictabilityOptimum airline schedule and aircraft assignmentMinimum passenger ticket price
− Regulatory standards: capacity, international flight priorities− Equity:
Stability in scheduleAirlines’ need to leverage Prior InvestmentsAirlines’ competitiveness : new-entrants vs. incumbents
Flexibility− Primary market at strategic level − Secondary market at tactical level
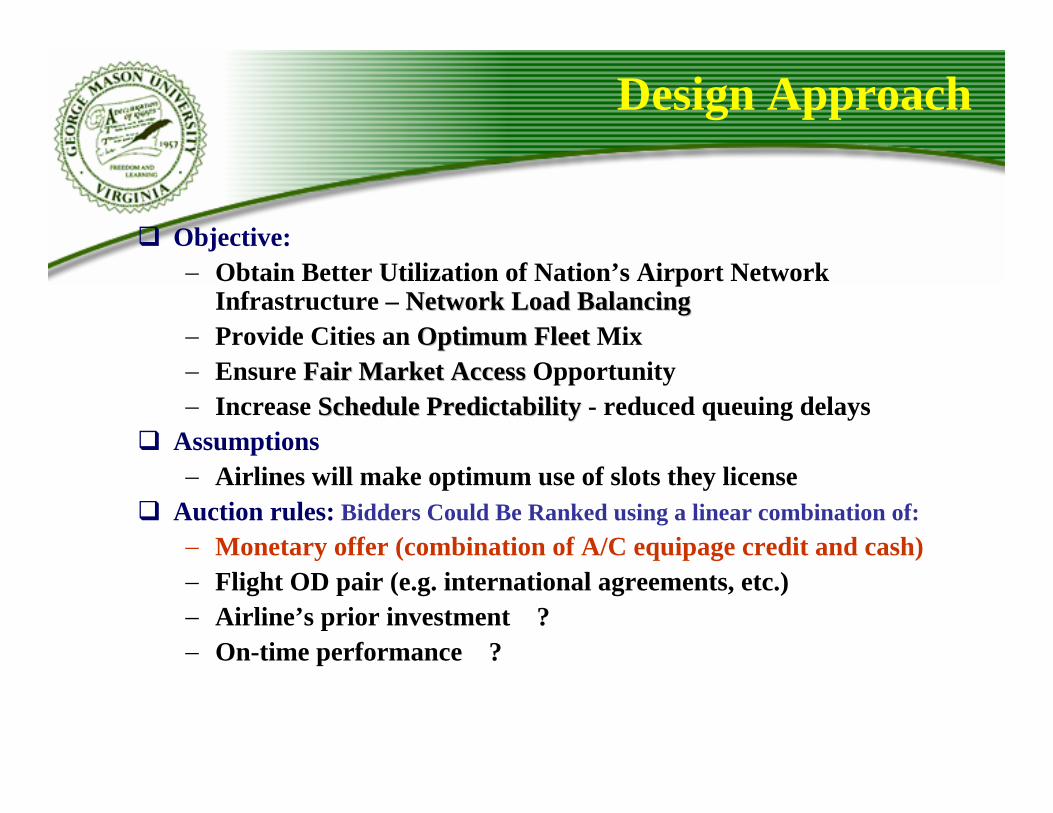
Design Approach
Objective:− Obtain Better Utilization of Nation’s Airport Network
Infrastructure – Network Load BalancingNetwork Load Balancing− Provide Cities an Optimum FleetOptimum Fleet Mix − Ensure Fair Market AccessFair Market Access Opportunity− Increase Schedule PredictabilitySchedule Predictability - reduced queuing delays
Assumptions− Airlines will make optimum use of slots they license
Auction rules: Bidders Could Be Ranked using a linear combination of: − Monetary offer (combination of A/C equipage credit and cash)− Flight OD pair (e.g. international agreements, etc.)− Airline’s prior investment ?− On-time performance ?

Strategic Auction Analytical Approach
NAS
Auction Model
Schedules
Analysis & Feedback
Bids
SlotsAirlines Auctioneers
Network Model
-Auctions only at Capacitated Airports
-Auction Licenses good for 5 to 10 years

Network Model used to Evaluate Auction Effectiveness
LGAORDMSP
DTW
ATLDFW
LAXIAD
BWIDEN
PHX
SFO
13-node network
departure separation
arrival separation
Trailing aircraft Small Large B757 HeavyLeading aircraftSmall 2.5/80 2.5/68 2.5/66 2.5/64Large 4/164 2.5/73 2.5/66 2.5/64B757 5/201 4/115 4/102 4/101Heavy 6/239 5/148 5/136 4/104
Runway capacity determined by♦ Wake Vortex Separation Standards (nmiles/seconds) (M. Hanson)
♦ and a scale factor to account for runway dependency
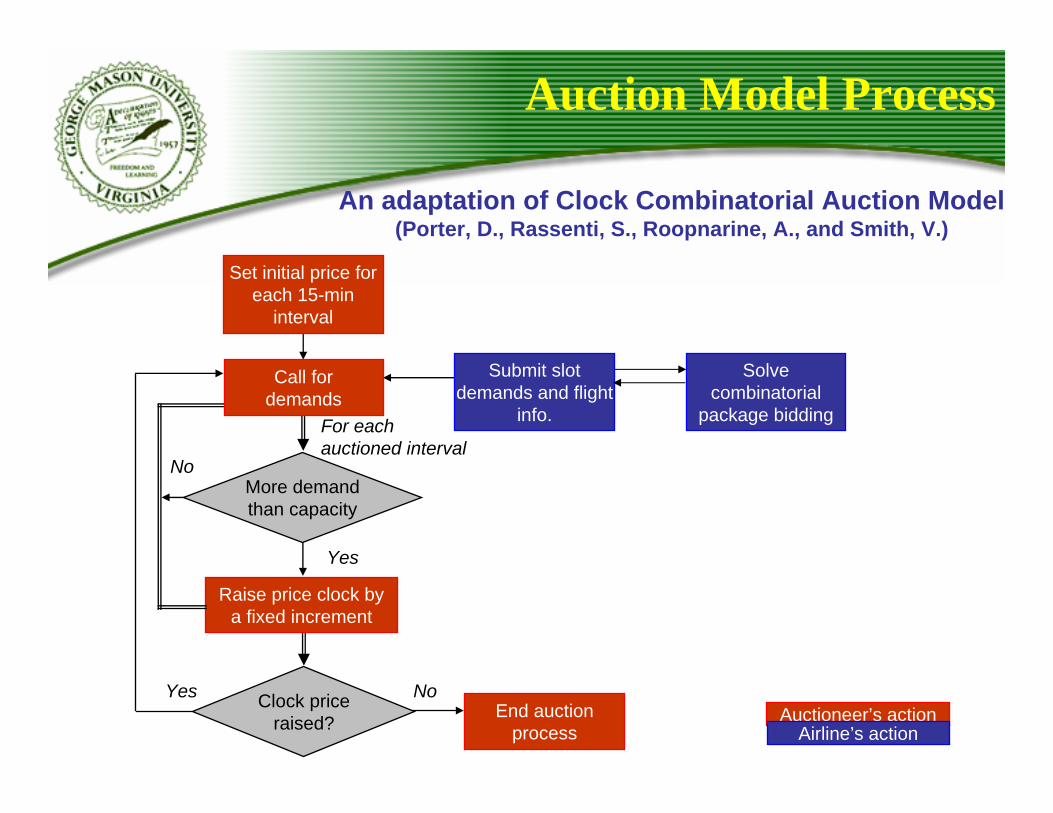
Auction Model Process
More demand than capacity
Raise price clock by a fixed increment
End auction process
Submit slot demands and flight
info.
Yes
No
Auctioneer’s actionAirline’s action
Call for demands
An adaptation of Clock Combinatorial Auction Model (Porter, D., Rassenti, S., Roopnarine, A., and Smith, V.)
Set initial price for each 15-min
interval
Clock price raised?
For each auctioned interval
NoYes
Solve combinatorial
package bidding

ORD Simulated Arrivals in VMC – No Auction
Domestic Arrivals (Dec 2003)
0
10
20
30
40
0 1 2 3 4 5 6 7 8 9 10 11 12 13 14 15 16 17 18 19 20 21 22 23
#Flights Scheduled (BTS) simulated mean
0
5
10
15
20
0 1 2 3 4 5 6 7 8 9 10 11 12 13 14 15 16 17 18 19 20 21 22 23
Time
Min
Mean of Estimated Average Arrival
Delay (good weather)
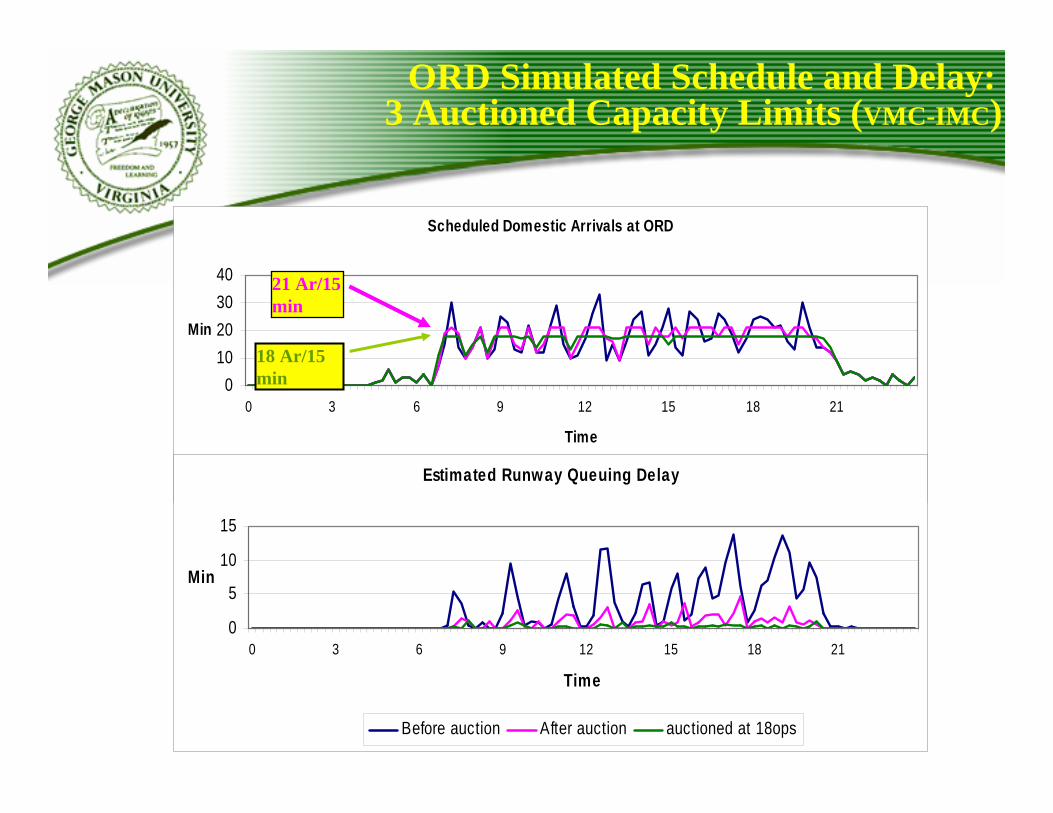
Scheduled Domestic Arrivals at ORD
010203040
0 3 6 9 12 15 18 21
Time
Min
Before auction After auction auctioned at 18ops
ORD Simulated Schedule and Delay: 3 Auctioned Capacity Limits (VMC-IMC)
Estimated Runway Queuing Delay
0
5
10
15
0 3 6 9 12 15 18 21
Time
Min
Before auction After auction auctioned at 18ops
21 Ar/15 min
18 Ar/15 min
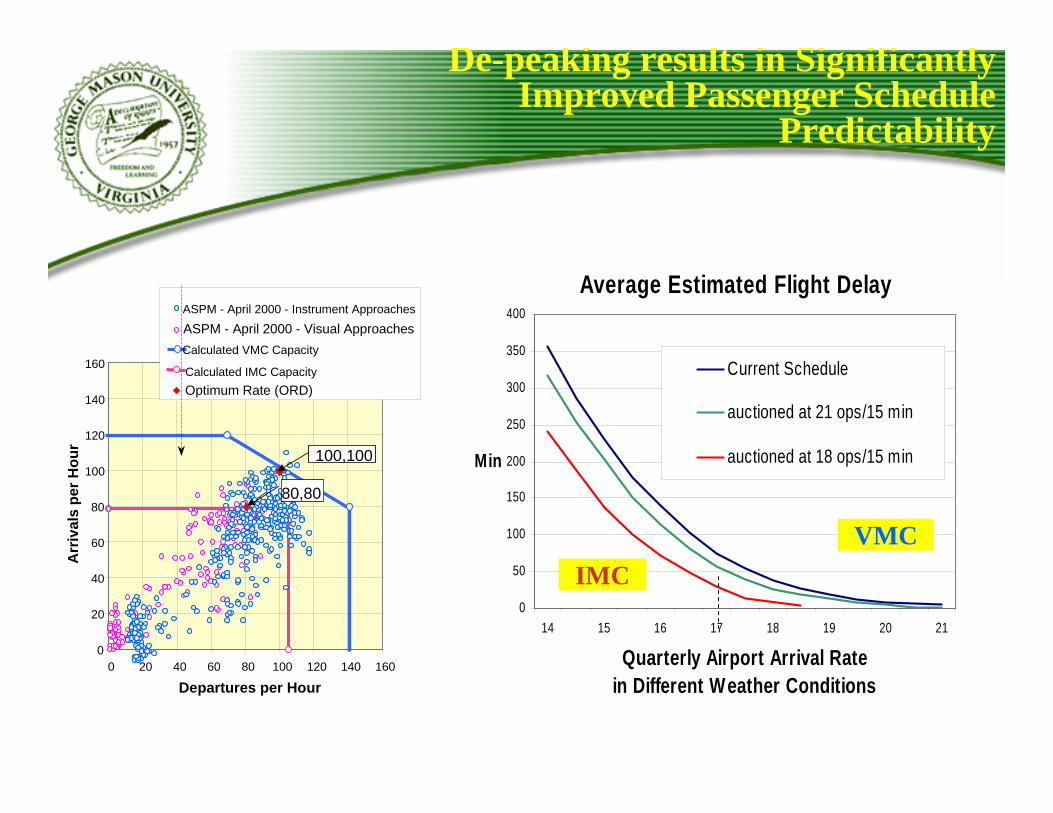
De-peaking results in Significantly Improved Passenger Schedule
Predictability
0
20
40
60
80
100
120
140
160
0 20 40 60 80 100 120 140 160
Departures per Hour
Arr
ival
s pe
r Hou
r
ASPM - April 2000 - Instrument Approaches
Calculated IMC Capacity
ASPM - April 2000 - Visual Approaches
Optimum Rate (ORD)
100,100
80,80
Calculated VMC Capacity
Average Estimated Flight Delay
0
50
100
150
200
250
300
350
400
14 15 16 17 18 19 20 21
Quarterly Airport Arrival Rate in Different Weather Conditions
Min
Current Schedule
auctioned at 21 ops/15 min
auctioned at 18 ops/15 min
IMCVMC

Auction Produced Rolling Banks Changes the Distribution of Delays
3 8 13 180.00
0.05
0.10
0.15
0.20
0.25
Estimated Arrival Queuing Delay
min
Current ScheduleAuction-produce schedule
Probability of Delay Duration
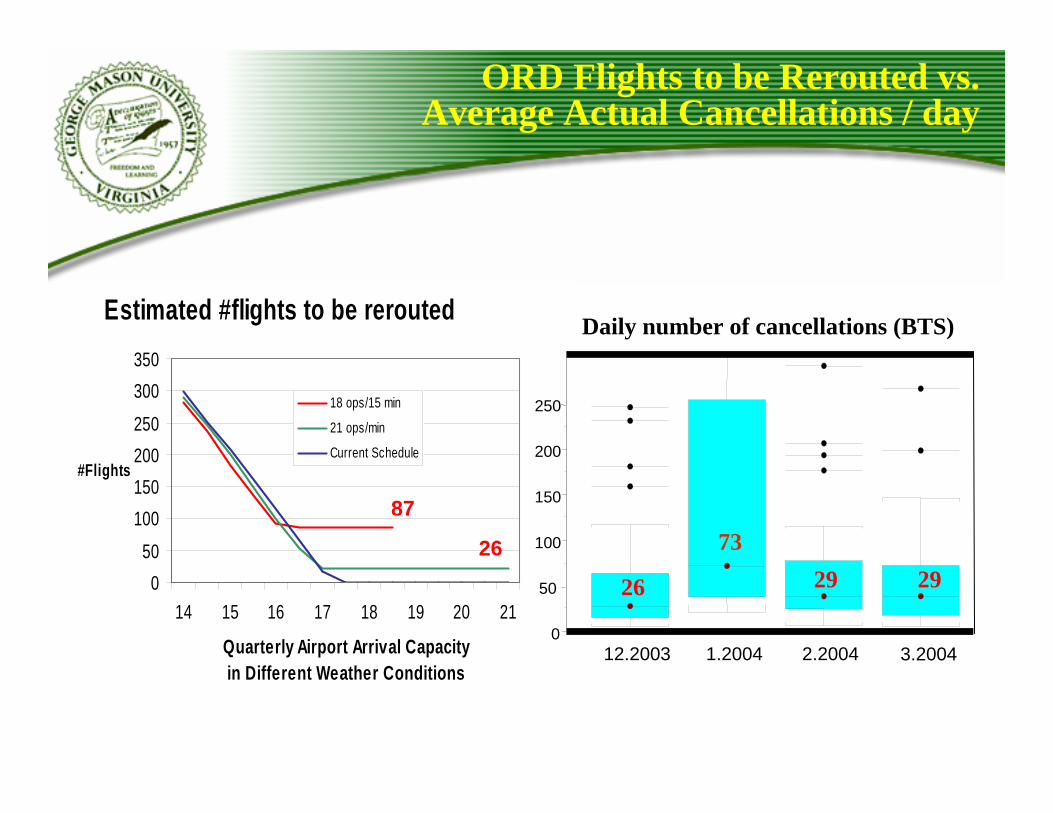
ORD Flights to be Rerouted vs. Average Actual Cancellations / day
Estimated #flights to be rerouted
050
100150200250
300350
14 15 16 17 18 19 20 21
Quarterly Airport Arrival Capacity in Different Weather Conditions
#Flights
18 ops/15 min
21 ops/min
Current Schedule
Daily number of cancellations (BTS)
0
50
100
150
200
250
12.2003 1.2004 2.2004 3.2004
26 29 2926
8773
Significantly Improved ORD Passenger Schedule Predictability
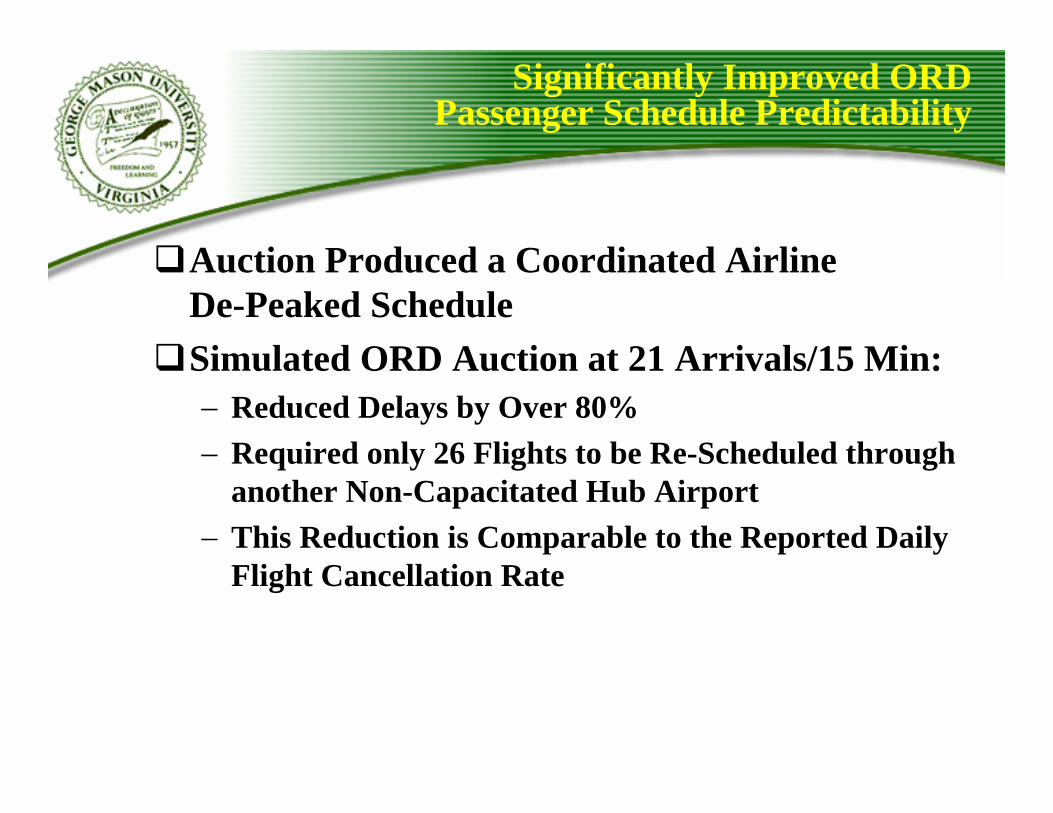
Auction Produced a Coordinated Airline De-Peaked ScheduleSimulated ORD Auction at 21 Arrivals/15 Min:− Reduced Delays by Over 80%− Required only 26 Flights to be Re-Scheduled through
another Non-Capacitated Hub Airport− This Reduction is Comparable to the Reported Daily
Flight Cancellation Rate

Research Issues to be Addressed
Who is Eligible to Bid?− Airlines, Airports, General Aviation, Investors
What is the Fundamental Bidding Metric?− $/15 min Slot @ 95% Confidence, $-Passenger/Aircraft Slot…
How Many Slots Should be Auctioned (arr @Prob. Delay (min))?− VMC ROT @ N(4,22), IMC WV @ N(8,42), IMC WV @ N(15,82) …
What Bid Combinations will be Allowed?− Packages w/ Ranked Priorities, Intercity Packages, etc.− Bidding Activity Rules
What are the Payment Options?− Up Front for X yr. Lic., Monthly Royalty Payments for X Yrs.
Who gets the Money?− Airports (PFC Sub.), Airlines (Equip. Vouchers), FAA (Ticket Tax
Sub.)What are the Secondary Market Rights?What is the Winner Determination Algorithm?Auction Frequency/Duration of Slot License?− License for 5 yr., 10 yr., ?
Observations on Research to Date
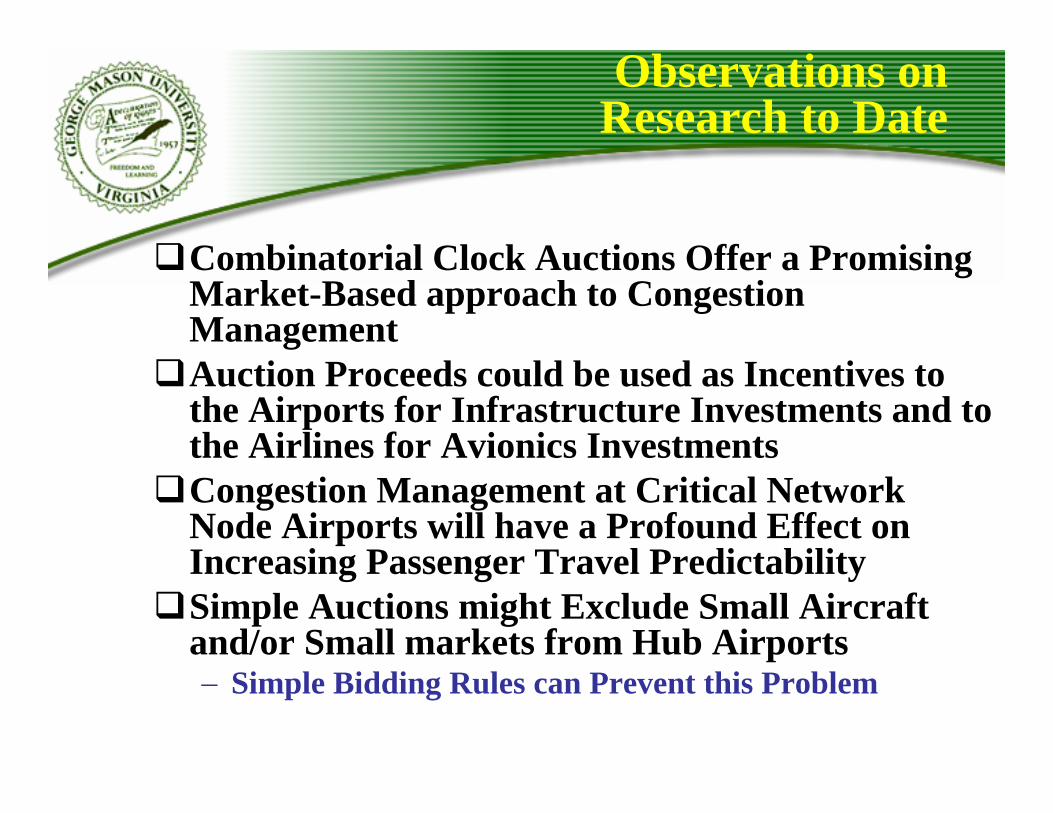
Combinatorial Clock Auctions Offer a Promising Market-Based approach to Congestion ManagementAuction Proceeds could be used as Incentives to the Airports for Infrastructure Investments and to the Airlines for Avionics InvestmentsCongestion Management at Critical Network Node Airports will have a Profound Effect on Increasing Passenger Travel PredictabilitySimple Auctions might Exclude Small Aircraft and/or Small markets from Hub Airports− Simple Bidding Rules can Prevent this Problem
Future work
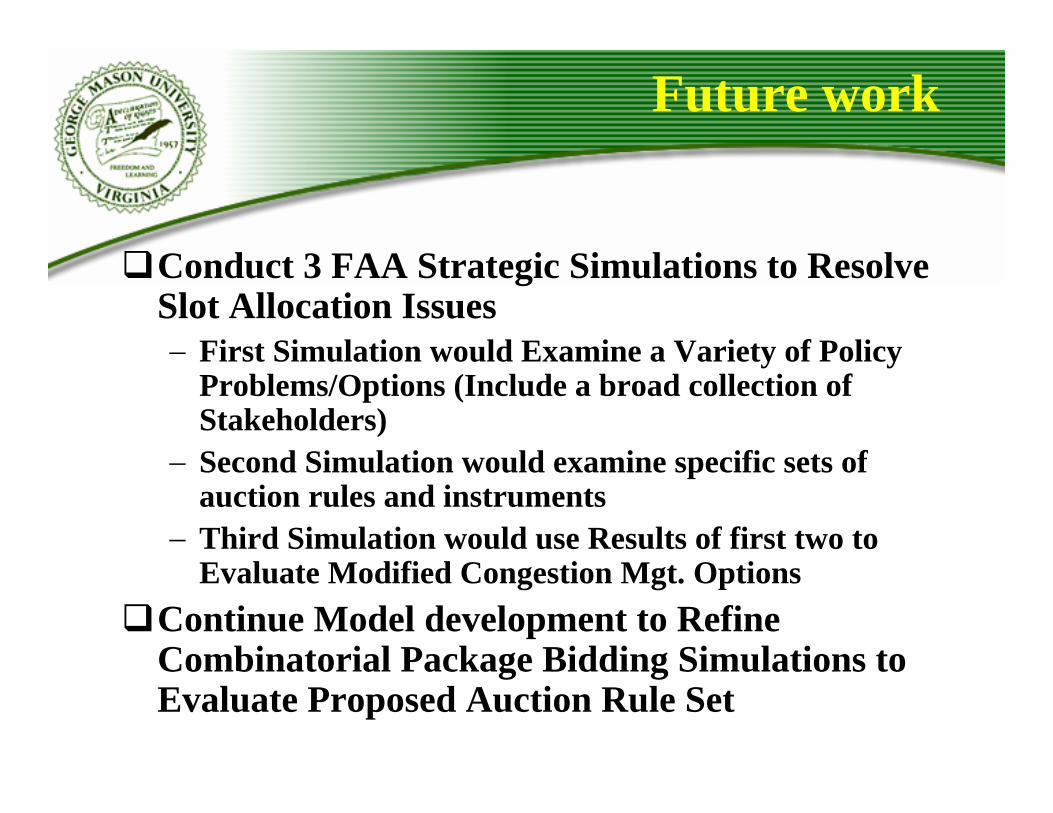
Conduct 3 FAA Strategic Simulations to Resolve Slot Allocation Issues − First Simulation would Examine a Variety of Policy
Problems/Options (Include a broad collection of Stakeholders)
− Second Simulation would examine specific sets of auction rules and instruments
− Third Simulation would use Results of first two to Evaluate Modified Congestion Mgt. Options
Continue Model development to Refine Combinatorial Package Bidding Simulations to Evaluate Proposed Auction Rule Set

Backup

Simulation Model for Testing Auction Design
General Assumptions:− Aircraft can arrive within allocated 15 min. Arrival Time slots with
Required Time-of-Arrival errors of 20 seconds (using Aircraft RTA Capabilities)
− Auction items: Metering Fix Arrival Slots in 76 15-min bins (5:00am till 24:00am) up to 21 arrivals/bin
Input:− Dec 2003 BTS schedule of 2186 flights domestic flights to ORD (80% of
total traffic)ORD Scheduled Arrivals (Source: ASPM, BTS Dec 2003)
0
10
20
30
40
50
0 1 2 3 4 5 6 7 8 9 10 11 12 13 14 15 16 17 18 19 20 21 22 23
Time
#Ops
Total ArrivalsDomestic Arrivals of 15 certificated airlines

Airline model assumptions
Single market, single item bidding
Airlines’ flexibility for changing schedule: one 15-min bin
Homogenous and honest bidding with upper threshold proportional to aircraft size
original scheduled 15-min interval
15min15min
bids withdrawn
bids withdrawn
u(bi) = 1
0bi bi+1
Linear decreasing
bi-1
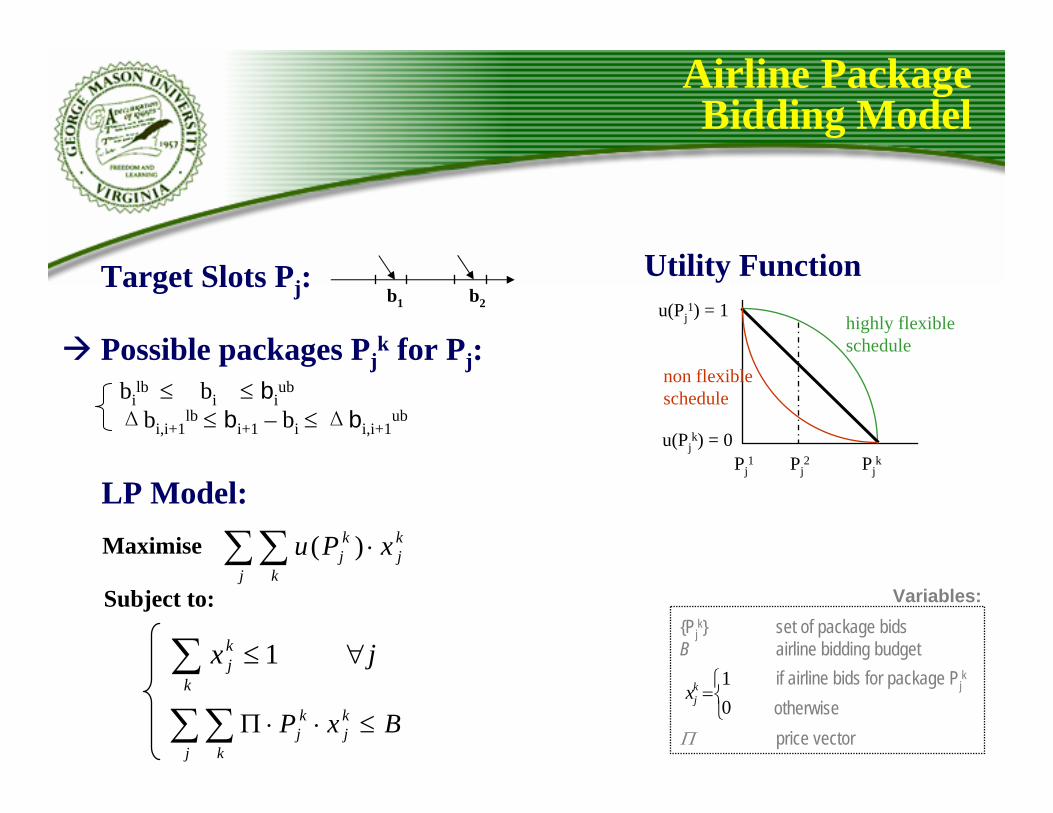
Airline Package Bidding Model
bilb ≤ bi ≤ bi
ub
Δbi,i+1lb ≤ bi+1 – bi ≤ Δbi,i+1
ub
Possible packages Pjk for Pj:
Target Slots Pj: b1 b2 u(Pj1) = 1
PjkPj
1 Pj2
Utility Function
u(Pjk) = 0
LP Model:Maximise
Variables:
∑ ∀≤k
kj jx 1
∑∑ ⋅j k
kj
kj xPu )(
Subject to:
BxPj k
kj
kj ≤⋅⋅Π∑∑
highly flexibleschedule
non flexibleschedule
⎩⎨⎧
=01k
jxif airline bids for package Pj
k
{Pjk} set of package bids
B airline bidding budget
Π price vectorotherwise
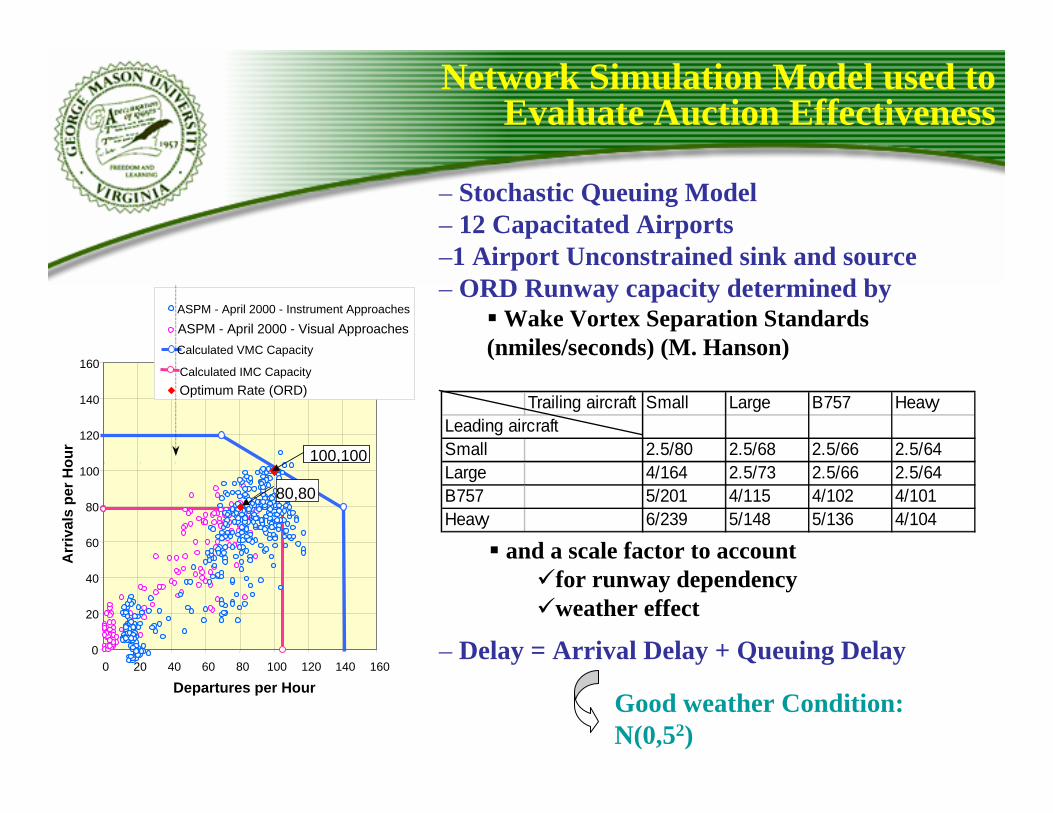
Network Simulation Model used to Evaluate Auction Effectiveness
Trailing aircraft Small Large B757 HeavyLeading aircraftSmall 2.5/80 2.5/68 2.5/66 2.5/64Large 4/164 2.5/73 2.5/66 2.5/64B757 5/201 4/115 4/102 4/101Heavy 6/239 5/148 5/136 4/104
– Stochastic Queuing Model– 12 Capacitated Airports–1 Airport Unconstrained sink and source– ORD Runway capacity determined by
Wake Vortex Separation Standards (nmiles/seconds) (M. Hanson)
and a scale factor to account for runway dependencyweather effect
0
20
40
60
80
100
120
140
160
0 20 40 60 80 100 120 140 160
Departures per Hour
Arr
ival
s pe
r Hou
r
ASPM - April 2000 - Instrument Approaches
Calculated IMC Capacity
ASPM - April 2000 - Visual Approaches
Optimum Rate (ORD)
100,100
80,80
Calculated VMC Capacity
– Delay = Arrival Delay + Queuing Delay
Good weather Condition: N(0,52)
UP-Front Payment vs. Cash-Flow Royalty
Auction Proceeds could be paid out to the FAA on a monthly basis (i.e. License Royalty Fee to Reserve Arrival Time Slot)FAA could retain a % to replace ATC ticket taxAirport could use a % to replace PFC tax and invest in New Runways, Taxiways, etc.
Airline Avionics Investments Required to Increase Airport Capacity
Flight Management Systems with Required Time of Arrival CapabilitiesADS-B Cockpit Display of Traffic Information with the Capability of Providing Pilot Controlled Time-Based Separation

Airlines Could bid with Avionics Investment Promissory Notes
Airlines could Bid with Script that constituted a contract to equip their Aircraft with-in X years (i.e. ½ bid price)Accepted Airline Bid constitutes a Contract with the FAA to provide Operational Procedures that Utilize Decreased Separation Capabilities

LGA Arrival - Departure IMC
0
10
20
30
40
50
60
0 10 20 30 40 50 60
Departures per Hour
Arriv
als
per H
our
ASPM - April 2000 - Instrument ApproachesASPM - October 2000 - Instrument ApproachesCalculated IMC CapacityReduced Rate (LGA)
32,32
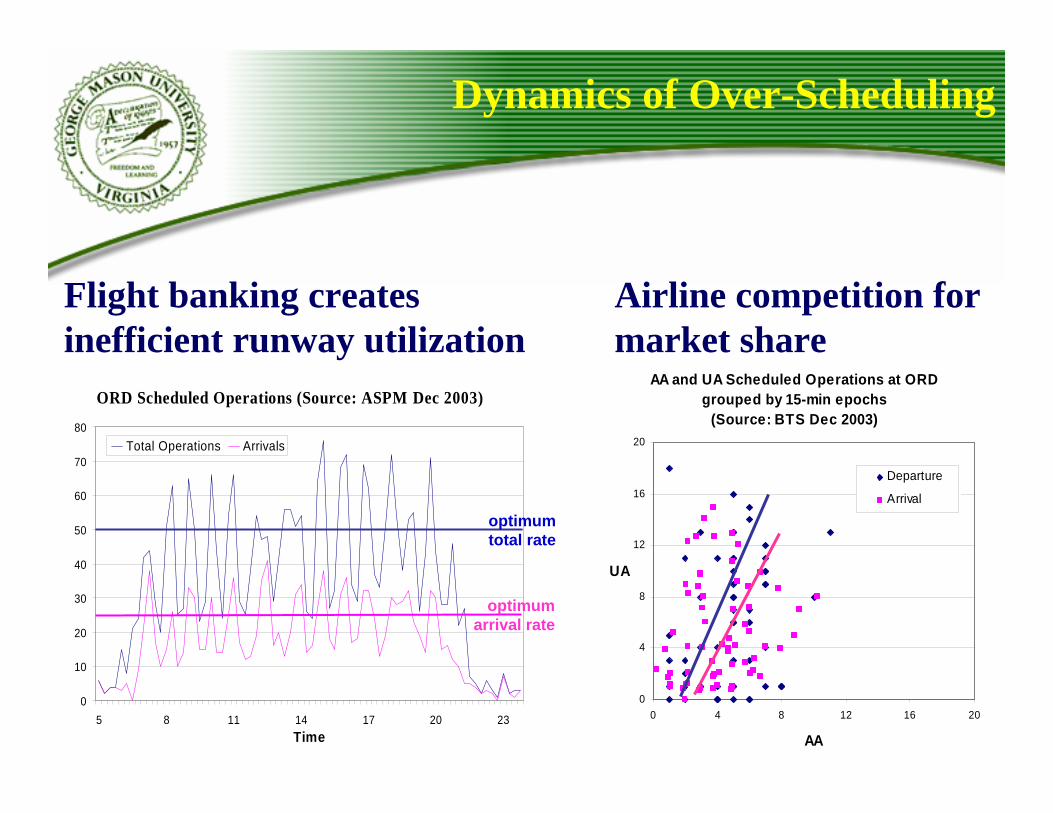
Dynamics of Over-Scheduling
ORD Scheduled Operations (Source: ASPM Dec 2003)
0
10
20
30
40
50
60
70
80
5 8 11 14 17 20 23Time
Total Operations Arrivals
optimum total rate
optimum arrival rate
Flight banking creates inefficient runway utilization
AA and UA Scheduled Operations at ORD grouped by 15-min epochs
(Source: BTS Dec 2003)
0
4
8
12
16
20
0 4 8 12 16 20
AA
UA
Departure
Arrival
Airline competition for market share